Published on May 16, 2008
Venture
Capital for Tiny Technology
FIRST
QUARTER REPORT 2008
FELLOW
SHAREHOLDERS:
Although
all of our 31 active portfolio companies are enabled by tiny technology, and
most of them can be said to be enabled by nanotechnology per
se,
there
are various ways of categorizing the markets that our portfolio companies
address. All of our portfolio companies have products under development or
in
production that are based on proprietary technology. But for analytical
purposes, they can also be grouped. One such grouping that we find useful is
the
portfolio snapshot below, reported as a percentage of value of the total active
portfolio companies.
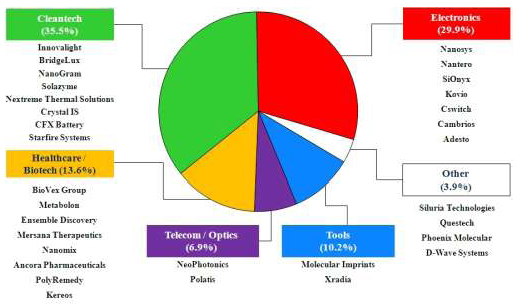
As
of
March 31, 2008, Tiny Tech for Cleantech has grown to 35.5 percent of our
portfolio. The widening gap between capabilities of existing energy solutions
and global demand has created a rare vacuum that venture-capital-funded,
entrepreneurial companies are rushing to fill. Although energy inventions come
in different shapes and forms, materials for energy are in the forefront of
changes in energy generation, storage, and utilization, and nanotechnology
is in
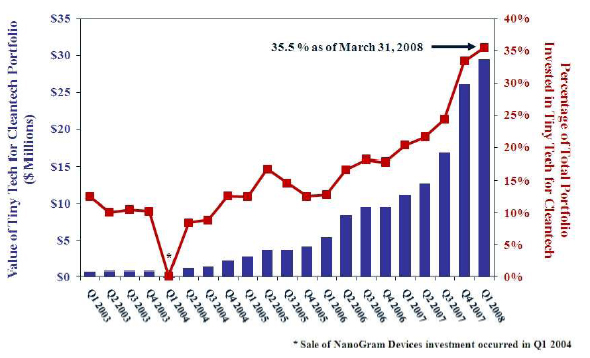
the forefront of materials innovation. Below is a graph showing the growth
in
the value of the "Tiny Tech for Cleantech" portion of our portfolio, updated
to
March 31, 2008, from a similar graph with earlier data in our Letter to
Shareholders in our 2007 annual report.
At
our
recent annual meeting of shareholders, we gave brief presentations on each
of
the eight companies in the Tiny Tech for Cleantech portion of our portfolio.
As
most of you were not able to attend the shareholders' meeting, you may find
the
brief sketches of these companies in the paragraphs that follow, similar to
the
presentations that we gave at the shareholders' meeting, to be of interest.
For
more information, the websites of these companies provide varying amounts of
information, depending on how much each of these private companies has chosen
to
reveal of itself at its stage of commercialization. Both Innovalight, Inc.,
and
Nanogram Corporation are developing solar-cell technologies; Solazyme, Inc.,
is
developing algal biodiesel; Nextreme Thermal Solutions, Inc., is developing
micro-scale thermal and power-management products; Starfire Systems, Inc.,
is
using its ceramic-forming polymers to produce lightweight, fuel-saving, brakes
and brake rotors for the automotive industry; CFX Battery, Inc., is developing
energy-storage solutions; and both Crystal IS, Inc., and BridgeLux, Inc., are
developing technologies and applications for light-emitting diodes
(LEDs).
Innovalight
(www.innovalight.com) is developing renewable energy products, including
ultra-low-cost, thin-film, solar panels. The company is using a proprietary,
silicon nanocrystalline ink process to print thin-film solar panels, which
may
enable more affordable solar-energy solutions for residential and commercial
applications. Because the cost of solar energy has been a major factor limiting
its adoption, Innovalight's technology, if successful, could revolutionize
the
solar market. Instead of using traditional manufacturing methods, Innovalight's
process is solvent based, lending itself to low-cost production and
high-throughput manufacturing. The company was recognized as a 2006 Technology
Pioneer winner at the World Economic Forum, and has been profiled in Time
Magazine, The Economist, Red Herring, and other major publications as a
technology leader.
NanoGram
(www.nanogram.com) utilizes its proprietary laser pyrolysis and
laser-reaction-deposition (LRD) technologies to synthesize and deposit
inorganic nanocrystals on a variety of substrates. Currently, a focus of
Nanogram is the development of silicon-based solar cells. In addition to
photovoltaics, Nanogram is exploring applications of LRD technology in
solid-state lighting, advanced batteries, and other energy applications.
Solazyme
(www.solazyme.com) is developing algal biodiesel, industrial chemicals and
special ingredients based on synthetic biology. Solazyme engineers marine
algae to create clean and scalable solutions for renewable energy. Algae
reproduces faster than plants and animals from which oils are derived, has
a
high starting oil content, and contains no sulfur. Solazyme engineers the algae
to increase its oil production and to be grown on waste-sugar sources.
This use of waste-sugar sources permits Solazyme to produce algal-based oil
at
lower cost and without replacing land historically used for feedstock crops.
The
oil is catalytically reacted with methanol in a process called
transesterification to produce biodiesel.
Nextreme
(www.nextremethermal.com) develops micro-scale thermal and power-management
products for the semiconductor, photonics, consumer, automotive, and
defense/aerospace industries. One application of Nextreme’s thermoelectric
products is the generation of electricity via the Seebeck Effect, which produces
electricity from a temperature differential applied across a device. Nextreme's
miniature, thin-film, thermoelectric generators (eTEGs) enable recycling of
heat
to electricity. eTEGs are ideal for waste-heat conversion applications, in
which the solid-state eTEG delivers power-generation densities in excess of
those achieved using bulk materials. The solid-state eTEG can be optimized
to
provide power in a form factor as much as 20x thinner than bulk-material
alternatives.
Starfire
Systems (www.starfiresystems.com) is utilizing its proprietary, nanostructured,
ceramic-forming polymers to manufacture silicon-carbide (SiC) ceramic brakes
and
brake rotors for the automotive industry. These brakes could replace standard
cast-iron or drum brakes. Starfire's brakes would reduce the weight of a
standard SUV's brakes from approximately 28 pounds to approximately eight
pounds. The lightweight SiC ceramic reduces the amount of energy needed to
accelerate a vehicle, permitting faster acceleration while reducing fuel
consumption. This fuel economy is most notable in city driving, where vehicles
utilizing Starfire's SiC brakes have shown four percent improvement in fuel
economy. Additionally, Starfire’s SiC ceramic brakes dampen rather than amplify
noise, perform better for longer periods of time than standard brakes, and
make
it easier to turn a vehicle's wheels, providing improved handling at high
speeds.
CFX
Battery (www.cfxbattery.com) is a 2007 spin-out of Caltech. CFX Battery’s
objective is to provide unique, cost-effective, state-of-the-art energy storage
solutions for a wide variety of applications. Over
the
next several years, CFX Battery envisions the development and rollout of a
family of primary (non-rechargeable) and secondary (rechargeable) batteries
that
use proprietary, advanced technology to deliver superior performance, safety,
and weight- and cost-reduction.
Crystal
IS (www.crystal-is.com) is addressing the need for efficient, chemical-free
water purification by enabling solid-state, ultraviolet (UV), light-emitting
diodes (LEDs). The company has a proprietary method for producing
single-crystal, aluminum-nitride (AlN) wafers that are the basis for making
UV
LEDs and other devices. UV devices rely on nitride-semiconducting layers, such
as GaN and AlxGa1-xN alloys. Because there has not been an ideal substrate
for
UV devices, manufacturers have had to rely on less than ideal sapphire
substrates. Sapphire suffers from numerous crystal-scale defects,
thermal-expansion problems, and poor thermal conductivity. AlN is not only
superior in all of these areas, but also has 10 times greater thermal
conductivity than sapphire, leading to higher efficiency and more reliable
devices. Products that would benefit from AlN wafers include: UV LEDs; UV lasers
for next-generation optical data storage; high-temperature electronics;
high-power RF and microwave devices; and other nitride-based
semiconductors.
BridgeLux
(www.bridgelux.com) manufactures light-emitting diodes (LEDs) that enable
energy-saving, solid-state lighting. LED-based lighting is more energy efficient
than incandescent lighting and even rivals the energy efficiency of fluorescent
lighting. Moreover, as compared with fluorescent lights, LEDs are more reliable,
provide better color quality, and do not contain harmful chemicals. Presently,
LEDs are found in mobile devices, backlights for computer displays, and signage.
As LED efficiencies have increased, they have begun to be utilized in general
lighting applications as well. BridgeLux is advancing the efficiency of
solid-state lighting through its proprietary epitaxy process and novel chip
design. In addition to LED chips, BridgeLux is developing a variety of white
and
blue LED arrays. BridgeLux's LED solutions are expected to help advance the
performance of solid-state lighting, open new markets, and hasten the adoption
of LEDs as an energy-saving technology.
The
growth in the Tiny Tech for Cleantech portion of our portfolio is the result
of
additional investment by us as well as increases in valuations reflecting
investments in these eight companies by sophisticated, third-party investors.
We
now value our Tiny Tech for Cleantech holdings at $29,482,246, versus our cost
of $19,169,612. We would not be surprised if continued growth of cleantech
and
its increasing reliance on nano-structured advanced materials result in Tiny
Tech for Cleantech continuing to grow as a percentage of our
portfolio.
 |
 |
 |
|
Charles
E. Harris
|
Douglas
W. Jamison
|
Daniel
B. Wolfe
|
|
Chairman
and Chief Executive Officer
|
President
and Chief Operating Officer
|
Chief
Financial Officer
|
|
Managing
Director
|
Managing
Director
|
Managing
Director
|
 |
 |
|
|
Michael
A. Janse
|
Alexei
A. Andreev
|
|
|
Executive
Vice President
|
Executive
Vice President
|
|
|
Managing
Director
|
Managing
Director
|
|
May
16,
2008
This
letter may contain statements of a forward-looking nature relating to future
events. These forward-looking statements are subject to the inherent
uncertainties in predicting future results and conditions. These statements
reflect the Company's current beliefs, and a number of important factors could
cause actual results to differ materially from those expressed in this letter.
Please see the Company's Annual Report on Form 10-K for the fiscal year ended
December 31, 2007, the Company's Registration Statement on Form N-2, the
Company's report on Form 10-Q for the quarter ended March 31, 2008 and
subsequent filings, filed with the Securities and Exchange Commission, for
a
more detailed discussion of the risks and uncertainties associated with the
Company's business, including but not limited to the risks and uncertainties
associated with venture capital investing and other significant factors that
could affect the Company's actual results. Except as otherwise required by
Federal securities laws, Harris & Harris Group, Inc.®,
undertakes no obligation to update or revise these forward-looking statements
to
reflect new events or uncertainties. The reference to the website
www.TinyTechVC.com and to the websites of all portfolio companies have been
provided as a convenience, and the information contained on such websites is
not
incorporated by reference into this letter. Harris & Harris Group,
Inc.®,
is not
responsible for the contents of third party websites.
|
HARRIS
& HARRIS GROUP, INC.
CONSOLIDATED
STATEMENTS OF ASSETS AND
LIABILITIES*
|
ASSETS
|
March
31, 2008
|
December
31, 2007
|
||||||
|
(Unaudited)
|
|||||||
|
Investments,
in portfolio securities at value
|
|||||||
|
(cost:
$84,013,804 and $82,677,528, respectively)
|
$
|
83,097,863
|
$
|
78,110,384
|
|||
|
Investments,
in U.S. Treasury obligations at value
|
|||||||
|
(cost:
$52,346,992 and $59,552,933, respectively)
|
53,589,100
|
60,193,593
|
|||||
|
Cash
and cash equivalents
|
210,154
|
330,009
|
|||||
|
Restricted
funds
|
2,520,310
|
2,667,020
|
|||||
|
Receivable
from portfolio company
|
0
|
524
|
|||||
|
Interest
receivable
|
497,488
|
647,337
|
|||||
|
Prepaid
expenses
|
412,589
|
488,667
|
|||||
|
Other
assets
|
445,135
|
455,798
|
|||||
|
Total
assets
|
$
|
140,772,639
|
$
|
142,893,332
|
|||
|
LIABILITIES
& NET ASSETS
|
|||||||
|
Accounts
payable and accrued liabilities
|
$
|
4,218,484
|
$
|
4,515,463
|
|||
|
Deferred
rent
|
12,866
|
14,525
|
|||||
|
Total
liabilities
|
4,231,350
|
4,529,988
|
|||||
|
Net
assets
|
$
|
136,541,289
|
$
|
138,363,344
|
|||
|
Net
assets are comprised of:
|
|||||||
|
Preferred
stock, $0.10 par value, 2,000,000 shares authorized; none
issued
|
$
|
0
|
$
|
0
|
|||
|
Common
stock, $0.01 par value, 45,000,000 shares authorized at
|
|||||||
|
3/31/08
and 12/31/07; 25,143,313 issued at 3/31/08 and 12/31/07
|
251,434
|
251,434
|
|||||
|
Additional
paid in capital
|
162,394,671
|
160,927,691
|
|||||
|
Accumulated
net realized loss
|
(23,025,452
|
)
|
(15,483,766
|
)
|
|||
|
Accumulated
unrealized appreciation (depreciation) of investments
|
326,167
|
(3,926,484
|
)
|
||||
|
Treasury
stock, at cost (1,828,740 shares at 3/31/08 and 12/31/07)
|
(3,405,531
|
)
|
(3,405,531
|
)
|
|||
|
Net
assets
|
$
|
136,541,289
|
$
|
138,363,344
|
|||
|
Shares
outstanding
|
23,314,573
|
23,314,573
|
|||||
|
Net
asset value per outstanding share
|
$
|
5.86
|
$
|
5.93
|
|||
|
HARRIS
& HARRIS GROUP, INC.
CONSOLIDATED
STATEMENTS OF OPERATIONS*
(Unaudited)
|
|
Three
Months Ended
|
Three
Months Ended
|
||||||
|
March
31, 2008
|
March
31, 2007
|
||||||
|
Investment
income:
|
|||||||
|
Interest
from:
|
|||||||
|
Fixed
income securities
|
$
|
576,302
|
$
|
652,498
|
|||
|
Total
investment income
|
576,302
|
652,498
|
|||||
|
Expenses:
|
|||||||
|
Salaries,
benefits and stock-based compensation
|
2,433,295
|
2,534,766
|
|||||
|
Administration
and operations
|
301,855
|
380,865
|
|||||
|
Professional
fees
|
138,232
|
182,195
|
|||||
|
Rent
|
57,854
|
59,507
|
|||||
|
Directors'
fees and expenses
|
105,146
|
141,196
|
|||||
|
Depreciation
|
13,985
|
15,313
|
|||||
|
Custodian
fees
|
6,553
|
5,774
|
|||||
|
Total
expenses
|
3,056,920
|
3,319,616
|
|||||
|
Net
operating loss
|
(2,480,618
|
)
|
(2,667,118
|
)
|
|||
|
Net
realized loss from investments:
|
|||||||
|
Realized
(loss) from investments
|
(5,014,870
|
)
|
(674
|
)
|
|||
|
Income
tax expense
|
46,198
|
84,905
|
|||||
|
Net
realized (loss) from investments
|
(5,061,068
|
)
|
(85,579
|
)
|
|||
|
Net
decrease (increase) in unrealized
|
|||||||
|
depreciation
on investments:
|
|||||||
|
Change
as a result of investment sales
|
5,014,653
|
0
|
|||||
|
Change
on investments held
|
(762,002
|
)
|
(3,637,463
|
)
|
|||
|
Change
in unrealized depreciation on investments
|
4,252,651
|
(3,637,463
|
)
|
||||
|
Net
decrease (increase) in unrealized depreciation on
investments
|
4,252,651
|
(3,637,463
|
)
|
||||
|
Net
decrease in net assets resulting from operations:
|
|||||||
|
Total
|
$
|
(3,289,035
|
)
|
$
|
(6,390,160
|
)
|
|
|
Per
average basic and diluted outstanding share
|
$
|
(0.14
|
)
|
$
|
(0.30
|
)
|
|
|
Average
outstanding shares
|
23,314,573
|
21,277,576
|
|||||
*Selected
quarterly financial information. The information contained herein does not
include the full unaudited quarterly financial information. Please see the
Company's report on Form 10-Q for the quarter ended March 31, 2008 for the
unaudited financial information and notes thereto.