10-K: Annual report [Section 13 and 15(d), not S-K Item 405]
Published on March 19, 2026
UNITED STATES
SECURITIES AND EXCHANGE COMMISSION
Washington, D.C. 20549
_________________________
FORM 10-K
_________________________
(Mark One)
ANNUAL REPORT PURSUANT TO SECTION 13 OR 15(d) OF THE SECURITIES EXCHANGE ACT OF 1934 | |||||
For the fiscal year ended December 31 , 2025
OR
TRANSITION REPORT PURSUANT TO SECTION 13 OR 15(d) OF THE SECURITIES EXCHANGE ACT OF 1934 | |||||
For the transition period from ___________ to ___________
Commission file number 001-42813
_________________________
(Exact name of registrant as specified in its charter)
_________________________
(State or other jurisdiction of incorporation or organization) | (I.R.S. Employer Identification No.) | |||||||
(Address of Principal Executive Offices) | (Zip Code) | |||||||
(212 ) 891-2880
Registrant’s telephone number, including area code
Securities registered pursuant to Section 12(b) of the Act:
Title of each class | Trading Symbol(s) | Name of each exchange on which registered | ||||||
Securities registered pursuant to Section 12(g) of the Act: None
Indicate by check mark if the registrant is a well-known seasoned issuer, as defined in Rule 405 of the Securities Act.
Yes ☐ No ☒
Indicate by check mark if the registrant is not required to file reports pursuant to Section 13 or Section 15(d) of the Exchange Act. Yes ☐ No ☒
Indicate by check mark whether the registrant (1) has filed all reports required to be filed by Section 13 or 15(d) of the Securities Exchange Act of 1934 during the preceding 12 months (or for such shorter period that the registrant was required to file such reports), and (2) has been subject to such filing requirements for the past 90 days. Yes ☒ No ☐
Indicate by check mark whether the registrant has submitted electronically every Interactive Data File required to be submitted pursuant to Rule 405 of Regulation S-T (§ 232.405 of this chapter) during the preceding 12 months (or for such shorter period that the registrant was required to submit such files). Yes ☒ No ☐
Indicate by check mark whether the registrant is a large accelerated filer, an accelerated filer, a non-accelerated filer, a smaller reporting company, or an emerging growth company. See the definitions of “large accelerated filer,” “accelerated filer,” “smaller reporting company,” and “emerging growth company” in Rule 12b-2 of the Exchange Act.
Large accelerated filer | ☐ | Accelerated filer | ☐ | |||||||||||
☐ | Smaller reporting company | |||||||||||||
Emerging growth company | ||||||||||||||
If an emerging growth company, indicate by check mark if the registrant has elected not to use the extended transition period for complying with any new or revised financial accounting standards provided pursuant to Section 13(a) of the Exchange Act. ☐
Indicate by check mark whether the registrant has filed a report on and attestation to its management’s assessment of the effectiveness of its internal control over financial reporting under Section 404(b) of the Sarbanes-Oxley Act (15 U.S.C. 7262(b)) by the registered public accounting firm that prepared or issued its audit report. ☒
Indicate by check mark whether the registrant is a shell company (as defined in Rule 12b-2 of the Exchange Act). Yes ☐ No ☒
If securities are registered pursuant to Section 12(b) of the Act, indicate by check mark whether the financial statements of the registrant included in the filing reflect the correction of an error to previously issued financial statements. ☐
Indicate by check mark whether any of those error corrections are restatements that required a recovery analysis of incentive-based compensation received by any of the registrant’s executive officers during the relevant recovery period pursuant to § 240.10D-1(b). ☐
The registrant was not a public company as of June 30, 2025, the last business day of the registrant’s most recently completed second fiscal quarter. Therefore, the registrant cannot calculate the aggregate market value of its voting and non-voting common equity held by non-affiliates as of such date. The registrant’s Common Stock began trading on the Nasdaq on September 15, 2025.
As of March 18, 2026, the registrant had 11,196,169 shares of Common Stock outstanding.
DOCUMENTS INCORPORATED BY REFERENCE
Portions of the Definitive Proxy Statement for the registrant’s 2026 Annual Meeting of Stockholders, expected to be filed pursuant to Regulation 14A within 120 days from December 31, 2025, are incorporated by reference into Part III of this Annual Report on Form 10-K to the extent stated herein.
Table of Contents
3
Cautionary Note Regarding Forward-Looking Statements
This Annual Report on Form 10-K contains “forward-looking statements” within the meaning of Section 27A of the Securities Act of 1933, as amended (the “Securities Act”), and Section 21E of the Securities Exchange Act of 1934, as amended (the “Exchange Act”). Forward-looking statements relate to expectations, beliefs, projections, future plans and strategies, anticipated events or trends and similar expressions concerning matters that are not historical facts. Forward-looking statements reflect the Company’s current views with respect to, among other things, capital resources, portfolio performance and results of operations. Likewise, the Company’s consolidated financial statements and statements regarding anticipated growth in its operations, anticipated market conditions, demographics and results of operations are forward-looking statements. In some cases, you can identify these forward-looking statements by the use of terminology such as “outlook,” “believes,” “expects,” “potential,” “continues,” “may,” “will,” “should,” “could,” “seeks,” “approximately,” “predicts,” “intends,” “plans,” “estimates,” “anticipates” or the negative version of these words or other comparable words or phrases.
The forward-looking statements contained in this Annual Report on Form 10-K are based on the Company’s current expectations and beliefs concerning future developments and their potential effects on the Company. There can be no assurance that future developments affecting the Company will be those that it has anticipated. Actual results may differ materially from those in the forward-looking statements. Some factors that could cause the Company’s actual results to differ include:
•the risk that any synergies from the Business Combination (as defined herein) may not be fully realized or may take longer to realize than expected;
•the risk of litigation related to the Business Combination;
•variability in revenues, earnings, and cash flows and the resulting impact on quarterly earnings trends and stock price volatility;
•the intensity of competition in asset management and insurance markets and constraints on the ability to execute growth strategies and maintain or increase market share or margins;
•reliance on technology and information systems, including third party and systems provided by BC Partners Advisors L.P. (“BCPA”), and risks related to cybersecurity, data integrity, and operational resilience;
•dependence on management’s assumptions, estimates, models, and judgment, and the risk that actual outcomes diverge materially from those assumptions;
•illiquidity of certain assets under management and insurance investments, and the impact of limited liquidity on valuation, portfolio management, and capital allocation;
•dependence on access to financing markets and the availability, cost, and terms of capital and liquidity;
•risks associated with the use of hedging and other risk management instruments, including costs, basis risk, counterparty exposure, and potential ineffectiveness;
•adverse political, market, and economic conditions and their effects on investment performance, funding costs, client activity, and policyholder behavior;
•dependence on BCPA and key BCPA personnel;
•actual and potential conflicts of interest arising from the relationship with BCPA;
•concentration risk associated with managing a limited number of funds and investments;
•complexities and subjectivity in valuing illiquid assets, including model risk and sensitivity to assumptions;
•the heavily regulated nature of the insurance business; and
•the increased expenses and compliance requirements associated with being a U.S. public company.
These forward-looking statements involve a number of risks, uncertainties (some of which are beyond the Company’s control) or other assumptions that may cause actual results or performance to be materially different from those expressed or implied by these forward-looking statements. These risks and uncertainties include, but are not limited to, those factors described under the section entitled “Item 1A. Risk Factors” of this Annual Report on Form 10-K. Should one or more of these risks or uncertainties materialize, or should any of the assumptions prove incorrect, actual results may vary in material respects from those projected in these forward-looking statements. The Company undertakes no obligation to update or revise any forward-looking statements, whether as a result of new information, future events or otherwise, except as may be required under applicable securities laws.
Unless the context otherwise requires, (i) all references in this Annual Report on Form 10-K following the closing of the Business Combination on September 12, 2025 to “we,” “us,” “our,” the “Company,” and “Mount Logan” refer to Mount Logan Capital Inc. (formerly, Yukon New Parent, Inc.), as the registrant, and its consolidated subsidiaries and (ii)
4
all references prior to the closing refer to Legacy Mount Logan (as defined herein). The Mount Logan logo and our other registered or common law trademarks, service marks, or trade names appearing in this Annual Report on Form 10-K are the property of Mount Logan Capital Inc. Other trade names, trademarks, and service marks used in this Annual Report on Form 10-K are the property of their respective owners.
5
PART I
Item 1. Business
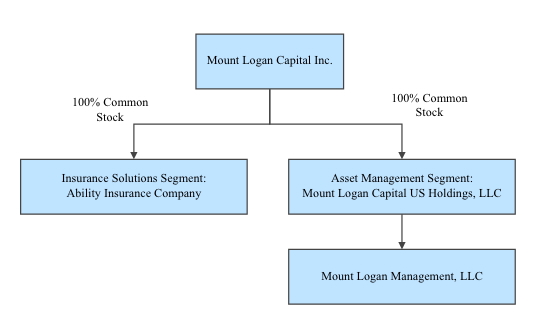
Formed in 2018, we are a publicly traded, alternative asset management and insurance solutions company that is focused on public and private debt securities in the North American market and the reinsurance of annuity products, primarily through our wholly-owned subsidiaries Mount Logan Management LLC (“ML Management”) and Ability Insurance Company, a Nebraska domiciled insurer (“Ability”), respectively. We also actively source, evaluate, underwrite, manage, monitor and primarily invest in loans, debt securities, and other credit-oriented instruments that present attractive risk-adjusted returns and present low risk of principal impairment through the credit cycle. We conduct our business primarily in the United States through our two business segments: Asset Management and Insurance Solutions.
On September 12, 2025 (the “Closing Date”), the Company completed a business combination pursuant to an Agreement and Plan of Merger, dated as of January 16, 2025 and amended as of July 6, 2025 and August 17, 2025 (the “Merger Agreement”) among the Company (formerly, Yukon New Parent, Inc.), Mount Logan Capital Inc., a corporation organized under the laws of the Province of Ontario (“Legacy Mount Logan”), and 180 Degree Capital Corp. (“TURN”), a New York corporation that was registered as a closed-end investment company under the Investment Company Act of 1940, as amended (the “Investment Company Act”), Polar Merger Sub, Inc., a corporation organized under the laws of the State of New York and wholly owned subsidiary of the Company (“TURN Merger Sub”), and Moose Merger Sub, LLC, a limited liability company formed under the laws of the State of Delaware and a wholly owned subsidiary of the Company (“MLC Merger Sub”) wherein (i) TURN Merger Sub. merged with and into TURN, with TURN surviving as a wholly owned subsidiary of the Company, and (ii) MLC Merger Sub merged with and into Legacy Mount Logan, with Legacy Mount Logan surviving as a wholly owned subsidiary of the Company (collectively, the “Business Combination”). Following the completion of the Business Combination, the Company changed its name from “Yukon New Parent, Inc.” to “Mount Logan Capital Inc.” and became a Nasdaq-traded public company. The Business Combination was accounted for as a reverse acquisition, with Legacy Mount Logan identified as the accounting acquiror and the legal acquiree.
The diagram below depicts Mount Logan’s current organizational structure:
Our Businesses
Asset Management
Our Asset Management segment focuses on private credit across senior secured lending, asset-based and specialty finance, structured and opportunistic credit, venture and growth lending, and select equity-linked solutions. We provide origination, underwriting, portfolio construction and risk management to a diversified client base, including insurance accounts, a BDC platform, our interval funds (SOFIX, ACIF), Separately Managed Accounts (“SMAs”) and other vehicles. We manage substantially all of the assets of Ability, our primary Insurance Solutions business, and maintain an active dialogue with the insurance solutions team.
For these services, we generate recurring fee streams across a diversified set of credit investing strategies. After expenses required to generate our fee revenues, the remaining profit stream constitutes Fee Related Earnings (“FRE”), our primary performance measure for this segment. We operate the platform integrated with our insurance solutions business, enabling collaboration on sourcing and asset allocation aligned to similarly-dated liabilities.
6
Our investment philosophy is centered around deploying capital into well-established middle-market businesses that operate across a wide range of industries, while limiting concentration in any one industry. We employ fundamental credit analysis, targeting investments in businesses with relatively low levels of cyclicality and operating risk. We seek to provide a full credit cycle investment offering, with the ability to opportunistically allocate capital to fill the white space created as other capital sources retrench. As part of our opportunistic allocation of capital, we are able to underwrite complex, less competitive niches, and deploy capital during periods of uncertainty with a consistent emphasis on downside protection and preservation of capital. Many of our mandates utilize multi-year, permanent or semi-permanent capital, allowing us to invest patiently across the capital structure, scale AUM, and compound recurring FRE through cycles. As of December 31, 2025, we had total AUM in excess of $2.1 billion.
We have experience managing levered vehicles, both public and private, and seek to enhance returns through the prudent use of leverage with a conservative approach that prioritizes downside protection and capital preservation. We believe this strategy and approach offers attractive risk-adjusted returns with lower volatility given the potential for fewer defaults and greater resilience through market cycles.
Permanent or Semi-Permanent Capital
Included within our investing strategies above is $1.5 billion of permanent or semi-permanent capital, out of the over $2.1 billion of total AUM, as of December 31, 2025. As of December 31, 2025, permanent capital includes, without limitation, certain assets in our credit strategy, including assets relating to publicly traded and non-traded vehicles, and assets managed for certain of our Insurance Solutions clients, which have indefinite or long-term investment horizons, and in specific cases provide stable sources of funding while allowing for liquidity access for investors through redemption mechanisms. We do not include vehicles with definite term, finite investment periods, or funds that are in wind-down in our definition and aggregation of permanent or semi-permanent capital.
The amount of fees charged for managing these assets depends on the underlying investment strategy, vehicle being managed, liquidity profile, and, ultimately, our ability to generate returns for our clients. After expenses associated with generating fee-related revenues, we measure the resulting earnings stream’s “Fee Related Earnings” or “FRE”, which represents the primary performance measure for the Asset Management segment. FRE is the sum of all recurring fees underpinned by asset management activities including but not limited to: (i) management and servicing fees, (ii) interest income attributable to investment management activity, (iii) equity investment earnings related to fee generating vehicles, and (iv) fee-related performance fees from certain managed funds with indefinite terms, measured and received on a recurring basis and not dependent on realization events of the underlying investments, less (x) fee related compensation expense, excluding equity-based compensation, and (y) other associated operating expenses, which excludes growth investments into the retail distribution platform, amortization of acquisition-related intangible assets, interest and other credit facility expenses, foreign exchange-related gains and losses, and other non-recurring, nonmaterial items that are not required for the management of the underlying assets and investments.
Historically, we focused on strategic acquisitions and partnerships to expand our asset management capabilities, including but not limited to (i) the 2020 transaction alongside SCIM, whereby SCIM became the investment advisor to the Alternative Credit Income Fund (“ACIF”), (ii) the purchase of, and subsequent increase in, a minority stake in SCIM, which manages Portman Ridge Finance Corp. (“PTMN”), a closed-end, externally managed, non-diversified investment company that has elected to be treated as a Business Development Company (“BDC”) under the Investment Company Act of 1940, (iii) the 2021 acquisition of certain assets from Capitala Investment Advisors, LLC, whereby ML Management became the manager of Logan Ridge Finance Corp. (formerly Capitala Finance Corp.) (“Logan Ridge”), also a BDC, and (iv) the transaction with Ovation Partners, LP (“Ovation”), for the management of its alternative income platform, which included the transfer of employees to ML Management to support its specialty finance and asset-backed finance efforts across commercial lending, real estate lending, consumer finance, and litigation finance.
The Asset Management segment also holds minority equity interests in (i) Runway Growth Capital, LLC (“Runway”), which is a private credit, SEC-registered investment adviser managing $1.2 billion AUM with a specific orientation on providing growth capital to sponsored (i.e., venture-backed) and non-sponsored companies, and (ii) two Canadian alternative asset managers focused on investment grade, high yield, private credit, and asset-backed investment strategies. The minority investment in Runway Growth Capital was acquired during the first quarter of 2025 by Legacy Mount Logan, but for purposes of this filing is not considered a significant investment in accordance with Rule 3-09 of Regulation S-X.
We are differentiated by the scale, depth, diversity, and investment performance of our funds and investment solutions. The diversity of our credit products and private market solutions demonstrates our focus on expanding and enhancing our capabilities, in support of investment performance on behalf of our investment clients. We believe the
7
achievement of attractive risk-adjusted returns will continue to support growth in AUM and the recurring fee streams it earns across the vehicles it manages.
Insurance Solutions
We acquired Ability in the fourth quarter of 2021. Today, Ability is a Nebraska domiciled reinsurer of annuity products that specializes in reinsuring annuity products for the increasing number of individuals seeking to fund retirement needs. Upon closing of the acquisition of Ability, ML Management entered into an investment management agreement with Ability (the “Ability IMA”) to manage certain of Ability’s assets that are within the scope of ML Management’s expertise in providing investment management advisory services (the assets of Ability managed by ML Management are referred to herein as the “Managed Ability Portfolio”). Ability then shifted the focus of our insurance business away from legacy insurance products, and reoriented around retirement solutions products, including multi-year guaranteed annuities (“MYGA”). Ability’s long-term goal is to build a platform that can both insure and reinsure a diverse set of competitive annuity and life insurance products.
Our acquisition of Ability combined two products that we believe are, and will continue to be, in high demand – insurance solutions and alternative asset management. We, through our acquisition of Ability, brought the insurance business additional capital to support growth, a stronger investment portfolio through ML Management’s repositioning of the portfolio, stability and continuity of liability management, and new growth opportunities that we believe will provide increased security to policyholders. The acquisition positioned us for a new stage of growth, as the stronger capital base and alignment allows us to scale asset and liability origination for the benefit of Ability’s policyholders as well as us and our shareholders.
We are focused on generating spread income, or Spread Related Earnings (“SRE”), within our Insurance Solutions segment for the benefit of policyholders, through (i) sourcing long-term liabilities and (ii) using the origination and investment capabilities of our Asset Management segment to source or originate assets that fit Ability’s targeted risk and return characteristics. SRE represents the difference between actual earnings generated on the assets and investments made and the interest or crediting rate guaranteed to policyholders or participants. We view SRE as a critical measurement for assessing the profitability of the Insurance Solutions segment, as it excludes the impact of certain market volatility and other one-time, non-core components of income or loss. Rather than increasing allocations to higher risk securities to increase yields, or returns, on the assets invested, Ability and ML Management focus on proprietary origination of high-quality, predominantly senior secured loans and assets, which we believe reduces downside risk. SRE is a key financial metric that we defined and report as a non-GAAP financial measure. See “—Segment Analysis—Insurance Solutions” for a reconciliation of SRE to the most directly comparable U.S. GAAP measure.
Our asset management expertise supports the sourcing and underwriting of assets for Ability’s portfolio. Ability is invested in a diverse array of high-grade fixed income assets including corporate bonds, structured securities and commercial real estate loans, as well as senior secured loans. Ability manages its interest rate risk through hedging activity to lower its overall net floating rate position. Ability also maintains holdings in less interest rate-sensitive investments, including CLOs, non-agency residential mortgage-backed securities (“RMBS”), and various types of structured products, consistent with its strategy of pursuing incremental yield by assuming liquidity and complexity risk, rather than assuming incremental credit risk.
Ability’s Products
Ability currently reinsures annuity products, consisting of MYGA, and is licensed in 42 states and the District of Columbia. We acquired Ability in the fourth quarter of 2021. As part of the transaction, we invested $10 million of capital into Ability to strengthen its balance sheet and launch a platform for the reinsurance of annuities. The reinsurance of annuity products commenced in the second quarter of 2022. As of December 31, 2025 we have contributed an incremental $37.2 million of capital and investments into Ability.
Annuities are a contract with an insurer where individuals agree to pay a certain amount of money, either in a lump sum or through installments, which entitles them to receive a series of payments at a future date. MYGA products are single premium deferred individual annuity contracts, providing consumers with an attractive, low-risk, predictable, and tax deferred investment option.
Effective April 1, 2022, we, through Ability, closed a reinsurance agreement with Atlantic Coast Life Insurance Company (“ACL”) pursuant to which Ability assumed a 20% quota share coinsurance of up to $150.0 million of premium of MYGA policies beginning January 1, 2021. Effective July 1, 2022, Ability closed on an additional reinsurance agreement with Sentinel Security Life Insurance Company (“SSL”) to assume a 20% quota share coinsurance of up to $100.0 million of premium of MYGA policies. These quota share coinsurance agreements were met as of July 10, 2023. On January 10, 2024, we, through Ability, amended the reinsurance agreements with ACL and with SSL, pursuant to
8
which Ability would assume a 20% quota share coinsurance of premium of MYGA policies issued and approved on or after October 1, 2023. Ability elected to terminate the amended reinsurance agreements, effective June 30, 2024, to diversify and grow liability origination away from the initial counterparties, ACL and SSL. On March 31, 2025, Ability entered a new reinsurance treaty for additional MYGA with National Security Group (“NSG”), further diversifying its reinsurance partners.
Ability has a runoff book of long-term care (“LTC”) business, which we classify as Ability’s legacy business. Ability has several reinsurance agreements to reinsure the long-term care portfolio's morbidity risk. Ability is no longer insuring new long-term care risk. The last LTC policy Ability wrote was in the early 2000’s, and thus, LTC has not been a core focus of the insurance business for multiple decades.
Reinsurance Channels
Ability is focused on reinsurance through quota-share agreements in the form or flow or block trades, as well as acquisitions, which supports Ability’s liability origination efforts across market environments. As Ability continues to grow, it remains disciplined in its evaluation of liabilities that are core to its strategy.
Capital
Ability believes it has a strong capital position and is well positioned to meet policyholder and other obligations, which it determines through various internal capital metrics tracked by management. The amount of capital required to support Ability’s core operating strategies is determined based on internal modeling and analysis of economic risk, as well as inputs from rating agency capital models and consideration of National Association of Insurance Commissioners (“NAIC”) risk-based capital (“RBC”) requirements. Capital in excess of this required amount is considered excess equity capital, which is available to deploy.
Ability’s Market Opportunity
Ability participates in a large U.S. market that it expects to grow in part due to several demographic trends. As measured by annual premiums written, annuities are the largest product line in the life and annuity sector. Annuities play an important role in retirement planning by providing individuals with stable, tax-efficient sources of income. In 2025, annuity premiums totaled $461.3 billion, up 6% year over year, accordingly to preliminary results from LIMRA’s U.S. Individual Annuity Sales survey, which represents 92% of the U.S. annuity market. The most common annuities are fixed and variable and may be written on an individual or group basis. The current products Ability reinsures are fixed annuities written on an individual basis.
There is an increasing demand for retirement solutions as a growing portion of the U.S. population is of retirement age and the retirement income needs of retirees are expected to increase. The number of people of retirement age has increased significantly since 2010, driven by the aging of the “Baby Boomer” generation. The U.S. population over 65 years old is forecast to grow from 57.8 million in 2022 to an estimated 78.3 million in the next 20 years, according to the U.S. Census Bureau, Population Estimates and Projections. This study also forecasted that the U.S. population aged over 65 years old is expected to grow by 44% from 2020 to 2040, while the total U.S. population is expected to grow by only 12%. Currently, 17.3% of the U.S. population is 65 or older, which is projected to rise to 22% by 2040, according to the ACL. The UN’s Population Statistics group has also forecasted that the global population aged 65 and over is expected to double from 0.8 billion to 1.6 billion, increasing from 10% to 17% of the total population, by mid-century. This demographics-driven demand has been further supported by a higher interest rate environment, which has enabled annuity providers to enhance their product offerings with more attractive crediting rates, strengthening the overall value proposition for consumers.
Annuities play an increasingly vital role in retirement planning, offering retirees stable, tax-efficient, and guaranteed income streams. In 2025, total fixed-rate deferred annuity sales reached $160.6 billion, improving by 5% since 2024. The consistent growth in MYGA demand has been a key driver of the overall expansion in the fixed annuity market. Ability’s current product focus is centered on individual MYGA offerings, where Ability sees continued opportunity for growth.
Growth Strategy
We are building a diversified alternative asset management and insurance solutions platform. With the completion of the Business Combination and our Nasdaq listing, we believe we have improved access to the capital markets, improved financing flexibility and a stronger balance sheet to accelerate organic and inorganic growth initiatives. Our team’s priorities include (i) investing into Ability to support increased reinsurance flows to expand Ability’s liabilities and investment portfolio to generate positive SRE, primarily managed by our registered advisor, ML Management; (ii) scaling
9
our private credit AUM across existing and future vehicles to increase FRE; and (iii) selective acquisitions and partnerships that broaden origination, diversify products, and enhance operating leverage. These initiatives are intended to reinforce shareholder value by compounding FRE and SRE via a capital flywheel. As assets under management increase, FRE rises, generating additional cash flow at the parent company. We can reinvest this cash into Ability to support new reinsurance treaties, which expand liabilities and invested assets. These assets generate SRE while also increasing AUM managed by Mount Logan, which in turn produces more FRE and cash flow to be re-deployed. We pursue this growth within a framework of disciplined underwriting, regulatory compliance, and capital management.
Asset Management
Our objective is to become a fully diversified private credit manager for institutional, retail and insurance clients. We are growing AUM in existing vehicles, new strategies, and through accretive acquisitions and partnerships that add capital and incremental origination channels. We intend to: (i) expand AUM in our existing vehicles; (ii) launch adjacent strategies that can scale through our distribution network; and (iii) pursue acquisitions or partnerships that add origination and recurring fees. These initiatives are supported by our permanent and semi-permanent capital base and our track record managing diverse investment vehicles. We are capitalizing on secular tailwinds as banks continue to re-trench and private credit fills the gap. We evaluate new vehicle launches, acquisitions and partnerships based on a number of factors including: (i) strategic fit (e.g. credit capability expansion, distribution); (ii) durability of capital (i.e. permanent or semi-permanent capital, what we refer to as “sticky AUM”); (iii) underwriting culture, risk controls, and unit economics (e.g., FRE uplift and margin accretion); and (iv) ease of integration into our operating model, as supported by our Staffing and Resource Agreement and Servicing Agreement (each as defined below) with BCPA.
Insurance Solutions
We are scaling a capital-efficient insurance platform pairing long-dated, predictable liabilities with our private credit origination and underwriting capabilities. A strengthened balance sheet following our combination with 180 Degree Capital positions us to grow our insurance capabilities. Our objectives include:
Expand MYGA Reinsurance Through Diversified Channels: Our Insurance Solutions segment, through Ability, is initially focused on MYGA reinsurance, a product with fixed tenors, high predictability, and strong growth in the fixed annuity market. We intend to increase our cadence of quota-share flow treaties and opportunistic blocks with a broader set of counterparties, building on previously executed agreements. Any new reinsurance treaties we enter into will be filed with and approved by appropriate state insurance regulatory authorities before being executed.
Increase our RBC Ratios via Direct Investments from Mount Logan, compounding SRE and Reinforcing the Asset Management “Flywheel”: Mount Logan as Parent can invest capital directly into Ability to support MYGA reinsurance and other insurance activities that we may pursue in the future. Through our asset management segment, we target attractive spread economics and active portfolio management to optimize Ability’s assets, while earning a management fee for performing these activities. The flywheel between asset management and insurance solutions is a key driver of the compounding growth of our business.
Broaden Product Set and Strengthen Distribution: Over time we plan to expand beyond MYGA into complementary retirement and life protection solutions, including fixed indexed annuities and pre-need products, subject to market conditions and regulatory approvals. We also plan to diversify and expand its liability based through flow and block transactions where attractive opportunities arise, complementing its direct writing capabilities. As scale increases across products and distribution channels, we expect to drive improved operating leverage, enhance the durability of SRE, and maintain disciplined management of asset-liability matching, RBC ratios, and regulatory capital.
Competition
Asset Management
Competition is high in the asset management industry, and more specifically the alternative asset management space in which we primarily operates. We face competition from a large number of asset managers that focus on the management of public and private funds, as well as commercial and investment banks, merchant banks, commercial financing companies, institutional investors, insurance companies and, to the extent they provide an alternative form of financing, private equity funds.
With respect to our investment strategies and the deployment of capital, we primarily compete with other private markets solutions providers within North America and Europe that specialize in private credit. We endeavor to maintain strong relationships with general partners and other alternative asset managers who manage investment funds, as well as the general investment community that can include investment banks, commercial banks, advisors, brokers, legal firms, and
10
accountants. Our non-sponsored, or non-private equity-backed, deals are sourced through a proprietary and robust network of industry contacts and other channels including existing relationships with owners or management teams of middle market companies, family-owned businesses, and niche industry players. We view the non-sponsored channel as less competitive given the wide dispersion of opportunities across North America and Europe, which are harder to source, evaluate, and underwrite. However, because of the increasing demand for private credit investments and growth across the industry, there can be no assurance that we will be able to invest all of the capital it raises in investments that meet our risk-adjusted return thresholds, or that the size of investment opportunities available to us will meet our investment sizing targets.
To grow our business, we must compete for investor capital, both within our existing investor base and the broader investor universe that is actively seeking to deploy capital into the private markets, and specifically funds managed by alternative asset managers like ML Management. Historically, our ability to raise additional capital, and thus grow AUM, is based on a variety of factors, including but not limited to:
•Investment performance across our managed and sub-advised investment strategies;
•Ability to originate and execute private credit investment opportunities;
•Nature and duration of investor relationships;
•Quality of service;
•Fund terms, including fees;
•Brand recognition of the platforms through which we operate as well as the brand recognition of the firms which we partner with, including BCPA and Runway;
•Ability to customize product offerings to fit our institutional, retail, and insurance client specifications; and
•Ability to provide cost effective and comprehensive range of services and products.
Competition is also high to attract and retain highly qualified investment professionals and support functions personnel. Our ability to continue to compete effectively within our industry will depend upon our ability to attract new employees and to motivate and retain our existing employees.
Insurance Solutions
We operate in a highly competitive industry through our Insurance Solutions operating subsidiary, Ability. Ability reinsures annuity products, which compete with fixed rate, fixed index, and variable annuities sold by other insurance companies and also with mutual fund products, traditional bank products, and other investment and retirement funding alternatives offered by other asset managers, banks, and broker/dealers.
The products Ability reinsures may compete with products of other insurance companies, financial intermediaries and other institutions based on several features, including crediting rates, index options, policy terms and conditions, ratings, reputation, and distributor compensation.
Many of Ability’s competitors are well-established, and have greater market share, broader networks, and maintain financial strength ratings from A.M. Best, which Ability does not have today. Larger competitors can have lower operating costs, enabling them to participate in transactions at more competitive pricing levels for insurance products, reinsurance solutions, and acquisitions. This pricing pressure could affect our Insurance Solutions segment’s ability to maintain or increase profitable growth. Ability has primarily grown through MYGA block reinsurance transactions and flow reinsurance, and increased competition within these insurance products could impact transaction pricing, potentially challenging future growth.
Regulatory and Compliance Matters
Our businesses, as well as the financial services and insurance industries generally, are subject to extensive regulation in the United States and around the world. Virtually all aspects of our business are subject to various laws and regulations, some of which are summarized below. Under these laws and regulations, agencies that regulate investment advisers, investment funds, insurance businesses, and other individuals and entities have broad administrative powers, including the power to limit, restrict, or prohibit the regulated entity or person from carrying on business if it fails to
11
comply with such laws and regulations. Failure to comply with applicable regulatory and compliance requirements may result in a variety of consequences, including fines; administrative measures; suspension of voting rights; suspension of individual employees; limitations on engaging in certain lines of business for specified periods of time or mandatory disposal of interests in any affected regulated entity; revocation of investment adviser, insurance, and other registrations; licenses, or charters; censures; and other regulatory sanctions. The legal and regulatory requirements applicable to our business are ever evolving and may become more restrictive, which may make compliance with applicable requirements more difficult or expensive, or otherwise restrict our ability to conduct our business activities in the manner in which they are now conducted. our businesses have operated for many years within a legal framework that requires being able to monitor and comply with a broad range of legal and regulatory developments that affect our activities. However, additional legislation, changes in rules promulgated by self-regulatory organizations, or changes in the interpretation or enforcement of existing laws and rules, either in the United States or elsewhere, may directly affect our mode of operation and profitability. The complex regulatory frameworks governing financial institutions, insurance companies, and insurance distributors and their respective holding companies and subsidiaries, as well as those with investments in them, are very detailed and technical. Accordingly, the discussion below is general in nature, does not purport to be complete and is current only as of the date of this Annual Report on Form 10-K.
Regulation under the Advisers Act
We conduct our advisory business primarily through ML Management and SCIM, each of which is registered as an investment adviser with the SEC under the Advisers Act. ML Management and SCIM are subject to, among other Advisers Act provisions, the anti-fraud provisions of the Advisers Act and to fiduciary duties derived from these provisions, which apply to the RIA’s relationships with their advisory clients globally, including funds that the RIAs manage. These provisions and duties impose restrictions and obligations on the RIA with respect to their dealings with their fund investors and their investments, including for example restrictions on agency cross and principal transactions. ML Management and SCIM are subject to periodic SEC examinations and other requirements under the Advisers Act and related regulations primarily intended to benefit advisory clients. These additional requirements relate, among other things, to maintaining an effective and comprehensive compliance program, record-keeping and reporting requirements and disclosure requirements. The Advisers Act generally grants the SEC broad administrative powers, including the power to limit or restrict an investment adviser from conducting advisory activities in the event it fails to comply with federal securities laws. Additional sanctions that may be imposed for failure to comply with applicable requirements include the prohibition of individuals from associating with an investment adviser, the revocation of registrations, and other censures and fines.
Insurance Regulation
Ability is subject to extensive regulation and supervision by the states in which it is domiciled, particularly with respect to their financial condition. Ability is domiciled in Nebraska, where it is regulated and supervised by the Nebraska Department of Insurance (“NEDOI”). Ability is also subject to regulation by all states in which the company transacts business; oversight that, in practice, often focuses on review of Ability’s market conduct. Ability is licensed to conduct insurance business, and is therefore subject to regulation and supervision by insurance regulators, in 42 states and the District of Columbia.
The extent and scope of insurance regulation varies between jurisdictions, but most jurisdictions have laws and regulations governing the financial security of insurers, including admittance of assets for purposes of calculating statutory surplus, standards of solvency, reserves, reinsurance, capital adequacy, and the business conduct of insurers.
In addition, statutes and regulations require the licensing of insurers and their agents, the approval of policy forms and related materials, and the approval of rates. State statutes and regulations also prescribe the permitted types and concentrations of investments by insurers. The primary purpose of this insurance industry regulation is to protect policyholders. Life insurance companies are required to file detailed quarterly and annual financial statements with insurance regulatory authorities in each of the jurisdictions in which they are licensed to do business, and their operations are subject to periodic examination by such authorities. Regulators have discretionary authority, in connection with the continued licensing of insurance companies, to limit or prohibit the insurance company’s ability to continue to do business if, in their judgment, the regulators determine that an insurer is not maintaining necessary statutory surplus or capital or if the further transaction of business will be detrimental to its policyholders.
The amount of dividends that Ability may pay in any twelve-month period, without prior approval by its domestic insurance regulator, is restricted under the laws of Nebraska.
We, an insurance holding company, together with our insurance subsidiary, Ability, are subject to the insurance holding company system laws of Nebraska. These laws generally require insurers that are members of such insurance holding company’s system to register with the jurisdiction’s insurance regulatory authorities, to file reports disclosing
12
certain information, including the insurance holding company’s capital structure, ownership, management, financial condition, enterprise risk, and own risk and solvency assessment.
These laws also require disclosure of certain qualifying transactions between Ability and any of our other subsidiaries or affiliates. Such transactions could include loans, investments, sales, service agreements, and reinsurance agreements among other similar inter-affiliate transactions. These laws also require that intercompany transactions be fair and reasonable and not adversely affect the interests of policyholders. In certain circumstances, the insurance company must give prior notice of the transaction to the insurance department in its state of domicile, and the insurance department must either approve or disapprove the subject intercompany transaction within defined periods. Further, these laws require that an insurer’s surplus following any dividends or distributions to shareholder affiliates is reasonable in relation to the insurer’s outstanding liabilities and its financial needs.
The insurance holding company laws in some states, including Nebraska, require regulatory approval of a direct or indirect change of control of an insurer or an insurer’s parent company. Generally, to obtain approval from the insurance commissioner for any acquisition of control of an insurance company or its parent company, the proposed acquirer must file with the applicable commissioner an application containing information regarding:
(i)the identity and background of the acquirer and its affiliates;
(ii)the nature, source and amount of funds to be used to carry out the acquisition;
(iii)the financial statements of the acquirer and its affiliates;
(iv)any potential plans for disposition of the securities or business of the insurer;
(v)the number and type of securities to be acquired;
(vi)any contracts with respect to the securities to be acquired;
(vii)any agreements with broker-dealers; and
(viii)other relevant matters.
Different jurisdictions may have similar or additional requirements for prior approval of any acquisition of control of an insurance or reinsurance company licensed or authorized to transact business in those jurisdictions. Additional requirements may include re-licensing or subsequent approval for renewal of existing licenses upon an acquisition of control.
Statutory Examinations
Ability is required to file detailed quarterly and annual financial statements, prepared in accordance with statutory accounting practices (“SAP”), with regulatory officials in each of the jurisdictions in which they conduct business. As part of their routine regulatory oversight process, the NEDOI conducts periodic detailed examinations, generally once every three to five years, of the books, records, accounts and operations of Ability. The NEDOI began its regularly-scheduled examination of Ability for the period of 2020-2022 in August 2023, completing its examination and issuing its final report on October 25, 2024.
Financial Tests
The NAIC has developed a set of financial relationships or “tests,” known as the Insurance Regulatory Information System, or IRIS, which is designed for early identification of companies that may require special attention or action by insurance regulatory authorities. Insurance companies submit data annually to the NAIC, which in turn analyzes the data by utilizing ratios. State insurance regulators review this statistical report, which is available to the public, together with an analytical report, prepared by and available only to state insurance regulators, to identify insurance companies that appear to require immediate regulatory attention. A “usual range” of results for each ratio is used as a benchmark.
Risk-Based Capital Requirements
In order to enhance the regulation of insurers’ solvency, the NAIC has adopted a model law to implement RBC requirements for life insurers. All states have adopted the NAIC’s model law or a substantively similar law. The NAIC Risk-Based Capital Model Act requires insurance companies to submit an annual RBC Report, which compares an insurer’s total adjusted capital with its authorized control level RBC. A company’s RBC is calculated by using a specified
13
formula that applies factors to various specified assets, premium, claim, expense, and reserve items. The factors are higher for those items with greater underlying risk and lower for items with less underlying risk.
The RBC Report is used by insurance regulators to set in motion appropriate regulatory actions relating to insurers that show indications of weak or deteriorating conditions. RBC is an additional standard for minimum capital requirements that insurers must meet to avoid being placed in receivership by regulators. The annual RBC Report, and the information contained therein, is not intended by the NAIC as a means to rank insurers.
RBC is a method of measuring the minimum amount of capital appropriate for an insurance company to support its overall business operations in light of its size and risk profile. It provides a means of setting the capital requirement in which the degree of risk taken by the insurer is the primary determinant. The value of an insurer’s Total Adjusted Capital, which is the sum of its year-end statutory capital and surplus, in relation to its RBC, together with its trend in its Total Adjusted Capital, is used as a basis for determining regulatory action that a state insurance regulator may be authorized or required to take with respect to an insurer.
Ability is subject to RBC standards and other minimum capital and surplus requirements imposed by state laws. Regulatory capital requirements for Ability are determined in accordance with statutory requirements of the Nebraska Department of Insurance. The minimum RBC ratio for Ability is 200% and Ability must have a ratio in excess of 300% to be able to reinsure new business. Regulatory action is triggered beginning at 200% RBC and below. The regulatory action varies with risk based capital level as follows: (i) if a company’s total adjusted capital is less than 200% but greater than or equal to 150% of its authorized control level RBC, the company shall submit a risk-based capital plan to the regulatory authority highlighting conditions which contributed to lower adjusted capital and proposing corrective actions aimed at improving its capital position; (ii) if a company’s total adjusted capital is less than 150% but greater than or equal to 70% of its authorized control level RBC, the regulatory authority will perform such examination and analysis of the assets, liabilities, and operations including a review of its risk-based capital plan of the company as deemed necessary and issue an order specifying the corrective actions that must be taken; (iii) if a company’s total adjusted capital is less than 70%, the regulatory authority may take any action it deems necessary, including placing the company under regulatory control. Ability’s RBC ratio is tested annually at the end of Ability’s financial year and estimated on a quarterly basis.
Market Conduct Exams
Ability is subject to periodic market conduct exams (“MCE”) in any jurisdiction where it does business. An MCE typically entails review of business activities, such as operations and management, complaint handling, marketing and sales, producer licensing, policyholder service, underwriting, and claims handling. Regulators may impose fines and penalties upon finding violations of regulations governing such business activities.
Form Approvals
Ability is subject to state laws and regulations regarding form approvals. In most states, insurance policies are subject to prior regulatory approval in the state in which the policy is sold.
Unfair Claims Practices
Insurance companies are prohibited by state statutes from engaging in unfair claims practice. Unfair claims practices include, but are not limited to, misrepresenting pertinent facts or insurance policy provisions; failing to acknowledge and act reasonably promptly upon communications with respect to claims arising under insurance policies; and attempting to settle a claim for less than the amount to which a reasonable person would have believed such person was entitled.
Regulation of Investments
Ability is subject to state laws that restrict the kinds of investments it may make. These laws require diversification of investment portfolios and limit the amounts of investments in certain asset categories, such as below-investment grade fixed income securities, equity real estate, other equity investments, and derivatives. Failure to comply with these requirements and limitations could cause affected investments to be treated as non-admitted assets for purposes of measuring statutory surplus and, in some instances, could require the divestiture of such non-qualifying investments. Ability’s investment guidelines, including its Derivative Use Plan, have been filed with the NEDOI.
Statutory Accounting Practices
SAP are a basis of accounting developed to assist insurance regulators in monitoring and regulating the solvency of insurance companies. SAP is primarily concerned with measuring an insurer’s solvency. Statutory accounting focuses on
14
valuing assets and liabilities of insurers at financial reporting dates in accordance with appropriate insurance law and regulatory provisions applicable in each insurer’s domiciliary state.
U.S. GAAP is concerned with a company’s solvency, but is also concerned with other financial measurements, principally income and cash flows. Accordingly, U.S. GAAP gives more consideration to appropriately matching revenue and expenses and accounting for management’s stewardship of assets than does SAP. As a result, different assets and liabilities and different amounts of assets and liabilities will be reflected in financial statements prepared in accordance with U.S. GAAP as compared to SAP.
Enterprise Risk and other Developments
The NAIC, as part of its solvency modernization initiative, has engaged in a concerted effort to strengthen the ability of U.S. state insurance regulators to monitor U.S. insurance holding company groups. The holding company reform efforts at the NAIC culminated in December 2010 in the adoption of significant amendments to the NAIC’s Insurance Holding Company System Regulatory Act (the “Model Holding Company Act”) and its Insurance Holding Company System Model Regulation (the “Model Holding Company Regulation”). Among other things, the revised Model Holding Company Act and Model Holding Company Regulation explicitly address “enterprise” risk — the risk that an activity, circumstance, event, or series of events involving one or more affiliates of an insurer will, if not remedied promptly, be likely to have a material adverse effect upon the financial condition or liquidity of the insurer or its insurance holding company system as a whole — and require annual reporting of potential enterprise risk as well as access to information to allow the state insurance regulator to assess such risk. In addition, the Model Holding Company Act amendments include a requirement to the effect that any person divesting control over an insurer must provide 30 days’ notice to the regulator and the insurer (with an exception for cases where a Form A is being filed). The amendments direct the domestic state insurance regulator to determine those instances in which a divesting person will be required to file for and obtain approval of the transaction. Some form of the 2010 amendments to the Model Holding Company Act and the Model Holding Company Act Regulation has been adopted in all states.
Consumer Protection Laws and Privacy and Data Security Regulation
Federal and state consumer protection laws affect our operations. As part of the Dodd-Frank Act, Congress established the Consumer Financial Protection Bureau to supervise and regulate institutions that provide certain financial products and services to consumers. In addition, the Gramm-Leach-Bliley Act of 1999 implemented fundamental changes in the regulation of the financial services industry in the United States and includes privacy and security requirements for financial institutions, including obligations to protect and safeguard consumers’ nonpublic personal information and records, limitations on the re-disclosure and re-use of such information, and requirements to notify customers and other individuals about their policies and practices relating to their collection and disclosure of such information and their practices relating to protecting the security and confidentiality of that information.
In addition to federal and other financial institution-specific privacy laws and regulations, an increasing number of states are considering and passing comprehensive privacy legislation. The issues surrounding data security and the safeguarding of consumers’ protected information are under increasing regulatory scrutiny by state and federal regulators.
Employees
As of December 31, 2025, we had no employees. We rely on BCPA to provide us with certain management and administrative services. In addition, our senior management team is comprised of substantially the same personnel as the senior management of BCPA. BCPA, together with its affiliates, is a global alternative asset manager focused on private credit, private equity and real estate.
Since November 20, 2018, BCPA, as servicing agent (the “Servicing Agent”), performs (or oversees, or arranges for the performance of) the administrative services necessary for the operation of Mount Logan, including, without limitation, office facilities, equipment, bookkeeping and recordkeeping services and such other services as the Servicing Agent, subject to review by our Board, shall from time to time deem necessary or useful to perform its obligations under the servicing agreement (as amended from time to time, the “Servicing Agreement”). The Servicing Agreement, by its terms, is subject to annual approval by our board of directors. We pay the Servicing Agent an amount equal to our allocable portion of the Servicing Agent’s overhead resulting from its obligations under the Servicing Agreement, including rent and the allocable portion of the cost of our Chief Financial Officer and associated personnel. The Servicing Agent, from time to time, pays amounts owed by us to third-party providers of goods or services, and subsequently reimburse the Servicing Agent for such amounts paid on our behalf at cost.
On November 18, 2025, we and BCPA entered into a Staffing and Resource Agreement (the “Staffing and Resource Agreement” and together with the Servicing Agreement, the “BCPA Arrangements”), pursuant to which certain
15
designated BCPA employees provide services to us. The Staffing and Resource Agreement allows us and BCPA to share personnel for a variety of investment advisory activities. Pursuant to the Staffing and Resource Agreement, BCPA may allocate costs and expenses relating to the Staffing and Resource Agreement as agreed to between us and BCPA. The Staffing and Resource Agreement, by its terms, can be terminated upon sixty (60) days’ prior written notice to the non-terminating party or as otherwise mutually agreed between us and BCPA.
The BCPA Arrangements allow us to leverage BCPA’s infrastructure and scale, including the resources of BCPA’s credit team.
Available Information
Our website is located at www.mountlogancap.com and our investor relations website is ir.mountlogancap.com. Copies of our Annual Reports on Form 10-K, Quarterly Reports on Form 10-Q, Current Reports on Form 8‑K, proxy statements and other information filed or furnished pursuant to Section 13(a) or 15(d) of the Exchange Act, are available free of charge on our investor relations website as soon as reasonably practicable after they are electronically filed with, or furnished to, the SEC. The SEC also maintains a website that contains our SEC filings at www.sec.gov.
We routinely announce material information to investors and the marketplace using filings with the SEC, press releases, public conference calls, presentations, webcasts, and the investor relations page of our website at ir.mountlogan.com and our LinkedIn page. We use these channels for purposes of compliance with Regulation FD and as routine channels for distribution of important information. While not all of the information that we post to the investor relations page of our website or to our LinkedIn page is of a material nature, some information could be deemed to be material. Accordingly, investors should monitor these channels, in addition to following our press releases, SEC filings, and public conference calls and webcasts. Our web addresses are included in this Annual Report on Form 10-K as textual references only and the information posted on these websites are not incorporated by reference in this Annual Report on Form 10-K or in any of our other filings with the SEC.
16
Item 1A. Risk Factors
Investing in our common stock involves a high degree of risk. The risks and uncertainties described below should be carefully considered, together with all of the other information in this Annual Report on Form 10-K, including the section titled “Management’s Discussion and Analysis of Financial Condition and Results of Operations” and our consolidated financial statements and related notes, before making a decision to invest in our common stock. Our business, financial condition, results of operations, or prospects could also be harmed by risks and uncertainties not currently known to us or that we currently do not believe are material. If any of the risks actually occur, our business, financial condition, results of operations, and prospects could be adversely affected. In that event, the market price of our common stock could decline, and you could lose part or all of your investment.
Summary Risk Factors
•A portion of our revenues, earnings and cash flow is highly variable, which may make it difficult for us to achieve steady earnings growth on a quarterly basis and may cause the price of shares of our common stock to be volatile.
•We operate in highly competitive industries, which could limit our ability to achieve our growth strategies.
•We rely on technology and information systems (including those of BCPA through our Servicing Agreement with BCPA), some of which are controlled by third-party vendors, to maintain the security of our information and technology networks and to conduct our businesses.
•Our business, financial condition, results of operations, liquidity and cash flows depend on the accuracy of our management’s assumptions and estimates.
•Some of the funds ML Management manages invest in illiquid assets, and some of the investments of our insurance business are relatively illiquid.
•We rely on the financing markets for the operation of our business.
•There can be no guarantee as to the timing or amount of dividends, and shareholders may not receive dividends.
•We rely on BCPA and key BCPA personnel.
•Our relationship with BCPA will result in significant actual and potential conflicts of interest that could impact our business.
•We, through ML Management, may only manage a limited number of funds and investments.
•Our insurance business is heavily regulated and changes in regulation could reduce our profitability.
•Ability operates in a highly competitive industry that includes a number of companies, many of which are larger and more well-known, which could limit Ability’s capacity to increase or maintain market share and/or margins.
•Ability faces risks associated with business it reinsures and business it cedes to reinsurers.
•Ability is subject to regulatory capital requirements in the United States.
Risks Related to the Business – General
A portion of our revenues, earnings and cash flow is highly variable, which may make it difficult for us to achieve steady earnings growth on a quarterly basis and may cause the price of shares of our common stock to be volatile.
A portion of our revenues, earnings and cash flow is highly variable, primarily due to the nature of the insurance business of our subsidiary, Ability and the fact that fees from our Asset Management segment vary significantly from quarter to quarter and year to year. We may also experience fluctuations in our results from quarter to quarter and year to year due to a number of other factors, including changes in our operating expenses, policyholder behavior, the degree to
17
which we encounter competition and general economic and market conditions. Our future results will also be dependent on the success of the vehicles ML Management manages, changes in the value of which may result in fluctuations in our results. Such variability may lead to volatility in the trading price of shares of our common stock and cause our results for a particular period not to be indicative of our performance in a future period. It may be difficult for us to achieve steady growth in earnings and cash flow on a quarterly basis, which could in turn lead to adverse movements in the price of shares of our common stock or increased volatility in the price of shares of our common stock in general.
We operate in highly competitive industries, which could limit our ability to achieve our growth strategies and could materially and adversely affect our businesses, financial condition, results of operations, cash flows and prospects.
We operate in highly competitive markets and compete with a large number of investment management firms, private credit fund sponsors, U.S. and non-U.S. insurance and reinsurance companies and other financial institutions. In particular, our Asset Management segment faces competition in the pursuit of clients, and our insurance business faces competition with respect to both the products we offer and insurance transactions we pursue. These competitive pressures may have a material and adverse effect on our growth, business, financial condition, results of operations, cash flows and prospects.
We rely on technology and information systems (including those of BCPA through our Servicing Agreement with BCPA), some of which are controlled by third-party vendors, to maintain the security of our information and technology networks and to conduct our business, and any failures or interruptions of these systems could adversely affect our business and results of operations.
We are subject to various risks and costs associated with the collection, handling, storage and transmission of proprietary or confidential information. In the ordinary course of business, we collect and store a range of data, including our proprietary business information and intellectual property, which may include personally identifiable information relating to our insurance business or of our employees, our investors, and other third parties, in data centers and on our or BCPA’s networks, and we rely on technology and information systems in our business activities. We rely on a host of information systems and hardware systems, including those of BCPA and BCPA’s third party vendors, for the secure processing, maintenance and transmission of this information, and the unavailability of these systems or the failure of these systems to perform as anticipated for any reason could disrupt our businesses and could result in decreased performance and increased operating costs, causing our businesses and results of operations to suffer.
There can be no assurance that the various procedures and controls we utilize to mitigate the threat of cyberattacks or other similar incidents will be sufficient to prevent disruptions to our systems, especially because the cyberattack techniques used change frequently and are not recognized until launched, the full scope of a cyberattack may not be realized until an investigation has been performed and cyberattacks can originate from a wide variety of sources. Although we and BCPA take protective measures to prevent and address potential cyberattacks, there can be no assurance that any of these measures will prove effective. The rapid evolution and increasing prevalence of artificial intelligence technologies may also increase our cybersecurity risks.
We rely on BCPA and third-party service providers for certain aspects of our businesses, including for certain information systems and technology. We cannot guarantee that BCPA, third party vendors, service providers and lenders have not been compromised or that they do not contain exploitable defects or bugs that could result in a breach of or disruption to our information technology systems or the BCPA or third-party information technology systems that support our business. Our ability to monitor these third parties’ information security practices is limited, and they may not have adequate information security measures in place. In addition, if BCPA or one of our third-party counterparties suffers a security breach, our response may be limited or more difficult because it may not have direct access to their systems. A disaster, disruption or compromise in technology or infrastructure that supports our businesses, including a disruption involving electronic communications or other services used by us, may have an adverse impact on our ability to continue to operate our businesses without interruption, which could have a material adverse effect on us. These risks could increase due to the increasing use of cloud-based software services. In addition, costs related to data security threats or disruptions may not be fully insured or indemnified by other means.
As new technologies, including tools that harness generative artificial intelligence and other machine learning techniques, rapidly develop and become even more accessible, the use of such new technologies by us, our affiliates and our third party service providers and other vendors will present additional known and unknown risks, including, among others, the risk that confidential information may be stolen, misappropriated or disclosed and the risk that we and/or our third party service providers or other vendors may rely on incorrect, unclear or biased outputs generated by such technologies, any of which could have an adverse impact on us and our business.
18
A significant actual or potential theft, loss, corruption, exposure, fraudulent, unauthorized or accidental use or misuse of personally identifiable or proprietary business data could result in significant remediation and other costs, fines, litigation and regulatory actions against us, in addition to significant reputational harm.
Our business, financial condition, results of operations, liquidity and cash flows will depend on the accuracy of our management’s assumptions and estimates, and we could experience significant gains or losses if these assumptions and estimates differ significantly from actual results.
We make and rely on certain assumptions and estimates regarding many matters related to our businesses, including interest rates, expenses and operating costs, tax assets and liabilities, tax rates, business mix, and contingent liabilities. We also use these assumptions and estimates to make decisions crucial to our business operations. The factors influencing these various assumptions and estimates cannot be calculated or predicted with certainty, and if our assumptions and estimates differ significantly from actual outcomes and results, our business, financial condition, results of operations, liquidity and cash flows may be materially and adversely affected.
Some of the funds ML Management manages invest in illiquid assets, and some of the investments of our insurance business are relatively illiquid. Funds holding such assets and we, as applicable, may fail to realize profits from these assets for a considerable period of time, or lose some or all of the amount that is invested in these assets if such assets are required to be sold at inopportune times or in response to changes in applicable rules and regulations.
Some of the funds ML Management manages invest in securities or other financial instruments that are not publicly traded or are otherwise viewed as “illiquid.” In such cases, there may be limitations by contract or by applicable securities laws on the sale of such securities or financial instruments, such that they can only be sold after a period of time and then only at such times when we will not possess material nonpublic information. In addition, the ability to dispose of private credit investments prior to maturity is generally heavily dependent upon the secondary trading market for such instruments. Such markets may not be available. Accordingly, the funds ML Management manages may be forced, under certain conditions, to sell securities at a loss.
In addition, some investments by Ability, our insurance business, are in securities that are not publicly traded or that otherwise lack liquidity. These relatively illiquid types of investments are recorded at fair value. If a material liquidity demand is triggered and our insurance business is unable to satisfy the demand with the sources of liquidity available to it, our insurance business could be forced to sell certain of its assets and there can be no assurance that it would be able to sell them for the values at which such assets are recorded and it might be forced to sell them at significantly lower prices. In some cases, our insurance business may also be prohibited by contract or applicable securities laws from selling such securities for a period of time. Thus, it may be impossible or costly to liquidate positions rapidly in order to meet unexpected obligations. This potential mismatch between the liquidity of assets and liabilities could have a material and adverse effect on our business, financial condition, results of operations and cash flows.
Further, governmental and regulatory authorities periodically review legislative and regulatory initiatives, and may promulgate new or revised, or adopt changes in the interpretation and enforcement of existing, rules and regulations at any time that may impact our investments. Such changes in regulatory requirements could disrupt market liquidity, make it more difficult for us to operate our business, and cause securities that are not publicly traded to lose value, any of which could have a material and adverse effect on our business, financial condition or results of operations.
We rely on the financing markets for the operation of our business.
We rely on the debt and equity financing markets for the operation of our business. To the extent that debt and equity markets render financing difficult to obtain, refinance or extend, or more expensive, this may have a material and adverse effect on our business, financial condition, results of operations, liquidity and cash flows.
In particular, our insurance business relies on access to lending and debt markets to provide capital and liquidity. Changes in debt financing markets may impact our insurance business’s access to capital and liquidity. Calculations of required insurance capital may move with market movements and result in greater capital needs during economic downturns. Our insurance business may also need additional liquidity to pay insurance liabilities in excess of its assumptions.
The absence of available sources of debt financing for extended periods of time could materially and adversely affect us. In the event that we are unable to obtain debt financing, or can only obtain debt at an increased interest rate or otherwise on unfavorable terms, we may be forced to find alternative sources of financing (including equity), may have difficulty executing our business objectives or may generate profits that are lower than would otherwise be the case, any of which could lead to a decrease in the income earned by us. If we use leverage in the future, shareholders should be aware that investments in leveraged entities are inherently more sensitive to declines in revenues, increases in expenses and
19
interest rates and adverse economic, market and industry developments. As a result, the risk of loss associated with a leveraged entity is generally greater than for companies with comparatively less debt.
We, and particularly our insurance business, may acquire various financial instruments for purposes of “hedging” or reducing its risks, which may be costly and ineffective and could reduce its cash available for distribution to its shareholders.
We, and particularly our insurance business, may seek to hedge against certain risks by using financial instruments such as futures, options, swaps and forward contracts. These financial instruments may be purchased on exchanges or may be individually negotiated and traded in over-the-counter markets. Use of such financial instruments for hedging purposes may present significant risks, including the risk of loss of the amounts invested. Defaults by the other party to a hedging transaction can result in losses in the hedging transaction. Hedging activities also involve the risk of an imperfect correlation between the hedging instrument and the asset being hedged, which could result in losses both on the hedging transaction and on the instrument being hedged. Use of hedging activities may not prevent significant losses and could increase our losses. Further, hedging transactions may reduce cash available to pay distributions to our shareholders.
Difficult political, market or economic conditions may adversely affect our businesses in many ways, which could materially reduce our revenue, net income and cash flow and adversely affect our financial prospects and condition.
Our businesses could be materially affected by conditions in the political environment and financial markets and economic conditions throughout the world, such as changes in interest rates, availability of credit, inflation rates (including persistent inflation), economic uncertainty, changes in laws, changes in governmental policy and regulatory reform, the ongoing Russia-Ukraine conflict, the conflicts in the Middle East, commodity prices, wars, other national and international political circumstances (including terrorist acts or security operations), natural disasters, climate change, pandemics or other severe public health crises and other events outside of our control. Market uncertainty and volatility could also be magnified as a result of the new U.S. administration and resulting uncertainties regarding actual and potential shifts in the U.S. and foreign, trade, economic and other policies, such as tariffs on imports from various countries.
Both domestic and international markets continued to experience significant inflationary pressures in fiscal year 2025 and inflation rates in the United States could continue at elevated levels for the near term. Although the Federal Reserve in the United States and central banks in various other countries have started to cut interest rates as the rate of inflation slowly weakened, they may again raise interest rates in response to concerns about inflation in the future, which, coupled with reduced government spending and volatility in financial markets, may have the effect of further increasing economic uncertainty and heightening these risks. Interest rate increases or other government actions taken to reduce inflation could also result in recessionary pressures in many parts of the world. A recession could have a material and adverse effect on our business, financial condition, results of operations, liquidity and cash flows.
The ongoing conflict between Russia and Ukraine and the conflict in the Middle East have increased global economic and political uncertainty. Furthermore, governments in the United States, U.K., and EU have each imposed export controls on certain products and financial and economic sanctions on certain industry sectors and parties in Russia, and additional controls and sanctions could be enacted in the future. We cannot predict the impact these conflicts may have on the global economy or our business, financial condition and operations in the future. These conflicts may also heighten the impact of other risks described herein.
Volatility caused by political, market or economic conditions can materially hinder business growth and may adversely impact our operating results. Any such volatility may also increase the risk that cash flows generated from operations may differ from expectations in timing or amount. There is also a risk of both sector-specific and broad-based corrections and/or downturns in the equity and/or credit markets. Our profitability may also be adversely affected by our fixed costs and the possibility that we would be unable to scale back other costs, within a time frame sufficient to match any further decreases in net income or increases in net losses relating to changes in market and economic conditions.
Moreover, Ability, our insurance business, is materially affected by conditions in the capital markets and the U.S. economy generally, as well as by the global economy. Actual or perceived stressed conditions, volatility and disruptions in financial asset classes or various capital and credit markets may have an adverse effect on our insurance business, both because such conditions may decrease the returns on, and value of, our investment portfolio and because our liabilities are sensitive to changing market factors.
Changes in laws or regulations governing our operations may adversely affect our business or cause us to alter our business strategy.
We, and particularly our insurance business, are and will be subject to regulation at the municipal, local, state, and federal level, including, in some cases, in both the United States and Canada. New legislation may be enacted, or new
20
interpretations, rulings or regulations could be adopted, including those governing the types of reinsurance products in which Ability deals, any of which could harm us and our shareholders, potentially with retroactive effect.
Additionally, any changes to the laws and regulations governing us or our business activities may cause us to alter our strategy to avail ourselves of new or different opportunities. Such changes could result in material differences to strategies and plans as set forth in this Annual Report on Form 10-K and may result in our business focus shifting to other types of activities in which our management may have less expertise or little or no experience. Thus, any such changes, if they occur, could have a material adverse effect on our financial condition and results of operations.
Any changes in tax regulations or tax reform may have an adverse impact on investors and policyholders.
Tax changes in the United States or Canada could result in adverse effects on our financial results and share price. We cannot predict how changes in tax legislation will affect us or our business (including Ability), but these provisions may in certain circumstances negatively affect our financial condition, results of operations, liquidity and cash flows.
There can be no guarantee as to the timing or amount of dividends, and shareholders may not receive dividends.
Holders of our common stock will not have a right to dividends on such shares unless declared by our board of directors. The declaration of dividends will be at the discretion of our board of directors, even if we have sufficient distributable cash to pay such dividends. The declaration of any dividend will depend on our financial results, cash requirements, future prospects and other factors deemed relevant by our board of directors.
Dividends are not guaranteed, and the amount of any dividend may fluctuate or be reduced or eliminated. There can be no assurance as to the levels of dividends to be paid by us, if any. The market value of our common stock may deteriorate if we are unable to pay dividends and such deterioration may be material.
Holders of our common stock will be entitled to receive only such dividends as our board of directors may declare out of funds legally available for such payments. We are incorporated in Delaware and governed by the Delaware General Corporation Law (“DGCL”). Delaware law allows a corporation to pay dividends only out of surplus, as determined under Delaware law or, if there is no surplus, out of net profits for the fiscal year in which the dividend was declared and/or for the preceding fiscal year. Under Delaware law, however, we will not be able to pay dividends out of net profits if, after we pay the dividend, our capital would be less than the capital represented by the outstanding stock of all classes, if any, having a preference upon the distribution of assets. Our ability to pay dividends will be subject to our future earnings, capital requirements and financial condition, as well as our compliance with covenants related to any indebtedness of Mount Logan or its subsidiaries and would only be declared in the discretion of our board of directors. Additionally, subject to certain limited exceptions, income received by Ability may only be used for the benefit of policyholders, so such proceeds will not be available for the payment of dividends to holders of our common stock.
We will be subject to changes in accounting policies or accounting standards.
From time to time, the Financial Accounting Standards Board (the “FASB”) and the SEC can be expected to change their guidance governing the form and content of our external financial statements. In addition, accounting standard setters and those who interpret accounting principles generally accepted in the United States of America (“U.S. GAAP”), such as the FASB, the SEC and our outside auditors, may change or even reverse their previous interpretations or positions on how these standards should be applied. Such changes are expected to continue. Changes in U.S. GAAP and changes in current interpretations are beyond our control, can be hard to predict and could materially impact how it reports financial results and condition. In certain cases, we could be required to apply a new or revised guidance retroactively or apply existing guidance differently, which may result in restating prior period financial statements for material amounts. Additionally, significant changes to U.S. GAAP may require costly technology changes, additional training and personnel and other expenses that would negatively impact results of operations.
We have and will continue to incur increased costs as a result of operating as a U.S. public company.
As a new U.S. public company, we have and will continue to incur significant legal, accounting, insurance and other expenses. Among other costs, we incur costs associated with our compliance with the reporting requirements of the Exchange Act, the Sarbanes-Oxley Act of 2002 (the “Sarbanes-Oxley Act”) and related rules implemented by the SEC, and the listing standards of Nasdaq. The expenses incurred by U.S. public companies generally for reporting and corporate governance purposes have been increasing. We expect these laws and regulations to increase our legal and financial compliance costs and to make some activities more time-consuming and costly, although we are currently unable to estimate these costs with any degree of certainty. These laws and regulations could also make it more difficult or costly for us to obtain certain types of insurance, including director and officer liability insurance, and we may be forced to accept reduced policy limits and coverage or incur substantially higher costs to obtain the same or similar coverage. These laws
21
and regulations could also make it more difficult for us to attract and retain qualified persons to serve on our Board, our Board committees or as our executive officers. Furthermore, if we are unable to satisfy our obligations as a U.S. public company, it could be subject to delisting of our common stock, fines, sanctions and other regulatory action and potentially civil litigation.
If we fail to maintain an effective system of disclosure controls and internal control over financial reporting, our ability to produce timely and accurate financial statements or comply with applicable regulations could be impaired.
The Sarbanes-Oxley Act requires, among other things, that we maintain effective disclosure controls and procedures and internal control over financial reporting. In addition, pursuant to Section 404 of the Sarbanes-Oxley Act, we are required to perform system and process evaluation and testing of our internal control over financial reporting to allow our management to furnish a report on, among other things, the effectiveness of our internal control over financial reporting.
In order to maintain and improve the effectiveness of our disclosure controls and procedures and internal control over financial reporting, we will expend significant resources, including accounting-related costs and significant management oversight. If any of these new or improved controls and systems do not perform as expected, we may experience deficiencies in our controls.
During the evaluation and testing process of our internal controls, if we identify one or more material weaknesses in our internal control over financial reporting, we will be unable to certify that our internal control over financial reporting is effective. We cannot assure you that there will not be material weaknesses in our internal control over financial reporting in the future, and our testing, or the subsequent testing by our independent public accounting firm, may reveal deficiencies in our internal control over financial reporting that are deemed to be material weaknesses.
Our current controls and any new controls that it develops may become inadequate because of changes in conditions in our business. Further, weaknesses in our disclosure controls and internal control over financial reporting may be discovered in the future. Any failure to develop or maintain effective controls or any difficulties encountered in their implementation or improvement could harm our results of operations or cause us to fail to meet our reporting obligations and may result in a restatement of our financial statements for prior periods. Any failure to implement and maintain effective internal control over financial reporting also could adversely affect the results of periodic management evaluations and annual independent registered public accounting firm attestation reports regarding the effectiveness of our internal control over financial reporting that we are required to include in our periodic reports that will be filed with the SEC. Ineffective disclosure controls and procedures and internal control over financial reporting could also cause investors to lose confidence in our reported financial and other information, which would likely have a negative effect on the trading price of our common stock. In addition, if we are unable to continue to meet these requirements, we may not be able to remain listed on Nasdaq.
If we are unable to assert that our internal control over financial reporting is effective, or if our independent registered public accounting firm is unable to express an opinion on the effectiveness of our internal control over financial reporting at any time when it is required to do so, investors could lose confidence in the reliability of our financial statements, the market price of our common stock could decline and we could be subject to sanctions or investigations by Nasdaq, the SEC or other regulatory authorities. Any failure to maintain effective disclosure controls and internal control over financial reporting could have an adverse effect on our business, results of operations and financial condition and could cause a decline in the market price of our common stock.
We are an emerging growth company and a smaller reporting company within the meaning of the Securities Act, and if we take advantage of certain exemptions from disclosure requirements available to “emerging growth companies” or “smaller reporting companies,” this could make our securities less attractive to investors and may make it more difficult to compare our performance with other public companies.
We are an “emerging growth company” within the meaning of the Securities Act, as modified by the Jumpstart our Business Startups Act of 2012 (“JOBS Act”), and we may take advantage of certain exemptions from various reporting requirements that are applicable to other public companies that are not “emerging growth companies” including, but not limited to, not being required to comply with the auditor attestation requirements of Section 404 of the Sarbanes-Oxley Act, reduced disclosure obligations regarding executive compensation in our periodic reports and proxy statements, and exemptions from the requirements of holding a nonbinding advisory vote on executive compensation and shareholder approval of any golden parachute payments not previously approved. As a result, our shareholders may not have access to certain information they may deem important. We could be an emerging growth company for up to five years, although circumstances could cause us to lose that status earlier, including if the market value of our common stock held by non-affiliates exceeds $700 million as of any June 30 before that time, in which case we would no longer be an emerging growth company as of the following December 31. We cannot predict whether investors will find our securities less
22
attractive because we will rely on these exemptions. If some investors find our securities less attractive as a result of our reliance on these exemptions, the trading prices of our securities may be lower than they otherwise would be, there may be a less active trading market for our securities and the trading prices of our securities may be more volatile.
Further, Section 102(b)(1) of the JOBS Act exempts emerging growth companies from being required to comply with new or revised financial accounting standards until private companies (that is, those that have not had a Securities Act registration statement declared effective or do not have a class of securities registered under the Exchange Act) are required to comply with the new or revised financial accounting standards. The JOBS Act provides that a company can elect to opt out of the extended transition period and comply with the requirements that apply to non-emerging growth companies but any such an election to opt out is irrevocable. We have elected not to opt out of such extended transition period which means that when a standard is issued or revised and it has different application dates for public or private companies, we, as an emerging growth company, can adopt the new or revised standard at the time private companies adopt the new or revised standard. This may make comparison of our financial statements with another public company which is neither an emerging growth company nor an emerging growth company which has opted out of using the extended transition period difficult or impossible because of the potential differences in accounting standards used.
Additionally, we are a “smaller reporting company” as defined in Item 10(f)(1) of Regulation S-K. Smaller reporting companies may take advantage of certain reduced disclosure obligations, including, among other things, providing only two years of audited financial statements, and, if their revenues are less than $100 million, not providing an independent registered public accounting firm attestation on internal control over financial reporting. We will remain a smaller reporting company until the last day of the fiscal year in which (1) the market value of our ordinary shares held by non-affiliates exceeds $250 million as of the prior June 30, or (2) our annual revenues exceeded $100 million during such completed fiscal year and the market value of our ordinary shares held by non-affiliates exceeds $700 million as of the prior June 30. To the extent we take advantage of such reduced disclosure obligations, it may also make comparison of our financial statements with other public companies difficult or impossible.
Any misconduct by Legacy MLC’s or 180 Degree Capital’s former, and our current and future, employees, directors, advisers, third-party service providers or others affiliated with us could harm us by impairing our ability to attract and retain investors and by subjecting us to significant legal liability, regulatory scrutiny and reputational harm.
There is a risk that our current (and Legacy MLC’s and 180 Degree Capital’s former) employees, directors, advisers, third-party service providers or others affiliated with us could engage, including deliberately or recklessly, in misconduct or fraud that creates legal exposure for us and adversely affects our businesses. For example, in October 2025, we discovered that a former employee of ML Management, our SEC-registered investment adviser subsidiary, engaged in misconduct while overseeing two operationally related portfolio companies of a non-core private fund advised by ML Management that has been and is winding down. ML Management ended its relationship with this employee and promptly engaged independent counsel to conduct a thorough investigation, which is ongoing. As of December 31, 2025, we have repaid one portfolio company approximately $0.7 million, inclusive of interest, that the former employee misappropriated from it through illegitimate vendor payments and expense reimbursements. Following completion of the forensic review, we expect to evaluate compensating the fund for certain fees received by ML Management related to the portfolio companies; as of December 31, 2025, we believe these to be at most $1.3 million. We also continue to investigate the former employee’s unauthorized actions regarding the second portfolio company, which impacted assets owned by that portfolio company. We sold the second portfolio company earlier this year and expect to reimburse any excess consideration received. ML Management has also taken actions to preserve the value of the potentially impacted assets and implemented short-term remedial measures, is planning long-term process remediations, and self-reported this matter to the SEC. We continue to assess the potential impact of this matter on our financial condition and results of operations.
If anyone associated or affiliated with us were to engage, or be accused of engaging, in illegal or suspicious activities, harassment, impermissible discrimination, improper use or disclosure of confidential information, fraud, payment or solicitation of bribes, or any other type of similar misconduct or violation of other laws and regulations, we could suffer serious harm to our brand, reputation, be subject to penalties or sanctions, face difficulties in raising funds, suffer serious harm to our financial position and current and future business relationships, as well as face potentially significant litigation or investigations.
Litigation filed against 180 Degree Capital, Legacy MLC and/or Mount Logan in connection with the Business Combination could result in substantial costs.
From time to time, Mount Logan may be subject to legal actions, including securities class action lawsuits and derivative lawsuits, as well as various regulatory, governmental and law enforcement inquiries, investigations and subpoenas in connection with the Business Combination (including any such actions, inquiries, investigations or subpoenas directed to 180 Degree Capital and/or Legacy Mount Logan). These or any similar securities class action lawsuits and
23
derivative lawsuits, regardless of their merits, may result in substantial costs and divert management time and resources. An adverse judgment in such cases could have a negative impact on the liquidity and financial condition of Mount Logan.
Risks related to the Business – Our Relationship with BCPA
We rely on BCPA and Key BCPA Personnel.
The success of Mount Logan, which has a limited number of employees, depends, in large part, upon the skill, expertise and network of relationships of key BCPA personnel to develop and implement strategies that achieve our business objectives, and upon BCPA providing certain administrative and other services to us. Our senior management is comprised of substantially the same personnel as the senior management team of BCPA, and these individuals have significant influence with respect to our business plans and policies. There can be no assurance that any such senior management individuals will continue to be associated with BCPA. The loss or reduction of the services of one or more such persons, including as a result of the death, disability or departure of one or more such persons, or to the extent any such persons do not dedicate sufficient time to us, could have a material and adverse impact on our business or performance. In addition, such BCPA personnel have other responsibilities, including to BCPA, its clients and to other entities and organizations and, therefore, conflicts can be expected to arise in the allocation of investment opportunities and personnel and the management of time, services or functions. The fulfillment of such other responsibilities may not be in our best interests or in the best interest of our stockholders. In addition, BCPA and the BCPA Credit Affiliates are presently, and plan in the future to continue to be, involved with activities that are unrelated to or in direct conflict with ours. As a result of these activities, BCPA, its officers and employees and the BCPA Credit Affiliates will have conflicts of interest in allocating their time between us and other activities in which they are or may become involved, including the management of funds advised by BCPA. The ability of BCPA and such personnel to access other resources for the benefit of Mount Logan may be limited under certain circumstances. In addition, our success will depend to a significant extent on BCPA continuing to provide staffing, services and support to us pursuant to the arrangements described above. BCPA personnel, including our senior management that is shared with BCPA, will devote as much time to us as such individuals deem appropriate but that will not be the entirety of their time dedicated to business activities.
Our relationship with BCPA has and will continue to result in significant actual and potential conflicts of interest that could impact our business.
Our relationship with BCPA has and will continue to result in significant actual and potential conflicts of interests. Addressing conflicts of interests (i) is complex, (ii) may result in us dedicating additional resources, incurring additional costs and implementing more administratively burdensome policies and procedures to address conflicts-related matters and (iii) may require our Board to spend considerable time analyzing and assessing conflicts-related matters. Such actions, together with the use of a special committee of disinterested directors or a board otherwise authorizing the disinterested directors to approve a transaction where actual or potential conflicts are present, may not result in terms that could otherwise be negotiated on an arm’s length basis between unrelated parties. New and different types of conflicts should be expected to arise in the future. BCPA and the BCPA Credit Affiliates engage in a broad range of business activities and have interests directly and indirectly in a wide range of enterprises. Such interests will conflict with and may adversely affect the performance and operations of our business. None of BCPA or the BCPA Credit Affiliates is generally restricted, relative to us, from engaging in any types of activities and accordingly, such activities are expected to compete with us. Moreover, in circumstances where we or a client of one of our subsidiaries is invested alongside any of the foregoing (including BCPA clients), conflicts will arise with respect to such holdings, which may create circumstances where different actions or decisions are made or taken with respect to us or such client of our subsidiary relative to BCPA or the BCPA Credit Affiliates, as the case may be.
BCPA is able to terminate the Staffing and Resource Agreement and Servicing Agreement upon 60 days’ written notice, and we, who have a limited number of employees, may not be able to find a suitable replacement for such services provided under those agreements within that time, resulting in a disruption in our operations, which could adversely affect our financial condition, business or results of operations.
We expect that BCPA will continue to provide us with staffing, administrative and other services that it has historically provided to Legacy Mount Logan. Pursuant to the terms of the Staffing and Resource Agreement and the Servicing Agreement, BCPA has the right to terminate either agreement upon 60 days’ written notice. If BCPA terminates either agreement, it may be difficult to find replacement arrangements providing for similar expertise and the ability to provide the same or equivalent services on acceptable terms within 60 days, or at all. If replacement arrangements are not quickly identified, our business, results of operations and financial condition, together with our ability to pay distributions, are likely to be adversely affected and the value of our common stock may decline. In addition, the coordination of our management and administrative functions are likely to suffer if we are unable to identify and reach an agreement with a single institution having the expertise possessed by BCPA. Even if a comparable service provider or individuals performing such services are retained, their integration into our business and lack of familiarity with our business strategy
24
may result in additional costs and time delays that may materially adversely affect our business, results of operations or financial condition.
The Staffing and Resource Agreement or Servicing Agreement with BCPA may be amended or otherwise modified from time to time, or other similar or alternative arrangements may be entered into with BCPA from time to time, and such amendments, modifications or other arrangements may create different incentives for BCPA than exist today or may otherwise create additional conflicts of interest.
In the future, we and our subsidiaries may, from time to time, (i) agree to amend, modify, supplement or otherwise change the Staffing and Resource Agreement, Servicing Agreement or aspects of such agreements, and (ii) may otherwise agree to enter into additional, alternative or similar arrangements with BCPA. Such amendments are expected to be agreed to and implemented in the near future. Such amendments, modifications, supplements or other changes to the Staffing and Resource Agreement or Servicing Agreement, or any such additional, alternative or similar arrangements with BCPA may create different incentives for BCPA than exist today or may otherwise create additional conflicts of interest. For example, if we agree to compensate BCPA on metrics tied to our assets or performance, BCPA and its personnel may be influenced by such arrangements and may be incentivized to undertake activities on behalf of us that are riskier or more speculative than would be the case in the absence of such compensation arrangements, which may materially adversely affect our business, results of operations or financial condition.
BCPA’s liability is limited under the Servicing Agreement and Staffing and Resource Agreement, and we are required to indemnify BCPA against certain liabilities, which may lead BCPA to act in a riskier manner on our behalf than it would when acting for our own account.
Under the terms of the Staffing Agreement and the Servicing and Resource Agreement, BCPA will not assume any responsibility to us other than to render the services described in such agreements. Pursuant to the terms of such agreements, BCPA and its officers, managers, partners, agents, employees, controlling persons, members and any other person or entity affiliated with BCPA will not be liable to us for their acts under such agreements, absent criminal conduct, willful misfeasance, bad faith or gross negligence in the performance of their duties or by reason of the reckless disregard of their duties and obligations. We have agreed to indemnify, defend and protect BCPA and its officers, managers, partners, agents, employees, controlling persons, members and any other person or entity affiliated with BCPA with respect to all damages, liabilities, costs and expenses arising out of or otherwise based upon the performance of any of BCPA’s duties or obligations under such agreements, and not arising out of criminal conduct, willful misfeasance, bad faith or gross negligence in the performance of their duties or by reason of the reckless disregard of their duties and obligations under such agreements. These protections may lead BCPA to act in a riskier manner when acting on our behalf than it would when acting for its own account.
Our financial condition and results of operations depend in large part on BCPA’s ability to effectively support our business.
Our ability to succeed in the future will depend on BCPA’s ability to effectively support our business, which depends, in turn, on BCPA’s ability to dedicate sufficient time and resources to us. Accomplishing execution of our business objectives on a cost-effective basis will depend in large part on BCPA’s ability to provide competent, attentive and efficient services and access to business opportunities through BCPA’s relationships. Even if we are able to grow, any failure to manage that growth effectively could have a material and adverse effect on our business, financial condition, results of operations and prospects. The results of our operations depend on many factors, including the availability of business opportunities, readily accessible funding alternatives in the financial markets and economic conditions. A number of entities compete with BCPA for business opportunities and some of those competitors are substantially larger and have considerably greater resources. In addition, we compete with other entities that are managed by BCPA or the BCPA Credit Affiliates or in which BCPA or the BCPA Credit Affiliates have an interest. These competitive pressures could have a material and adverse effect on Mount Logan’s business, financial condition or prospects. As a result of this competition, Mount Logan can provide no assurance that it will be able to take advantage of attractive business opportunities that may arise from time to time.
Because our business model depends upon relationships with various counterparties, the inability of BCPA to maintain or develop these relationships, or the failure of these relationships to generate business opportunities, could adversely affect our business.
If BCPA fails to maintain its existing relationships, or develop new relationships, on which we rely, to generate business opportunities, we may not be able to grow and its business could be materially and adversely impacted. In addition, entities and individuals with whom BCPA has relationships generally are not obligated to provide BCPA with business opportunities and, therefore, there is no assurance that such relationships will generate business opportunities for us.
25
Risks Related to the Business – Asset Management
The asset management business is competitive.
The asset management business is competitive, with competition based on a variety of factors, including investment performance, business relationships, quality of service provided to clients, client liquidity and willingness to invest, fund terms (including fees), brand recognition and business reputation. We, through ML Management, compete for prospective clients with a number of other asset managers, public and private funds, business development companies, interval funds and others. Numerous factors increase ML Management’s competitive risks, including:
•a number of ML Management competitors have greater financial, technical, marketing and other resources and more personnel than ML Management does;
•several of ML Management’s competitors have raised significant amounts of capital, and many of them have similar investment objectives to those of ML Management, which may create additional competition for prospective clients and investment opportunities;
•some of ML Management’s competitors may have a lower cost of capital and access to funding sources that are not expected to be available to ML Management, which may create competitive disadvantages for ML Management;
•some of ML Management’s competitors may be subject to less regulation and, accordingly, may have more flexibility to undertake and execute certain business or investments than ML Management does and/or bear less compliance expense than ML Management does;
•some of ML Management’s competitors may have better expertise or be regarded by prospective clients as having better expertise in a specific asset class or geographic region than ML Management does; and
•other industry participants may, from time to time, seek to recruit its investment professionals and other employees away from ML Management.
In addition, current or prospective clients of ML Management may negotiate for lower fees or more limited reimbursement requirements relating to expenses. Such economic terms may be less favorable, reducing ML Management’s financial opportunity from any such asset management activities.
These and other competitive pressures could adversely affect ML Management, which in turn may adversely impact our business, results of operations and financial condition.
Additionally, BCPA or the BCPA Credit Affiliates may establish one or more other asset management businesses, which may be competitive with ML Management and would lead to additional conflicts of interest. For example, individuals providing services to ML Management would likely be expected to provide similar services for any such new asset management business as well, and would face conflicts of interest in allocating time to the activities of ML Management and any such new asset management business.
We may experience a decline in revenue associated with our Asset Management segment for a variety of reasons.
Our Asset Management segment derives revenues from fees generated from advisory and other services such business provides.
Certain fees that ML Management may earn, such as origination, arranger, structuring and other similar fees, are driven in part by the pace at which ML Management sources investment opportunities. Any decline in such pace would reduce ML Management’s fee income from such sources. Likewise, any increase in the pace at which the clients ML Management manages exit investments would reduce origination, arranger, structuring and other similar fees to the extent additional investment opportunities are not available to re-deploy all or a portion of the proceeds. Mount Logan’s ability to maintain or grow these services, and the related fees ML Management earns therefrom, will depend on a number of factors, some of which are outside Mount Logan’s control, including conditions in the debt, equity or merger markets.
In addition, with respect to any clients that are funds regulated under the 1940 Act, each such fund’s investment management agreement must generally be re-approved annually by such fund’s board of directors or by the vote of a majority of the stockholders and the majority of the independent members of such fund’s board of directors. Moreover, as required by the 1940 Act, these contracts are terminable without penalty upon 60 days’ written notice. Because we, through
26
ML Management, receive management fees and other revenue from investment advisory agreements that are subject to the foregoing requirements, there can be no assurance that such agreements will remain in place, which could result in a loss of revenue.
Contemplated mergers, acquisitions, or consolidations involving funds with which we or our affiliates have servicing or other investment advisory agreements may in the future lead to non-renewal or termination of such agreements, which would adversely affect our revenues. The contemplated merger between BC Partners Lending Corporation (“BCPL”) and ACIF could result in the termination or non‑renewal of our servicing agreement with SCIM over ACIF under which we, through ML Management, may indirectly receive fees. However, to date, we have not received, and have only incurred, fees in connection with such servicing agreement. For more information, see Note 27. Subsequent events in our consolidated financial statements.
If a client of ML Management performs poorly, ML Management may receive little or no performance fees, if applicable. In addition, poor performance may result in lower assets under management and a corresponding reduction in fee-related revenue. With respect to any private fund clients, if as a result of poor performance of later investments in a such a fund’s life, that fund does not achieve investment returns that exceed a specified return threshold for the life of the fund, ML Management could be obligated to repay the amount by which performance fees that were previously distributed to ML Management exceed amounts to which ML Management is ultimately entitled.
We, through ML Management, receive collateral management fees pursuant to collateral management agreements for acting as the collateral manager of certain collateralized loan obligations (“CLOs”). If all the notes issued by one of the CLOs are redeemed, or if the collateral management agreement is otherwise terminated, ML Management will no longer receive collateral management fees from that CLO. In general, a collateral management agreement may be terminated both with and without cause at the direction of holders of a specified supermajority in principal amount of the notes issued by the CLO. Furthermore, such fees are based on the total amount of assets held by the CLO. If the assets held by the CLO are prepaid or go into default, ML Management will receive lower collateral management fees than expected or the collateral management fees may be eliminated. In addition, collateral management agreements typically provide that if certain over-collateralization tests are failed, the collateral management agreement may be terminated by a vote of the security holders, which would result in ML Management’s loss of management fees from these CLOs.
In each instance, a decrease in the fees received by ML Management from its asset management activities will lead to a decrease in revenues and may have a materially adverse impact on our business and results of operations.
The historical performance of Legacy Mount Logan’s asset management business should not be considered indicative of our future performance, which may vary considerably from historical performance.
We may be subject to focus by certain current or prospective clients or other stakeholders on environmental, social and governance matters.
Certain current or prospective clients, regulators and other stakeholders are increasingly focused on sustainability matters, such as climate change and environmental stewardship, human rights, support for local communities, corporate governance and transparency, or other environmental- or social-related areas. Certain stakeholder groups have increased their activism and scrutiny of asset managers’ approaches to considering sustainability matters as part of their investment management decision making. Moreover, a growing number of states having enacted or proposed policies or legislation or have engaged in related litigation regarding sustainability matters. Increased focus and activism related to sustainability matters may constrain our asset management-related business opportunities or otherwise negatively impact our prospects or results of operations.
Growing interest on the part of various stakeholders, including regulators, in sustainability factors and increased demand for, and scrutiny of, asset managers’ sustainability-related disclosure, have also increased the risk that asset managers could be perceived as, or accused of, making inaccurate or misleading statements regarding these matters. The occurrence of any of the foregoing could have a material and adverse impact on our business and could lead to inquiries, investigations, or lawsuits.
Additionally, our business could be adversely affected if it fails to comply with applicable sustainability regulations. If regulators enact new rules, it may materially and adversely affect us in various ways, including the incurrence of significant compliance costs and an increase in the risk of litigation and regulatory action.
Valuations for illiquid assets under management entail significant complications.
The value of any illiquid investments held by entities ML Management manages will generally be based on estimates of fair value as of the date of determination based on third-party valuations or models, or, in some cases, models
27
developed by us. Because these valuations are inherently uncertain, they may fluctuate greatly from period to period. Also, they may vary greatly from the prices that would be obtained if the assets were to be liquidated on the date of the valuation. In addition, if any such illiquid investments are in industries or sectors that are unstable, in distress, or undergoing some uncertainty, such investments will be subject to rapid changes in value caused by sudden company-specific or industry-wide developments.
If realized values are significantly lower than the estimated value, there could be a decline in ML Management’s management fees (particularly expected performance fees, if any). If actual asset values turn out to be materially different compared to those determined by the valuations described above, clients could lose confidence in ML Management which could, in turn, negatively impact our business, operations and financial results.
We, through ML Management, may only manage a limited number of funds and investments.
We, through ML Management, may only manage a limited number of funds or products, and each fund or product may participate in a limited number of investments. Such investments may be concentrated within relatively few industries, sectors, countries or regions. Such investments may be exposed to one or more common or systemic risks as result. The performance of our Asset Management segment may be negatively affected by the unfavorable performance of a limited subset of funds or products or a small group or type of investments. Any such unfavorable performance may have a material adverse effect on our business, operations and financial results.
Risks Related to the Business – Insurance
Our insurance business is heavily regulated and changes in regulation could reduce our profitability.
Our insurance and reinsurance subsidiary is Ability, which is highly regulated by insurance regulators in the United States and changes in regulations affecting the Ability’s insurance business may reduce our profitability and limit our growth. Ability operates in 42 U.S. states and the District of Columbia. The insurance and reinsurance industry are generally heavily regulated and Ability’s operations in each of these jurisdictions are subject to varying degrees of regulation and supervision. The laws and regulations of the jurisdictions in which Ability operates may require Ability to, among other things, maintain minimum levels of statutory capital, surplus and liquidity, meet solvency standards, submit to periodic examinations of its financial condition, and restrict payments of dividends and distributions of capital. Ability is also subject to laws and regulations that may restrict its ability to write insurance and reinsurance policies, make certain types of investments and distribute funds. With respect to investments, Ability must comply with applicable regulations regarding the type and concentration of investments it may make. These restrictions are set forth in investment guidelines that ML Management must comply with when providing investment management to Ability. These restrictions may limit Ability’s capacity to invest and ML Management’s ability to earn fees on those investments. In addition, Ability is subject to laws and regulations governing affiliate transactions. The investment management agreement between ML Management and Ability was approved by applicable insurance regulators, and any changes of such agreement, including with respect to fees, must receive applicable approval.
In connection with the conduct of Ability’s insurance and reinsurance business, it is crucial that Ability establish and maintain good working relationships with the various regulatory authorities having jurisdiction over its business. If those relationships and that reputation were to deteriorate, Ability’s business could be materially adversely affected. For example, Ability requires various consents and approvals from its regulators, both with respect to transactions Ability enters into and in the ordinary course of the conduct of its business. If Ability fails to maintain good working relationships with its regulators, it may become more difficult or impossible for Ability to obtain those consents and approvals, either on a timely basis or at all.
Regulations applicable to Ability and interpretations and enforcement of such regulations may change. Insurance regulators have increased their scrutiny of the insurance regulatory framework in the United States. Ability is unable to predict whether, when or in what form legislators will enact legislative and regulatory changes, and Ability cannot provide any assurances that more stringent restrictions will not be adopted from time to time in jurisdictions in which Ability conducts business.
The cost of compliance with existing laws and regulations is high and the cost of compliance with any new regulatory requirements could have a significant and negative effect on Ability’s business. Ability may not be able to comply fully with, or obtain desired exemptions from, any such new laws and regulations that govern the conduct of Ability’s business. Failure to comply with, or to obtain desired authorizations and/or exemptions under, any applicable laws could result in restrictions on Ability’s capacity to do business or undertake activities that are regulated in one or more of the jurisdictions in which Ability operates, could impact Ability’s potential growth and could subject Ability to fines and other sanctions. In addition, changes in the laws or regulations to which Ability is subject, or in the interpretations thereof
28
by enforcement or regulatory agencies, could have a material adverse effect on Ability’s business, results of operations and financial condition.
Ability operates in a highly competitive industry that includes a number of companies, many of which are larger and more well-known, which could limit Ability’s capacity to increase or maintain market share and/or margins.
Ability operates in highly competitive markets and competes with large and small industry participants. Ability faces intense competition, based upon price, terms and conditions, relationships with distribution partners and other clients, quality of service, capital and perceived financial strength (including independent rating agencies’ ratings), technology, innovation, ease of use, capacity, product breadth, reputation and experience, brand recognition and claims processing.
Ability’s competitors include other insurers, reinsurers and other financial institutions that offer investment products. Many of Ability’s competitors are large and well-established, and some have greater market share or breadth of distribution, assume a greater level of risk while maintaining financial strength ratings, or have higher financial strength, claims-paying or credit ratings than Ability does or benefit, by offering various lines of insurance, from diversification of risks and possible positive impacts on capital requirements.
Ability’s competitors may also have lower operating costs than Ability, which may allow them to price insurance products, reinsurance solutions or acquisitions more competitively. Furthermore, Ability may face greater operational complexity when compared to competitors who offer a more limited range of products due to the breadth of Ability’s product offering.
The reinsurance industry is highly competitive, and Ability encounters significant competition in all lines of business from other reinsurance companies, as well as competition from other providers of financial services. Ability’s competitors vary by geographic market, and many of Ability’s competitors have greater financial resources than Ability does. Ability’s capacity to compete depends on, among other things, pricing and other terms and conditions of reinsurance agreements, Ability’s capacity to maintain strong financial strength ratings, and Ability’s service and experience in the types of business that Ability underwrites.
The insurance and reinsurance industries are subject to ongoing changes from market pressures brought about by customer demands, changes in law, changes in economic conditions such as interest rates and investment performance, technological innovation, marketing practices and new providers of insurance and reinsurance solutions. Failure to anticipate market trends or to differentiate Ability’s products and services may affect Ability’s capacity to grow or maintain its current position in the industry. A failure by the insurance industry to meet evolving consumer demands, including demands to address disparate impacts that may exist against certain groups in insurers’ underwriting and sales models, could adversely affect the insurance industry and Ability’s operating results. Similarly, Ability’s failure to meet the changing demands of its insurance company clients through innovative product development, effective distribution channels and investments in technology could negatively impact its financial performance over the long-term. Additionally, Ability’s failure to adjust its strategies in response to changing economic conditions could impact its competitive position and have a material adverse effect on its business, financial condition and results of operations.
Because of the highly competitive nature of the insurance industry, there can be no assurance that Ability will maintain or grow its market share, continue to identify attractive opportunities in either the individual or institutional markets, or that competitive pressure will not have a material adverse effect on Ability’s business, results of operations and financial condition.
Additionally, BCPA and certain of the BCPA Credit Affiliates have established a separate Cayman-domiciled reinsurance business, which competes with Ability and will lead to additional conflicts of interest. For example, individuals providing services to Ability will provide similar services for such new reinsurance business as well, and will face conflicts of interest in allocating time to the activities of Ability and such new reinsurance business. In addition, there may be times when Ability cedes certain insurance products to, or otherwise engages in transactions with, such new reinsurance business, which may result in, among other things, a reduction in Ability’s assets and a related reduction in fee income earned by ML Management and a corresponding increase in such new reinsurance business’ assets and a related increase in fee income earned by BCPA.
Differences between Ability’s policyholder behavior estimates, reserve assumptions and actual claims experience, in particular with respect to the timing and magnitude of claims and surrenders, may adversely affect Ability’s results of operations or financial condition.
Ability holds reserves to pay future policy benefits and claims. Ability’s reserves are estimated based on data and models that include many assumptions and projections, which are inherently uncertain and involve significant judgment,
29
including assumptions as to the levels and/or timing of receipt or payment of premiums, benefits, claims, expenses, interest credits, investment results (including equity and other market returns), mortality, morbidity, longevity and persistency.
While Ability periodically reviews the adequacy of its reserves and the assumptions underlying those reserves, Ability cannot determine with precision the amounts that Ability will pay for, or the timing of payment of, actual benefits, claims and expenses or whether the assets supporting policy liabilities, together with future premiums, will grow to the level assumed prior to the payment of benefits or claims. For Ability’s reinsurance of fixed-rate annuities, reserves are equal to policyholder account balances before applicable surrender charges, and lapse, surrender rates and persistency assumptions are important assumptions used in calculating these reserves and drivers of profitability with respect to these products. Advances in technology, including predictive medical technology that enables consumers to select products better matched to their individual longevity or mortality risk profile and other medical breakthroughs that extend lives, could cause Ability’s future experience to deviate significantly from actuarial assumptions, which could significantly impact the level of reserves and profitability. The resulting acceleration of expense amortization, reduced spread or increased payments could have a material adverse effect on Ability’s business, financial condition and results of operations.
If actual experience differs significantly from assumptions or estimates, certain balances included in Ability’s balance sheet may not be adequate, particularly deferred acquisition costs, policy reserves and other actuarial balances. If Ability concludes that its reserves, together with future premiums, are insufficient to cover future policy benefits and claims, Ability would be required to increase its reserves and incur income statement charges for the period in which it makes the determination, which could have a material adverse effect on Ability’s business, financial condition and results of operations. An increase in the statutory reserves of Ability may negatively affect liquidity and capitalization.
Estimates used in the preparation of financial statements and models for insurance products may differ materially from actual experience.
U.S. GAAP requires the application of accounting guidance and policies that often involve a significant degree of judgment when accounting for insurance products. These estimates include, but are not limited to, premium persistency, future policy benefits and related expenses, valuation of embedded derivatives, valuation and impairment of investments and amortization of deferred revenues and expenses, and the valuation and impairment of goodwill recognized in accordance with the acquisition of Ability. These accounting estimates require the use of assumptions, some of which are highly uncertain at the time of estimation. These estimates are based on judgment, current facts and circumstances and, when applicable, internally developed models. Therefore, actual results could differ from these estimates, possibly in the near term. Inaccuracies could result in, among other things, an increase in policyholder benefit reserves or acceleration of the amortization of deferred revenues and expenses, which would result in a charge to earnings, a restatement of Ability’s historical financial statements or other material adjustments. Additionally, the potential for unforeseen developments, including changes in laws, regulations or accounting standards, may result in losses and loss expenses materially different from the reserves initially established.
In addition, Ability employs models to price products, calculate reserves and value assets, as well as evaluate risk and determine capital requirements, among other uses. These models rely on estimates and projections that are inherently uncertain, may use incomplete, outdated or incorrect data or assumptions and may not operate properly. As Ability’s business continues to expand and evolve, the number and complexity of models it employs has grown, increasing exposure to error in the design, implementation or use of models, including the associated data input, controls and assumptions, and the controls in place to mitigate their risk may not be effective in all cases.
Ability’s historical growth rates may not be indicative of its future growth, and Ability may not be able to identify attractive insurance markets, reinsurance opportunities or investments with returns that are as favorable as Ability’s historical returns and grow new business volumes at historical levels.
Ability’s historical growth rates may not reflect its future growth rates. While Ability anticipates that it will continue to grow by deepening existing and adding new distribution relationships in Ability’s individual market, pursuing attractive reinsurance opportunities and expanding its funding agreement business in the institutional market, taking advantage of investment opportunities to support Ability’s growth, developing new products and entering new markets, Ability may not be able to identify opportunities to do so. With future growth, there can be no guarantee that Ability’s net underwriting return will be as favorable as its historic returns. Weaker margins may challenge Ability’s capacity to grow profitably or at the returns targeted. Further, in order to maintain or increase investment returns, it may be necessary to expand the scope of Ability’s investing activities to asset classes in which Ability historically has not invested, which may increase the risk of Ability’s investment portfolio. If Ability is unable to find profitable growth opportunities, it will be more difficult for Ability to continue to grow, and could negatively affect its results of operations and financial condition.
Interest rate fluctuations could negatively affect the income Ability derives from the difference between the interest rates it earns on its investments and interest it pays under its reinsurance contracts.
30
Significant changes in interest rates expose reinsurance companies to the risk of reduced investment income or actual losses based on the difference between the interest rates earned on investments and the credited interest rates paid on outstanding reinsurance contracts. Both rising and declining interest rates can negatively affect the income Ability derives from these interest rate spreads. During periods of rising interest rates, Ability may be contractually obligated to reimburse its clients for the greater amounts they credit on certain interest-sensitive products. However, Ability may not have the ability to immediately acquire investments with interest rates sufficient to offset the increased crediting rates on its reinsurance contracts. During periods of falling interest rates, Ability’s investment earnings will be lower because new investments in fixed maturity securities will likely bear lower interest rates. Ability may not be able to fully offset the decline in investment earnings with lower crediting rates on underlying annuity products related to certain of its reinsurance contracts. Ability’s asset/liability management programs and procedures may not reduce the volatility of its income when interest rates are rising or falling, and thus Ability cannot assure you that changes in interest rates will not affect its interest rate spreads. Changes in interest rates may also affect Ability’s business in other ways. Higher interest rates may result in increased surrenders on interest-based products of Ability’s clients, which may affect its fees and earnings on those products. Lower interest rates may result in lower sales of certain insurance and investment products of Ability’s clients, which would reduce the demand for its reinsurance of these products. If interest rates remain low for an extended period, it may adversely affect Ability’s cash flows, financial condition and results of operations.
Ability faces risks associated with business it reinsures and business it cedes to reinsurers and which could cause a material adverse effect on Ability’s business, results of operations and financial condition.
As part of Ability’s overall risk management strategy, it cedes business to other insurance companies through reinsurance. Ability’s inability to collect from its reinsurers (including reinsurance clients in transactions where Ability reinsures business net of ceded reinsurance) on its reinsurance claims could have a material adverse effect on Ability’s business, results of operations and financial condition. Although reinsurers are liable to Ability to the extent of the reinsurance coverage it acquires, Ability remains primarily liable as the direct insurer on all risks that it writes; therefore, Ability’s reinsurance agreements do not eliminate its obligation to pay claims. As a result, Ability is subject to the risk that it may not recover amounts due from reinsurers. The risk could arise primarily in two situations: (i) Ability’s reinsurers may dispute some of its reinsurance claims based on contract terms, and, as a result, Ability may receive partial or no payment; or (ii) Ability’s reinsurers may default on their obligations. While Ability may manage these risks through transaction-related diligence, contract terms, collateral requirements, hedging, and other oversight mechanisms, Ability’s efforts may not be successful. A reinsurer’s insolvency, or its inability or unwillingness to make payments due to Ability under the terms of the relevant reinsurance agreements, could have a material adverse effect on Ability’s business, results of operations and financial condition.
Ability also bears the risk that the companies that reinsure its mortality risk on a yearly renewable term, where the reinsurer may reset the premium and other terms each year, increase the premiums they charge to levels Ability deems unacceptable. If that occurs, Ability will either need to pay such increased premiums, which will affect margins and financial results, or alternatively, Ability will need to limit or potentially terminate reinsurance, which will increase the risks that Ability retains.
Conversely, Ability assumes liabilities from other insurance companies. Changes in the ratings, creditworthiness or market perception of such ceding companies or in the administration of policies reinsured to Ability could cause policyholders of contracts reinsured to Ability to surrender or lapse their policies in unexpected amounts. In addition, to the extent such ceding companies do not perform their obligations under the relevant reinsurance agreements, Ability may not achieve the results intended and could suffer unexpected losses. In either case, Ability has exposure to reinsurance clients, which could materially and adversely affect Ability’s business, financial condition, results of operations and cash flows.
The determination of the amount of impairments and allowances for credit losses recognized on Ability’s investments is highly subjective and could materially affect its results of operations or financial condition.
The determination of the amount of impairments and allowances for credit losses is based upon Ability’s periodic evaluation and assessment of known and inherent risks associated with the respective asset class and the specific investment being reviewed. Such evaluations and assessments are revised as conditions change and new information becomes available. Management updates its evaluations regularly and reflects changes in allowances and impairments in its financial results as such evaluations are revised. Impairments result in a non-cash charge to earnings during the period in which the impairment charge is taken. Changes in allowances for credit losses can result in either a charge or credit to earnings.
For example, an allowance is recognized on Ability’s fixed maturity securities when the fair value of the security is less than its amortized cost basis and credit related losses are deemed to have occurred. The determination of the allowance requires assessment of the security’s expected future cash flows, which depend on a variety of macroeconomic
31
factors and security-specific considerations. Similarly, the determination of the allowance on Ability’s mortgage and other loan receivables requires an assessment of expected credit losses that considers current, historical and forecasted macroeconomic data and loan-specific factors. As expectations change based on macroeconomic data and individual investment considerations, the associated allowance for credit losses can be adjusted, up or down.
There can be no assurance that management has accurately determined the amount of impairments and allowances for credit losses recognized in our financial statements and their potential impact on regulatory capital. Furthermore, additional impairments and allowance provisions may be taken in the future.
Ability’s liabilities for insurance products may prove to be inadequate, requiring Ability to increase liabilities which results in reduced net income and shareholders’ equity.
Liabilities for insurance products are calculated based on numerous assumptions including, but not limited to, investment yields, mortality, morbidity, withdrawals, lapses, cash flow assumptions and discount rates. Such assumptions are based on Ability’s experience, and in cases of limited experience, industry experience. Such assumptions also consider future expectations in policyholder behavior that may vary from past experience.
Many factors can affect these reserves and liabilities, such as economic and social conditions, inflation, hospital and pharmaceutical costs, changes in life expectancy, regulatory actions, changes in doctrines of legal liability and extra-contractual damage awards. Therefore, the reserves and liabilities Ability establishes are necessarily based on estimates, assumptions, industry data and prior years’ statistics. Ability’s financial performance depends significantly upon the extent to which Ability’s actual claims experience and future expenses are consistent with the assumptions Ability used in setting its reserves. If Ability’s future claims are higher than its assumptions, and Ability’s reserves prove to be insufficient to cover Ability’s actual losses and expenses, Ability would be required to increase Ability’s liabilities, and this could have a material adverse effect on Ability’s results of operations and financial condition.
Ability is subject to regulatory capital requirements in the United States.
Ability’s business is subject to external capital requirements in the United States, as required by Nebraska statute. Regulatory capital requirements for Ability are determined in accordance with guidelines issued by the National Association of Insurance Commissioners (“NAIC”). The RBC requirement is a statutory minimum level of capital that is based on two factors: an insurance company’s size, and the inherent riskiness of its financial assets and operations. That is, Ability must hold capital in proportion to its risk. Under those requirements, the amount of statutory capital and surplus maintained by an insurance company is to be determined based on the various risk factors related to it. The minimum RBC ratio for Ability is 200% and Ability must have a ratio in excess of 300% to be able to write new business. Ability’s RBC ratio is tested annually at the end of Ability’s financial year and was in excess of the minimum requirement as of December 31, 2025. From time to time during a particular financial year, Ability may take steps to increase its RBC ratio to ensure it remains above the minimum requirement or exceeds the ratio required to write new business, which steps may include, among other things, securing additional funding. Failure to meet or exceed the regulatory capital requirements issued by NAIC could significantly limit Ability’s ability to write new business.
Ability faces risks associated with credit.
The assets and other debt securities in which Ability invests, including mortgage loans, are subject to credit and liquidity risk. Any loan investment may become a defaulted obligation for a variety of reasons, including non-payment of principal or interest, as well as covenant violations by the borrower in respect of the underlying loan documents. A defaulted loan may become subject to either substantial workout negotiations or restructuring, which may entail, among other things, a substantial reduction in the interest rate, a substantial write-down of principal, and a substantial change in the terms, conditions and covenants with respect to such defaulted loan. In addition, such negotiations or restructuring may be extensive and protracted over time, and therefore may result in substantial uncertainty with respect to the ultimate recovery on such defaulted loan. In addition, substantial costs in such situations may be imposed on Ability, further affecting the value of the investment. The liquidity in defaulted loans may also be limited, and to the extent that defaulted loans are sold, it is highly unlikely that the proceeds from such sale will be equal to the amount of unpaid principal and interest thereon, which would adversely affect our financial condition and consequently, the market value of shares of our Common Stock.
Ability faces due diligence risks.
The due diligence process undertaken by Ability in connection with investments that it expects to make or wishes to make may not reveal all relevant facts in connection with an investment. Before making investments, Ability conducts due diligence investigations that it deems reasonable and appropriate based on the facts and circumstances applicable to each investment. When conducting due diligence investigations, Ability may be required to evaluate important and
32
complex business, financial, tax, accounting, environmental and legal issues. Outside consultants, legal advisors, accountants and investment banks may be involved in the due diligence process in varying degrees depending on the type of investment. Nevertheless, when conducting due diligence investigations and making an assessment regarding an investment, Ability relies on resources available, including information provided by the target of the investment and, in some circumstances, third party investigations. The due diligence investigations that are carried out with respect to any investment opportunity may not reveal or highlight all relevant facts that may be necessary.
Ability faces risks from borrower clients.
Each borrower client is also subject to risks which affect its financial condition. As Ability is not privy to all aspects of its clients’ businesses, it is impossible to predict exactly what risks borrowers will face. Nonetheless, typical risks include the following: (i) the success of Ability’s borrowers may depend on the management talents and efforts of certain key persons or a small group of persons. The death, disability or resignation of one or more of these persons could have a material adverse effect on a borrower; (ii) borrowers may require additional working capital to carry out their business activities and to expand their businesses. If such working capital is not available, or is not available on beneficial terms, the financial performance and development of the businesses of the borrowers may be adversely affected; (iii) damage to the reputation of the borrowers’ brands could negatively impact consumer opinion of those businesses or their related products and services, which could have an adverse effect on their business; (iv) borrowers may face competition, including competition from companies with greater financial or other resources, more extensive development, manufacturing, marketing, and other capabilities. There can be no assurance that Ability’s borrower clients will be able to successfully compete against their competitors or that such competition will not have a material adverse effect on their businesses; (v) borrowers may experience reduced revenues from the loss of one or more customers representing a high percentage of their revenues; (vi) borrowers may experience reduced revenues due to an inability to meet regulatory requirements, or may experience losses of revenues due to unforeseeable changes in regulations imposed by various levels of government; (vii) borrowers may rely on government or other subsidy programs for revenue or profit generation, and changes to or elimination of such programs may have an adverse effect on the borrower; and (viii) borrowers may derive some of their revenues from foreign sources and may experience negative financial results based on foreign exchange losses, hedging costs or foreign investment restrictions.
Ability faces risks from prepayments by borrower clients.
Certain of Ability’s investments may be prepayable by the borrowers, subject to prepayment penalties. Ability is unable to predict if or when a borrower will make a prepayment. Typically, a borrower’s decision to prepay depends on its continued positive economic performance and the existence of favorable financing market conditions that permit the borrower to replace its existing financing with less expensive capital. As market conditions change frequently, it is difficult to predict if or when a borrower may deem market and business conditions to be favorable for prepayment. Prepayment by a borrower may have the effect of reducing the achievable yield of the loan to a level below that which was anticipated by Ability. Such a reduction may occur when Ability is unable to invest the funds prepaid by the borrower in other transactions with an expected yield greater than or equal to the yield Ability expected to receive from the prepaying borrower.
Ability faces risk of default by and bankruptcy of a borrower client.
A borrower’s failure to satisfy its borrowing obligations, including any covenants imposed by Ability, could lead to defaults and the termination of the borrower’s loans and enforcement against its assets. In order to protect and recover its investments, Ability may be required to bear significant expenses (including legal, accounting, valuation and transaction expenses) to the extent necessary to seek recovery upon default or to negotiate new terms with a defaulting borrower. In certain circumstances, a borrower’s default under one loan could also trigger cross-defaults under other agreements and jeopardize that borrower’s ability to meet its obligations under a loan agreement it may have with Ability.
Second priority liens on collateral securing debt investments that Ability makes may be subject to control by senior creditors with first priority liens. If there is a default, the value of the collateral may not be sufficient to repay in full both the first priority creditors and Ability.
Certain debt investments that Ability makes may be secured on a second priority basis by the same collateral securing first priority debt of such companies. The first priority liens on the collateral will secure the portfolio corporation’s obligations under any outstanding senior debt and may secure certain other future debt that may be permitted to be incurred by Ability under the agreements governing the loans. The holders of obligations secured by the first priority liens on the collateral will generally control the liquidation of and be entitled to receive proceeds from any realization of the collateral to repay their obligations in full before Ability. In addition, the value of the collateral in the event of liquidation will depend on market and economic conditions, the availability of buyers and other factors. There can be no assurance that the proceeds, if any, from the sale or sales of all of the collateral would be sufficient to satisfy the debt
33
obligations secured by the second priority liens after payment in full of all obligations secured by the first priority liens on the collateral. If such proceeds are not sufficient to repay amounts outstanding under the debt obligations secured by the second priority liens, then Ability, to the extent not repaid from the proceeds of the sale of the collateral, will only have an unsecured claim against the portfolio company’s remaining assets, if any.
The rights Ability may have with respect to the collateral securing the debt investments it makes with senior debt outstanding may also be limited pursuant to the terms of one or more intercreditor agreements that Ability enters into with the holders of senior debt. Under such an intercreditor agreement, at any time that obligations that have the benefit of the first priority liens are outstanding, any of the following actions that may be taken in respect of the collateral will be at the direction of the holders of the obligations secured by the first priority liens: the ability to cause the commencement of enforcement proceedings against the collateral; the ability to control the conduct of such proceedings; the approval of amendments to collateral documents; releases of liens on the collateral; and waivers of past defaults under collateral documents. Ability may not have the ability to control or direct such actions, even if its rights are adversely affected.
Ability is subject to additional risks associated with investments in the form of loan participation interests.
Ability invests in loan participation interests in which another lender or lenders share with it the rights, obligations and benefits of a loan made by an originating lender to a borrower. Accordingly, Ability will not be in privity of contract with a borrower because the other lender or participant is the record holder of the loan and, therefore, Ability will not have any direct right to any underlying collateral for the loan. These loan participations may be senior, pari passu or junior to the interests of the other lender or lenders in respect of distributions from the loan. Furthermore, Ability may not be able to control the pursuit of any rights or remedies under the loan, including enforcement proceedings in the event of default thereunder. In certain cases, the original lender or another participant may be able to take actions in respect of the loan that are not in Ability’s best interests. In addition, in the event that (1) the owner of the loan participation interest does not have the benefit of a perfected security interest in the lender’s rights to payments from the borrower under the loan or (2) there are substantial differences between the terms of the loan and those of the applicable loan participation interest, such loan participation interest could be recharacterized as an unsecured loan to a lender that is the record holder of the loan in such lender’s bankruptcy, and the assets of such lender may not be sufficient to satisfy the terms of such loan participation interest. Accordingly, Ability may face greater risks from loan participation interests than if it had made loans directly to the borrowers.
Ability faces risk on the collateral securing Ability’s loans.
Where the loans provided by Ability are secured by a lien on specified collateral of the borrower (particularly inventory, receivables and tangible fixed assets), there is no assurance that Ability will have obtained or properly perfected its liens, or that the value of the collateral securing any particular loan will protect Ability from suffering a partial or complete loss if the loan becomes non-performing and Ability moves to enforce against the collateral. In such event, we could suffer losses that could have a material adverse effect. In addition, during its underwriting process, Ability will make an estimate of the value of the collateral. A decrease in the market value of collateral assets at a rate greater than the rate projected by Ability may adversely affect the current realization values of such collateral. The degree of realization risk varies by the business of the borrower and the nature of the security.
Ability may not be able to exercise control over borrower clients.
Ability will not always be in a position to exercise control over its borrower clients or prevent decisions by the management or shareholders of a borrower that may affect the fair value of an Ability loan, or otherwise affect the ability of the borrower to repay its obligations to Ability. Furthermore, Ability does not intend to take significant equity positions in its borrower clients. The lack of liquidity of debt positions that Ability will typically hold in its borrower clients results in the risk that Ability may not be able to dispose of its exposure to the borrower in the instance where a borrower is underperforming. This could have a material adverse effect on us.
Ability faces risks related to securities of borrower clients.
Ability anticipates lending to both public and private companies, which may include bonus features granting Ability securities of the client. The securities issued by private companies will be subject to legal and other restrictions on resale or will be otherwise less liquid than publicly traded securities. To the extent Ability receives any form of securities issued by private companies, it may be difficult for Ability to dispose of such holdings if the need arises. Furthermore, if Ability is required to liquidate all or a portion of the securities it holds in an illiquid company, it may realize significantly less than the value at which it had previously recorded its holdings. In addition, Ability may face restrictions imposed by U.S. securities laws on its ability to liquidate or otherwise trade in securities of a borrower client, including, where Ability obtains material non- public information regarding such borrower.
34
Use of leverage and changes in interest rates may affect Ability’s cost of capital and net investment income.
Since Ability may from time to time use debt to finance a portion of its investments, its net investment income will depend, in part, upon the difference between the rate at which it borrows funds and the rate at which it invests those funds. As a result, we can offer no assurance that a significant change in market interest rates will not have a material adverse effect on Ability’s net investment income. In periods of rising interest rates when Ability has debt outstanding, Ability’s cost of funds will increase, which could reduce its net investment income. Ability expects that its long-term fixed-rate investments will be financed primarily with equity and long-term debt. Ability may use interest rate risk management techniques in an effort to limit its exposure to interest rate fluctuations. These activities may limit Ability’s capacity to participate in the benefits of lower interest rates with respect to the hedged portfolio. Adverse developments resulting from changes in interest rates or hedging transactions could have a material adverse effect on our business, financial condition and results of operations.
The ability of Ability to service any future outstanding debt depends largely on its financial performance and is subject to prevailing economic conditions and competitive pressures. The amount of leverage that Ability will employ at any particular time will depend on its assessments of market and other factors at the time of any proposed borrowing. As a result of Ability’s use of leverage: (i) shares of our common stock may be exposed to incremental risk of loss and a decrease in the value of Ability’s loan portfolio would have a greater negative impact on the value of shares of our common stock if Ability did not use leverage; (ii) adverse changes in interest rates could reduce or eliminate the incremental income we receive from the proceeds of any leverage; (iii) Ability and, indirectly, our shareholders, will bear the entire cost of paying interest and repaying any borrowed funds; (iv) our ability to pay dividends on its common shares may be restricted by covenants or other restrictions imposed by Ability’s lenders; (v) Ability’s ability to amend its organizational documents or other agreements may be restricted if such amendments would result in a material adverse effect on its lenders; and (vi) Ability may, under some circumstances, be required to dispose of its assets under unfavorable market conditions in order to maintain its leverage, thus causing us to recognize a loss that might not otherwise have occurred. The extent to which the gains and losses associated with leveraged investing are increased will generally depend on the degree of leverage employed.
General Risks
The market price and trading volume of our common stock may be volatile, which could result in rapid and substantial losses for our stockholders.
The market value of our common stock will fluctuate with changes in, among other things, changes in the amount of our dividends, market reaction to any acquisitions or other transactions, and liquidity in the trading of common stock. Such changes in value may occur as a result of various factors, including those described above and general economic and market conditions and the performance of Mount Logan relative to entities engaged in similar businesses.
Climate change-related risks and regulatory and other efforts to address climate change could adversely affect our business.
We will face a number of risks associated with climate change, including risks related to the impact of U.S. and foreign climate-related legislation and regulation, as well as risks arising from climate-related business trends. Climate change-related regulations or interpretations of existing laws have resulted, and may continue to result, in enhanced disclosure obligations that could negatively affect us and also materially increase our regulatory burden. We may also face business trend-related climate risks. Certain asset management clients are increasingly taking climate-related risks into account in their investment decisions.
We will be subject to risks associated with pandemics, epidemics, disease outbreaks and other public health crises, which could impact our business, financial condition and results of operations in the future.
We are subject to risks associated with pandemics, epidemics, disease outbreaks and other public health crises. Such public health crises could adversely affect our business in a number of ways, including by increasing volatility in the financial markets; preventing us from capitalizing on certain market opportunities; causing prolonged asset price inflation; hurting economic activity; straining our liquidity, which may impact our credit ratings and limit the availability of future financing; and reducing our ability to understand and foresee trends and changes in the markets in which we operate.
35
Delaware law, our amended and restated certificate of incorporation and our amended and restated bylaws contain certain provisions, including anti-takeover provisions that limit the ability of stockholders to take certain actions and could delay or discourage takeover attempts that stockholders may consider favorable.
Our amended and restated certificate of incorporation, amended and restated bylaws and the DGCL contain provisions that could have the effect of rendering more difficult, delaying, or preventing an acquisition deemed undesirable by our board of directors and therefore depress the trading price of our common stock. These provisions could also make it difficult for stockholders to take certain actions, including electing directors who are not nominated by the current members of our board of directors or taking other corporate actions, including effecting changes in management. Among other things, our amended and restated certificate of incorporation and amended and restated bylaws include provisions regarding:
•the ability of our board of directors to issue shares of preferred stock, including “blank check” preferred stock and to determine the price and other terms of those shares, including preferences and voting rights, without stockholder approval, which could be used to significantly dilute the ownership of a hostile acquirer;
•the limitation of the liability of, and the indemnification of, our directors and officers;
•the right of our board of directors to elect a director to fill a newly created directorship created by the expansion of our board of directors or a vacancy resulting from the resignation or death of a director, which, in some cases, prevents stockholders from being able to fill vacancies on our board of directors;
•controlling the procedures for the conduct and scheduling of our board of director and stockholder meetings;
•the ability of our board of directors to amend the amended and restated bylaws, which may allow our board of directors to take additional actions to prevent an unsolicited takeover and inhibit the ability of an acquirer to amend our amended and restated bylaws to facilitate an unsolicited takeover attempt;
•advance notice procedures with which stockholders must comply to nominate candidates to the board of directors or to propose matters to be acted upon at a stockholders’ meeting, which could preclude stockholders from bringing matters before annual or special meetings of stockholders and delay changes in the board of directors and also may discourage or deter a potential acquirer from conducting a solicitation of proxies to elect the acquirer’s own slate of directors or otherwise attempting to obtain control of the Company;
•the elimination of stockholders’ ability to act by written consent in lieu of a meeting of stockholders;
•the classification of our board of directors into three classes, each serving a three-year term, and with each director only being able to be removed for cause, which could delay changes in our board of directors by increasing the amount of time required to replace a majority of directors sitting on our board of directors; and
•the exclusive right of our board of directors to determine the number of directors constituting the whole board.
These provisions, alone or together, could delay or prevent hostile takeovers and changes in control or changes in our board of directors or management.
In addition, because we have not chosen to be exempt from Section 203 of the DGCL, this provision could also delay or prevent a change of control that our stockholders may favor. Section 203 of the DGCL generally prohibits a Delaware corporation from engaging in a “business combination” with an “interested stockholder” for a period of three years following the time that such stockholder became an interested stockholder, subject to certain exceptions.
Any provision of our amended and restated certificate of incorporation, amended and restated bylaws or Delaware law that has the effect of delaying or preventing a change in control could limit the opportunity for our stockholders to receive a premium for their shares in our capital stock and could also affect the price that some investors are willing to pay for our common stock.
36
Our amended and restated certificate of incorporation could prevent us from benefiting from corporate opportunities that might otherwise have been available to us.
Our amended and restated certificate of incorporation of provides that, to the fullest extent permitted by the law of the State of Delaware, our officers, directors and stockholders have no obligation to refrain from:
•engaging in the same or similar business activities or lines of business as us or our subsidiaries; or
•competing, directly or indirectly, with us or any of our subsidiaries.
Additionally, our amended and restated certificate of incorporation includes a “corporate opportunity” waiver provision pursuant to which, to the fullest extent permitted by law, our officers, directors and stockholders will not be liable to us for breach of any fiduciary duty by reason of the fact that any such person (i) pursues or acquires any corporate opportunity or (ii) does not communicate information regarding such corporate opportunity to us unless the potential transaction or corporate opportunity is expressly offered to a Mount Logan director or officer in his or her capacity as a director or officer of Mount Logan. This corporate opportunity waiver provision may exacerbate conflicts of interest between us and our directors, officers or stockholders because the provision may permit one of our officers, directors or stockholders to choose to direct a corporate opportunity to that other entity instead of us.
Our amended and restated certificate of incorporation designates the state courts of the State of Delaware in and for New Castle County as the sole and exclusive forum for certain types of actions and proceedings that may be initiated by our stockholders, which could limit our stockholders’ ability to obtain a favorable judicial forum for disputes with us or our directors, officers or other employees.
Our amended and restated certificate of incorporation will provide that unless we consent in writing to the selection of an alternative forum, the state courts of the State of Delaware in and for New Castle County will be the sole and exclusive forum for (i) any derivative action or proceeding brought on our behalf, (ii) any action asserting a claim of breach of a fiduciary duty owed by any of our directors, officers, employees or agents to us or our stockholders, (iii) any action asserting a claim arising pursuant to any provision of the DGCL or our amended and restated certificate of incorporation or our amended and restated bylaws, (iv) any action seeking to interpret, apply, enforce or determine the validity of our amended and restated certificate of incorporation or our amended and restated bylaws; or (v) any action asserting a claim against us or any of our directors, officers, employees, or agents governed by the internal affairs doctrine. However, if no state court located within the State of Delaware has jurisdiction over any such action, the action may be brought instead in the United States District Court for the District of Delaware. In addition, our amended and restated certificate of incorporation will provide that the foregoing provision will not apply to claims arising under the Securities Act or the Exchange Act or the respective rules and regulations promulgated thereunder; unless we consent in writing to the selection of an alternative forum, the federal district court for the District of Delaware will be the sole and exclusive forum for the resolution of any action asserting a claim arising under the Securities Act, the Exchange Act, or the respective rules and regulations promulgated thereunder. These exclusive forum provisions may impose additional costs on stockholders in pursuing any such claims, particularly if the stockholders do not reside in or near the State of Delaware and may limit the ability of a stockholder to bring a claim in a judicial forum that such stockholder finds favorable for disputes with us or any of our directors, officers or stockholders, which may discourage lawsuits with respect to such claims. Our stockholders will not be deemed to have waived our compliance with the federal securities laws and the rules and regulations thereunder as a result of these exclusive forum provisions.
Our amended and restated certificate of incorporation will provide that any person or entity purchasing or otherwise receiving or acquiring any interest in any shares of our capital stock shall be deemed to have notice of and to have consented to the forum provisions in our amended and restated certificate of incorporation.
This choice-of-forum provision may limit a stockholder’s ability to bring a claim in a judicial forum that it finds favorable for disputes with us or our directors, officers, stockholders, agents or other employees, or could result in increased costs for a stockholder to bring a claim, particularly if they do not reside in or near Delaware, which may discourage such lawsuits. We note that there is uncertainty as to whether a court would enforce this provision, and the enforceability of similar choice of forum provisions in other companies’ charter documents has been challenged in legal proceedings. Further, investors cannot waive compliance with the federal securities laws and the rules and regulations thereunder. It is possible that a court could find these types of provisions to be inapplicable or unenforceable, and if a court were to find this provision of our amended and restated certificate of incorporation inapplicable or unenforceable with respect to one or more of the specified types of actions or proceedings, we may incur additional costs associated with resolving such matters in other jurisdictions, which could materially and adversely affect our business, financial condition and results of operations and result in a diversion of the time and resources of our management and board of directors.
37
Item 1B. Unresolved Staff Comments
None.
Item 1C. Cybersecurity
We have processes in place to assess, identify, and manage material risks from cybersecurity threats. The Company’s business is dependent on the communications and information systems of BCPA and other third-party service providers. The Company relies on BCPA for the management of certain aspects of its day-to-day operations including its cybersecurity program.
Cybersecurity Program Overview
The Company relies on BCPA and certain vendors to engage external experts, including cybersecurity assessors, consultants, and other specialists as appropriate to evaluate cybersecurity measures and risk management processes, including those applicable to the Company.
Board Oversight of Cybersecurity Risks
Management’s Role in Cybersecurity Risk Management
Management of the Company is informed about and monitors the prevention, detection, mitigation, and remediation of cybersecurity incidents impacting the Company, including through the receipt of notifications from service providers and reliance on communications with legal, information technology, and/or compliance personnel of the BCPA.
Assessment of Cybersecurity Risk
Item 2. Properties
Our principal executive and administrative offices are located at 650 Madison Avenue, 3rd Floor, New York, NY 10022. This space is leased by BCPA and we reimburse BCPA for a portion of the lease expense pursuant to the Servicing Agreement. This space is used by both segments of Mount Logan.
38
Mount Logan does not currently have any investments or interests in any real estate on its own behalf, nor does it have for its own benefit any investments or interest in any real estate mortgages or securities of persons engaged in real estate activities, though Ability does from time to time make such investments and hold such interests for the benefit of policyholders.
Item 3. Legal Proceedings
From time to time, we are involved in various legal proceedings, lawsuits and claims incidental to the conduct of our business. Our business is also subject to extensive regulation, which may result in regulatory proceedings against us. We are not currently party to any material legal proceedings.
Item 4. Mine Safety Disclosures
Not applicable.
39
PART II
Item 5. Market for Registrant’s Common Equity, Related Stockholder Matters and Issuer Purchases of Equity Securities Market Information
Market Information
Our common stock is listed on the Nasdaq Global Market under the ticker symbol “MLCI.” At March 18, 2026, there were approximately 92 stockholders of record. This does not include the number of stockholders that hold stock in “street name” through banks or broker-dealers.
Purchases of Equity Securities
On December 29, 2025, we commenced a cash tender offer to purchase up to $15 million in value, or approximately 1,590,600 shares, of our common stock at a price of $9.43 per share. The tender offer expired on February 2, 2026.
Item 6. Reserved
40
Item 7. Management’s Discussion and Analysis of Financial Condition and Results of Operations
The following discussion and analysis of our financial condition and results of operations should be read in conjunction with Mount Logan’s condensed consolidated financial statements and the related notes within this Annual Report on Form 10-K. As described in the section entitled “Cautionary Note Regarding Forward-Looking Statements,” this discussion contains forward-looking statements that are subject to known and unknown risks and uncertainties. Actual results and the timing of events may differ significantly from those expressed or implied in such forward-looking statements due to a number of factors, including those included in the section of this Annual Report on Form 10-K entitled “Item 1A. Risk Factors” beginning on page 17 herein. The highlights listed below have had significant effects on many items within our condensed consolidated financial statements and affect the comparison of the current period’s activity with those of prior periods. Our historical results are not necessarily indicative of the results that may be expected for any period in the future, and our interim results are not necessarily indicative of the results we expect for the full fiscal year or any other period.
Nature of Business
General
Mount Logan’s Business
Mount Logan, together with its consolidated subsidiaries is an alternative asset management and insurance solutions company. Mount Logan manages its business through two business segments: Asset Management and Insurance Solutions. Its Asset Management segment is focused on investing in and actively managing credit investment opportunities in North America through its wholly-owned subsidiary Mount Logan Management LLC (“ML Management”). The Insurance Solutions segment is conducted by Ability Insurance Company (“Ability”), a Nebraska domiciled insurer, that specializes in reinsuring annuity products for the increasing number of individuals seeking to fund retirement needs. Ability also holds a run-off book of long-term care policies. As of December 31, 2025, Mount Logan no longer had any direct full time employees.
Asset Management
Mount Logan’s Asset Management segment focuses on generating recurring asset management fee streams across a variety of credit investing strategies. Mount Logan raises, invests and manages funds, accounts and other vehicles with an emphasis on private credit. As of December 31, 2025, Mount Logan had a total AUM of $2.1 billion.
As an alternative asset manager, through Mount Logan’s wholly and partially owned SEC-registered investment advisers (“RIAs”), Mount Logan earns management and incentive fees for providing investment advisory and management services to multiple diversified investment vehicles, which include Mount Logan’s Insurance Solutions segment. The majority of these vehicles are permanent or semi-permanent capital, generating recurring management and fee-related performance fees from indefinite term vehicles, that are measured and received on a recurring basis, primarily focused on North American and European direct and indirect private loan origination in the middle-market across the capital structure, as well as corporate credit, specialty finance, and other mandates across managed accounts and CLOs. Mount Logan benefits from its investment in and expansion into high-growth areas of private credit and private solutions investing, including asset-backed finance, opportunistic credit, and venture and growth lending. Beyond participation in the traditional primary and secondary credit markets, through Mount Logan’s origination and corporate solutions capabilities, Mount Logan seeks to originate assets with attractive risk-adjusted returns, in the funds Mount Logan manages, through the employment of rigorous and deep diligence on the opportunities Mount Logan assesses.
Through Mount Logan’s RIAs, Mount Logan seeks to invest in well-established middle market businesses that operate across a wide range of industries (i.e., no concentration in any one industry). Mount Logan employs fundamental credit analysis, targeting investments in businesses with relatively low levels of cyclicality and operating risk. Mount Logan has experience managing levered vehicles, both public and private, and seeks to enhance returns through the prudent use of leverage with a conservative approach that prioritizes downside protection and capital preservation. Mount Logan believes this strategy and approach offers attractive risk-adjusted returns with lower volatility featuring the potential for fewer defaults and greater resilience through market cycles.
The amount of fees charged for managing these assets depends on the underlying investment strategy, vehicle being managed, liquidity profile, and, ultimately, Mount Logan’s ability to generate returns for Mount Logan’s clients. After expenses associated with generating fee-related revenues, Mount Logan measures the resulting earnings stream “Fee Related Earnings” or “FRE”, which represents the primary performance measure for the Asset Management segment. FRE
41
is the sum of (i) management fees, (ii) performance fees received from certain managed funds, (iii) advisory and transaction fees, (iv) equity investment earnings related to fee generating vehicles, (v) interest income attributable to investment management activity, and (vi) other fee-related income derived from the Company’s profit-sharing agreement with BCPSC Holdings LLC, a wholly owned subsidiary of BCPA (the “Profit-Sharing Agreement”) over a fee-generating vehicle less (a) fee-related compensation, excluding equity-based compensation, and (b) other associated operating expenses, which excludes amortization of acquisition-related intangible assets and interest and other credit facility expenses. FRE excludes non-fee generating revenues and expenses, transaction-related charges, equity-based compensation costs, the amortization of intangible assets, the operating results of variable interest entities (“VIEs”) that are included in the consolidated financial statements, and any other non-recurring income and expenses. In addition, FRE excludes interest and other financing costs related to Mount Logan not attributable to any specific segment, and corporate overhead expenses incurred to support the operations of the business rather than directly fee-related. Management considers these types of costs corporate in nature, and are included only for reconciliation purposes to income (loss) before income tax (provision) benefit. FRE is a key financial metric that we defined and report as a non-GAAP financial measure. See “—Segment Analysis—Asset Management” for a reconciliation of FRE to the most directly comparable U.S. GAAP measure.
The Asset Management segment also holds a minority interest in Sierra Crest Investment Management (“SCIM”), which manages BCP Investment Corporation (“BCIC”), formerly known as Portman Ridge Finance Corp. (“Portman” or “Portman Ridge”), a United States business development company, and Alternative Credit Income Fund (“ACIF”), a closed-end interval fund that invests in a portfolio of public and private credit investments. SCIM is majority owned by BCPA.
Insurance Solutions
Mount Logan’s Insurance Solutions segment is operated by Ability, a Nebraska domiciled insurer and reinsurer of LTC policies and retirement savings products, licensed in 42 states and the District of Columbia. Upon closing of the acquisition of Ability in late 2021, ML Management entered into an investment management agreement with Ability (the “Ability IMA”) to manage certain of Ability’s assets that are within the scope of ML Management’s expertise in providing investment management advisory services (the assets of Ability managed by ML Management referred to herein as the “Managed Ability Portfolio”). In the second quarter of 2022, management began to implement its plan to expand and diversify the Insurance Solutions business, including ceasing to insure new long-term care risk and, instead, reinsuring multi-year guaranteed annuity (“MYGA”) policies. The Insurance Solutions segment also includes the economic benefits of the three Cornhusker CLOs (collectively, the “Cornhusker CLOs”), which represent consolidated VIEs. Annuity policies are contracts with insurers where individuals agree to pay a certain amount of money, either in a lump sum or through installments, which entitles them to receive a series of payments at a future date.
Long-term care insurance policies reimburse policyholders a daily amount, upon meeting certain requirements, for services to assist with daily living as they age. Ability’s long-term care portfolio’s morbidity risk has been largely reinsured to third-parties.
A reinsurance contract is a type of insurance contract that is issued by an entity (the reinsurer) to compensate another entity (the cedant) for claims arising from insurance contract(s) issued by the cedant.
Consistent with the overall business strategy, Ability assumes certain policy risks written by other insurance companies and cedes insurance risks to reinsurers. Reinsurance accounting is applied for reinsurance transactions when risk transfer provisions have been met. Ability reviews all contractual features, particularly those that may limit the amount of insurance risk to which the reinsurer is subject or features that delay the timely reimbursement of claims. Ability does not have any assumed or ceded reinsurance contracts for the LTC line of business that do not meet risk transfer requirements. The MYGA line of business does not meet the risk requirements to qualify as an insurance contract and is therefore considered an investment contract.
Ability uses ceded reinsurance contracts in the normal course of business to manage its risk exposure. For each of its reinsurance agreements, cessions under reinsurance agreements do not discharge Ability’s obligations as the primary insurer. Reinsurance assets represent the benefit derived from reinsurance agreements in force at the reporting date, considering the financial condition of the reinsurer. Amounts recoverable from reinsurers are estimated in accordance with the terms of the relevant reinsurance contract and historical reinsurance recovery information. Amounts recoverable from reinsurers are based on what Ability believes are reasonable estimates and the balance is reported as an asset in the
42
Insurance section of the Consolidated Statements of Financial Position. However, the ultimate amount of the reinsurance recoverable is not known until all claims are settled.
Mount Logan provides a full suite of services for Ability’s investment portfolio, including direct investment management, asset allocation, mergers and acquisitions asset diligence and certain operational support services, including investment compliance, tax, legal and risk management support. Mount Logan’s Insurance Solutions business focuses on generating spread income by combining the two core competencies of (1) sourcing long-term, persistent liabilities through reinsurance treaties and (2) using the scale and reach of Mount Logan’s Asset Management business to actively source or originate assets with Ability’s preferred risk and return characteristics. Ability’s investment philosophy is to invest a portion of its assets in securities that earn an incremental yield by taking measured liquidity and complexity risk and capitalize on its long-dated, persistent liability profile to prudently achieve higher net investment earned rates, rather than assuming incremental credit risk. Because Ability maintains discipline in reinsuring attractively priced liabilities, it has the ability to invest in a broad range of high-quality assets to generate attractive earnings.
Mount Logan uses Spread Related Earnings (“SRE”) to assess the performance of the Insurance Solutions segment. SRE is a component of Segment Income that is used to assess the performance of the Insurance Solutions segment, excluding certain market volatility, which consists of investment gains (losses), other income and certain general, administrative & other expenses. For the Insurance Solutions segment, SRE equals the sum of (i) the net investment earnings on Insurance Solutions segment’s net invested assets (excluding investment earnings on funds held under reinsurance contracts and modified coinsurance (“Modco”) agreement), less (ii) cost of funds (as described below), (iii) compensation and benefits, (iv) interest expense and (v) operating expenses. SRE represents the difference between actual earnings generated on the assets and investments made and the interest or crediting rate guaranteed to policyholders or participants. Rather than increasing allocations to higher risk securities to increase yields, or returns, on the assets invested, Ability and ML Management focus on proprietary origination of high-quality, predominantly senior secured loans and assets, which Mount Logan believes reduce downside risk.
The diagram below depicts Mount Logan’s current organizational structure:
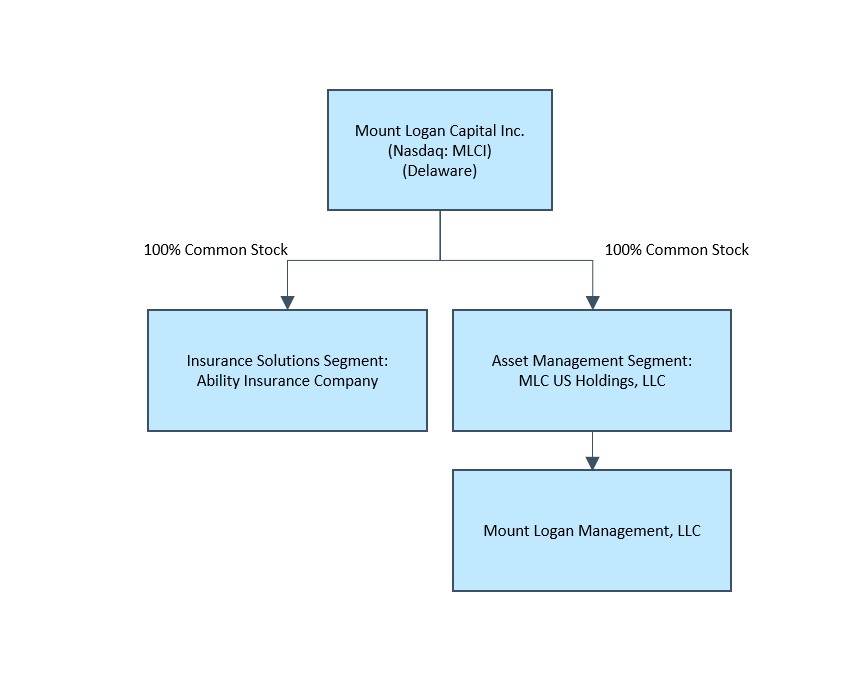
Note: The organizational structure chart above depicts a simplified version of the Mount Logan structure. It does not include all legal entities in the structure. The acquisition of 180 Degree Capital Corp. is reflected as part of the Asset Management segment.
Business Environment
43
Industry Trends and Market Conditions
Mount Logan’s asset management and insurance solutions businesses are affected by the conditions in the political environment and financial markets and economic conditions of the United States, such as changes in interest rates, availability of credit, and inflation rates (including persistent inflation). These conditions can significantly impact the performance of Mount Logan’s business, including, but not limited to, the valuation of investments, including those of the vehicles Mount Logan manages, and related income that Mount Logan may recognize.
Mount Logan carefully monitors economic and market conditions that could potentially give rise to market volatility and affect its business operations, which include inflation and benchmark interest rates. According to the U.S. Bureau of Labor Statistics, the annual U.S. inflation rate increased 2.7% from December 31, 2024 to December 31, 2025. This heightening of inflation was part of a broader trend of increasing inflationary pressures. The Federal Reserve finished the fourth quarter of 2025 with a benchmark interest rate target range of 3.5% to 3.75%, a 25 basis point decrease from its October 2025 meeting. While the Federal Reserve in the United States and central banks in other countries have continued to cut interest rates as inflation rates have gradually weakened, they may raise rates again in the future due to ongoing inflation concerns. This potential increase, combined with reduced government spending and financial market volatility, could further elevate economic uncertainty and associated risks. Additionally, interest rate hikes or other government measures aimed at curbing inflation might lead to recessionary pressures globally. Such a recession could significantly and adversely impact Mount Logan’s business, financial condition, operational results, liquidity, and cash flows.
Moreover, Ability is materially affected by conditions in the capital markets and the U.S. economy generally. Actual or perceived stressed conditions, volatility and disruptions in financial asset classes or various capital and credit markets may have an adverse effect on Mount Logan’s insurance business because such conditions may decrease the returns on, and value of, its investment portfolio.
Interest Rate Environment
Both medium-term and long-term rates remained relatively flat between the third and fourth quarter of 2025, with the U.S. 10-year Treasury yield at 4.17% as of December 31, 2025 compared to 4.15% as of September 30, 2025. Short term rates declined in the third quarter of 2025, with the 3-month secured overnight financing rate at 3.65% as of December 31, 2025 compared to 3.98% as of September 30, 2025 respectively.
With respect to the Insurance Solutions segment, Ability’s investment portfolio consists predominantly of fixed maturity investments. Both rising and declining interest rates can negatively affect the income Ability derives from these interest rate spreads. During periods of rising interest rates, Ability may be contractually obligated to reimburse its clients for the greater amounts they credit on certain interest-sensitive products. However, Ability may not have the ability to immediately acquire investments with interest rates sufficient to offset the increased crediting rates on its reinsurance contracts. During periods of falling interest rates, Ability’s investment earnings will be lower because new investments in fixed maturity securities will likely bear lower interest rates. Ability may not be able to fully offset the decline in investment earnings with lower crediting rates on underlying annuity products related to certain of its reinsurance contracts. Higher interest rates may result in increased surrenders on interest-based products of Ability’s clients, which may affect its fees and earnings on those products. Lower interest rates may result in lower sales of certain insurance and investment products of Ability’s clients, which would reduce the demand for its reinsurance of these products. If interest rates remain low for an extended period, it may adversely affect Ability’s cash flows, financial condition and results of operations. Ability addresses interest rate risk through managing the duration of the liabilities it sources with assets it acquires through asset/liability management (“ALM”) programs. As part of its investment strategy, Ability purchases floating rate investments, which are expected to perform well in a rising interest rate environment and are expected to underperform in a declining rate environment. Ability manages its floating interest rate risk in a declining rate environment through hedging activity.
As of December 31, 2025, Ability’s net invested asset portfolio included $317 million of floating rate investments, or 41% of its net invested assets. In periods of prolonged low interest rates, the net investment spread may be negatively impacted by reduced investment income to the extent that Ability is unable to adequately reduce policyholder crediting rates due to policyholder guarantees in the form of minimum crediting rates or otherwise due to market conditions. A significant majority of the MYGA policies Ability reinsures have crediting rates that reset upon renewal. While Ability has the contractual right to not accept the renewals, its willingness to do so may be limited by competitive pressures.
Significant interest rate risk may arise from mismatches in the timing of cash flows from Ability’s assets and liabilities. Management of interest rate risk at the Company-wide level, and at the various operating company levels, is one of the main risk management activities in which MLC senior management engages.
44
Interest Rate Sensitivity
The following table summarizes the potential impact on net income of hypothetical base rate changes in interest rates on Mount Logan’s debt investments assuming a parallel shift in the yield curve, with all other variables remaining constant for the Insurance Solutions segment. The impact of interest rates sensitivity on the Asset Management segment is immaterial.
| As at | December 31, 2025 | December 31, 2024 | ||||||||||||
50 basis point increase1 | $ | 653 | $ | 1,911 | ||||||||||
50 basis point decrease1 | (653) | (1,911) | ||||||||||||
_______________
(1)Losses are presented in brackets and gains are presented as positive numbers.
Actual results may differ significantly from these sensitivity analyses. As such, the sensitivities should only be viewed as directional estimates of the underlying sensitivities for the respective factors based on the assumptions outlined above.
During the first quarter of 2024, Mount Logan entered into interest rate swaps to economically hedge fair value interest rate risk on floating rate debt investments. Mount Logan does not designate derivatives (interest rate swaps) as hedging instruments under a fair value hedge accounting model. Derivatives are initially measured at fair value with subsequent changes therein recognized in the Consolidated Statements of Comprehensive Income (Loss). Mount Logan’s derivative instruments are disclosed below:
| As at December 31, 2025 | Notional | Derivative assets | Derivative liabilities | |||||||||||||||||
| Interest rate swaps | $ | 187,000 | $ | 481 | $ | 1,388 | ||||||||||||||
| Total | 187,000 | 481 | 1,388 | |||||||||||||||||
| As at December 31, 2024 | Notional | Derivative assets | Derivative liabilities | |||||||||||||||||
| Interest rate swaps | $ | 187,000 | $ | — | $ | 5,192 | ||||||||||||||
| Total | 187,000 | — | 5,192 | |||||||||||||||||
The interest rate swaps are recorded in the Consolidated Statement of Financial Position as “Derivatives” within the Insurance Solutions segment with the mark-to-market changes in fair value being recorded as part of “Unrealized gains (losses) on hedging instruments” within the Insurance Solutions segment on the Consolidated Statement of Comprehensive Income (Loss).
Restricted cash posted as collateral consists of cash deposited at a bank that is pledged as collateral in connection with the interest rate swaps. The table below represents the cash posted as collateral associated with open derivative positions:
| As at | December 31, 2025 | December 31, 2024 | ||||||||||||
| Restricted cash posted as collateral | $ | 9,973 | $ | 15,716 | ||||||||||
| Total | 9,973 | 15,716 | ||||||||||||
Recent Developments
On February 24, 2026, BCPL and ACIF announced that they have entered into an agreement under which ACIF will merge with and into BCPL, subject to approval by ACIF shareholders and the satisfaction of other closing conditions. We receive the economics of ACIF, which is an interval fund advised by SCIM, via a servicing agreement with SCIM over ACIF. See “Risk Factors—Risks Related to the Business – Asset Management—We may experience a decline in revenue associated with our Asset Management segment for a variety of reasons.”
45
On March 18, 2026, Opportunistic Credit Interval Fund (“OCIF”), a fund managed by ML Management, entered into definitive agreements to acquire the assets of Yieldstreet Alternative Income Fund (“YS AIF”) (the “Asset Acquisition”). In connection with the Asset Acquisition, ML Management entered into a Transaction Services Agreement with Willow Asset Management LLC (“Willow”), the advisor of YS AIF, pursuant to which Willow will provide access to books and records of YS AIF, certain transition services and licenses in exchange for aggregate consideration of up to $5 million, payable in cash and shares of the Company’s common stock. The transaction is expected to close in the third quarter of 2026, subject to regulatory and YS AIF shareholder approvals.
See Note 27. Subsequent events in our consolidated financial statements for further details.
Overview of Results of Operations
Financial Measures under U.S. GAAP - Asset Management
The following discussion of financial measures under U.S. GAAP is based on Mount Logan’s Asset Management business as of December 31, 2025.
Revenues
Management Fees
Mount Logan provides investment management services to investment funds, CLOs, managed accounts and other vehicles in exchange for a management fee. The significant growth of assets Mount Logan manages has had a positive effect on Mount Logan’s revenues. Management fees are determined quarterly using an annual rate which are generally based upon (i) a percentage of the capital committed during the commitment period, and thereafter based on the remaining invested capital of unrealized investments, or (ii) net asset value, gross assets, or as otherwise provided in the respective agreements. Management fees are recognized over time, during the period in which the related services are performed.
Incentive Fees
Mount Logan provides investment management services to investment funds, CLOs, managed accounts and other vehicles in exchange for a management fee, as discussed above and, in some cases an incentive fee, a type of performance revenue. The incentive fee consists of two parts: (i) an income incentive fee which is based on pre-incentive fee net investment income in excess of a hurdle rate and (ii) a capital gains incentive fee which is based on cumulative realized capital gains and losses and unrealized capital depreciation. Incentive fees are considered a form of variable consideration as they are based on the fund achieving certain investment return hurdles. Accordingly, the recognition of such fee is deferred until it is probable that a significant reversal in the amount of cumulative revenue will not occur, which is generally upon liquidation of the investment fund.
The following table summarizes Mount Logan’s (i) management fees and (ii) incentive fees by fee generating vehicle:
| As of December 31, | As of December 31, | For the year ended | For the year ended | Year on Year change in Total Fees | ||||||||||||||||||||||||||||||||||||||||||||||||||||||||||||||||||||||
| 2025 | 2024 | 2025 | 2024 | December 31, 2025 | December 31, 2024 | |||||||||||||||||||||||||||||||||||||||||||||||||||||||||||||||||||||
Management Fees Receivable 7 | Incentive Fees Receivable 7 | Management Fees | Incentive Fees | Total Fees | Management Fees | Incentive Fees | Total Fees | $ Change | % Change | |||||||||||||||||||||||||||||||||||||||||||||||||||||||||||||||||
| Fee Generating Vehicle | ||||||||||||||||||||||||||||||||||||||||||||||||||||||||||||||||||||||||||
Ability (including consolidated VIEs) 1 | $ | 553 | $ | 526 | $ | — | $ | — | $ | 6,043 | $ | — | $ | 6,043 | $ | 5,626 | $ | — | $ | 5,626 | $ | 417 | 7 | % | ||||||||||||||||||||||||||||||||||||||||||||||||||
BDCs 2 | — | 834 | — | — | 1,729 | — | 1,729 | 3,486 | — | 3,486 | (1,757) | (50) | % | |||||||||||||||||||||||||||||||||||||||||||||||||||||||||||||
CLOs 3 | 647 | 779 | — | — | 2,771 | — | 2,771 | 3,059 | — | 3,059 | (288) | (9) | % | |||||||||||||||||||||||||||||||||||||||||||||||||||||||||||||
Interval Funds 4 | 208 | 157 | 405 | 544 | 1,898 | 1,613 | 3,511 | 908 | 1,706 | 2,614 | 897 | 34 | % | |||||||||||||||||||||||||||||||||||||||||||||||||||||||||||||
Ovation Funds 5 | 525 | 269 | — | — | 1,935 | — | 1,935 | 2,935 | 1,491 | 4,426 | (2,491) | (56) | % | |||||||||||||||||||||||||||||||||||||||||||||||||||||||||||||
Other 6 | 97 | 74 | — | — | 1,199 | — | 1,199 | 742 | — | 742 | 457 | 62 | % | |||||||||||||||||||||||||||||||||||||||||||||||||||||||||||||
| Total Fees | $ | 2,030 | $ | 2,639 | $ | 405 | $ | 544 | $ | 15,575 | $ | 1,613 | $ | 17,188 | $ | 16,756 | $ | 3,197 | $ | 19,953 | $ | (2,765) | (14) | % | ||||||||||||||||||||||||||||||||||||||||||||||||||
______________
(1)ML Management earns a base management fee of 1% on the average statutory book value of the portion of Ability’s investments it manages. Management fees earned by ML Management from Ability are eliminated on consolidation.
46
(2)ML Management earned a base management fee of 1.75% on the gross assets of Logan Ridge until July 15, 2025 at which time Logan Ridge merged into Portman and became the newly merged entity - BCIC, and ML Management’s investment management agreement with Logan Ridge was terminated. Management fees earned indirectly through ML Management’s 24.99% interest in SCIM, which is the manager of BCIC (previously Portman), are excluded as management fee revenue, but are paid as cash distributions from SCIM. Upon the merger of Logan Ridge and Portman, on July 15, 2025, the Company through MLCSC Holdings LLC, a wholly owned subsidiary, entered into a profit-sharing agreement with BCPSC Holdings LLC, a wholly owned subsidiary of BCPA (the “Profit-Sharing Agreement”). MLCSC is entitled to 16.03% of BCPA’s distributions from SCIM. Incremental management fees from BCIC are indirectly earned through the Profit-Sharing Agreement, and are excluded as management fee revenue, but recognized in other income.
(3)ML Management as the adviser to two CLOs, 2018-01 and 2019-01, earns senior and subordinated management fees on these vehicles, calculated on the outstanding collateral balance. CLO 2018-1 earns 0.25% senior and 0.35% subordinated fees, and 2019-1 earns 0.25% senior and 0.25% subordinated fees. These rates are fixed for the life of the transaction and are not subject to repricing.
(4)ML Management is the adviser to OCIF and earns management and incentive fees directly from this fund. Base management fees are earned at 1.25% of gross assets. Incentive fees are realized when the fund reaches a hurdle rate of return each quarter, based on the pre-incentive fee net investment income. When OCIF’s pre-incentive net investment income – i.e. interest income, dividend income and any other income accrued during the calendar quarter, less OCIF’s operating expenses for the quarter – exceeds the hurdle rate of return on OCIF’s adjusted capital of 1.5% (or 6% annualized), ML Management earns an incentive fee at 15% of the pre-incentive fee net investment income. All incentive fees recognized are considered realized as they are calculated and payable quarterly in arrears based on the pre-incentive fee net investment income for the immediately preceding calendar quarter. All recorded incentive fees have been subsequently received in cash. Separately, Mount Logan receives the economics of ACIF, which is an interval fund advised by SCIM, via a servicing agreement with SCIM over ACIF. The SCIM servicing fee over ACIF is excluded.
(5)Mount Logan as the general partner accrues base management fees, calculated monthly, due and payable either monthly or quarterly in arrears at 0.125% of the net assets in the Ovation funds. Incentive fees, calculated monthly, due and payable quarterly in arrears, are calculated as 10% of pre-incentive fee distributable income. If pre-incentive fee distributable income amounts do not exceed 0% in any fiscal quarter, such shortfall (a “High Watermark Shortfall”) will carry forward to subsequent quarters. No incentive fees are payable to the general partner in any fiscal quarter in which a High Watermark Shortfall exists.
(6)Consists of several small, closed end private funds which are sub-advised by ML Management at 1% of net assets, as well as management fees earned from a portfolio of Vista Life & Casualty Reinsurance Company’s (Vista) assets to which ML Management was appointed as the investment manager of, effective March 2025, at a rate of 1% on the average statutory book value of investments under management. Only fees which are crystallized and not subject to reversal are recognized and included.
(7)Management and incentive fees receivable are part of Other assets on the Consolidated Statement of Financial Position.
The fee rates described above are contractually fixed, however Mount Logan retains the right to voluntarily waive all or a portion of any management or incentive fee in circumstances where doing so would better align the economic interests of Mount Logan and the investors in a particular vehicle. Any such waiver would be approved by the applicable fund board.
Advisory and Transaction Fees
Mount Logan originates loan assets into the Ability investment portfolio, and also structures securitization transactions for third parties in exchange for a fee. The fees are structured and agreed on an individual deal basis and will vary from one transaction to another. Generally, Mount Logan will receive a fixed fee and bear no expenses, but from time to time may cover some transaction fees or split a fee with an origination partner.
Expenses
Compensation and Benefits
Compensation and benefits expense consists of fixed salary, discretionary and non-discretionary bonuses, profit sharing expense associated with the performance fees earned and compensation expense associated with the vesting of non-cash equity-based awards. Mount Logan’s compensation arrangements with certain of its employees include non-cash equity-based awards, which are considered to be ‘performance-based incentives.’ The non-cash equity-based awards are granted subject to management’s discretion and approval by the Board of Directors. There are no clawback provisions associated with the non-cash equity-based awards; however, they are subject to a time-based vesting requirement and continued employment. To date, Mount Logan has not paid any profit sharing associated with performance fees. Because of these performance-based incentives, as Mount Logan’s net revenues increase, Mount Logan’s compensation costs rise. Mount Logan’s compensation costs also reflect the increased investment in people as Mount Logan continues to grow its AUM both organically and inorganically. During the fourth quarter of 2025, Mount Logan’s direct employees were transferred to BCPA. As such, as at December 31, 2025 Mount Logan has no direct employees. However, the compensation costs of BCPA employees who provide services to Mount Logan are attributed to Mount Logan based on AUM, and are now recorded within Administration and servicing fees.
Mount Logan grants equity awards to certain directors, officers, service providers and employees, consisting of Restricted Stock Units (“RSUs”) that generally vest and become exercisable in annual installments depending on the award terms. See Note 20. Equity based compensation to Mount Logan’s consolidated financial statements for further discussion of equity-based compensation.
47
Administration and Servicing Fees
On November 20, 2018, Mount Logan entered into a servicing agreement (the “Servicing Agreement”) with BCPA. Under the terms of the Servicing Agreement, BCPA as servicing agent (the “Servicing Agent”) performs (or oversees, or arranges for, the performance of) the administrative services necessary for the operation of Mount Logan, including, without limitation, office facilities, equipment, bookkeeping and record keeping services and such other services the Servicing Agent, subject to review by the Board, shall from time to time deem necessary or useful to perform its obligations under this Servicing Agreement. The Servicing Agent is authorized to enter into sub-administration agreements as determined to be necessary in order to carry out the administrative services.
Unless earlier terminated as described below, the Servicing Agreement will remain in effect from year-to-year if approved annually by (i) the vote of the Board and (ii) the vote of a majority of Mount Logan’s independent directors. The Servicing Agreement may be terminated at any time, without the payment of any penalty, upon 60 days’ written notice by the vote of the Board or by the Servicing Agent.
Mount Logan reimburses BCPA for an allocable portion of compensation paid to Mount Logan’s Chief Financial Officer, associated management personnel and other staff (based on a percentage of time such individuals devote, on an estimated basis, to the business affairs of Mount Logan), and out-of-pocket expenses. While the Servicing Agent performs certain administrative functions for Mount Logan, the management functions of Mount Logan are wholly performed by Mount Logan’s management team.
Mount Logan provides administrative and reporting services to SCIM in respect of the management of ACIF in exchange for a servicing fee. The servicing fee is variable consideration as it is calculated quarterly based on the fees received by SCIM under its advisory agreement with ACIF, less a specified fee retained by SCIM, debt servicing expense, compensation and other certain expenses SCIM incurs in connection with investment advisory services it provides to ACIF. As Mount Logan determined it acts as the agent in this relationship, Mount Logan recognizes in income the amount it is entitled to receive or obligated to pay. In the Consolidated Statements of Financial Position, uncollected amounts are classified as Due from related parties when money is owed to Mount Logan and money owed by Mount Logan is presented as Due to related parties.
Financial Measures under U.S. GAAP - Insurance Solutions
The following discussion of financial measures under U.S. GAAP is based on Mount Logan’s Insurance Solutions business, which is operated by Ability, as of December 31, 2025.
Revenues
Net Premiums
Net premiums for long-duration contracts, including products with fixed and guaranteed premiums and benefits, are recognized as revenue when due from policyholders. Insurance premiums are reported net of reinsurance ceded premiums. The net premiums for long duration contracts are negative as reinsurance ceded premiums exceeds direct and assumed premiums, primarily due to additional ceded premiums paid to transfer a substantial portion of risk under a reinsurance arrangement.
Product Charges
Product charges mainly include surrender charges on MYGA product which are earned when assessed against policyholder account balances during the period.
Net Investment Income
Net investment income is a significant component of Ability’s total revenues. Ability recognizes investment income as it accrues or is legally due, net of investment management and custody fees. Investment income on fixed maturity securities includes coupon interest, as well as the amortization of any premium and the accretion of any discount. Investment income on equity securities represents dividend income and preferred coupon interest.
Net gains (losses) from investment activities
Investment related gains (losses) primarily consist of (i) realized gains and losses on sales of investments, (ii) unrealized gains and losses on trading securities, (iii) unrealized gains and losses on equity securities, (iv) changes in the
48
fair value of the embedded derivatives and derivatives not designated as a hedge, and (v) changes in the provision for credit losses.
Net revenues of consolidated variable interest entities
Changes in the fair value of the consolidated VIEs’ assets and liabilities and related interest, dividend and other income and expenses are presented within net revenues of consolidated variable interest entities.
Net investment income (loss) on funds withheld
Net gains (losses) on funds withheld consists of investment activity pertaining to funds withheld assets which includes any interest income, unrealized gains, and losses, and realized gains and losses from sales of these assets.
Ceded reinsurance – Funds withheld with Front Street Re
Mount Logan has a coinsurance with funds withheld arrangement with Front Street Re covering a significant portion of the LTC business (the “Medico” block of policies). Under the funds withheld arrangement, assets are retained by Mount Logan; however, all investment activity pertaining to those assets are passed through to Front Street Re. Investment activity includes any interest income, unrealized gains, and losses, and realized gains and losses from sales of these assets. The liability for this funds held arrangement is in the liability section of the Insurance section of the Consolidated Statements of Financial Position, and the income statement items related to this contract are in the line item net investment income (loss) on funds withheld in the Insurance section of the Consolidated Statement of Operations.
Ceded reinsurance – Modified coinsurance with Vista Life and Casualty Reinsurance Company
Mount Logan also has a Modco agreement with Vista. Pursuant to such agreement, Mount Logan retains assets in a designated custody account to support the quota share of the ceded Modco reserves. Similar to a funds withheld arrangement, all investment activity pertaining to those assets are passed through to Vista. Investment activity includes any interest income, unrealized gains, and losses, and realized gains and losses from sales on these assets. The liability for this funds held agreement is netted against the reinsurance recoverable of the Insurance section of the Consolidated Statements of Financial Position, and the income statement items related to this contract are in the line item net investment income (loss) on funds withheld in the Insurance Consolidated Statement of Operations.
Expenses
Interest sensitive contract benefits
Liabilities for the MYGA investment contracts equal the account value, that is, the amount that accrues to the benefit of the contract or policyholder including credited interest and assessments through the financial statement date. Changes in interest sensitive contract liabilities, excluding deposits and withdrawals, are recorded in interest sensitive contract benefits or product charges on the consolidated statements of operations.
Net policy benefit and claims
Net policy benefit and claims represent the present value of future benefits to be paid to or on behalf of policyholders and related expenses less the present value of future net premiums. The liability is measured for each group of contracts (i.e., cohorts) using current cash flow assumptions. Contracts are grouped into cohorts by line of business, product type and cash flow streams, based on the date the policy was acquired (which for the entire LTC portfolio is the date of the acquisition of Ability). Future policy benefit reserves are adjusted each period because of updating lifetime net premium ratios for differences between actual and expected experience with the retroactive effect of those variances recognized in current period earnings. Mount Logan reviews at least annually in the third quarter, future policy benefit reserves cash flow assumptions, and if the review concludes that the assumptions need to be updated, future policy benefit reserves are adjusted retroactively based on the revised net premium ratio using actual historical experience, updated cash flow assumptions, and the locked-in discount rate with the effect of those changes recognized in current period earnings.
As Mount Logan’s LTC business is in run-off, the locked-in discount rate is used for the computation of interest accretion on future policy benefit reserves recognized in earnings. However, cash flows used to estimate future policy benefit reserves are also discounted using an upper-medium grade (i.e., low credit risk) fixed-income instrument yield reflecting the duration characteristics of the liabilities and is updated each reporting period with changes recorded in Accumulated Other Comprehensive Income (“AOCI”). As a result, changes in the current discount rate at each reporting period are recognized as an adjustment to AOCI and not earnings each period, whereas, changes relating to cash flow assumptions are recognized in the Insurance Statement of Earnings (Loss).
49
Amortization of deferred acquisition costs
Mount Logan incurs significant costs in connection with its renewals for its MYGA business. Costs that are related directly to the successful acquisition or renewal of MYGA contracts are capitalized as Deferred Acquisition Costs (“DAC”). Such costs for Mount Logan are comprised mostly of incremental direct costs of contract acquisitions, which for Mount Logan are primarily commissions. Deferred acquisition costs will be amortized to expense on a straight-line basis, at the individual level over the expected term of the related contract.
All other acquisition-related costs, as well as all indirect costs, are expensed as incurred.
Compensation and Benefits
This consists of fixed salary, discretionary and non-discretionary bonuses.
Interest expense
This includes interest expense on the debt obligations.
General, administrative and other
General, administrative and other expenses include normal operating expenses, integration, restructuring and other non-operating expenses.
Other Financial Measures under U.S. GAAP
Income Taxes
Mount Logan’s income tax expense increased in the year ended December 31, 2025 compared to the year ended December 31, 2024. For the year ended December 31, 2025, Mount Logan incurred an income tax expense of $2.4 million while for the year ended December 31, 2024, Mount Logan incurred an income tax expense of $0.6 million. Income taxes were higher in 2025 due to a valuation allowance that has been established to offset certain deferred tax assets as management determined that it is more likely than not that such deferred tax assets will not be realized, increasing the deferred tax expense for the 2025 period.
Managing Business Performance - Key Segment and Non-GAAP Performance Measures
Mount Logan believes that the presentation of Segment Income supplements a reader’s understanding of the economic operating performance of each of Mount Logan’s segments.
Segment Income is the key performance measure used by management in evaluating the performance of the Asset Management and Insurance Solutions segments. See Note 23. Segments to the consolidated financial statements for more details regarding the components of Segment Income and management’s consideration of Segment Income. Mount Logan believes that Segment Income is helpful for an understanding of Mount Logan’s business and that investors should review the same supplemental financial measure that management uses to analyze Mount Logan’s segment performance. Segment Income is a measure of profitability and has certain limitations in that it does not take into account certain items included under U.S. GAAP. This measure supplements and should be considered in addition to and not in lieu of the results of operations discussed in “Overview of Results of Operations” that have been prepared in accordance with U.S. GAAP.
Fee Related Earnings and Spread Related Earnings
FRE is a component of Segment Income that is used to assess the performance of the Asset Management segment. FRE is the sum of (i) management fees, (ii) performance fees received from certain managed funds, (iii) advisory and transaction fees, (iv) equity investment earnings related to fee generating vehicles, (v) interest income attributable to investment management activity, and (vi) other fee-related income derived from the Company’s Profit-Sharing Agreement less (a) fee-related compensation, excluding equity-based compensation, and (b) other associated operating expenses, which excludes amortization of acquisition-related intangible assets and interest and other credit facility expenses.
FRE excludes non-fee generating revenues and expenses, transaction-related charges, equity-based compensation costs, the amortization and/or impairment of intangible assets, the operating results of VIEs that are included in the consolidated financial statements, and any other non-recurring income and expenses. In addition, FRE excludes interest and other financing costs related to the Company not attributable to any specific segment, and corporate overhead expenses incurred to support the operations of the business rather than directly fee-related. Management considers these types of
50
costs corporate in nature, and are included only for reconciliation purposes to income (loss) before income tax (provision) benefit.
Spread Related Earnings (“SRE”) is a component of Segment Income that is used to assess the performance of the Insurance Solutions segment, excluding certain market volatility, which consists of investment gains (losses), other income and certain general, administrative & other expenses. For the Insurance Solutions segment, SRE equals the sum of (i) the net investment earnings on Insurance Solutions segment’s net invested assets (excluding investment earnings on funds held under reinsurance contracts and Modco agreement), less (ii) cost of funds (as described below), (iii) compensation and benefits, (iv) interest expense and (v) operating expenses.
Cost of funds includes liability costs associated with the crediting cost on MYGA liabilities as well as other liability costs. Other liability costs include DAC amortization, the cost of liabilities associated with LTC, net of reinsurance, which includes change in reserves, premiums, actual claim experience including related expenses and certain product charges related to MYGA.
Mount Logan uses FRE and SRE, which are non-GAAP measures, as measures of operating performance, not as measures of liquidity. These measures should not be considered in isolation or as a substitute for net income or other income data prepared in accordance with U.S. GAAP. The use of these measures without consideration of their related U.S. GAAP measures is not adequate due to the adjustments described above. See “—Segment Analysis” for reconciliations of Segment Income, FRE and SRE to their most directly comparable measures under U.S. GAAP.
Results of Operations
Below is a discussion of Mount Logan’s consolidated statements of operations for the years ended December 31, 2025 and 2024. For additional analysis of the factors that affected Mount Logan’s results at the segment level, see “Segment Analysis” below:
51
| Years Ended December 31, | ||||||||||||||||||||||||||
| 2025 | 2024 | Change ($) | Change (%) | |||||||||||||||||||||||
| ($ in thousands) | ||||||||||||||||||||||||||
| REVENUES | ||||||||||||||||||||||||||
| Asset Management | ||||||||||||||||||||||||||
| Management fees | $ | 9,532 | $ | 11,131 | $ | (1,599) | (14) | % | ||||||||||||||||||
| Incentive fees | 1,613 | 3,198 | (1,585) | (50) | % | |||||||||||||||||||||
| Advisory and transaction fees, net | 798 | — | 798 | NM | ||||||||||||||||||||||
| Equity investment earning | 1,023 | 680 | 343 | 50 | % | |||||||||||||||||||||
| 12,966 | 15,009 | (2,043) | (14) | % | ||||||||||||||||||||||
| Insurance Solutions | ||||||||||||||||||||||||||
| Net Premiums | (17,200) | (15,479) | (1,721) | 11 | % | |||||||||||||||||||||
| Product charges | 1,877 | 266 | 1,611 | 606 | % | |||||||||||||||||||||
| Net investment income | 63,423 | 74,638 | (11,215) | (15) | % | |||||||||||||||||||||
| Net gains (losses) from investment activities | 6,217 | (8,211) | 14,428 | (176) | % | |||||||||||||||||||||
| Net revenues of consolidated variable interest entities | 13,166 | 15,082 | (1,916) | (13) | % | |||||||||||||||||||||
| Net investment income (loss) on funds withheld | (27,192) | (32,056) | 4,864 | (15) | % | |||||||||||||||||||||
| Other income | 309 | 541 | (232) | (43) | % | |||||||||||||||||||||
| 40,600 | 34,781 | 5,819 | 17 | % | ||||||||||||||||||||||
| Total revenues | 53,566 | 49,790 | 3,776 | 8 | % | |||||||||||||||||||||
| EXPENSES | ||||||||||||||||||||||||||
| Asset Management | ||||||||||||||||||||||||||
| Administration and servicing fees | 7,802 | 5,895 | 1,907 | 32 | % | |||||||||||||||||||||
| Transaction costs | 9,501 | 2,174 | 7,327 | 337 | % | |||||||||||||||||||||
| Compensation and benefits | 8,392 | 8,412 | (20) | — | % | |||||||||||||||||||||
| Amortization and impairment of intangible assets | 14,978 | 3,582 | 11,396 | 318 | % | |||||||||||||||||||||
| Interest and other credit facility expenses | 7,810 | 7,001 | 809 | 12 | % | |||||||||||||||||||||
| General, administrative and other | 13,138 | 6,480 | 6,658 | 103 | % | |||||||||||||||||||||
| 61,621 | 33,544 | 28,077 | 84 | % | ||||||||||||||||||||||
| Insurance Solutions | ||||||||||||||||||||||||||
Net policy benefit and claims (remeasurement gain on policy liabilities of $9,872 and $16,237 for the year ended December 31, 2025 and 2024, respectively) | (2,222) | (10,091) | 7,869 | (78) | % | |||||||||||||||||||||
| Interest sensitive contract benefits | 16,076 | 14,972 | 1,104 | 7 | % | |||||||||||||||||||||
| Amortization of deferred acquisition costs | 3,126 | 2,175 | 951 | 44 | % | |||||||||||||||||||||
| Compensation and benefits | 543 | 1,367 | (824) | (60) | % | |||||||||||||||||||||
| Interest expense | 1,541 | 1,313 | 228 | 17 | % | |||||||||||||||||||||
General, administrative and other (including related party amounts of $6,972 and $7,169 for the year ended December 31, 2025 and 2024, respectively) | 14,394 | 16,276 | (1,882) | (12) | % | |||||||||||||||||||||
| Goodwill impairment | 25,504 | — | 25,504 | NM | ||||||||||||||||||||||
| 58,962 | 26,012 | 32,950 | 127 | % | ||||||||||||||||||||||
| Total expenses | 120,583 | 59,556 | 61,027 | 102 | % | |||||||||||||||||||||
| Investment and other income (Loss) - Asset Management | ||||||||||||||||||||||||||
| Net gains (losses) from investment activities | 2,021 | (1,531) | 3,552 | (232) | % | |||||||||||||||||||||
| Dividend income | 98 | 356 | (258) | (72) | % | |||||||||||||||||||||
| Interest income | 1,278 | 1,091 | 187 | 17 | % | |||||||||||||||||||||
| Other income (loss), net | 702 | 69 | 633 | 917 | % | |||||||||||||||||||||
| Gain on acquisition | 4,457 | — | 4,457 | NM | ||||||||||||||||||||||
| Total investment and other income (loss) | 8,556 | (15) | 8,571 | NM | ||||||||||||||||||||||
| Income (loss) before taxes | (58,461) | (9,781) | (48,680) | 498 | % | |||||||||||||||||||||
| Income tax (expense) benefit — Asset Management | (2,386) | (606) | (1,780) | 294 | % | |||||||||||||||||||||
| Net income (loss) | $ | (60,847) | $ | (10,387) | $ | (50,460) | 486 | % | ||||||||||||||||||
______________
Note: “NM” denotes not meaningful.
52
Year Ended December 31, 2025 Compared to Year Ended December 31, 2024
In this section, references to 2025 refer to the year ended December 31, 2025 and references to 2024 refer to the year ended December 31, 2024.
Asset Management Segment
Revenues
Revenues were $13.0 million in 2025, a decrease of $2.0 million from $15.0 million in 2024, driven by a decrease in incentive fees and management fees, partially offset by an increase in equity investment earnings and new advisory and transaction fees earned in the fourth quarter of 2025.
The $1.6 million decrease in incentive fees was primarily driven by investment write-downs in the Ovation funds which resulted in $nil Ovation incentive fees being earned in 2025, compared to $1.5 million fees earned in 2024. Given the underlying Ovation fund is in wind down, no further incentive fees are anticipated to be earned going forward.
Management fees decreased $1.6 million primarily due to the merging of Logan Ridge into Portman on July 15, 2025, and the continued wind down of the Ovation funds. The existing Logan Ridge Investment Management Agreement (“IMA”) was terminated upon the Logan Ridge and Portman Ridge merger and therefore, the Company’s management fee stream from Logan Ridge ceased. The Ovation fee stream decreased as the fund continues to wind down. The decrease in fees was partially offset by the Vista investment management agreement, which commenced during the first quarter of 2025 and the increase in AUM across OCIF and a closed end private fund sub-advised by ML Management.
Equity investment earnings increased by $0.3 million due to favorable net income from SCIM, which was primarily driven by the decrease in professional fee spend due to active management efforts to reduce costs and elimination of the legacy cost reimbursement program at SCIM upon the Logan Ridge and Portman Ridge merger. SCIM was the adviser of Portman Ridge and effective July 15, 2025, upon closing of the merger of Logan Ridge and Portman Ridge, became the advisor to the combined company, renamed BCP Investment Corporation (“BCIC”).
New advisory and transaction fees of $0.8 million were earned in the fourth quarter of 2025, as the Company began earning origination fees related to assets originated into the Ability investment portfolio by ML Management, and transaction structuring fees for third parties.
Expenses
Expenses were $61.6 million in 2025, an increase of $28.1 million from $33.5 million in 2024, primarily driven by expenses that are one-time or non-recurring in nature as the Company completed its merger with TURN and its continued efforts to consolidate investment vehicles within its asset management segment. The key components of this increase are as follows:
Transaction costs increased $7.3 million in 2025 primarily due to deal costs related to Mount Logan’s merger with TURN. Refer to Note 3. Business combinations of the consolidated financial statements for further details.
Amortization and impairment of intangible assets increased $11.4 million in 2025 due to the impairment of the Logan Ridge IMA as the entity merged with Portman Ridge, as discussed above. The impairment charge of $19.2 million was offset by a gain recorded upon recognition of a new profit sharing agreement between the Company and the parent entity of SCIM whereby the Company is entitled to receive 16.03% of the distributions received by the parent entity. Given SCIM is the manager of BCIC, the Company’s profit sharing interest under the agreement is driven by BCIC management and performance fees. The value of the profit sharing agreement was determined to be $8.2 million and is considered an indefinite lived intangible asset. Income earned as a result of the profit sharing agreement is recorded as “Other income (loss), net” on the consolidated statement of operations. Further, amortization expense increased in 2025 compared to 2024 due to adjustments to the remaining useful life and amortization method of the IMA purchased in the Ovation GP acquisition, as the underlying fund is being wound down. Further, impairment of the Ovation IMA was also taken in the fourth quarter of 2025 in relation to matters concerning the AIF fund that will impact future management fee cash flows under the IMA.
53
General, administrative and other expenses increased $6.7 million in 2025 primarily due to increased expenses relating to ML Management being the registered investment advisor to Logan Ridge and AIF, as well as increased legal and consulting costs. ML Management entered into an agreement in connection with the Logan-Portman merger, whereby upon the closing of the merger, as Logan Ridge’s investment adviser, ML Management financed a pre-closing cash dividend to Logan Ridge shareholders. Included in this figure is the incurrence of certain one-time legal fees associated with the investigation of misconduct by a former employee of ML Management, as well as reimbursements of $0.7 million to a portfolio company of AIF and potential future reimbursements of as much as $1.5 million to AIF and its portfolio company in relation to such misconduct.
Interest and other credit facility expenses increased $0.8 million in 2025 due to increased borrowings from upsizing our existing credit facility during the fourth quarter of 2024 and the amortization of deferred financing costs associated with the upsize, and growing paid in kind interest on the debenture units.
Compensation and benefits remained flat while administration and servicing fees increased $1.9 million in 2025 primarily due to the Company’s employees being transferred to BCPA on October 1, 2025. This effectively resulted in direct compensation costs being exchanged for administrative fees charged by BCPA as servicing agent. As such, the decrease in on-going compensation costs related to these transferred employees was offset by the increase in administrative fees. Total compensation and benefits did not decrease from this effective reclass, due to increased costs associated with the acceleration of RSUs vesting upon change in control related to Mount Logan’s merger with TURN and severance costs for several individuals.
Administration and servicing fees were otherwise relatively flat in 2025 compared to 2024 as the increase in administrative fees was offset by decreases in servicing fees. Administrative fees paid to BCPA increased by $1.5 million due to increased reliance on BCPA for services provided under the Servicing Agreement. The decrease in servicing fees was due to the decrease in net economic loss attributable to Mount Logan’s servicing agreement with SCIM by $0.4 million. Mount Logan’s servicing agreement with SCIM is for ACIF, an interval fund, and is calculated as the gross management and incentive fees paid by ACIF net of expenses incurred under the servicing agreement. The decrease in economic loss attributable to the servicing agreement with SCIM was primarily driven by a decrease in expenses under the agreement due to compensation costs moving directly to Mount Logan, and non-recurring costs incurred in 2024 related to ACIF expense write-offs. Administrative expenses related to a closed end private fund sub-advised by ML Management also decreased due to active management efforts to reduce costs.
Investment and Other Income (Loss)
Total investment and other income increased $8.6 million primarily driven by a $4.5 million gain realized upon the reverse acquisition of TURN on September 12, 2025 (refer to Note 3. Business combinations of the consolidated financial statements for further details regarding this transaction), realized gains on OCIF redemptions and subsequent sale of investments acquired in the TURN acquisition, unrealized gains on the minority investment in Runway Growth Capital, and unrealized gains on the seller note issued in relation to the Capitala acquisition (refer to Note 12. Debt obligations of the consolidated financial statements for further details regarding Mount Logan’s debt obligations). The remaining increase was driven by income earned as a result of the Profit-Sharing Agreement in the second half of 2025. Refer to Note 22. Related parties of the consolidated financial statements for further details regarding the Profit-Sharing Agreement.
The increase in total investment and other income was partially offset by a decrease in dividend income from the partial redemption of OCIF shares.
Insurance Solutions Segment
Revenues
Revenues were $40.6 million in 2025, an increase of $5.8 million from $34.8 million in 2024. The increase was primarily driven by increases in net gains (losses) from investment activities, net investment income (loss) on funds withheld and product charges. These increases were partially offset by decreases in net investment income, net revenue of consolidated VIEs, and net premiums.
Net gains (losses) from investment activities were gains of $6.2 million in 2025, an increase of $14.4 million from losses of ($8.2) million in 2024, primarily due to a favorable change in the fair value of assets, partially offset by higher
54
realized losses. The favorable change in the fair value of assets was primarily driven by a decrease in yield in 2025 compared to 2024.
Net investment income (loss) on funds withheld were a loss of ($27.2) million in 2025, which reflects an increase of $4.9 million from a loss of ($32.1) million in 2024. This increase was primarily driven by decline in income attributable to funds withheld assets due to lower interest income and higher realized losses and investment management expenses in 2025 compared to 2024.
Product charges were $1.9 million in 2025, which reflects an increase of $1.6 million from $0.3 million in 2024, primarily driven by an increase in surrenders of MYGA policies in 2025 compared to 2024 which resulted in higher surrender charges/product charges paid by policyholders in 2025.
Net investment income was $63.4 million in 2025, a decrease of $11.2 million from $74.6 million in 2024, primarily due to the lower interest rate environment, higher management and incentive fees on Vista assets and also due to the write off of accrued interest on certain defaulted mortgages amounting to $2.3 million.
Net revenues of consolidated VIEs were $13.2 million in 2025, a decrease of $1.9 million from $15.1 million in 2024, primarily driven by lower interest income due to lower interest rate environment and higher realized losses in 2025 compared to 2024, partially offset by lower unrealized losses in 2025.
Net premiums were ($17.2) million in 2025, a decrease of $1.7 million from ($15.5) million in 2024. The negative net premium reflects ceded premiums exceeding direct and assumed premiums within the LTC business, primarily due to additional ceded premiums paid to transfer a substantial portion of LTC related risk under a reinsurance arrangement. The decrease in net premiums was primarily driven by a decrease of $3.0 million in direct and assumed premiums compared to 2024, partially offset by a decrease of $1.3 million in ceded premium related to the LTC business compared to 2024.
Expenses
Expenses were $59.0 million in 2025, an increase of $33.0 million from $26.0 million in 2024. The increase was driven by increases in net policy benefit and claims, interest sensitive contract benefits, DAC amortization and goodwill impairment. These increases were partially offset by a decrease in general, administrative & other expenses.
Net policy benefits and claims were $(2.2) million in 2025, an increase of $7.9 million from ($10.1) million in 2024, primarily driven by unfavorable in-force update to the LTC business in 2025 which had a favorable impact in 2024. Also, there was a higher provision for credit losses on reinsurance recoverable.
Interest sensitive contract benefits were $16.1 million in 2025, an increase of $1.1 million from $15.0 million in 2024, primarily driven by interest accretion on the MYGA block assumed from NSG in the second quarter of 2025.
DAC amortization was $3.1 million in 2025, an increase of $1.0 million from $2.2 million in 2024, primarily due to the acquisition cost related to additional MYGA block assumed from NSG in the second quarter of 2025, as well as due to increased surrenders of existing MYGA policies in 2025 compared to 2024.
General, administrative and other expenses were $14.4 million in 2025, a decrease of $1.9 million from $16.3 million in 2024. Expenses were lower in 2025 primarily due to a reduction in new MYGA business in 2025 compared to 2024, which decreased MYGA related costs. Valuation costs also decreased in 2025 following the transition to a new valuation service provider in the fourth quarter of 2024. Additionally, consulting and legal expenses also declined. These decreases were partially offset by one time setup cost associated with the direct writing of MYGA business, which is expected to commence in 2026.
The Company performed its annual goodwill impairment assessment in the fourth quarter of 2025 and Insurance Solutions recorded a $25.5 million charge to fully impair the goodwill in the LTC reporting unit. There was no goodwill impairment in 2024.
Income Tax (Provision) Benefit
Mount Logan’s income tax expense was $2.4 million in 2025, an increase from the income tax expense of $0.6 million in 2024. Income taxes were higher in 2025 due to the valuation allowance established to offset certain deferred tax
55
assets as management determined that it is more likely than not that such deferred tax assets will not be realized, driving up the deferred tax expense for the 2025 period. The (provision) benefit for income taxes includes federal, state, local and foreign income taxes, resulting in an effective income tax rate of (4.1%) and (6.2%) for 2025 and 2024, respectively. The most significant reconciling items between the U.S. federal statutory income tax rate and the effective income tax rate were due to transaction costs which are treated as a permanent difference for tax purposes. See Note 18. Income taxes to the consolidated financial statements for further details regarding Mount Logan’s income tax (provision) benefit.
Segment Analysis
Discussed below are Mount Logan’s results of operations for each of Mount Logan’s reportable segments. They represent the segment information available and utilized by management to assess performance and to allocate resources. See Note 23. Segments to Mount Logan’s consolidated financial statements for more information regarding Mount Logan’s segment reporting.
We present certain performance measures for our reportable segments that are not calculated in accordance with U.S. GAAP, including FRE and SRE. Our management believes FRE and SRE are useful in evaluating our operating performance and by providing these non-GAAP measures, management intends to provide investors, securities analysts and other interested parties with a meaningful, consistent comparison of the Company’s profitability for the periods presented. These non-GAAP measures are not intended to be a substitute for U.S. GAAP financial measures and, as calculated, may not be comparable to other similarly titled measures of performance of other companies in other industries or within the same industry.
Asset Management
The following tables presents FRE, the performance measure of Mount Logan’s Asset Management segment.
| Years Ended December 31, | ||||||||||||||||||||||||||
| 2025 | 2024 | Change ($) | Change (%) | |||||||||||||||||||||||
| Asset Management | ||||||||||||||||||||||||||
| Management fees | $ | 15,575 | $ | 16,758 | $ | (1,183) | (7) | % | ||||||||||||||||||
| Incentive fees | 1,613 | 3,198 | (1,585) | (50) | % | |||||||||||||||||||||
| Advisory and transaction fees, net | 798 | — | 798 | NM | ||||||||||||||||||||||
| Equity investment earnings | 1,023 | 680 | 343 | 50 | % | |||||||||||||||||||||
Interest income¹ | 1,087 | 1,091 | (4) | — | % | |||||||||||||||||||||
| Other fee-related income | 367 | — | 367 | NM | ||||||||||||||||||||||
| Fee-related compensation | (4,962) | (5,665) | 703 | (12) | % | |||||||||||||||||||||
| Other operating expenses: | ||||||||||||||||||||||||||
| Administration and servicing fees | (4,313) | (4,290) | (23) | 1 | % | |||||||||||||||||||||
| General, administrative and other | (2,704) | (2,693) | (11) | — | % | |||||||||||||||||||||
| Fee related earnings | $ | 8,484 | $ | 9,079 | $ | (595) | (7) | % | ||||||||||||||||||
______________
Note: “NM” denotes not meaningful.
(1)Represents interest income on a loan asset related to a fee generating vehicle.
Year Ended December 31, 2025 Compared to Year Ended December 31, 2024
In this section, references to 2025 refer to the year ended December 31, 2025, and references to 2024 refer to the year ended December 31, 2024.
FRE was $8.5 million in 2025, a decrease of $0.6 million compared to $9.1 million in 2024. This decrease was primarily attributable to the decline in management and incentive fees. The decline in management and incentive fees over-shadowed the increase in equity investment earnings and other fee-related income, and new advisory and transaction fees earned in the fourth quarter of 2025.
Management fees decreased by $1.2 million primarily due to the merging of Logan Ridge into Portman Ridge on July 15, 2025, and the wind down of the Ovation funds. The existing Logan Ridge IMA was terminated and therefore, the Company’s management fee stream from Logan Ridge ceased. The Ovation fee stream decreased as the fund continues to
56
wind down. The decrease in fees was partially offset by the Vista investment management agreement, which commenced during the first quarter of 2025 and the increase in AUM across OCIF and Ability.
Incentive fees decreased by $1.6 million primarily driven by investment write-downs in the Ovation funds which resulted in $nil Ovation incentive fees being earned in 2025, compared to $1.5 million in fees earned in 2024. Given the underlying Ovation fund is in wind down, no further incentive fees are anticipated to be earned going forward.
Fee-related compensation decreased in-line with underlying vehicle performance, consistent with decreasing fee revenue.
Equity investment earnings increased by $0.3 million due to favorable net income earned by SCIM, which was primarily driven by the decrease in professional fee spend due to active management efforts to reduce costs and the elimination of the legacy cost reimbursement program at SCIM upon the Logan Ridge and Portman Ridge merger.
Other fee-related income represents the income earned from the Profit-Sharing Agreement entered into in July 2025 between Mount Logan and the owner of SCIM. This fee represents 16.03% of the distributions received by the parent entity of SCIM via the Profit-Sharing Agreement.
New advisory and transaction fees were earned in the fourth quarter of 2025, as the Company started earning origination fees related to assets originated into the Ability investment portfolio by ML Management, and transaction structuring fees for third parties.
Administration and servicing fees remained relatively flat. Servicing fees under the SCIM agreement regarding ACIF decreased by $0.4 million due to compensation costs moving directly to Mount Logan’s fee-related compensation line and non-recurring costs incurred in 2024 related to ACIF expense write-offs. Administrative expenses related to a closed end private fund sub-advised by ML Management decreased due to active management efforts to reduce costs. These decreases to administration and servicing fees were offset by the increase in administration fees charged by BCPA due to increased reliance on BCPA for services provided under the servicing agreement.
General, administrative and other expenses also remained relatively flat as the expiration of transition services agreements on assets purchased, and the decrease in professional services fee spend due to active management efforts to reduce costs was offset by the allocation of shared expenses between BCPA and the Company.
Asset Management Operating Metrics
Assets Under Management
The following presents Mount Logan’s total AUM by vehicle (in millions):
| Year ended December 31, | ||||||||||||||||||||||||||||||||||||||||||||
| 2025 | ||||||||||||||||||||||||||||||||||||||||||||
| (in millions) | Ability (including consolidated VIEs) 1 | BDCs 2 | CLOs 3 | Interval Funds 4 | Ovation Funds | Other 5 | Total | |||||||||||||||||||||||||||||||||||||
Change in Total AUM6 | ||||||||||||||||||||||||||||||||||||||||||||
| Beginning of Period | $ | 746 | $ | 305 | $ | 564 | $ | 409 | $ | 211 | $ | 111 | $ | 2,346 | ||||||||||||||||||||||||||||||
| Inflows | 136 | 52 | — | 130 | — | 8 | 326 | |||||||||||||||||||||||||||||||||||||
| Outflows | (21) | (75) | — | (133) | (111) | (62) | (402) | |||||||||||||||||||||||||||||||||||||
| Net Flows | 115 | (23) | — | (3) | (111) | (54) | (76) | |||||||||||||||||||||||||||||||||||||
| Realizations | — | (11) | (113) | (28) | (13) | (2) | (167) | |||||||||||||||||||||||||||||||||||||
| Market activity and other | 12 | (78) | (10) | 32 | 21 | 14 | (9) | |||||||||||||||||||||||||||||||||||||
Inter-vehicle eliminations7 | — | — | — | (4) | — | — | (4) | |||||||||||||||||||||||||||||||||||||
| End of Period | $ | 873 | $ | 193 | $ | 441 | $ | 406 | $ | 108 | $ | 69 | $ | 2,090 | ||||||||||||||||||||||||||||||
57
| Year ended December 31, | ||||||||||||||||||||||||||||||||||||||||||||
| 2024 | ||||||||||||||||||||||||||||||||||||||||||||
| (in millions) | Ability (including consolidated VIEs) 1 | BDCs 2 | CLOs 3 | Interval Funds 4 | Ovation Funds | Other 5 | Total | |||||||||||||||||||||||||||||||||||||
Change in Total AUM6 | ||||||||||||||||||||||||||||||||||||||||||||
| Beginning of Period | $ | 695 | $ | 334 | $ | 634 | $ | 343 | $ | 255 | $ | 66 | $ | 2,327 | ||||||||||||||||||||||||||||||
| Inflows | 73 | 116 | — | 147 | 8 | 44 | 388 | |||||||||||||||||||||||||||||||||||||
| Outflows | (23) | (173) | — | (73) | (7) | (3) | (279) | |||||||||||||||||||||||||||||||||||||
| Net Flows | 50 | (57) | — | 74 | 1 | 41 | 109 | |||||||||||||||||||||||||||||||||||||
| Realizations | — | (34) | (68) | (32) | (26) | — | (160) | |||||||||||||||||||||||||||||||||||||
| Market activity and other | 1 | 62 | (2) | 25 | (19) | 4 | 71 | |||||||||||||||||||||||||||||||||||||
Inter-vehicle eliminations7 | — | — | — | (5) | — | — | (5) | |||||||||||||||||||||||||||||||||||||
| End of Period | $ | 746 | $ | 305 | $ | 564 | $ | 405 | $ | 211 | $ | 111 | $ | 2,342 | ||||||||||||||||||||||||||||||
_______________
(1)Ability’s AUM excludes assets held under the funds withheld and Modco agreements, and includes a portion of the Vista assets to which ML Management was appointed as the investment manager of, effective March 2025.
(2)Mount Logan owns a 24.99% interest in SCIM, which is the manager of BCP Investment Corporation (“BCIC”). Under the Profit-Sharing Agreement with BCPSC, the majority owner of SCIM, Mount Logan receives 16.03% of their SCIM distribution. BCIC is the new merged entity of Portman Ridge and Logan Ridge, which closed on July 15, 2025. Prior to Logan Ridge merging into Portman, ML Management was the manager of Logan Ridge.
(3)ML Management is the adviser to two CLOs 2018-01 and 2019-01.
(4)ML Management is the adviser to OCIF. Separately Mount Logan receives the economics of ACIF, which is an interval fund advised by SCIM, via a servicing agreement with SCIM over ACIF.
(5)Consists of several small closed end private funds and AUM which is sub-advised by ML Management.
(6)Inflows generally represent new capital which includes capital contributions, subscriptions, dividend reinvestments, draw downs on leverage facilities, and new MYGA flows and managed reinsurance assets added at Ability. Outflows include redemptions, pay downs on leverage facilities, and claims and benefits payments at Ability. Realizations represent distributions of realized income, repurchases of capital, and repayments on CLO notes. Market activity and other generally represents realized and unrealized gains (losses) on investments and other changes in AUM.
(7)Represents ACIF’s investment in OCIF.
(8)Several of the above funds are still subject to their reporting period audits or reviews, thus the AUM quoted above represents management’s best estimate of AUM as of December 31, 2025, but may be subject to change.
Year Ended December 31, 2025 Compared to Year Ended December 31, 2024
Total AUM was $2.1 billion at December 31, 2025, a $0.3 billion decrease from $2.3 billion at December 31, 2024. The decrease is attributable to decreases in AUM across the BDCs, CLOs, Interval funds, Ovation funds, and small closed end private funds. BDC assets decreased due to the termination of the Logan Ridge IMA. CLO assets will continue to decline given both are in post reinvestment period and continue to harvest their assets. The decrease in ACIF AUM was driven by redemptions and distributions slightly outweighed the increase in OCIF AUM which was driven by subscriptions and line of credit draw downs. Ovation funds’ AUM will also continue to decline pursuant to their wind down. The AUM of a small closed end private fund decreased due to a capital distribution after realizing its last investment, and the AUM ML Management sub-advises decreased due to distributions and redemptions. The total decrease in AUM was offset by increases in AUM attributable to growth in Ability’s AUM from additional capital contributions, the addition of a portion of the Vista portfolio of assets to which Mount Logan has been appointed manager effective March 2025, and new MYGA business assumed.
58
Insurance Solutions
The following table presents Spread Related Earnings, the performance measure of Mount Logan’s Insurance Solutions segment:
| Years Ended December 31, | ||||||||||||||||||||||||||
| 2025 | 2024 | Change ($) | Change (%) | |||||||||||||||||||||||
| Insurance Solutions | ||||||||||||||||||||||||||
| Net investment income and realized gain (loss), net | $ | 47,147 | $ | 53,477 | $ | (6,330) | (12) | % | ||||||||||||||||||
| Cost of funds | (32,303) | (22,269) | (10,034) | 45 | % | |||||||||||||||||||||
| Compensation and benefits | (543) | (1,367) | 824 | (60) | % | |||||||||||||||||||||
| Interest expense | (1,541) | (1,313) | (228) | 17 | % | |||||||||||||||||||||
| General, administrative and other | (12,764) | (14,788) | 2,024 | (14) | % | |||||||||||||||||||||
| Spread related earnings | $ | (4) | $ | 13,740 | $ | (13,744) | (100) | % | ||||||||||||||||||
In this section, references to 2025 refer to the year ended December 31, 2025, and references to 2024 refer to the year ended December 31, 2024.
Spread Related Earnings
SRE was $nil in 2025, a decrease of $13.7 million, or 100%, compared to $13.7 million in 2024. The decrease in SRE was primarily driven by lower investment income and realized gains (losses) and higher cost of funds, partially offset by lower general, administrative & other expenses.
Net investment income and realized gains (losses) decreased by $6.3 million. Net investment income decreased due to lower treasury yields and higher realized losses in 2025 compared to 2024.
Cost of funds increased by $10.0 million, primarily driven by unfavorable in-force update to the LTC business in 2025 which had a favorable impact in 2024. Also, there was an increased DAC amortization from the assumption of the NSG MYGA block in the second quarter of 2025, as well as lower premium volume experienced in the LTC business in 2025.
General, administrative and other expenses decreased by $2.0 million in 2025 due to a reduction in new MYGA business in 2025 compared to 2024, which reduced MYGA related costs. Additionally, consulting and legal expenses declined and valuation costs were reduced in 2025 following the transition to a new valuation service provider in the fourth quarter of 2024.
Net Investment Spread
| Years Ended December 31, | ||||||||||||||||||||
| 2025 | 2024 | Change | ||||||||||||||||||
| Net investment income and realized gain or (loss), net | 6.13% | 7.43% | (130)bps | |||||||||||||||||
| Cost of funds¹ | (5.48)% | (5.35)% | (13)bps | |||||||||||||||||
| Net Investment spread | 0.65% | 2.08% | (143)bps | |||||||||||||||||
_______________
(1)Excludes changes in future policy benefits liabilities of LTC line of business, to calculate net investment spread, which result from changes in actuarial assumptions and future cash flow projections.
Net investment spread was 0.65% in 2025, a decrease of 143 basis points compared to 2.08% in 2024, primarily driven by lower net investment income and realized gain or (loss) and higher cost of funds in 2025 compared to 2024.
Net investment income and realized gain or (loss) percent represents the percent of net investment income and realized gain (loss) over average net invested assets. Net investment income and realized gain (loss) was 6.13% in 2025, a decrease of 130 basis points compared to 7.43% in 2024, primarily driven by higher average net invested assets (including cash on hand), lower treasury yields, and higher realized losses.
Cost of funds percent represents the percent of cost of funds over average net invested assets. Cost of funds were higher in 2025 compared to 2024 primarily due to the unfavorable in-force update and claims experience in the LTC
59
business, increased DAC amortization due to the assumption of the NSG MYGA block and increased surrenders of existing MYGA policies.
Net invested assets represent investments that directly back the Insurance Solutions segment’s net reserve liabilities as well as surplus assets. Net invested assets for Insurance Solutions segment includes (a) total investments on the consolidated statements of financial position, with available-for-sale securities, trading securities and mortgage loans at cost or amortized cost, (b) cash and cash equivalents and restricted cash, (c) investments in related parties, (d) accrued investment income, (e) VIE assets, and (f) net investment payables and receivables. Net invested assets exclude the investment assets under funds withheld arrangement with FSR and assets under Modco agreement with Vista. Net invested assets also exclude mark-to-market adjustment (net unrealized gains (losses)) including provision for credit losses recognized in consolidated statement of operations during the year.
Investment Portfolio and Net Investment Spread
Ability had total investments, including related parties and consolidated VIEs, of $1,077 million and $1,041 million as of December 31, 2025, and December 31, 2024, respectively. Total investments have increased by 3% compared to 2024, which is primarily driven by lower yields, which resulted in an increase in the value of investments. Ability’s investment strategy seeks to achieve sustainable risk-adjusted returns through the disciplined management of its investment portfolio against its duration of liabilities. The investment strategies focus primarily on a buy and hold asset allocation strategy that may be adjusted periodically in response to changing market conditions and the nature of Ability’s liability profile. Ability takes advantage of its generally persistent liability profile by identifying investment opportunities with an emphasis on earning incremental yield by taking measured liquidity and complexity risk rather than assuming incremental credit risk. Ability has selected a diverse array of primarily high-grade fixed income assets including corporate bonds, structured securities and commercial real estate loans, among others. Ability also maintains holdings in floating rate and less rate-sensitive instruments, including CLOs, non-agency RMBS and various types of structured products, both as an expression of its macroeconomic views as well as to capture incremental returns versus fixed rate instruments. Depending on its market outlook, Ability will use financial hedges to increase or reduce its exposure to various macroeconomic factors, including interest rate, foreign currency exchange rate, and / or performance of market indices. In addition to its fixed income portfolio, Ability opportunistically allocates to alternative investments where it primarily focuses on fixed income-like, cash flow-based investments.
Segment Income
Segment Income is a measure of profitability and has certain limitations in that it does not take into account certain items included under U.S. GAAP. Segment Income is the sum of (i) FRE and (ii) SRE. The following presents a reconciliation of Net Income (loss) attributable to Mount Logan common shareholders to Segment Income:
60
| Years Ended December 31, | ||||||||||||||
| 2025 | 2024 | |||||||||||||
| Net income (loss) | $ | (60,847) | $ | (10,387) | ||||||||||
| Income tax (expense) benefit — Asset Management | (2,386) | (606) | ||||||||||||
| Income (loss) before taxes | (58,461) | (9,781) | ||||||||||||
| Asset Management Adjustments: | ||||||||||||||
| Intersegment management fee eliminations | 6,043 | 5,627 | ||||||||||||
Administration and servicing fees 1 | 2,236 | 1,605 | ||||||||||||
| Transaction costs | 9,501 | 2,174 | ||||||||||||
Compensation and benefits 1 | 1,885 | 2,173 | ||||||||||||
| Equity-based compensation | 1,476 | 363 | ||||||||||||
| Amortization and impairment of intangible assets | 14,978 | 3,582 | ||||||||||||
| Interest and other credit facility expenses | 7,810 | 7,001 | ||||||||||||
General, administrative and other 1 | 10,434 | 3,787 | ||||||||||||
| Net gains (losses) from investment activities | (2,021) | 1,531 | ||||||||||||
| Dividend income | (98) | (356) | ||||||||||||
| Interest income - bank interest | (191) | — | ||||||||||||
| Other income (loss), net | (335) | (69) | ||||||||||||
| Gain on acquisition | (4,457) | — | ||||||||||||
| Insurance Solutions Adjustments: | ||||||||||||||
| Equity-based compensation | 1,322 | 211 | ||||||||||||
| Net unrealized gains (losses) from investment activities | (2,424) | 9,651 | ||||||||||||
| Other income | (309) | (541) | ||||||||||||
| Intersegment management fee eliminations | (6,043) | (5,627) | ||||||||||||
General, administrative and other 2 | 1,630 | 1,488 | ||||||||||||
| Impairment loss - Goodwill | 25,504 | — | ||||||||||||
| Segment Income | $ | 8,480 | $ | 22,819 | ||||||||||
_______________
(1)Represents corporate overhead allocated to each segment.
(2)Represents costs incurred by the insurance segment for purposes of U.S. GAAP reporting but not the day-to-day operations of the insurance company.
Liquidity and Capital Resources
Overview
Mount Logan primarily derives revenues and cash flows from the assets we manage and the retirement savings products we issue and reinsure. Based on management’s experience, we believe that our current liquidity position, together with the cash generated from revenues will be sufficient to meet our anticipated expenses and other working capital needs for at least the next 12 months. For the longer-term liquidity needs of the Asset Management business, we expect to continue to fund the Asset Management business’s operations through management fees and incentive fees received. The principal sources of liquidity for the Insurance Solutions segment, in the ordinary course of business, are operating cash flows and holdings of cash, cash equivalents and other readily marketable assets. At December 31, 2025, we had $133.8 million of unrestricted cash and cash equivalents.
Primary Uses of Cash
Over the next 12 months, we expect our primary liquidity needs will be to:
•support the future growth of our businesses through strategic corporate investments;
•pay our operating expenses, including, general, administrative, and other expenses;
•make payments to policyholders for surrenders, withdrawals and payout benefits;
•make interest and principal payments on funding agreements;
61
•make share repurchases through its authorized share repurchase program;
•pay taxes; and
•pay cash dividends.
Over the long term, we believe we will be able to (i) grow our AUM and generate positive investment performance in the funds we manage, which we expect will allow us to grow our management fees and incentive fees and (ii) grow the investment portfolio of insurance solutions services, in each case in amounts sufficient to cover our long-term liquidity requirements, which may include:
•supporting the future growth of our businesses;
•creating new or enhancing existing products and investment platforms;
•making payments to policyholders;
•pursuing new strategic corporate investment opportunities; and
•paying interest and principal on our financing arrangements.
On January 26, 2026, we completed a public offering of $40.0 million in aggregate principal amount of 8.0% Notes due 2031 (the “Notes” and, such offering, the “Notes Offering”). The Notes will mature on January 31, 2031, unless previously redeemed or repurchased in accordance with their terms. The interest rate of the Notes is 8.00% per year and will be paid quarterly in arrears on January 30, April 30, July 30 and October 30 of each year, commencing April 30, 2026. The Notes are our direct senior unsecured obligations and rank pari passu with our existing and future unsecured, unsubordinated indebtedness; senior to any series of preferred stock that we may issue in the future; senior to any of our future indebtedness that expressly provides it is subordinated to the Notes; effectively subordinated to all of our existing and future secured indebtedness (including indebtedness that is initially unsecured to which we subsequently grant security), to the extent of the value of the assets securing such indebtedness; and structurally subordinated to all existing and future indebtedness and other obligations of any of our existing or future subsidiaries, financing vehicles or similar facilities. The Notes are listed on the Nasdaq Global Market and trade under the ticker symbol “MLCIL.”
On February 2, 2026, we completed a cash tender of $15.0 million of shares of our Common Stock at a fixed price of $9.43 per share, pursuant to which we purchased 1,590,601 shares of our Common Stock, which represented approximately 12% of our outstanding Common Stock (the “Tender Offer”).
On February 23, 2026, we announced that our board of directors has approved a $10.0 million share repurchase program through December 31, 2027 (the “Share Repurchase Program”). Under the Share Repurchase Program, repurchases may be made from time to time using a variety of methods, which may include open market purchases, privately negotiated transactions, or by other means in accordance with applicable securities laws and subject to market conditions and other factors. The size and timing of any repurchases will be determined by the Company at its discretion and will depend on factors including, but not limited to, prevailing stock prices, general economic and market conditions, along with other considerations. The program does not obligate the Company to repurchase any specific amount of Common Stock and may be suspended or discontinued at any time.
On March 5, 2026, the Board declared a cash dividend in the amount of $0.03 per share of Common Stock to be paid on April 15, 2026 to stockholders of record on March 30, 2026.
62
Cash Flow Analysis
The section below discusses in more detail our primary sources and uses of cash and the primary drivers of cash flows within our consolidated statements of cash flows:
| Years Ended December 31, | ||||||||||||||
| (in thousands) | 2025 | 2024 | ||||||||||||
| Operating activities | $ | (22,179) | $ | (37,768) | ||||||||||
| Investing activities | 50,856 | (26,497) | ||||||||||||
| Financing activities | 13,344 | 75,749 | ||||||||||||
| Cash, cash equivalents and restricted cash, and cash and cash equivalents of consolidated VIEs, end of period | $ | 143,725 | $ | 101,704 | ||||||||||
Operating Activities
Our operating activities support our Asset Management and Insurance Solutions businesses. The primary sources of cash within operating activities include: (a) management, performance and advisory and transaction fees, (b) insurance premiums, (c) reinsurance recoverable, (d) proceeds from sales of investments from Mount Logan’s consolidated VIEs and (e) cash interest received from investments. The primary uses of cash within operating activities include: (a) investment purchases from Mount Logan’s consolidated VIEs (b) compensation and non-compensation related expenses, (c) benefit payments, (d) cash interest paid on debt obligations and (e) other operating expenses. A significant use of cash within operating activities pertain to future policy benefits incurred in the LTC business. As the LTC business is in run-off, this activity is expected to have less of an impact to cash outflow over time.
During the years ended December 31, 2025 and December 31, 2024, cash used in operating activities reflects Asset Management expense reimbursements to BCPA under the Servicing Agreement for third-party costs incurred, interest expense on borrowings, compensation and quarterly tax payments. Cash used in operating activities also reflects net cash benefit payments associated with the LTC business, purchases of investments by consolidated VIEs, policy acquisition costs, and other operating expenses within Insurance Solutions. These outflows were partially offset by inflows of management fees, realized incentive fees, and distributions from SCIM within Asset Management, and investment income, reinsurance recoverables related to the LTC business and proceeds from the sale of investments held by consolidated VIEs within Insurance Solutions.
Investing Activities
Our investing activities support the growth of our business. The primary sources of cash within investing activities include sales, maturities and repayments of investments. The primary uses of cash within investing activities include: (a) acquisition of consolidated business(es) and (b) purchases and acquisitions of new investments. The cash flow activities related to MYGA products is split across investing activities and financing activities. As Mount Logan assumes new MYGA products, the receipt of cash is reported in financing activities and the corresponding purchase of securities is reported in investing activities. As a result, as the MYGA portfolio grows, these cash flow activities while related, will continue to present an inflow to financing activities and an outflow to investing activities.
•During the year ended December 31, 2025, cash provided by investing activities primarily reflects the net assets acquired from the merger with TURN, and sales, maturities and repayment of investments, partially offset by purchase of investments, mainly available-for-sale (“AFS”) and mortgage loans within Insurance Solutions.
•During the year ended December 31, 2024, cash used in investing activities primarily reflects the purchase of investments due to the deployment of significant cash inflows from the reinsurance of MYGA contracts within Insurance Solutions, partially offset by the sales, maturities and repayments of investments.
Financing Activities
Our financing activities reflect our capital market transactions and transactions with equity holders. The primary sources of cash within financing activities primarily include proceeds from debt issuances and proceeds from reinsurance of MYGA. The primary uses of cash within financing activities include dividends paid and repayments of debt.
63
•During the year ended December 31, 2025, cash provided by financing activities primarily reflects deposits from the assumption of the NSG MYGA block as well as increased borrowings in both the Insurance Solutions and Asset Management segments. These inflows were partially offset by surrenders or benefit payments related to MYGA policies (classified as investment-type contracts) within the Insurance Solutions segment, and the repayment of debt within the Asset Management segment, payment of dividends and repurchase of common shares.
•During the year ended December 31, 2024, cash provided by financing activities primarily reflects proceeds from the issuance of debenture units and upsize of the credit facility under the Asset Management segment and net inflows associated with the reinsurance of new MYGA contracts within the Insurance Solutions segment. These inflows were partially offset by repayments on borrowings within Asset Management and dividend payments and by surrenders or benefit payments related to MYGA policies (classified as investment-type contracts) within the Insurance Solutions segment,
Contractual Obligations, Commitments and Contingencies
For a summary and a description of the nature of Mount Logan’s commitments, contingencies and contractual obligations, see Note 24. Commitments and contingencies to the consolidated financial statements.
Consolidated VIEs
Mount Logan manages its liquidity needs by evaluating unconsolidated cash flows; however, Mount Logan’s financial statements reflect the financial position of Mount Logan as well as consolidated VIEs. The primary sources and uses of cash at Mount Logan's consolidated VIEs include: (a) proceeds from sales, maturities and repayments of investments and (b) purchase of investments.
Dividends and Distributions
For information regarding the quarterly dividends that were made to common shareholders and distribution equivalents on participating securities, see Note 19. Equity to the consolidated financial statements. Although Mount Logan currently expects to pay dividends, Mount Logan may not pay dividends if, among other things, Mount Logan does not have the cash necessary to pay the dividends. To the extent it does not have sufficient cash on hand to pay dividends, Mount Logan may have to borrow funds to pay dividends, or it may determine not to pay dividends. The primary source of funds for dividends is distributions from Mount Logan’s operating subsidiaries, which are expected to be adequate to fund dividends and other cash flow requirements based on current estimates of future obligations. The ability of these operating subsidiaries to make distributions to Mount Logan will depend on satisfying applicable law with respect to such distributions, including surplus and minimum solvency requirements among others. On March 13, 2025 Mount Logan declared a cash dividend of C$0.08 per share of its common stock, which was paid on April 10, 2025, to holders of record at the close of business on April 3, 2025. On May 15, 2025 Mount Logan declared a cash dividend of C$0.08 per share of its common stock, which was paid on June 2, 2025, to holders of record at the close of business on May 27, 2025. On August 7, 2025, Mount Logan declared a cash dividend of C$0.08 per share of its common stock, which was paid on August 25, 2025, to holders of record at the close of business on August 19, 2025. On November 5, 2025, Mount Logan declared a cash dividend in the amount of US$0.03 per common share to be paid on December 11, 2025 to shareholders of record on November 25, 2025.
Asset Management Liquidity
Mount Logan’s Asset Management business requires limited capital resources to support the working capital or operating needs of the business. For the Asset Management business’s longer term liquidity needs, Mount Logan expects to continue to fund the Asset Management business’s operations through management fees and performance fees received. Liquidity needs are also met through proceeds from borrowings and equity issuances as described in Note 12. Debt obligations and Note 19. Equity to the consolidated financial statements, respectively. From time to time, if Mount Logan determines that market conditions are favorable after taking into account Mount Logan’s liquidity requirements, we may seek to raise proceeds through the issuance of additional debt or equity instruments.
At December 31, 2025, the Asset Management business had $15.0 million of unrestricted cash and cash equivalents.
64
Future Debt Obligations
The Asset Management business had long-term debt outstanding of $77.1 million at December 31, 2025, which includes notes with maturities in 2027, 2031 and 2032. There are also scheduled incremental repayments of principal on the credit facility in 2026. See Note 12. Debt obligations to the consolidated financial statements for further information regarding the Asset Management business’s debt arrangements.
Future Cash Flows
Mount Logan’s ability to execute Mount Logan’s business strategy, particularly Mount Logan’s ability to increase Mount Logan’s AUM, depends on Mount Logan’s ability to establish new funds and to raise additional investor capital within such funds. Mount Logan’s liquidity will depend on a number of factors, such as Mount Logan’s ability to project our financial performance, which is highly dependent on the funds it manages and its ability to manage our projected costs, fund performance, access to credit facilities, compliance with the existing credit agreement, as well as industry and market trends. Also during economic downturns the funds Mount Logan manages might experience cash flow issues or liquidate entirely. In these situations, Mount Logan might be asked to reduce or eliminate the management fee and incentive fees it charges, which could adversely impact Mount Logan’s cash flow in the future. An increase in the fair value of the investments of the funds Mount Logan manages, by contrast, could favorably impact its liquidity through higher management fees where the management fees are calculated based on the net asset value, gross assets or adjusted assets. Additionally, higher incentive fees not yet realized would generally result when investments appreciate over their cost basis which would not have an impact on the Asset Management business’s cash flow until realized.
Consideration of Financing Arrangements
As noted above, the Asset Management business has and may continue to issue debt to supplement its liquidity. The decision to enter into a particular financing arrangement is made after careful consideration of various factors, including the Asset Management business’s cash flows from operations, future cash needs, current sources of liquidity, demand for the Asset Management business’s debt or parent's equity, and prevailing interest rates.
Insurance Solutions Liquidity and funding risk
Liquidity risk is the risk that an entity will encounter difficulty in meeting obligations associated with its financial liabilities as they fall due or can only do so on terms that are materially disadvantageous. Prudent liquidity risk management includes maintaining sufficient cash on hand and the availability of funding through an adequate amount of committed credit facilities. Mount Logan also has the ability to raise additional liquidity through the issuance of debt, and through the sale of its portfolio investments. Periodic cash flow forecasts are performed to ensure Ability has sufficient cash to meet operational and financing costs.
Liquid assets
Liquid assets, including high-quality assets that are marketable, can be pledged as security for borrowings, and can be converted to cash in a time frame that meets liquidity and funding requirements.
| As at | December 31, 2025 | December 31, 2024 | ||||||||||||
Cash and cash equivalents1 | $ | 118,753 | $ | 77,055 | ||||||||||
| Restricted cash | 9,973 | 15,716 | ||||||||||||
| Investments | 639,221 | 637,048 | ||||||||||||
| Receivable for investments sold | — | 17,045 | ||||||||||||
Accrued interest and dividend receivable1 | 12,596 | 18,580 | ||||||||||||
| Total liquid assets | $ | 780,543 | $ | 765,444 | ||||||||||
_______________
(1)Cash and cash equivalents and accrued interest & dividend receivable includes cash and cash equivalent and accrued interest of consolidated VIEs, respectively.
The liquid assets held by Mount Logan's insurance company, Ability, are subject to restrictions which prevent Mount Logan from transferring these assets to other entities within the group without insurance regulatory approvals. These assets are not restricted for use within the insurance company.
65
Insurance Subsidiaries’ Operating Liquidity
The primary cash flow sources for Ability include retirement services product inflows, investment income, and principal repayments on its investments. Uses of cash include investment purchases, payments to policyholders for surrenders, withdrawals and payout benefits, interest and principal payments on funding agreements and outstanding debt, policy acquisition and general operating costs.
Ability’s policyholder obligations are generally long-term in nature. However, policyholders may elect to withdraw some, or all, of their account value in amounts that exceed Ability’s estimates and assumptions over the life of an annuity contract. Ability includes provisions within its annuity policies, such as surrender charges and market value adjustments, which are intended to protect it from early withdrawals. As of December 31, 2025, and December 31, 2024, approximately 77% and 76%, respectively, of Ability’s MYGA policies were subject to penalty upon surrender. In addition, as of December 31, 2025, and December 31, 2024, approximately 55% and 85%, respectively, of policies contained Market Value Adjustments (“MVAs”) that may also have the effect of limiting early withdrawals if interest rates increase but may encourage early withdrawals by effectively subsidizing a portion of surrender charges when interest rates decrease.
Dividends from Insurance Subsidiaries
The NAIC has established minimum capital requirements in the form of RBC that factors the type of business written by an insurance company, the quality of its assets and various other aspects of its business to develop a minimum level of capital known as “authorized control level risk-based capital” and compares this level to adjusted statutory capital that includes capital and surplus as reported under SAP, plus certain investment reserves. Should the ratio of adjusted statutory capital to control level RBC fall below 200%, a series of remedial actions by the affected company would be required. As of December 31, 2025, and 2024, the RBC ratio of Ability was 501% and 325%, respectively.
The ability to pay dividends is limited by applicable laws and regulations of the jurisdiction where Ability is domiciled, as well as agreement(s) entered into with regulators. These laws and regulations require, among other things, Ability to maintain minimum solvency requirements and limit the amount of dividends Ability can pay. Nebraska state insurance laws and regulations require that the statutory surplus following any dividend or distribution must be reasonable in relation to their outstanding liabilities and adequate for its financial needs.
Future Debt Obligations
Ability had long-term debt of $17.3 million as of December 31, 2025, which includes notes with maturities in 2028, 2032, and 2033. See Note 12. Debt obligations to the consolidated financial statements for further information regarding Ability’s debt arrangements.
Capital
Ability believes it has a strong capital position and is well positioned to meet policyholder and other obligations. Ability measures capital sufficiency using various internal capital metrics which reflect management’s view on the various risks inherent to its business, the amount of capital required to support its core operating strategies and the amount of capital necessary to maintain its current ratings in a recessionary environment. The amount of capital required to support Ability’s core operating strategies is determined based upon internal modeling and analysis of economic risk, as well as inputs from rating agency capital models and consideration of NAIC RBC requirements. Capital in excess of this required amount is considered excess equity capital, which is available to deploy. As of December 31, 2025, and December 31, 2024, Ability’s RBC ratio was 501% and 325%, respectively. The formulas for determining the amount of RBC specify various weighting factors that are applied to financial balances or various levels of activity based on the perceived degree of risk.
Critical Accounting Estimates
This Management’s Discussion and Analysis of Financial Condition and Results of Operations is based upon the consolidated financial statements, which have been prepared in accordance with U.S. GAAP. The preparation of financial statements in accordance with U.S. GAAP requires the use of estimates and assumptions that could affect the reported amounts of assets and liabilities, the disclosure of contingent assets and liabilities and the reported amounts of revenues and expenses. Actual results could differ from these estimates. A summary of our significant accounting policies is presented in
66
Note 2. Summary of significant accounting policies to our consolidated financial statements. The following is a summary of our accounting policies that are affected most by judgments, estimates and assumptions.
Critical Accounting Estimates - Overall
Consolidation
Mount Logan assesses all entities in which Mount Logan has a variable interest for consolidation including management companies, insurance companies, investment companies, CLOs, and other entities. A variable interest is an investment or other interest that will absorb portions of an entity’s expected losses and/or receive expected residual returns. Fees earned by Mount Logan that (i) include terms, conditions, or amounts that are customarily present in arrangements for similar services negotiated at arm’s length, (ii) are commensurate with the level of effort required to provide those services, and (iii) where Mount Logan does not hold other economic interests in the entity that would absorb more than an insignificant amount of the expected losses or returns of the entity, would not be considered to be variable interests.
Pursuant to its consolidation policy, once Mount Logan determines it has a variable interest in an entity, Mount Logan considers whether the entity is a VIE. Entities that do not qualify as VIEs are assessed for consolidation as voting interest entities (“VOEs”) under the voting interest model.
An entity is a VIE if one of the following conditions exist: (a) the equity at risk is not sufficient for the entity to finance its activities without additional subordinated financial support, (b) the holders of the equity at risk (as a group) lack the ability to make decisions about the activities that most significantly impact the entity’s economic performance, or (c) the voting rights of some investors are disproportionate to their obligation to absorb the expected losses of the legal entity, their rights to receive the expected residual returns of the legal entity, or both and substantially all of the legal entity's activities either involve or are conducted on behalf of an investor with disproportionately few voting rights. Limited partnerships and other similar entities where limited partners, not affiliated with the general partner, have not been granted (i) substantive participation rights or (ii) substantive rights to either dissolve the partnership or remove the general partner are VIEs.
Mount Logan consolidates VIEs in which it is the primary beneficiary. Mount Logan is the primary beneficiary if it holds a controlling financial interest which is defined as possessing both (a) the power to direct the activities of a VIE that most significantly impact the VIE's economic performance and (b) the obligation to absorb losses of the VIE or the right to receive benefits from the VIE that could potentially be significant to the VIE. Mount Logan determines whether it is the primary beneficiary of a VIE at the time it becomes involved with a VIE and reconsiders that conclusion on an ongoing basis if facts and circumstances change.
Entities determined not to be VIEs are VOEs and are evaluated under the voting interest model. Mount Logan typically consolidates VOEs when it has a majority voting interest.
Each entity is assessed for consolidation individually considering the specific facts and circumstances surrounding that entity. The consolidation assessment, including the determination whether an entity is a VIE or VOE, depends on the facts and circumstances for each entity, and therefore Mount Logan’s investment companies may qualify as VIEs or VOEs.
With respect to CLOs (which are generally VIEs), as collateral manager, Mount Logan generally has the power to direct the activities of the CLO that most significantly impact the CLO’s economic performance. In some, but not all cases, Mount Logan, through its ownership in the CLOs, may have variable interests that represent an obligation to absorb losses of, or a right to receive benefits from, the CLO that could potentially be significant to the CLO. In cases where Mount Logan has both the power to direct the activities of the CLO that most significantly impact the CLO’s economic performance and the obligation to absorb losses of the CLO or the right to receive benefits from the CLO that could potentially be significant to the CLO, Mount Logan is deemed to be the primary beneficiary and consolidates the CLO.
Assets and liabilities of the consolidated VIEs are primarily presented in separate sections within the Consolidated Statements of Financial Position. Changes in the fair value of the consolidated VIEs’ assets and liabilities and related interest, dividend and other income and expenses are primarily presented within revenues of consolidated variable interest entities and Income of consolidated variable interest entities, for the Asset Management and Insurance Solutions segments, respectively, in the Consolidated Statements of Operations.
67
Income Taxes
Significant judgment is required in determining tax expense and in evaluating certain and uncertain tax positions. Mount Logan recognizes the tax benefit of uncertain tax positions when the position is “more likely than not” to be sustained upon examination, including resolution of any related appeals or litigation processes, based on the technical merits of the position. The tax benefit is measured as the largest amount of benefit that has a greater than 50% likelihood of being realized upon ultimate settlement. If a tax position is not considered more likely than not to be sustained, then no benefits of the position are recognized. Mount Logan’s tax positions are reviewed and evaluated quarterly to determine whether Mount Logan has uncertain tax positions that require financial statement recognition.
Deferred tax assets and liabilities are recognized for the expected future tax consequences of differences between the carrying amount of assets and liabilities and their respective tax bases using currently enacted tax rates. The effect on deferred tax assets and liabilities of a change in tax rates is recognized in income in the period during which the change is enacted. Deferred tax assets are reduced by a valuation allowance when it is more likely than not that all or a portion of the deferred tax assets will not be realized.
Critical Accounting Estimates - Asset Management Segment
Investments, at Fair Value
On a quarterly basis, Mount Logan utilizes a valuation committee consisting of members from senior management, to review and approve the valuation results related to the investments of the funds ML Management manages. Mount Logan also retains external valuation firms to provide third-party valuation consulting services to Mount Logan, which consist of certain limited procedures that management identifies and requests them to perform. The limited procedures provided by the external valuation firms assist management with validating their valuation results or determining fair value. Mount Logan performs various back-testing procedures to validate their valuation approaches, including comparisons between expected and observed outcomes, forecast evaluations and variance analyses. However, because of the inherent uncertainty of valuation, the estimated values may differ significantly from the values that would have been used had a ready market for the investments existed, and the differences could be material. The fair values of the investments in the funds Mount Logan manages can be impacted by changes to the assumptions used in the underlying valuation models. There have been no material changes to the valuation approaches utilized during the periods that Mount Logan’s financial results are presented in this report.
Fair Value of Financial Instruments
Except for Mount Logan’s debt obligations (each as defined in Note 12. Debt obligations to Mount Logan’s consolidated financial statements), Mount Logan's financial instruments are recorded at fair value or at amounts whose carrying values approximate fair value. See “Investments, at Fair Value” above. While Mount Logan's valuations of portfolio investments are based on assumptions that Mount Logan believes are reasonable under the circumstances, the actual realized gains or losses will depend on, among other factors, future operating results, the value of the assets and market conditions at the time of disposition, any related transaction costs and the timing and manner of sale, all of which may ultimately differ significantly from the assumptions on which the valuations were based. Financial instruments’ carrying values generally approximate fair value because of the short-term nature of those instruments or variable interest rates related to the borrowings.
Revenue Recognition
Management Fees
ML Management provides investment management services to investment funds, CLOs, and other vehicles in exchange for a management fee. Management fees are determined quarterly using an annual rate which are generally based upon (i) a percentage of the capital committed during the commitment period, and thereafter based on the remaining invested capital of unrealized investments, or (ii) net asset value, gross assets, or as otherwise provided in the respective agreements. Management fees are recognized over time, during the period in which the related services are performed.
68
Incentive Fees
ML Management provides investment management services to investment funds, CLOs, managed accounts and other vehicles in exchange for a management fee, as discussed above and, in some cases an incentive fee, a type of performance revenue. The incentive fee consists of two parts: (i) an income incentive fee which is based on pre-incentive fee net investment income in excess of a hurdle rate and (ii) a capital gains incentive fee which is based on cumulative realized capital gains and losses and unrealized capital depreciation. Incentive fees are considered a form of variable consideration as they are based on the fund achieving certain investment return hurdles. Accordingly, the recognition of such fee is deferred until it is probable that a significant reversal in the amount of cumulative revenue will not occur, which is generally upon liquidation of the investment fund.
Critical Accounting Estimates - Insurance Solutions Segment
Investments
Mount Logan is responsible for the fair value measurement of investments presented in the consolidated financial statements. Mount Logan performs regular analysis and review of its valuation techniques, assumptions and inputs used in determining fair value to evaluate if the valuation approaches are appropriate and consistently applied, and the various assumptions are reasonable. Mount Logan also performs quantitative and qualitative analysis and review of the information and prices received from commercial pricing services and broker-dealers, to verify it represents a reasonable estimate of the fair value of each investment. In addition, Mount Logan uses both internally-developed and commercially-available cash flow models to analyze the reasonableness of fair values using credit spreads and other market assumptions, where appropriate. For investment funds, Mount Logan typically recognizes its investment, including those for which it has elected the fair value option, based on net asset value information provided by the general partner or related asset manager. For a discussion of investment funds for which it has elected the fair value option, see Note 9. Fair value measurements to the consolidated financial statements.
69
Valuation of Fixed Maturity Securities, Equity Securities and Mortgage Loans
The following tables presents the fair value of fixed maturity securities, equity securities and mortgage loans, including those with related parties and those held by consolidated VIEs, by fair value hierarchy. Investments classified as Equity Method for which the Fair Value Option (“FVO”) has not been elected have been excluded from the table below:
| Fair Value Measurements | ||||||||||||||||||||||||||||||||
| December 31, 2025 | Level 1 | Level 2 | Level 3 | NAV | Total | |||||||||||||||||||||||||||
| Financial assets | ||||||||||||||||||||||||||||||||
| Asset Management | ||||||||||||||||||||||||||||||||
| Equity securities | $ | 3,834 | $ | 91 | $ | 6,484 | $ | — | $ | 10,409 | ||||||||||||||||||||||
| Derivatives | — | — | 13 | — | 13 | |||||||||||||||||||||||||||
| Other invested assets | — | — | 72 | — | 72 | |||||||||||||||||||||||||||
| Total financial assets — Asset Management | 3,834 | 91 | 6,569 | — | 10,494 | |||||||||||||||||||||||||||
| Insurance Solutions | ||||||||||||||||||||||||||||||||
| Debt securities: | ||||||||||||||||||||||||||||||||
| U.S. government and agency | — | 10,348 | — | — | 10,348 | |||||||||||||||||||||||||||
| U.S. state, territories and municipalities | — | 5,354 | — | — | 5,354 | |||||||||||||||||||||||||||
| Other government and agency | — | 2,475 | — | — | 2,475 | |||||||||||||||||||||||||||
| Corporate | — | 261,039 | 10,149 | — | 271,188 | |||||||||||||||||||||||||||
| Asset and mortgage-backed securities | — | 323,246 | 19,427 | — | 342,673 | |||||||||||||||||||||||||||
| Corporate loans | — | 7,499 | 116,568 | — | 124,067 | |||||||||||||||||||||||||||
| Equity securities | 7,644 | 2,246 | 3,240 | 1,923 | 15,053 | |||||||||||||||||||||||||||
| Other invested assets | — | 51 | 5,637 | 299 | 5,987 | |||||||||||||||||||||||||||
| Total financial assets — Insurance Solutions | 7,644 | 612,258 | 155,021 | 2,222 | 777,145 | |||||||||||||||||||||||||||
| Corporate loans of consolidated VIEs | — | — | 119,731 | — | 119,731 | |||||||||||||||||||||||||||
| Equity of consolidated VIEs | — | — | 949 | — | 949 | |||||||||||||||||||||||||||
| Total financial assets including consolidated VIEs | 7,644 | 612,258 | 275,701 | 2,222 | 897,825 | |||||||||||||||||||||||||||
| Derivatives | — | 481 | — | — | 481 | |||||||||||||||||||||||||||
| Total financial assets | $ | 11,478 | $ | 612,830 | $ | 282,270 | $ | 2,222 | $ | 908,800 | ||||||||||||||||||||||
| Financial liabilities | ||||||||||||||||||||||||||||||||
| Asset Management | ||||||||||||||||||||||||||||||||
| Debt obligations | — | — | — | — | — | |||||||||||||||||||||||||||
| Total financial liabilities — Asset Management | — | — | — | — | — | |||||||||||||||||||||||||||
| Insurance Solutions | ||||||||||||||||||||||||||||||||
| Ceded reinsurance - embedded derivative | — | 29,650 | — | — | 29,650 | |||||||||||||||||||||||||||
| Interest rate swaps | — | 1,388 | — | — | 1,388 | |||||||||||||||||||||||||||
| Total financial liabilities — Insurance Solutions | — | 31,038 | — | — | 31,038 | |||||||||||||||||||||||||||
| Total financial liabilities | $ | — | $ | 31,038 | $ | — | $ | — | $ | 31,038 | ||||||||||||||||||||||
70
| Fair Value Measurements | ||||||||||||||||||||||||||||||||
| December 31, 2024 | Level 1 | Level 2 | Level 3 | NAV | Total | |||||||||||||||||||||||||||
| Financial assets | ||||||||||||||||||||||||||||||||
| Asset Management | ||||||||||||||||||||||||||||||||
| Equity securities | $ | 1,777 | $ | — | $ | 499 | $ | — | $ | 2,276 | ||||||||||||||||||||||
| Total financial assets — Asset Management | 1,777 | — | 499 | — | 2,276 | |||||||||||||||||||||||||||
| Insurance Solutions | ||||||||||||||||||||||||||||||||
| Debt securities: | ||||||||||||||||||||||||||||||||
| U.S. government and agency | — | 8,075 | — | — | 8,075 | |||||||||||||||||||||||||||
| U.S. state, territories and municipalities | — | 5,252 | — | — | 5,252 | |||||||||||||||||||||||||||
| Other government and agency | — | 2,369 | — | — | 2,369 | |||||||||||||||||||||||||||
| Corporate | — | 226,249 | — | — | 226,249 | |||||||||||||||||||||||||||
| Asset and mortgage-backed securities | — | 364,875 | 8,641 | — | 373,516 | |||||||||||||||||||||||||||
| Corporate loans | — | — | 114,734 | — | 114,734 | |||||||||||||||||||||||||||
| Equity securities | 310 | 11,134 | 2,918 | 2,042 | 16,404 | |||||||||||||||||||||||||||
| Other invested assets | — | — | 4,575 | — | 4,575 | |||||||||||||||||||||||||||
| Total financial assets — Insurance Solutions | 310 | 617,954 | 130,868 | 2,042 | 751,174 | |||||||||||||||||||||||||||
| Corporate loans of consolidated VIEs | — | — | 125,757 | — | 125,757 | |||||||||||||||||||||||||||
| Equity securities of consolidated VIEs | — | — | 141 | — | 141 | |||||||||||||||||||||||||||
| Total financial assets including consolidated VIEs | 310 | 617,954 | 256,766 | 2,042 | 877,072 | |||||||||||||||||||||||||||
| Total financial assets | $ | 2,087 | $ | 617,954 | $ | 257,265 | $ | 2,042 | $ | 879,348 | ||||||||||||||||||||||
| Financial liabilities | ||||||||||||||||||||||||||||||||
| Asset Management | ||||||||||||||||||||||||||||||||
| Debt obligations | — | — | 1,471 | — | 1,471 | |||||||||||||||||||||||||||
| Total financial liabilities — Asset Management | — | — | 1,471 | — | 1,471 | |||||||||||||||||||||||||||
| Insurance Solutions | ||||||||||||||||||||||||||||||||
| Ceded reinsurance - embedded derivative | — | 34,770 | — | — | 34,770 | |||||||||||||||||||||||||||
| Interest rate swaps | — | 5,192 | — | — | 5,192 | |||||||||||||||||||||||||||
| Total financial liabilities — Insurance Solutions | — | 39,962 | — | — | 39,962 | |||||||||||||||||||||||||||
| Total financial liabilities | $ | — | $ | 39,962 | $ | 1,471 | $ | — | $ | 41,433 | ||||||||||||||||||||||
Goodwill
We review goodwill for impairment annually and whenever events or changes in the business environment may indicate the carrying amount of one of our reporting units may exceed its fair value. Our methodology for conducting this goodwill impairment testing contains both a qualitative and quantitative assessment. In evaluating the recoverability of goodwill, we perform a qualitative analysis at the reporting unit level to determine whether there are any events or circumstances that would indicate it is more likely than not that the fair value of a reporting unit is below its carrying value. Based on the results of this analysis, if we determine that it is more likely than not that the fair value of a reporting unit is less than its carrying amount, we then perform the impairment evaluation using a quantitative assessment based on an analysis of the discounted future cash flows generated by the underlying assets. The process of determining whether goodwill is impaired or recoverable relies on projections of future cash flows, operating results and market conditions. Future cash flow estimates are based partly on economic trends such as interest rates and market conditions, which are beyond our control and are likely to fluctuate.
Mount Logan has determined it has two reporting units: (1) LTC, its legacy run-off business, and (2) MYGA and Other. The fair value of reporting unit is determined from a projection of future cash flows and operating results derived from both the in-force business and new business expected in the future. This approach requires assumptions including premium growth rates, capital requirements, interest rates, mortality, morbidity, policyholder behavior, and discount rates. These assumptions are consistent with internal projections and operating plans. We believe these estimates and assumptions are reasonable and comparable to those that would be used by other marketplace participants. To calculate the fair value of the insurance business, Mount Logan discounted projected earnings from in-force contracts and valued new business growing at expected plan levels, consistent with the periods used for forecasting long term businesses, in addition to considering a terminal value for the value of new business beyond five years at Mount Logan’s long-term growth rate. In
71
arriving at its projections, Mount Logan considered past experience, economic trends such as interest rates, capital requirements and market trends. Capital requirements were based on a risk based capital (RBC) ratio of 350%. Excess capital above this requirement was added to the fair value of the reporting units, consistent with market participant treatment. Mount Logan's key assumptions for the new MYGA business were the (i) discrete premium growth rate, (ii) interest rate, and (iii) capital requirements, which are discussed further below:
i.The discrete MYGA premium growth rate in the fair value calculations were based on maintaining management’s target RBC ratio of 350%. RBC of 350% is anticipated to be maintained based on the performance of the investment portfolio and additional capital contributions. We assumed a higher growth rate in initial years with declining growth in the later years as we continue to scale the business;
ii.Interest rate assumptions are based on prevailing market rates at the valuation date; and
iii.Capital requirements assumed per management’s target RBC ratio of 350%.
Management has not adjusted its assumptions between the year ended December 31, 2024 and December 31, 2025, rather, the discount rate applied to the quantitative assessment has had impact. Discount rates assumed in determining the fair value for applicable reporting units was based on a cost of equity of 15% and 23% on an after-tax basis for existing (LTC & MYGA) and new business (MYGA), respectively for impairment testing for the year ended December 31, 2025. Capital Asset Pricing Model (“CAPM”) was used to estimate the cost of equity. The cost of equity was derived using the 20-year U.S. treasury bond yield and by adding an equity risk premium. The equity risk premium considers 100 basis point and 900 basis point execution risk to account for the risk of achieving the planned forecast for existing (LTC and MYGA) and new business (MYGA), respectively.
We apply significant judgement when determining the estimated fair value of our reporting units. While we believe that our estimates of future cash flows are reasonable, these estimates are not guarantees of future performance and are subject to risks and uncertainties that may cause actual results to differ from what is assumed in our impairment tests. Such analyses are particularly sensitive to changes in estimates of discount rates, future cash flows and other market conditions. A 50 basis point increase or decrease to the discount rate assumption, all other assumptions remaining constant, would not result in the carrying value exceeding the fair value of the MYGA reporting units. Management notes that these assumptions are often interdependent and shouldn’t be assessed in isolation. Further changes to these estimates might result in material changes in fair value and determination of the recoverability of goodwill, which may result in charges against earnings and a reduction in the carrying value of our goodwill in the future.
We complete our annual goodwill impairment analyses in the fourth quarter of each period presented using an October 1 measurement date. For the years ended December 31, 2025 and December 31, 2024, we determined from a qualitative standpoint there were no events or circumstances that indicated that the carrying value exceeded the fair value. From a quantitative standpoint as of October 1, 2025, we performed our annual quantitative goodwill impairment test for our reporting units, LTC and MYGA. As of such date, we noted that the carrying value of the LTC reporting unit exceeded its estimated fair value, which resulted in recording a $25.5 million charge to fully impair the goodwill associated with the LTC reporting unit. The excess carrying value of the LTC reporting unit was primarily driven by an increase in its net assets resulting from lower recorded long‑term care (LTC) reserves following a change in the accounting basis from IFRS to U.S. GAAP. Under U.S. GAAP, the revised reserving methodology reduced the level of recognized LTC reserves, thereby increasing the carrying value of the reporting unit. Consequently, the carrying value exceeded the estimated fair value as of the measurement date, resulting in the impairment. In contrast, the fair value of MYGA reporting unit exceeded its respective carrying value by 30.6%.
Derivatives
Freestanding derivatives are instruments that Ability has entered into as part of their overall risk management strategies. Such contracts include interest rate swaps to convert floating-rate interest receipts to fixed-rate interest receipts to reduce exposure to interest rate changes. All derivatives are recognized either as a Derivatives asset or Derivatives liability and are presented on a gross basis in the Consolidated Statements of Financial Position and measured at fair value unless there is a legal right of set-off. Changes in fair value are recorded in Accumulated Other Comprehensive Income as the swaps are in hedging relationships, with changes in fair value reclassified into Interest income in the same period as the hedged transactions affect earnings. Any interest accruals will flow through earnings as adjustments to Interest income. Ability’s derivative financial instruments contain credit risk to the extent that its counterparties may be unable to meet the terms of the agreements. Ability attempts to reduce this risk by limiting its counterparties to major financial institutions with strong credit ratings.
72
To qualify for hedge accounting, at the inception of the hedging relationship, Ability formally documents its risk management objective and strategy for undertaking the hedging transaction. This documentation identifies how the hedging instrument is expected to mitigate the designated risk related to the hedged item and the method that will be used to retrospectively and prospectively assess the hedge effectiveness. A derivative designated as a hedging instrument must be assessed as being highly effective in offsetting the designated risk of the hedged item. Hedge effectiveness is formally assessed at inception and periodically throughout the life of the hedge accounting relationship.
Ability issues and reinsures products or purchases investments that contain embedded derivatives. If it determines an embedded derivative has economic characteristics not clearly and closely related to the economic characteristics of the host contract, and a separate instrument with the same terms would qualify as a derivative instrument, the embedded derivative is bifurcated from the host contract and accounted for separately, unless the Fair Value Option (“FVO”) is elected on the host contract. Under the FVO, bifurcation of the embedded derivative is not necessary as the entire contract is carried at fair value with all related gains and losses recognized in Net gains (losses) from investment activities in the Consolidated Statements of Operations. Embedded derivatives are carried at fair value in the Consolidated Statements of Financial Position in the same line item as the host contract.
Additionally, reinsurance agreements written on a funds withheld or Modco basis contain embedded derivatives. Ability has determined that the obligation to pay the total return on the assets supporting the funds withheld liability represents a total return swap with a floating rate leg. The fair value of embedded derivatives on funds withheld and Modco agreements is computed as the unrealized gain (loss) on the underlying assets and is included within the funds withheld under reinsurance contracts in the Consolidated Statements of Financial Position.
The change in the fair value of the embedded derivatives is recorded in Net investment income (loss) on funds withheld in the Consolidated Statements of Operations. Ceded earnings from funds withheld liability and changes in the fair value of embedded derivatives are reported in operating activities in the Consolidated Statements of Cash Flows. Contributions to and withdrawals from funds withheld liability are reported in operating activities in the Consolidated Statements of Cash Flows.
Ability’s insurance operations include providing reinsurance related to LTC, as well as MYGA products. Insurance contracts are contracts with significant mortality and/or morbidity risks, while investment contracts are contracts without such risks. MYGA contracts were deemed to be investment contracts. Insurance revenue is comprised primarily of premiums and investment income. For traditional long-duration insurance contracts, Mount Logan reports premiums as revenue when due. Premiums received on MYGA products (a product without significant mortality risk) are not reported as revenue but rather as deposit liabilities. Mount Logan recognizes revenue for charges and assessments on these contracts, mostly relating to surrender charges. Interest credited to policyholder accounts is charged to expense.
Future policy benefit reserves represent the present value of future benefits to be paid to or on behalf of policyholders and related expenses less the present value of future net premiums. The liability is measured for each group of contracts (i.e., cohorts) using current cash flow assumptions. Contracts are grouped into cohorts by line of business, product type and cash flow streams, based on the date the policy was acquired (which for the entire LTC portfolio is the date of the acquisition of Ability). Future policy benefit reserves are adjusted each period because of updating lifetime net premium ratios for differences between actual and expected experience with the retroactive effect of those variances recognized in current period earnings. Ability reviews at least annually in the fourth quarter, future policy benefit reserves cash flow assumptions, and if the review concludes that the assumptions need to be updated, future policy benefit reserves are adjusted retroactively based on the revised net premium ratio using actual historical experience, updated cash flow assumptions, and the locked-in discount rate with the effect of those changes recognized in current period earnings.
As Ability’s LTC business is in run-off, the locked-in discount rate is used for the computation of interest accretion on future policy benefit reserves recognized in earnings. However, cash flows used to estimate future policy benefit reserves are also discounted using an upper-medium grade (i.e., low credit risk) fixed-income instrument yield reflecting the duration characteristics of the liabilities and is updated each reporting period with changes recorded in AOCI. As a result, changes in the current discount rate at each reporting period are recognized as an adjustment to AOCI and not earnings each period, whereas, changes relating to cash flow assumptions are recognized in the Insurance Solutions Statement of Earnings (Loss).
Liabilities for the MYGA investment contracts equal the account value, that is, the amount that accrues to the benefit of the contract or policyholder including credited interest and assessments through the financial statement date. See Note 15. Interest sensitive contract liabilities for further information.
73
Recent Accounting Pronouncements
A list of recent accounting pronouncements that are relevant to Mount Logan and its industries is included in Note 2. Summary of significant accounting policies to Mount Logan’s consolidated financial statements.
Item 7A. Quantitative and Qualitative Disclosures about Market Risk
We are a smaller reporting company as defined by Rule 12b-2 of the Exchange Act and are not required to provide the information otherwise required under this item.
Item 8. Consolidated Financial Statements and Supplementary Data
INDEX TO FINANCIAL STATEMENTS
MOUNT LOGAN CAPITAL INC.
Schedule I: Summary of Investments — Other Than Investments in Related Parties
74
MOUNT LOGAN CAPITAL INC.
REPORT OF INDEPENDENT REGISTERED PUBLIC ACCOUNTING FIRM (PCAOB ID 34 )
REPORT OF INDEPENDENT REGISTERED PUBLIC ACCOUNTING FIRM
To the shareholders and the Board of Directors of Mount Logan Capital Inc.
Opinion on the Financial Statements
We have audited the accompanying consolidated statements of financial position of Mount Logan Capital Inc. (the “Company”) as of December 31, 2025 and 2024, the related consolidated statements of operations, comprehensive income (loss), changes in equity, and cash flows for the two years in the period ended December 31, 2025, and the related notes (collectively referred to as the "financial statements"). In our opinion, the financial statements present fairly, in all material respects, the financial position of the Company as at December 31, 2025 and 2024, and the results of its operations and its cash flows for each of the two years in the period ended December 31, 2025, in conformity with accounting principles generally accepted in the United States of America.
Basis for Opinion
These financial statements are the responsibility of the Company’s management. Our responsibility is to express an opinion on the Company’s financial statements based on our audits. We are a public accounting firm registered with the Public Company Accounting Oversight Board (United States) (PCAOB) and are required to be independent with respect to the Company in accordance with the U.S. federal securities laws and the applicable rules and regulations of the Securities and Exchange Commission and the PCAOB.
We conducted our audits in accordance with the standards of the PCAOB. Those standards require that we plan and perform the audit to obtain reasonable assurance about whether the financial statements are free of material misstatement, whether due to error or fraud. The Company is not required to have, nor were we engaged to perform, an audit of its internal control over financial reporting. As part of our audits, we are required to obtain an understanding of internal control over financial reporting but not for the purpose of expressing an opinion on the effectiveness of the Company’s internal control over financial reporting. Accordingly, we express no such opinion.
Our audits included performing procedures to assess the risks of material misstatement of the financial statements, whether due to error or fraud, and performing procedures that respond to those risks. Such procedures included examining, on a test basis, evidence regarding the amounts and disclosures in the financial statements. Our audits also included evaluating the accounting principles used and significant estimates made by management, as well as evaluating the overall presentation of the financial statements. We believe that our audits provide a reasonable basis for our opinion.
/s/ Deloitte & Touche LLP
March 19, 2026
We have served as the Company’s auditor since 2021.
F-1
MOUNT LOGAN CAPITAL INC.
CONSOLIDATED STATEMENTS OF FINANCIAL POSITION
| (in thousands, except per share data) | December 31, 2025 | December 31, 2024 | ||||||||||||
| ASSETS | ||||||||||||||
| Asset Management | ||||||||||||||
| Cash and cash equivalents | $ | $ | ||||||||||||
Investments (including related party amounts of $ | ||||||||||||||
| Intangible assets | ||||||||||||||
Other assets (including related party amounts of $ | ||||||||||||||
| Insurance Solutions | ||||||||||||||
| Cash and cash equivalents | ||||||||||||||
| Restricted cash | ||||||||||||||
Investments (including related party amounts of $ | ||||||||||||||
| Derivatives | ||||||||||||||
| Assets of consolidated variable interest entities | ||||||||||||||
| Cash and cash equivalents | ||||||||||||||
| Investments | ||||||||||||||
| Other assets | ||||||||||||||
| Reinsurance recoverable | ||||||||||||||
| Intangible assets | ||||||||||||||
| Deferred acquisition costs | ||||||||||||||
| Goodwill | ||||||||||||||
| Other assets | ||||||||||||||
| Total assets | $ | $ | ||||||||||||
| LIABILITIES | ||||||||||||||
| Asset Management | ||||||||||||||
| Due to related parties | $ | $ | ||||||||||||
| Debt obligations | ||||||||||||||
| Accrued expenses and other liabilities | ||||||||||||||
| Insurance Solutions | ||||||||||||||
| Future policy benefits | ||||||||||||||
| Interest sensitive contract liabilities | ||||||||||||||
| Funds held under reinsurance contracts | ||||||||||||||
| Debt obligations | ||||||||||||||
| Derivatives | ||||||||||||||
| Accrued expenses and other liabilities | ||||||||||||||
| Total liabilities | ||||||||||||||
| Commitments and Contingencies (See Note 24) | ||||||||||||||
| EQUITY | ||||||||||||||
Common shares, $ | ||||||||||||||
| Warrants | ||||||||||||||
| Additional paid-in-capital | ||||||||||||||
| Retained earnings (accumulated deficit) | ( | ( | ||||||||||||
| Accumulated other comprehensive income (loss) | ||||||||||||||
| Total equity | ||||||||||||||
| Total liabilities and equity | $ | $ | ||||||||||||
See accompanying notes to the audited consolidated financial statements.
F-2
MOUNT LOGAN CAPITAL INC.
CONSOLIDATED STATEMENTS OF OPERATIONS
| Years Ended December 31, | ||||||||||||||
| (in thousands, except per share data) | 2025 | 2024 | ||||||||||||
| REVENUES | ||||||||||||||
| Asset Management | ||||||||||||||
| Management fees | $ | $ | ||||||||||||
| Incentive fees | ||||||||||||||
| Advisory and transaction fees, net | ||||||||||||||
| Equity investment earning | ||||||||||||||
| Insurance Solutions | ||||||||||||||
| Net premiums | ( | ( | ||||||||||||
| Product charges | ||||||||||||||
| Net investment income | ||||||||||||||
| Net gains (losses) from investment activities | ( | |||||||||||||
| Net revenues of consolidated variable interest entities | ||||||||||||||
| Net investment income (loss) on funds withheld | ( | ( | ||||||||||||
| Other income | ||||||||||||||
| Total revenues | ||||||||||||||
| EXPENSES | ||||||||||||||
| Asset Management | ||||||||||||||
| Administration and servicing fees | ||||||||||||||
| Transaction costs | ||||||||||||||
| Compensation and benefits | ||||||||||||||
| Amortization and impairment of intangible assets | ||||||||||||||
| Interest and other credit facility expenses | ||||||||||||||
| General, administrative and other | ||||||||||||||
| Insurance Solutions | ||||||||||||||
Net policy benefit and claims (remeasurement gain on policy liabilities of $ | ( | ( | ||||||||||||
| Interest sensitive contract benefits | ||||||||||||||
| Amortization of deferred acquisition costs | ||||||||||||||
| Compensation and benefits | ||||||||||||||
| Interest expense | ||||||||||||||
General, administrative and other (including related party amounts of $ | ||||||||||||||
| Goodwill impairment | ||||||||||||||
| Total expenses | ||||||||||||||
| Investment and other income (loss) - Asset Management | ||||||||||||||
| Net gains (losses) from investment activities | ( | |||||||||||||
| Dividend income | ||||||||||||||
| Interest income | ||||||||||||||
| Other income (loss), net | ||||||||||||||
| Gain on acquisition | ||||||||||||||
| Total investment and other income (loss) | ( | |||||||||||||
| Income (loss) before taxes | ( | ( | ||||||||||||
| Income tax (expense) benefit — Asset Management | ( | ( | ||||||||||||
| Net income (loss) | $ | ( | $ | ( | ||||||||||
| Earnings per share | ||||||||||||||
| Net income (loss) attributable to common shareholders - Basic | $ | ( | $ | ( | ||||||||||
| Net income (loss) attributable to common shareholders - Diluted | ( | ( | ||||||||||||
| Weighted average shares outstanding – Basic | ||||||||||||||
| Weighted average shares outstanding – Diluted | ||||||||||||||
F-3
MOUNT LOGAN CAPITAL INC.
CONSOLIDATED STATEMENTS OF COMPREHENSIVE INCOME (LOSS)
| Years Ended December 31, | ||||||||||||||
| (in thousands, except per share data) | 2025 | 2024 | ||||||||||||
| Net income (loss) | $ | ( | $ | ( | ||||||||||
| Other comprehensive income (loss), before tax: | ||||||||||||||
| Unrealized investment gains (losses) on available-for-sale securities | ||||||||||||||
| Unrealized gains (losses) on hedging instruments | ( | |||||||||||||
| Remeasurement gains (losses) on future policy benefits related to discount rate | ( | |||||||||||||
| Other comprehensive income (loss), before tax | ( | |||||||||||||
| Income tax expense (benefit) related to other comprehensive income (loss) | ||||||||||||||
| Other comprehensive income (loss) | ( | |||||||||||||
| Comprehensive income (loss) | $ | ( | $ | ( | ||||||||||
See accompanying notes to the audited consolidated financial statements.
F-4
MOUNT LOGAN CAPITAL INC.
CONSOLIDATED STATEMENTS OF CHANGES IN EQUITY
(in thousands, except for number of shares)
| Year Ended December 31, 2025 | Number of Voting Common Shares | Common Shares | Warrants | Additional Paid in Capital | Retained Earnings (Accumulated Deficit) | Accumulated Other Comprehensive Income (loss) | Total Equity | |||||||||||||||||||||||||||||||||||||
| Balance at January 1, 2025 | $ | $ | $ | $ | ( | $ | $ | |||||||||||||||||||||||||||||||||||||
| Share issuance for reverse acquisition | — | — | — | |||||||||||||||||||||||||||||||||||||||||
| Share issuance for investment purchase | — | — | — | |||||||||||||||||||||||||||||||||||||||||
| Equity based compensation | — | — | — | — | ||||||||||||||||||||||||||||||||||||||||
| Restricted share units release | — | — | ( | — | — | ( | ||||||||||||||||||||||||||||||||||||||
| Common shares repurchased | ( | — | — | ( | — | — | ( | |||||||||||||||||||||||||||||||||||||
Shareholder dividends ($ | — | — | — | — | ( | — | ( | |||||||||||||||||||||||||||||||||||||
| Net income (loss) | — | — | — | — | ( | — | ( | |||||||||||||||||||||||||||||||||||||
| Other comprehensive income (loss) | — | — | — | — | — | ( | ( | |||||||||||||||||||||||||||||||||||||
| Balance at December 31, 2025 | $ | $ | $ | $ | ( | $ | $ | |||||||||||||||||||||||||||||||||||||
| Year Ended December 31, 2024 | Number of Voting Common Shares | Common Shares | Warrants | Additional Paid in Capital | Retained Earnings (Accumulated Deficit) | Accumulated Other Comprehensive Income (Loss) | Total Equity | |||||||||||||||||||||||||||||||||||||
| Balance at January 1, 2024 | $ | $ | $ | $ | ( | $ | $ | |||||||||||||||||||||||||||||||||||||
| Issuance of warrants | — | — | — | — | — | |||||||||||||||||||||||||||||||||||||||
| Equity based compensation | — | — | — | — | — | |||||||||||||||||||||||||||||||||||||||
| Restricted Share Units release | — | — | ( | — | — | ( | ||||||||||||||||||||||||||||||||||||||
Shareholder dividends ($ | — | — | — | — | ( | — | ( | |||||||||||||||||||||||||||||||||||||
| Net income (loss) | — | — | — | — | ( | — | ( | |||||||||||||||||||||||||||||||||||||
| Other comprehensive income (loss) | — | — | — | — | — | |||||||||||||||||||||||||||||||||||||||
| Balance at December 31, 2024 | $ | $ | $ | $ | ( | $ | $ | |||||||||||||||||||||||||||||||||||||
See accompanying notes to the audited consolidated financial statements.
F-5
MOUNT LOGAN CAPITAL INC.
CONSOLIDATED STATEMENTS OF CASH FLOWS
| Years Ended December 31, | ||||||||||||||
| (in thousands) | 2025 | 2024 | ||||||||||||
| Cash Flows from Operating Activities | ||||||||||||||
| Net income (loss) | $ | ( | $ | ( | ||||||||||
| Adjustments to reconcile net income (loss) to net cash used in operating activities: | ||||||||||||||
| Net realized (gains) losses on investments | ( | |||||||||||||
| Net realized (gains) losses on foreign currency | ||||||||||||||
| Net change in unrealized (gains) losses on investments | ( | |||||||||||||
| Net change in unrealized (gains) losses on foreign currency | ( | |||||||||||||
| Change in fair value of debt obligation | ( | |||||||||||||
| Payment in-kind interest | ( | ( | ||||||||||||
| Equity investment earnings | ( | ( | ||||||||||||
| Amortization of debt issuance costs | ||||||||||||||
| Amortization of deferred acquisition costs | ||||||||||||||
| Amortization of intangible assets | ||||||||||||||
| Impairment of intangible assets | ||||||||||||||
| Net amortization of premiums and accretion of discounts on investments | ( | ( | ||||||||||||
| Equity based compensation | ||||||||||||||
| Increase (decrease) in estimated credit losses | ||||||||||||||
| Gain on reverse acquisition of business | ( | |||||||||||||
| Goodwill Impairment | ||||||||||||||
| (Increase) decrease in operating assets: | ||||||||||||||
| Reinsurance recoverable | ||||||||||||||
| Change in deferred acquisition costs | ( | ( | ||||||||||||
| Distributions from equity method investments | ||||||||||||||
| Other assets | ( | |||||||||||||
| Other assets of consolidated VIEs | ||||||||||||||
| Purchases of investments by consolidated VIEs | ( | ( | ||||||||||||
| Proceeds from sale of investments by consolidated VIEs | ||||||||||||||
| Increase (decrease) in operating liabilities: | ||||||||||||||
| Due to related parties | ( | |||||||||||||
| Future policy benefits | ( | ( | ||||||||||||
| Interest sensitive contract liabilities | ||||||||||||||
| Funds held under reinsurance contracts | ( | |||||||||||||
| Accrued expenses and other liabilities | ( | |||||||||||||
| Net cash used in operating activities | $ | ( | $ | ( | ||||||||||
| Investing Activities | ||||||||||||||
| Purchases of investments | ( | ( | ||||||||||||
| Proceeds received from reverse acquisition of business | ||||||||||||||
| Proceeds from sales and repayments of investments | ||||||||||||||
| Net cash provided by (used in) investing activities | $ | $ | ( | |||||||||||
| Financing Activities | ||||||||||||||
| Shareholder dividends | ( | ( | ||||||||||||
| Repurchase of common shares | ( | |||||||||||||
| Proceeds from borrowings of asset management business | ||||||||||||||
| Repayments of borrowings of asset management business | ( | ( | ||||||||||||
| Financing costs paid and deferred | ( | |||||||||||||
| Proceeds from borrowings of insurance business | ||||||||||||||
| Deposits on investment-type policies and contracts | ||||||||||||||
| Withdrawals on investment-type policies and contracts | ( | ( | ||||||||||||
| Net cash provided by (used in) financing activities | $ | $ | ||||||||||||
F-6
| Years Ended December 31, | ||||||||||||||
| (in thousands) | 2025 | 2024 | ||||||||||||
| Net increase (decrease) in cash, cash equivalents and restricted cash, and cash and cash equivalents of consolidated VIEs | ||||||||||||||
| Cash, cash equivalents and restricted cash, and cash and cash equivalents of consolidated VIEs, beginning of the period | ||||||||||||||
| Cash, cash equivalents and restricted cash, and cash and cash equivalents of consolidated VIEs, end of period | $ | $ | ||||||||||||
| Cash, cash equivalents, restricted cash and cash and cash equivalents of consolidated VIEs | ||||||||||||||
| Asset Management | ||||||||||||||
| Cash and cash equivalents | ||||||||||||||
| Total Asset Management | ||||||||||||||
| Insurance Solutions | ||||||||||||||
| Cash and cash equivalents | ||||||||||||||
| Restricted cash | ||||||||||||||
| Cash and cash equivalents of consolidated VIEs | ||||||||||||||
| Total Insurance Solutions | ||||||||||||||
| Total cash, cash equivalents and restricted cash, and cash and cash equivalents of consolidated VIEs | $ | $ | ||||||||||||
| Supplemental disclosures of cash flow information | ||||||||||||||
| Interest received | ||||||||||||||
| Interest paid | ||||||||||||||
| Dividends received | ||||||||||||||
| Income taxes paid | ||||||||||||||
| Supplemental Disclosures of Non-Cash Investing and Financing Activities | ||||||||||||||
| Cashless repayment on borrowings | ||||||||||||||
| Issuance of common shares for vested Restricted Share Units | ||||||||||||||
| Issuance of common shares for investment purchases | ||||||||||||||
| Issuance of common shares for share based compensation | ||||||||||||||
See accompanying notes to the audited consolidated financial statements.
F-7
MOUNT LOGAN CAPITAL INC.
NOTES TO CONSOLIDATED FINANCIAL STATEMENTS
(All amounts in thousands, except share and per share data, and except where noted)
Note 1. Organization
Mount Logan, together with its consolidated subsidiaries (the “Company”) is a diversified alternative asset management and insurance solutions platform. Our mission is to provide our investors access to a diversified and differentiated set of private market investment solutions to address their capital needs. Mount Logan conducts its business primarily in the United States through its two business segments: Asset Management and Insurance Solutions. Our Asset Management segment is conducted by Mount Logan Management LLC (“ML Management”), our SEC-registered investment adviser, manages a significant portion of our Assets Under Management (“AUM”) across our various managed funds supported by permanent and semi-permanent capital bases. Management also directly manages the capital of our wholly-owned insurance company, Ability Insurance Company (“Ability”), for the benefit of policyholders. The Company’s Insurance Solutions segment is conducted by Ability, a Nebraska domiciled insurer, specializes in reinsuring annuity products for the increasing number of individuals seeking to fund retirement needs and represents all of our insurance solutions operations.
On September 12, 2025 (the “Closing Date”), the Company completed a business combination pursuant to an Agreement and Plan of Merger, dated as of January 16, 2025 and amended as of July 6, 2025 and August 17, 2025 (the “Merger Agreement”) among the Company (formerly, Yukon New Parent, Inc.), Mount Logan Capital Inc., an insurance company and asset manager organized under the laws of the Province of Ontario (“Legacy Mount Logan”), and 180 Degree Capital Corp. (“TURN”), a New York corporation that was registered as a closed-end investment company under the Investment Company Act of 1940, as amended (the “Investment Company Act”), Polar Merger Sub, Inc., a corporation organized under the laws of the State of New York and wholly owned subsidiary of the Company (“TURN Merger Sub”), and Moose Merger Sub, LLC, a limited liability company formed under the laws of the State of Delaware and a wholly owned subsidiary of the Company (“MLC Merger Sub”) wherein (i) TURN Merger Sub. merged with and into TURN, with TURN surviving as a wholly owned subsidiary of the Company, and (ii) MLC Merger Sub merged with and into Legacy Mount Logan, with Legacy Mount Logan surviving as a wholly owned subsidiary of the Company (collectively, the “Business Combination”). In connection with the Business Combination, Legacy Mount Logan was domesticated into a Delaware limited liability company and renamed “Mount Logan Capital Intermediate LLC.” Following the completion of the Business Combination, the Company changed its name to “Mount Logan Capital Inc.” and became a Nasdaq-traded public company. The Business Combination was accounted for as a reverse acquisition, with Legacy Mount Logan identified as the accounting acquirer, but the legal acquiree. Accordingly, our consolidated financial statements present the historical results of Legacy Mount Logan prior to September 12, 2025, and those of the combined company subsequent to that date. Refer to Note 3. Business combinations for more information about the reverse acquisition and the financial reporting impacts.
Note 2. Summary of significant accounting policies
Basis of presentation and Consolidation
The accompanying consolidated financial statements (“Consolidated Financial Statements”) have been prepared in accordance with accounting principles generally accepted in the United States of America (“U.S. GAAP”). The results of the Company and its subsidiaries are presented on a consolidated basis. All intercompany transactions and balances are eliminated on consolidation.
The Consolidated Financial Statements reflect all adjustments, both normal and recurring which, in the opinion of management, are necessary for the fair presentation of the Company’s consolidated financial statements for the periods presented.
The Company's Asset Management and Insurance Solutions segments possess distinct characteristics, and as a result are presented separately from each other. The Company believes that separate presentation provides a more informative view of the Company’s consolidated financial position and results of operations than an aggregated presentation and that reporting insurance solutions separately is appropriate given, among other factors, the relative significance of Ability's policy liabilities, which do not provide recourse to the remaining assets of Mount Logan.
F-8
The summary of the significant accounting policies includes a section for common accounting policies and an accounting policy section for each of the two operating segments when a policy is specific to one operating segment and not the other. Unless otherwise specified, the significant accounting policy applies to both segments.
The number of shares issued and outstanding, earnings per share, additional paid-in capital, dividends paid per share and all references to share quantities of the Company have been retrospectively adjusted to reflect the Company’s existing capital structure post merger with TURN. Refer to Note 3. Business combinations for further detail.
Due to rounding, numbers presented throughout these Consolidated Financial Statements may not add up precisely to the totals provided and percentages may not precisely reflect the absolute figures.
Significant accounting policies - overall
Consolidation
These Consolidated Financial Statements include the financial statements of the Company and its controlled subsidiaries and entities. The Company assesses all entities in which the Company has a variable interest for consolidation including management companies, insurance companies, investment companies, collateralized loan obligations (“CLOs”), and other entities. A variable interest is an investment or other interest that will absorb portions of an entity’s expected losses and/or receive expected residual returns. Fees earned by the Company that (i) include terms, conditions, or amounts that are customarily present in arrangements for similar services negotiated at arm’s length, (ii) are commensurate with the level of effort required to provide those services, and (iii) where the Company does not hold other economic interests in the entity that would absorb more than an insignificant amount of the expected losses or returns of the entity, would not be considered to be variable interests.
Pursuant to its consolidation policy, once the Company determines it has a variable interest in an entity, the Company considers whether the entity is a variable interest entity (“VIE”). Entities that do not qualify as VIEs are assessed for consolidation as voting interest entities (“VOEs”) under the voting interest model.
An entity is a VIE if one of the following conditions exist: (a) the equity at risk is not sufficient for the entity to finance its activities without additional subordinated financial support, (b) the holders of the equity at risk (as a group) lack the ability to make decisions about the activities that most significantly impact the entity’s economic performance, or (c) the voting rights of some investors are disproportionate to their obligation to absorb the expected losses of the legal entity, their rights to receive the expected residual returns of the legal entity, or both and substantially all of the legal entity’s activities either involve or are conducted on behalf of an investor with disproportionately few voting rights. Limited partnerships and other similar entities where limited partners, not affiliated with the general partner, have not been granted (i) substantive participation rights or (ii) substantive rights to either dissolve the partnership or remove the general partner are VIEs.
The Company consolidates VIEs in which it is the primary beneficiary. The Company is the primary beneficiary if it holds a controlling financial interest which is defined as possessing both (a) the power to direct the activities of a VIE that most significantly impact the VIE's economic performance and (b) the obligation to absorb losses of the VIE or the right to receive benefits from the VIE that could potentially be significant to the VIE. The Company determines whether it is the primary beneficiary of a VIE at the time it becomes involved with a VIE and reconsiders that conclusion on an ongoing basis if facts and circumstances change.
Entities determined not to be VIEs are VOEs and are evaluated under the voting interest model. The Company typically consolidates VOEs when it has a majority voting interest.
Each entity is assessed for consolidation individually considering the specific facts and circumstances surrounding that entity. The consolidation assessment, including the determination whether an entity is a VIE or VOE, depends on the facts and circumstances for each entity, and therefore the Company’s investment companies may qualify as VIEs or VOEs.
With respect to CLOs (which are generally VIEs), as collateral manager, the Company generally has the power to direct the activities of the CLO that most significantly impact the CLO’s economic performance. In some, but not all cases, the Company, through its ownership in the CLOs, may have variable interests that represent an obligation to absorb losses of, or a right to receive benefits from, the CLO that could potentially be significant to the CLO. In cases where the Company has both the power to direct the activities of the CLO that most significantly impact the CLO’s economic
F-9
performance and the obligation to absorb losses of the CLO or the right to receive benefits from the CLO that could potentially be significant to the CLO, the Company is deemed to be the primary beneficiary and consolidates the CLO.
Assets of the consolidated VIEs are primarily presented in separate sections within the Consolidated Statements of Financial Position. Changes in the fair value of the consolidated VIEs’ assets and liabilities and related interest, dividend and other income and expenses are primarily presented within Revenues of consolidated variable interest entities in the Consolidated Statements of Operations.
Use of estimates
The preparation of the Consolidated Financial Statements in conformity with U.S. GAAP requires management to make estimates and assumptions that affect the reported amounts in the financial statements and related disclosures. Significant estimates and assumptions include but are not limited to estimating fair values of certain financial instruments (including derivatives), impairment of investments and allowances for expected credit losses, goodwill and intangible assets, insurance liabilities and reinsurance recoverables, income taxes, performance obligations and incentive fees, and equity based compensation. Actual results could differ from those estimates, and such differences could be material.
Cash and cash equivalents
The Company considers all highly liquid short-term investments, including money market funds, with original maturities of three months or less when purchased to be cash equivalents. Interest income from Cash and cash equivalents is recorded within the Investment and other income (loss) – Asset Management and Net investment income for Insurance Solutions in the Consolidated Statements of Operations. The carrying values of the money market funds represent their fair values due to their short-term nature. Substantially all of the Company’s cash on deposit is in interest bearing accounts with financial institutions and exceed insured limits.
Restricted cash
Foreign currency translation
The functional currency is the currency of the primary economic environment in which an entity operates. If a subsidiary has a functional currency different from the Company’s reporting currency, the subsidiary’s results are translated into the reporting currency as follows:
•Assets and liabilities are translated at the closing rate as of the date of that Consolidated Balance Sheet
•Income and expenses for each Consolidated Statement of Operations and Consolidated Statement of Comprehensive Income (Loss) are translated at average exchange rates for the period
•All resulting exchange differences are recognized as a separate component of Accumulated other comprehensive income (loss) (“AOCI”)
When a subsidiary is sold or substantially liquidated, the cumulative amount in AOCI related to the subsidiary is recognized in the Consolidated Statements of Operations.
Foreign currency transactions
Transactions in foreign currencies are converted into the functional currency using exchange rates that approximate those prevailing at the date of the transactions. The Company remeasures monetary assets and liabilities denominated in a currency that is different from functional currency. The effect of this remeasurement process results in gains and losses that are recognized in the Consolidated Statements of Operations. Foreign currency transactions, such as, purchases and sales of investments, income and expenses, contributions and dividends to shareholders, are converted at the exchange rate prevailing on the respective dates of such transactions.
Investments
F-10
Investment transactions are recorded on trade date. Transaction costs incurred to acquire financial assets measured at fair value through earnings are recognized as an expense as incurred. Transaction costs incurred to acquire financial assets measured at cost are amortized over the contractual life of the instrument using the effective interest method. The periodic movement in fair value of financial assets measured at fair value through earnings is recorded as an unrealized gain or loss within Net gains (losses) from investment activities in the Consolidated Statements of Operations.
Realized gains or losses on investments are calculated, using the first-in, first-out (“FIFO”) method, as the difference between the net proceeds received (excluding prepayment fees, if any) and the amortized cost basis of the investment. Realized gains or losses on investments include investments charged off during the period, net of recoveries.
Interest income
Interest income is recognized using the effective interest method and recorded within Interest income for Asset Management segment and Net investment income for the Insurance Solutions segment on the Consolidated Statements of Operations. Discounts from and premiums to par value are accreted or amortized into Interest income over the contractual life of the investment using the effective interest method.
Debt securities and loans will be put on nonaccrual status when delinquent in principal and/or interest payments for a period exceeding 90 days. Any previously recognized interest receivable will be reversed through interest income once the instrument is put on nonaccrual status and determined to be on the cost recovery method.
In determining the accounting for individual payments on a nonaccrual loan or security, the Company will evaluate the instrument to determine whether doubt exists about the ultimate collectability of the cost basis. If collectability of the cost basis in the instrument is in doubt, any payment received on a nonaccrual instrument should be applied to reduce the cost basis to the extent necessary to eliminate such doubt.
When the Company can demonstrate that doubt about the ultimate collectability of the cost basis no longer exists, subsequent interest payments received may be recorded as Interest income on a cash basis.
Dividend income
Dividend income on preferred equity securities is recorded on the accrual basis to the extent that such amounts are payable by the portfolio company and are expected to be collected. Dividend income on common equity securities is recorded on the declaration date for private portfolio companies or on the ex-dividend date for publicly-traded portfolio companies.
Equity method investments
For equity investments in entities which the Company exercises significant influence, but does not meet the requirements for consolidation, and has not elected the FVO, the Company uses the equity method of accounting. The Company has significant influence when it can influence operating and financial policies of an investee, which can be indicated in several ways, including, but not limited to: (i) representation on the board of directors, (ii) participation in policy-making processes, and (iii) extent of ownership. Under the equity method of accounting, the Company records its share of the underlying income or loss of such entities adjusted for distributions. The Company recognizes its share of the underlying net income or loss of such entities, using best available information, in Equity investment earning for the Company in its Consolidated Statement of Operations. The initial carrying amount of an equity method investment equals the Company’s cost basis, including transaction costs. The carrying amount is subsequently adjusted for the Company’s share of the investees’ profit, dividends received, and the differences, if any, between the Company’s cost of the investment and the underlying equity in the net assets that arose upon acquisition. The Company evaluates its equity method investments for which it has not elected FVO for impairment whenever events or changes in circumstances indicate that the carrying amounts of such investments may not be recoverable. During the years ended December 31, 2025 and December 31, 2024, there were no impairment charges related to equity method investments.
The carrying amounts of all equity method investments are recorded in investments in the Consolidated Statements of Financial Position. If the Company loses significant influence over the investee, the Company will record its retained investment based on current carrying value as of that date. The subsequent accounting will depend on the accounting policy of the investment.
F-11
The Company evaluates each of its equity method investments to determine if any were significant, as defined by guidance from the Securities and Exchange Commission, to consider if the Company is required to present separate financial statements and additional information for its equity method investments. As of, and for the years ended December 31, 2025 and December 31, 2024, no equity method investment held by the Company met the significance criteria individually or in aggregate. As such, the Company is not required to present separate financial statements or supplemental information for any of its equity method investments.
Refer to Note 22. Related parties for more information on the Company’s equity method investments.
Allowance for credit losses
Credit losses for mortgage loans and other loans and receivables
The current expected credit losses (CECL) methodology is based on relevant information about past events, including historical experience, current conditions and reasonable and supportable (R&S) forecasts that affect the collectability of the reported financial asset balances. If the asset’s life extends beyond the R&S forecast period, then historical experience is considered over the remaining life of the assets in the allowance. The resulting allowance is adjusted in each subsequent reporting period in the consolidated statement of income to reflect changes in history, current conditions and forecasts as well as changes in asset positions and portfolios. The allowance is a valuation account that is deducted from the amortized cost of the financial asset to present the net amount that management expects to collect on the financial asset over its expected life. All financial assets carried at amortized cost are in the scope of the CECL methodology, while assets measured at fair value are excluded.
The Company’s estimation of expected credit losses requires management to make assumptions regarding the likelihood and severity of credit loss events and their impact on expected cash flows, which drive the probability of default (PD), loss given default (LGD) and exposure at default in the Company’s credit loss methods, where the Company discounts the expected credit loss using discounting techniques.
The Company’s forecasts of the U.S. employment rate represent the key macroeconomic variable that most significantly affects its estimate of expected credit losses. The Company forecasts over the next four quarters and reverts to historical experience on a straight-line basis.
The Company estimates expected credit losses over the contractual term of the financial asset, which is adjusted for expected prepayments. Expected extensions are not considered unless the option to extend the loan are unilaterally held by the borrower. Credit enhancements are included in the assessment when embedded in the financial asset and not freestanding.
Expected credit losses are calculated on a pooled basis where financial assets share similar risk characteristics. The Company maintains a watch list and assigns a risk rating of 1 – 5 for each loan to gauge potential credit risk. The loans are then pooled by risk rating to determine the expected credit loss for the pool. The risk rating levels are the following:
Level 1 Borrower is performing above expectations and the trends and risk factors since origination or acquisition are generally favorable.
Level 2 Borrower is generally performing as expected and the risk factors are similar to the risk at the time of origination or acquisition.
Level 3 Borrower performing below expectations and the risk factors increased since origination or acquisition.
Level 4 Borrower performing materially below expectations and the risk factors increased materially since origination or acquisition. Borrower generally breaches debt covenants and loan payments(s) may be past due.
F-12
Level 5 Borrower performing significantly below expectations and the risk factors increased significantly since origination or acquisition. Borrower breached most or all debt covenants, loan payments(s) are significantly past due. Principal not expected to be repaid in full.
The loss likelihood and severity models use both internal and external information and are sensitive to forecast of macroeconomic conditions. Regression of information predicated on peer performance is utilized and management has elected the upper bound of the case scenario where PD/LGD estimates will be above the model midpoint. This process more adequately quantifies uncertainties or subjectively assesses risk.
For defaulted loans where repayment is based on sale or operations of the collateral, the Company will evaluate the fair value of the collateral to determine the measurement of expected credit losses. The Company excludes interest receivable from the measurement of expected credit losses and the Company will reverse interest income in a timely manner when loans are placed on nonaccrual. When all or a portion of a loan is deemed uncollectible, the uncollectible portion of the carrying amount of the loan is charged off against the allowance. If the Company recovers all or a portion of an amount previously written off on a credit impaired loan, the recovery is recognized through the allowance account. Expected credit losses are reported in “Net gains (losses) from investment activities” for loans and “Net policy and claims” for reinsurance recoverables.
The Company will measure expected credit losses arising from off-balance sheet commitments, including loan commitments, that are not unconditionally cancellable by the Company. This allowance for credit losses for off-balance sheet commitments is determined using methods consistent with those used for the associated mortgage and other loan receivable class and is recognized in Accrued expenses and other liabilities in the Consolidated Statements of Financial Position, since there is no funded asset for the committed amount.
Credit losses for available-for-sale securities
Available-for-sale (“AFS”) securities with a fair value that has declined below amortized cost are evaluated for impairment. If the Company intends to sell a security or it is more likely than not that it would be required to sell a security before the recovery of its amortized cost, the security is written down to its fair value and any impairment is immediately recognized in “Net gains (losses) from investment activities”. If neither of these conditions exist, the decline in fair value is evaluated to determine whether a credit loss exists and an allowance for credit losses should be recognized.
For AFS securities, relevant facts and circumstances are qualitatively considered in evaluating whether a decline below fair value is credit-related. Relevant facts and circumstances include but are not limited to: (1) the extent to which the fair value is less than amortized cost; (2) changes in credit ratings, (3) adverse conditions related to the security’s industry or geographical area, (4) failure to make scheduled payments, and (5) other known changes in the financial condition of the issuer or quality of any underlying collateral or credit enhancements.
Management uses its best judgment in evaluating the cause of the decline in the estimated fair value of the security. Inherent in management’s evaluation of the security are assumptions and estimates about the operations of the issuer and its future earnings potential. The review of expected future cash flows can include assumptions about economic risks (e.g., unemployment, real estate prices), loan specific information (delinquency rates and loan-to-value ratios), facts and circumstances relevant to the security and the issuer, and secondary sources of repayment (e.g., credit enhancements).
Credit impairments are measured as the difference between the security’s amortized cost and the present value of expected cash flows discounted at the current effective interest rate. The credit impairment is subject to a floor equal to the fair value of the security and is recognized immediately in “Net gains (losses) from investment activities”. Any non-credit impairment will continue to be recorded in accumulated other comprehensive income. The Company continues to monitor impaired AFS securities for changes in the measurement of credit losses which will be reflected through adjustments to the allowance. Amounts are charged off against the allowance for credit losses when deemed uncollectible and any recoveries are recognized as a realized gain.
Financial instruments held by consolidated VIEs
The consolidated VIEs are primarily CLOs. Their investments include loans, debt securities, and equity securities held at fair value. Net income attributable to the Company reflects the Company’s own economic interests in the consolidated CLOs, including (i) changes in the fair value of the beneficial interests retained by the Company and (ii) beneficial interests that represent compensation for collateral management services. Using the measurement alternative for
F-13
consolidated collateralized financing entities, the Company measures both the financial assets and financial liabilities of the consolidated CLOs using the fair value of the financial assets or financial liabilities, whichever are more observable. When the financial assets are more observable, the financial assets are measured at fair value. In consolidation, the financial liabilities are measured as the sum of (i) the fair value of financial assets and (ii) the carrying value of any nonfinancial assets held temporarily, less the sum of (i) the fair value of any beneficial interests owned by the Company and (ii) the carrying value of any beneficial interests that represent compensation for services. When financial liabilities are more observable, the financial liabilities are measured at fair value. In consolidation, the financial assets are measured as the sum of (i) the fair value of financial liabilities, (ii) the fair value of any beneficial interests retained by the Company, and (iii) the carrying value of any beneficial interests that represent compensation for services, less the carrying value of any nonfinancial assets held temporarily.
Fair value of financial instruments
Fair value measurement
Fair value is the price that would be received upon the sale of an asset or paid to transfer a liability in an orderly transaction between market participants at the measurement date under current market conditions. Where available, fair value is based on observable market prices or parameters, or derived from such prices or parameters. Where observable prices or inputs are not available, valuation techniques are applied. These valuation techniques involve varying levels of management estimation and judgment, the degree of which is dependent on a variety of factors. The actual realized gains or losses will depend on, among other factors, future operating results, the value of the assets and market conditions at the time of disposition, any related transaction costs and the timing and manner of sale, all of which may ultimately differ significantly from the assumptions on which the valuations were based.
U.S. GAAP establishes a hierarchical disclosure framework which prioritizes and ranks the level of market price observability used in measuring financial instruments at fair value. Market price observability is affected by a number of factors, including the type of financial instrument, the characteristics specific to the financial instrument and the state of the marketplace, including the existence and transparency of transactions between market participants. Financial instruments with readily available quoted prices in active markets generally will have a higher degree of market price observability and less judgment used in measuring fair value.
The Company undertakes a multi-step valuation process, which includes, among other procedures, the following:
•The Company’s quarterly valuation process begins with each investment being initially valued by the investment professionals responsible for the respective portfolio investment. The Company may utilize an independent valuation firm from time to time to provide valuation on material illiquid securities.
•The Company will review the recommended valuations and determine the fair value of each investment. Valuations that are not based on readily available market quotations will be valued in good faith based on, among other things, the input of management and, where applicable, other third-parties.
The Company classifies fair value measurements within a hierarchy which gives the highest priority to unadjusted quoted prices in active markets for identical assets or liabilities (Level 1) and the lowest priority to unobservable inputs (Level 3). The three levels of the fair value hierarchy are:
Level 1 Unadjusted quoted prices in active markets for identical assets or liabilities that the Company can access at the measurement date. The type of investments included in Level I include listed equities and listed securities. The Company does not adjust the quoted price for these investments, even in situations where the Company may hold a large position and a sale could reasonably affect the quoted price.
Level 2 Pricing inputs are other than quoted prices in active markets, which are either directly or indirectly observable as of the reporting date. Such inputs may be quoted prices for similar assets or liabilities, quoted markets that are not active, or other inputs that are observable or can be corroborated by observable market data for substantially the full character of the financial instrument, or inputs that are derived principally from, or corroborated by, observable market information. Investments which are generally included in this category include illiquid debt securities and less liquid, privately held or restricted equity securities, for which some level of recent trading activity has been observed.
F-14
Level 3 Pricing inputs are unobservable for the investment and includes situations where there is little, if any, market activity for the investment. The inputs may be based on our own assumptions about how market participants would price the asset or liability or may use Level 2 inputs, as adjusted, to reflect specific investment attributes relative to a broader market assumption. These inputs into the determination of fair value may require significant management judgment or estimation. Even if observable market data for comparable performance or valuation measures (earnings multiples, discount rates, other financial/valuation ratios, etc.) are available, such investments are grouped as Level 3 if any significant data point that is not also market observable (private company earnings, cash flows, etc.) is used in the valuation methodology.
In certain cases, the inputs used to measure fair value may fall into different levels of the fair value hierarchy. In such cases, a financial instrument’s level within the fair value hierarchy is based on the lowest level of input that is significant to the fair value measurement. The Company’s assessment of the significance of a particular input to the fair value measurement in its entirety requires judgment and considers factors specific to the financial instrument when the fair value is based on unobservable inputs. The Company evaluates these inputs and recognizes transfers between levels, if any, at the end of each reporting period.
A significant decrease in the volume and level of activity for the asset or liability is an indication that transactions or quoted prices may not be representative of fair value because in such market conditions there may be increased instances of transactions that are not orderly. In those circumstances, further analysis of transactions or quoted prices is needed, and a significant adjustment to the transactions or quoted prices may be necessary to estimate fair value.
When a security is valued based on broker quotes, the Company subjects those quotes to various criteria in making the determination as to whether a particular financial instrument would qualify for classification as Level 2 or Level 3. These criteria include, but are not limited to, the number and quality of the broker quotes, the standard deviations of the observed broker quotes, and the percentage deviation from external pricing services.
Debt securities: These financial instruments are generally valued using inputs obtained from dealers or market makers, and where these values are not available, generally valued based on a range of valuations determined by management or an independent valuation firm. Valuation models are based on discounted cash flow or enterprise value analyses, for which the key inputs are determined based on market comparables, which incorporate similar instruments from similar issuers.
Real estate and mortgage loans: The Company's investments in real estate and mortgage loans are illiquid, structured investments that are specific to the property and its operating performance. As there are no observable inputs, these investments are classified as Level 3 on the fair value hierarchy.
Fair value option
The Company elects the fair value option (“FVO”) to carry certain financial assets and financial liabilities at fair value, with changes in fair value recognized in the Consolidated Statements of Operations. The FVO election is irrevocable and is applied to financial instruments on an individual basis at initial recognition or at eligible remeasurement events. Transaction costs incurred to acquire financial assets which are accounted for under the FVO are expensed as incurred. The Company elected to present the accretion of purchase discounts and the amortization of purchase premiums separately from the changes in fair value. Interest income on interest-bearing financial instruments is based on the stated interest rates adjusted for the accretion of purchase discounts and the amortization of purchase premiums.
The Company elects FVO for certain debt securities collateralizing insurance contract liabilities to substantially reduce any accounting mismatch arising from changes in fair value of these assets and changes in the value of their related insurance contract liabilities. The Company also elects FVO on certain financial liabilities which contain embedded derivatives. By electing the FVO, the Company accounts for the entire financial liability at fair value with changes in fair value recognized in earnings, and therefore does not need to account for the derivative separately from the host contract. Additionally, the Company elects the FVO on certain loan assets and equity securities which the Company manages on a fair value basis.
Business combinations
F-15
The Company accounts for business combinations using the acquisition method of accounting where the consideration transferred for the acquisition is allocated to the assets acquired and liabilities assumed using the fair values determined by management as of the acquisition date. Contingent consideration obligations that are elements of the consideration transferred are recognized as of the acquisition date as part of the fair value transferred in exchange for the acquired business. Acquisition-related costs incurred in connection with a business combination are expensed as incurred.
Goodwill
Goodwill represents the excess of cost over the fair value of identifiable net assets of an acquired business. Goodwill is recorded as a separate line item in the Consolidated Statements of Financial Position for Insurance Solutions and included in Other assets for Asset Management. Refer to Note 11 Goodwill and intangible assets for disclosure regarding the goodwill recorded.
Intangible assets
The Company’s intangible assets include investment management contracts included in the Asset Management segment and state insurance licenses in the Insurance Solutions segment. Investment management contracts include payments made to purchase existing investment management contracts from third-party investment managers. The Company recognizes indefinite and definite lived investment management contracts. State insurance licenses are deemed intangible assets with an indefinite useful life. The indefinite useful life assessment for the state insurance licenses is based off the circumstances that these licenses are incapable of being separated from the entity and sold, arise from a contractual and legal right to write insurance policies in respective licensed states, and the expected future economic benefits attributable to the asset will flow to the entity.
Intangible assets with definite useful lives are measured at cost less accumulated amortization and accumulated impairment losses. Amortization is recorded using either the straight-line method or another systematic basis that reflects the pattern in which future economic benefits are expected to be consumed over the remaining useful life of the intangible asset. The useful life is based on the estimated periods that the Company expects to collect management fees, which range from 4 to 6 years. Amortization expense is recognized in the Consolidated Statements of Operations in Amortization and impairment of intangible assets. The indefinite useful life assessment for certain investment management contracts is based on the ability to renew these contracts indefinitely. In addition, there are no legal, regulatory or contractual provisions that limit the useful lives of these intangible assets. Intangible assets with definite useful lives are periodically tested for recoverability when indicators are present that indicate carrying amount of the asset or the asset group is not recoverable. A two-step recoverability test is performed where in first step asset is considered impaired when the carrying amount of asset or the asset group is less than future undiscounted cash flows attributed to asset or the asset group. In second step, an impairment charge is determined as the difference between fair value of the asset less the carrying value of the asset.
Intangible assets with indefinite useful lives are not amortized but are subject to an annual impairment test which is performed more frequently if an indication that it is not recoverable arises. Intangible assets are reviewed for impairment annually or more frequently if events or changes in circumstances indicate that the asset may be impaired. Intangible assets are first qualitatively assessed for indicators of impairment by looking at relevant events and circumstances that can affect the significant inputs used to determine the fair value of the indefinite-lived intangible assets. When results of qualitative test indicate that it is more likely than not that an intangible asset is impaired, a quantitative test is performed comparing intangible asset’s fair value to its carrying value. Intangible assets that are determined to be impaired are written down to
F-16
Additional information regarding intangible assets is included in Note 11. Goodwill and intangible assets.
Compensation and benefits
Compensation consists of base salary, benefits, discretionary and non-discretionary bonuses, severance, and stock-based awards. Compensation costs are recorded in compensation and benefits in the Consolidated Statements of Operations.
Certain employees and non-employees who provide services to the Company are granted equity-based awards as compensation that are measured based on the grant date fair value of the award. Equity-based employee awards that require future service are expensed over the relevant period of service. Under the Company’s performance and restricted share unit (“RSU”) plan (the “RSU Plan”), participants may be granted RSUs, each of which represents a conditional right to receive a common share in the future. The RSUs granted under this plan generally vest over a period with 33
Earnings per share
Basic earnings per share is calculated by dividing net income or loss attributable to common shareholders by the weighted average number of common shares outstanding during the period. Diluted earnings per share is calculated in the same manner, except that the number of shares is increased to assume the issuance of potentially dilutive shares using the treasury stock method, unless the effect of such increase would be anti-dilutive. Diluted earnings or loss per share attributable to common stockholders is calculated to give effect to all potentially dilutive common shares that were outstanding during the reporting period. Any potentially dilutive shares are excluded from the calculation for periods when there is a net loss attributable to common stockholders to avoid anti-dilutive effects.
Income taxes
The Company’s Consolidated Financial Statements present current and deferred income tax balances for both domestic and foreign operations, including U.S. federal, state and local income taxes. Any interest and penalties when incurred would be reflected within Income tax (expense) benefit as applicable, in the accompanying Consolidated Statements of Financial Position.
Deferred Income Taxes
Income taxes are accounted for using the asset and liability method of accounting. Under this method, deferred tax assets and liabilities are recognized for the expected future tax consequences of differences between the carrying amounts of assets and liabilities and their respective tax basis, using tax rates in effect for the year in which the differences are expected to reverse. The effect on deferred assets and liabilities of a change in tax rates is recognized in the Consolidated Statements of Operations in the period when the change is enacted. Deferred tax assets are reduced by a valuation allowance when, based on the weight of available evidence, it is more likely than not that some portion or all of the deferred tax assets will not be realized. When evaluating the realizability of the deferred tax assets, all evidence, both positive and negative, is considered. Items considered when evaluating the need for a valuation allowance include the ability to carry back losses, future reversals of existing temporary differences, tax planning strategies, and expectations of future earnings.
For a particular tax-paying component of an entity and within a particular tax jurisdiction, deferred tax assets and liabilities are offset and presented as a single amount within Other assets or Accrued expenses and other liabilities, as applicable, in the accompanying Consolidated Statements of Financial Position.
Uncertain Tax Positions
F-17
The Company analyzes its tax filing positions in all jurisdictions where it is required to file income tax returns, as well as for all open tax years in these jurisdictions. If, based on this analysis, the Company determines that uncertainties in tax positions exist, a reserve is established. The reserve for uncertain tax positions is recorded in Accrued and Other Liabilities in the accompanying Consolidated Statements of Financial Position. The Company recognizes accrued interest and penalties related to uncertain tax positions within the provision for income taxes in the Consolidated Statements of Operations.
The Company assesses uncertain tax positions on the basis of a two-step process: (a) determination is made whether it is more likely than not that the tax positions will be sustained based on the technical merits of the position and (b) those tax positions that meet the more-likely-than-not threshold are recognized as the largest amount of tax benefit that is greater than 50 percent likely to be realized upon ultimate settlement with the related tax authority. Any required liability reduces the tax benefit from the position to the amount determined under step (b), above.
Debt issuance costs
Debt issuance costs consist of costs incurred in obtaining financing and are amortized over the term of the financing using the effective interest method. These costs are generally recorded as a direct deduction from the carrying amount of the related debt liability in the Consolidated Statements of Financial Position. Costs incurred as a result of debt modification are either capitalized or expensed depending on if debt is considered extinguished or modified.
Warrants
The Company accounts for warrants as either equity or liabilities based on an assessment of the warrants’ terms. The assessment considers whether the warrants are freestanding financial instruments, if the warrants are required to be classified as a liability or meet the definition of a derivative asset or a liability under derivative guidance. When the warrants meet the definition of a derivative, the Company evaluates whether warrants meet the scope exception that allow warrants to be classified as equity. The common scope exception applied to derivate warrants is that warrants are considered indexed to the Company’s equity which allows warrants to be classified as equity. Warrant classification assessment requires the use of judgment, is conducted at the time of issuance and as of each subsequent quarterly period end date while the warrants are outstanding. For warrants that either meet the liability classification or are a derivative asset or liability without an available scope exception to classify as equity, warrants are initially and subsequently measured at fair value with changes in fair value presented in the current period earnings. Warrants that meet all of the criteria to be recorded as equity, are required to be recorded as a component of Additional paid-in capital in the Consolidated Statements of Financial Position at the time of issuance.
Recently adopted accounting pronouncements
In March 2024, the Financial Accounting Standards Board (“FASB”) issued Accounting Standards Update (“ASU”) 2024-01, Compensation-Stock Compensation (Topic 718): Scope Application of Profits Interest and Similar Awards, which clarifies how an entity determines whether a profits interest or similar award (hereafter a “profits interest award”) is (1) within the scope of FASB ASC 718, Share-Based Payments, or (2) not a share-based payment arrangement and therefore within the scope of other guidance. This ASU is effective for annual periods beginning after December 15, 2024, and interim periods within those annual periods. The Company adopted this accounting standard effective January 1, 2025 and its adoption on a prospective basis did not have an impact on the Consolidated Financial Statements.
In December 2023, the FASB issued ASU 2023-09, Income Taxes (Topic 740): Improvements to Income Tax Disclosures. This ASU requires public business entities to annually disclose specific categories within the income tax rate reconciliation, and provide additional information for reconciling items that meet a certain quantitative threshold. Additionally, the amendments in this ASU require entities to disclose certain information about income taxes paid, income tax disaggregation, disclosures around unrecognized tax benefits, and the removal of disclosures related to temporary differences surrounding deferred tax liabilities to enhance the transparency and decision usefulness of income tax disclosures. This ASU is effective for annual periods beginning after December 15, 2024 and early adoption is permitted. The Company retrospectively adopted this ASU for the year ended December 31, 2025. See Note 18. Income taxes for details.
F-18
Recently issued accounting pronouncements
In November 2024, the FASB issued ASU 2024-03, Income Statement – Reporting Comprehensive Income – Expense Disaggregation Disclosures. This ASU requires disaggregation of certain expense captions into specified categories in disclosures within the footnotes to the financial statements. The ASU requires presentation in a tabular format of each pertinent expense category on the face of the income statement, such as employee compensation, depreciation, amortization of intangible assets, and other applicable expenses. In January 2025, the FASB issued ASU 2025-01, Income Statement—Reporting Comprehensive Income—Expense Disaggregation Disclosures: Clarifying the Effective Date. ASU 2024-03 will be effective for annual reporting periods beginning after December 15, 2026 and interim reporting periods beginning after December 15, 2027 with early adoption permitted, as clarified in ASU 2025-01. The Company is currently evaluating the impact of adopting ASU 2024-03 on its Consolidated Financial Statements.
In May 2025, the FASB issued ASU 2025–03, Business Combinations (Topic 805) and Consolidation (Topic 810): Determining the Accounting Acquirer in the Acquisition of a Variable Interest Entity (“ASU 2025–03”). This ASU requires an entity involved in an acquisition transaction effected primarily by exchanging equity interests when the legal acquiree is a variable interest entity (“VIE”) that meets the definition of a business to consider factors to determine which entity is the accounting acquirer. When considering those factors, the reporting entity may determine that a transaction in which the legal acquiree is a VIE represents a reverse acquisition. The update will be effective for annual periods (and interim periods in annual reporting periods) beginning after December 15, 2026. The Company is currently evaluating the impact of adopting this ASU on its Consolidated Financial Statements.
Significant accounting policies – Asset Management
The material accounting policies applicable to the Asset Management business are described below.
Revenues
The Company provides investment management and related services to investment funds, CLOs, and other vehicles. The Company’s contracts generally impose single performance obligations, each consisting of a series of similar related services to the customers. The performance obligations are generally satisfied over time as the customers simultaneously receive and consume the benefits of the services rendered and are measured using an output method. The Company recognizes revenue to depict the transfer of promised goods or services to customers in an amount that reflects the consideration the Company expects to be entitled in exchange for those goods or services (i.e., the transaction price). When determining the transaction price, the Company recognizes variable consideration only to the extent that it is probable that a significant reversal in the amount of cumulative revenue will not occur when the uncertainty associated with the variable consideration is subsequently resolved. Additionally, when another party is involved in the Company’s provision of services, the Company determines whether it is the principal which results in the Company presenting revenue gross with a corresponding expense, or is an agent which results in net revenue presentation. The Company evaluates each arrangement separately, considering the transfer of control of the services, as well as, each party’s rights and obligations, including price discretion, inventory risk, and primary responsibility to the end customer.
Customers are billed regularly, typically quarterly and shortly after the control of services have been transferred to the customer. Amounts billed are recorded as receivables and require payment on a short-term basis and, therefore, the contracts do not contain a significant financing component. Additionally, the Company’s customers do not have a right to return the provided services. Fees earned from the Company’s consolidated entities are eliminated in consolidation.
The Company’s revenues include (i) Management fees, (ii) Incentive fees, (iii) Advisory and transaction fees, (iv) Servicing fees, and (v) Performance allocations.
Management fees
The Company provides investment management services to investment funds, CLOs, and other vehicles in exchange for a management fee. Management fees are determined quarterly using an annual rate which are generally based upon (i) a percentage of the capital committed during the commitment period, and thereafter based on the remaining invested capital of unrealized investments, or (ii) net asset value, gross assets, or as otherwise provided in the respective
F-19
agreements. Management fees are recognized over time, during the period in which the related services are performed. Uncollected amounts are classified as Other assets in the Consolidated Statements of Financial Position.
Incentive fees
The Company provides investment management services to investment funds, CLOs, managed accounts and other vehicles in exchange for a management fee, as discussed above and, in some cases an incentive fee, a type of performance revenue. The incentive fee consists of two parts: (i) an income incentive fee which is based on pre-incentive fee net investment income in excess of a hurdle rate and (ii) a capital gains incentive fee which is based on cumulative realized capital gains and losses and unrealized capital depreciation. Incentive fees are considered a form of variable consideration as they are based on the fund achieving certain investment return hurdles. Accordingly, the recognition of such fee is deferred until it is probable that a significant reversal in the amount of cumulative revenue will not occur, which is generally upon liquidation of the investment fund. Uncollected amounts are classified as Other assets in the Consolidated Statements of Financial Position.
Advisory and transaction fees
Advisory and transaction fees generally include origination fees related to assets originated into the Ability investment portfolio by ML Management, and transaction structuring fees for third parties.
The Company evaluates its contractual obligations in accordance with the terms of the related legal agreements when determining whether there is an identifiably distinct performance obligation. Depending on the identifiably distinct service, advisory and transaction fees may be recognized at a point in time or over time. Advisory and transaction fees associated with originating an investment or deal completion are generally recognized at the point in time of completion.
The Company evaluates whether it is acting as a principal or an agent for each specified service. The Company is a principal when it controls the service before it is transferred to the customer and therefore recognizes revenue on a gross basis. The Company is an agent when its promise is to arrange for another party to provide the specified good or service and it does not obtain control before transfer, in which case revenue is recognized on a net basis in the amount of any fee or commission. The Company considers indicators of control such as primary responsibility for fulfillment, risk before transfer, and discretion in establishing pricing.
Servicing fees
The Company provides administrative and reporting services to Sierra Crest Investment Management LLC (“SCIM”) in respect of the management of an investment fund (“ACIF”) in exchange for a servicing fee. The servicing fee is variable consideration as it is calculated quarterly based on the fees received by SCIM under its advisory agreement with ACIF, less a specified fee retained by SCIM, debt servicing expense, compensation and other certain expenses SCIM incurs in connection with investment advisory services it provides to ACIF. As the Company determined it acts as the agent in this relationship, the Company recognizes in income the amount it is entitled to receive or obligated to pay. Servicing fees have typically been a net expense for the Company as reimbursements to SCIM for certain costs and the specified investment advisory fee retained by SCIM exceed the net economic benefit derived under the ACIF advisory agreement and as such, are included within Administration and servicing fees in the Consolidated Statements of Operations. In the Consolidated Statements of Financial Position, uncollected amounts are classified as Due from related parties when money is owed to the Company and money owed by the Company is presented as Due to related parties.
Performance allocations
The Company provides investment management services to investment funds in exchange for a management fee as discussed above and, in some cases a performance allocation. Performance allocations are an allocation of capital that the Company receives in exchange for managing an investment company and are based on pre-incentive fee net investment income in excess of a hurdle rate. Performance allocations are variable consideration as these fees receive an allocation of capital after the investors receive a defined internal rate of return. As variable consideration, recognition of such fee is deferred until it is probable that a significant reversal in the amount of cumulative revenue will not occur, which is generally upon liquidation of the investment fund. The Company has yet to recognize any performance allocations.
F-20
Investments
Investments consist of loans and equity securities.
Loans
Loans consist of corporate loans that are classified as held for investment (“HFI”) since the Company has the ability and intent to hold the loan in the foreseeable future. These assets are recorded at amortized cost basis on the financial statements. The amortized cost basis is the amount the investment is originated or acquired, adjusted for applicable accrued interest, accretion, or amortization of premium, discount, and net deferred fees or costs, and an allowance for credit losses.
Equity securities
Equity securities consist primarily of investments in common stock of companies and mutual funds. These investments are recognized at fair value with changes in fair value recognized in earnings.
Purchase receivables
The Company acquires factored medical receivables for which the FVO is elected. These purchase receivables are presented in Other assets on the consolidated statements of financial position, with fair value movements recognized in Other income (loss), net on the consolidated statements of operations. See Note 17. Other assets and Accrued expenses and other liabilities for further detail.
Significant accounting policies – Insurance Solutions
The material accounting policies applicable to the Insurance Solutions business are described below.
Investments
Investments consist primarily of the following: U.S. government and agency obligations; U.S. state, territories and municipalities obligations, government and agency obligations, corporate, CLOs, corporate loans, asset and mortgage-backed securities, mortgage loans, equity securities, and other invested assets.
Debt securities
The Company accounts for its debt securities at fair value as either AFS or under the fair value option. Classification is dependent on a variety of factors, including expected holding period. The Company makes the accounting policy election at the time of purchase or at eligible remeasurement events.
Unrealized gains and losses for AFS debt securities, calculated as the difference between fair value and amortized cost basis, exclusive of allowances for credit losses, are generally reflected in AOCI. The deferred income tax consequences of unrealized holding gains and losses on AFS securities are also reported in OCI, resulting in a net presentation within OCI. Any component of the overall change in fair value that may be associated with foreign exchange gains and losses on an AFS securities is treated in a manner consistent with the remaining overall change in the instrument’s fair value.
Gains and losses from debt securities under fair value option and sales of an AFS securities that result in gains and losses are recognized in Net gains (losses) from investment activities in the Consolidated Statements of Operations. The gain or loss for AFS debt securities are recognized on a FIFO basis and calculated as the difference between the sale proceeds and the security’s amortized cost basis (reduced by any allowance for credit losses).
F-21
Equity securities
Equity securities consist primarily of investments in common stock of companies and mutual funds. These investments are recognized at fair value with changes in fair value recognized in earnings. Certain investments are valued using the net asset value (“NAV”) per share equivalent calculated by the investment manager as a practical expedient to determine an independent fair value.
Mortgage loans
Mortgage loans are classified as HFI and are reported in the Consolidated Statements of Financial Position at their amortized cost basis. The amortized cost basis is the amount the investment is originated or acquired, adjusted for applicable accrued interest, accretion, or amortization of premium, discount, and net deferred fees or costs, and an allowance for credit losses.
Fair value option
The Company may elect the FVO to carry at fair value for certain financial assets and financial liabilities, including certain debt securities.
Other invested assets
Other invested assets include CLOs, asset-backed securities, and corporate loans. CLOs and asset-backed securities are recognized at fair value using the FVO. Corporate loans are recognized as either HFI or FVO.
Derivative instruments
Freestanding derivatives are instruments that the Company has entered into as part of their overall risk management strategies. Such contracts include interest rate swaps to convert floating-rate interest receipts to fixed-rate interest receipts to reduce exposure to interest rate changes. All derivatives are recognized in Derivatives liability or Derivative assets or both and are presented on a gross basis in the Consolidated Statements of Financial Position and measured at fair value. Changes in fair value are recorded in Accumulated Other Comprehensive Income as the swaps are in hedging relationships, with changes in fair value reclassified into Interest income in the same period as the hedged transactions affect earnings. Any interest accruals will flow through earnings as adjustments to Interest income. The Company’s derivative financial instruments contain credit risk to the extent that its counterparties may be unable to meet the terms of the agreements. The Company attempts to reduce this risk by limiting its counterparties to major financial institutions with strong credit ratings.
To qualify for hedge accounting, at the inception of the hedging relationship, the Company formally documents its risk management objective and strategy for undertaking the hedging transaction. This documentation identifies how the hedging instrument is expected to mitigate the designated risk related to the hedged item and the method that will be used to retrospectively and prospectively assess the hedge effectiveness. A derivative designated as a hedging instrument must be assessed as being highly effective in offsetting the designated risk of the hedged item. Hedge effectiveness is formally assessed at inception and periodically throughout the life of the hedge accounting relationship.
The Company issues and reinsures products or purchases investments that contain embedded derivatives. If it determines an embedded derivative has economic characteristics not clearly and closely related to the economic characteristics of the host contract, and a separate instrument with the same terms would qualify as a derivative instrument, the embedded derivative is bifurcated from the host contract and accounted for separately, unless the FVO is elected on the host contract. Under the FVO, bifurcation of the embedded derivative is not necessary as the entire contract is carried at fair value with all related gains and losses recognized in Net gains (losses) from investment activities in the Consolidated Statements of Operations. Embedded derivatives are carried at fair value in the Consolidated Statements of Financial Position in the same line item as the host contract.
Additionally, reinsurance agreements written on a funds withheld or modco basis contain embedded derivatives. The Company has determined that the obligation to pay the total return on the assets supporting the funds withheld liability represents a total return swap with a floating rate leg. The fair value of embedded derivatives on funds withheld and modco agreements is computed as the unrealized gain (loss) on the underlying assets and is included within the funds withheld under reinsurance contracts in the Consolidated Statements of Financial Position.
F-22
Insurance
The Company’s insurance operations include providing insurance and reinsurance related to LTC, and reinsurance for MYGA products. Insurance contracts are contracts with significant mortality and/or morbidity risks, while investment contracts are contracts without such risks. The MYGA contracts were deemed to be investment contracts as reported as Interest sensitive contract liabilities in the Consolidated Statements of Financial Position. Insurance revenue is comprised primarily of premiums and investment income. For traditional long-duration insurance contracts, the Company reports premiums as revenue when due. Premiums received on MYGA products (a product without significant mortality risk) are not reported as revenue but rather as deposit liabilities. The Company recognizes revenue for charges on these contracts, mostly relating to surrender charges. Interest credited to policyholder accounts is charged to expense.
Future policy benefit reserves represent the present value of future benefits to be paid to or on behalf of policyholders and related expenses less the present value of future net premiums. The liability is measured for each group of contracts (i.e., cohorts) using current cash flow assumptions. Contracts are grouped into cohorts by line of business, product type and cash flow streams, based on the date the policy was acquired (which for the entire LTC portfolio is the date of the acquisition of Ability Insurance). Future policy benefit reserves are adjusted each period because of updating lifetime net premium ratios for differences between actual and expected experience with the retroactive effect of those variances recognized in current period earnings. The Company reviews at least annually in the third quarter, future policy benefit reserves cash flow assumptions, and if the review concludes that the assumptions need to be updated, future policy benefit reserves are adjusted retroactively based on the revised net premium ratio using actual historical experience, updated cash flow assumptions, and the locked-in discount rate with the effect of those changes recognized in current period earnings.
As the Company’s LTC business is in run-off, the locked-in discount rate is used for the computation of interest accretion on future policy benefit reserves recognized in earnings. However, cash flows used to estimate future policy benefit reserves are also discounted using an upper-medium grade (i.e., low credit risk) fixed-income instrument yield reflecting the duration characteristics of the liabilities and is updated each reporting period with changes recorded in AOCI. As a result, changes in the current discount rate at each reporting period are recognized as an adjustment to AOCI and not earnings each period, whereas, changes relating to cash flow assumptions are recognized in the Insurance Solutions section of the Consolidated Statements of Operations.
Reinsurance
A reinsurance contract is a type of insurance contract that is issued by an entity (the reinsurer) to compensate another entity (the cedant) for claims arising from insurance contract(s) issued by the cedant.
Consistent with the overall business strategy, the Company assumes certain policy risks written by other insurance companies and cedes insurance risks to reinsurers. Reinsurance accounting is applied for reinsurance transactions when risk transfer provisions have been met. The Company reviews all contractual features, particularly those that may limit the amount of insurance risk to which the reinsurer is subject or features that delay the timely reimbursement of claims. The Company does not have any assumed or ceded reinsurance contracts for the LTC line of business that do not meet risk transfer requirements. As noted above, the assumed MYGA line of business does not meet the risk requirements as noted above and is therefore considered an investment contract under U.S. GAAP.
The Company uses ceded reinsurance contracts in the normal course of business to manage its risk exposure. For each of its reinsurance agreements, cessions under reinsurance agreements do not discharge the Company’s obligations as the primary insurer. Reinsurance assets represent the benefit derived from reinsurance agreements in-force at the reporting date, considering the financial condition of the reinsurer. Amounts recoverable from reinsurers are estimated in accordance with the terms of the relevant reinsurance contract and historical reinsurance recovery information. Amounts recoverable from reinsurers are based on what the Company believes are reasonable estimates and the balance is reported as an asset in
F-23
the Insurance section of the Consolidated Statements of Financial Position. However, the ultimate amount of the Reinsurance recoverable is not known until all claims are settled.
Ceded reinsurance – Funds withheld with Front Street Re
The Company has a coinsurance with funds withheld arrangement with Front Street Re covering a significant portion of the LTC business (the “Medico” block of policies). Under the funds withheld arrangement, assets are retained by the Company; however, all investment activity pertaining to those assets are passed through to Front Street Re. Investment activity includes any interest income, unrealized gains, and losses, and realized gains and losses from sales on these assets. The liability for this Funds Held agreement is in the liability section of the Insurance section of the Consolidated Statements of Financial Position, and the income statement items related to this contract are in the line item Net investment income (loss) on funds withheld in the Insurance Solutions section of the Consolidated Statements of Operations.
Ceded reinsurance – Modified coinsurance with Vista Life and Casualty Reinsurance Company
The Company also has a modified coinsurance (“Modco”) agreement with Vista Life and Casualty Reinsurance Company (“Vista”). Pursuant to such agreement, the Company retains assets in a designated custody account to support the quota share of the ceded Modco reserves. Similar to a funds withheld arrangement, all investment activity pertaining to those assets are passed through to Vista. Investment activity includes any interest income, unrealized gains, and losses, and realized gains and losses from sales on these assets. The liability for this fund held agreement is netted against the reinsurance recoverable of the Insurance section of the Consolidated Statements of Financial Position, and the income statement items related to this contract are in the line item Net investment income (loss) on funds withheld in the Insurance Solutions section of the Consolidated Statements of Operations.
Ceded reinsurance – Embedded derivatives
As the return on receivables or payable balances under the arrangements with Front Street Re and Vista are not clearly and closely related to the host insurance contract, these contracts are deemed to contain embedded derivatives, which are measured at fair value based on the fair value of the assets held by the Company in designated portfolios to support the underlying liability. The fair value of the embedded derivatives for the funds withheld and Modco agreements are included in the Funds held under reinsurance contracts (Front Street Re) and reinsurance contract assets line items (Vista) in the Consolidated Statements of Financial Position, respectively.
Deferred acquisition costs (“DAC”)
The Company incurs significant costs in connection with its renewals for its MYGA business. Costs that are related directly to the successful acquisition or renewal of MYGA contracts are capitalized as DAC. Such costs for the Company are comprised mostly of incremental direct costs of contract acquisitions and renewals, which for the Company are primarily commissions. DAC related to products with significant revenue streams from sources other than investment of the policyholder funds or with significant surrender charges are amortized to expense on a straight-line basis, at the individual level over the expected term of the related contract. The amortization of deferred acquisition costs is recorded within Amortization of deferred acquisition costs in the Consolidated Statements of Operations.
All other acquisition-related costs, as well as all indirect costs, are expensed as incurred.
Note 3. Business combinations
Acquisition of 180 Degree Capital
On the Closing Date, the Company consummated the Business Combination pursuant to the Merger Agreement, by and among the Company, Legacy Mount Logan, TURN, TURN Merger Sub, and MLC Merger Sub. In accordance with the Merger Agreement, the Company was formed as a holding company to effectuate the mergers. TURN Merger Sub merged with and into TURN (the “TURN Merger”), with TURN continuing as the surviving company and a wholly-owned subsidiary of the Company, and MLC Merger Sub merged with and into Legacy Mount Logan, (the “MLC Merger” and, together with the TURN Merger, the “Mergers”), with Legacy Mount Logan continuing as the surviving company and a wholly-owned subsidiary of the Company. As a result of the Business Combination, the Company changed its name from “Yukon New Parent Inc.” to “Mount Logan Capital Inc.” and its common stock commenced trading on Nasdaq Capital Market under the symbol “MLCI” on September 15, 2025.
F-24
Prior to the closing of the Business Combination, to facilitate the Mergers, Legacy Mount Logan, completed a domestication process where it redomiciled from Canada to the United States. The domestication did not result in any interruption of business or change in ownership for Legacy Mount Logan’s shareholders.
Following the closing of the Business Combination, former Legacy Mount Logan shareholders and former TURN shareholders owned approximately 56 % and 44 %, respectively, of the combined company. All outstanding Legacy Mount Logan and TURN shares were converted into the right to receive shares of the Company common stock at fixed exchange ratios, resulting in approximately 13 million shares of the Company’s common stock outstanding, of which approximately 7.3 million shares and 5.7 million shares were issued to former Legacy Mount Logan shareholders and former TURN shareholders, respectively. TURN’s common shares were delisted from Nasdaq Global Market and TURN deregistered under the Investment Company Act. Legacy Mount Logan’s common shares were delisted from Cboe Canada.
The Company amended its certificate of incorporation and bylaws to align with governance and regulatory standards applicable to a United States publicly traded corporation, reflecting its transition from a Canadian public entity. In addition, the Company adopted the Mount Logan Capital Inc. 2025 Omnibus Incentive Plan (as described in Note 20. Equity based compensation). Furthermore, all Legacy Mount Logan warrants outstanding as of the Closing Date were assumed by the Company and became exercisable for Company common stock.
The transaction was accounted for as a reverse acquisition with Legacy Mount Logan, a legal acquiree, as the accounting acquirer. This determination was based on the relative voting rights, board composition, and management of the combined company, as well as other relevant factors. Retained earnings, historical operations and accumulated other comprehensive income (loss) reflect those of Legacy Mount Logan for the period prior to the closing of the Business Combination. The Company’s historical common shares outstanding, shareholders’ equity and earnings per share, have been retrospectively adjusted based on the Company’s existing capital structure.
The purchase price of $46.8 million was calculated using Legacy Mount Logan’s share price and the number of shares Legacy Mount Logan would have had to issue in order to give TURN’s former shareholders the percentage ownership of Legacy Mount Logan that they had of the Company as of the Closing Date. The acquired net assets consisted of cash of $36.8 million, investments of $15 million, and liabilities of $0.6 million, all initially recorded at fair value. The investments were predominantly composed of equity securities which are recorded at fair value on a recurring basis with changes in fair value recognized in the consolidated statement of operations. As the fair value of TURN’s identifiable net assets exceeded the purchase price, the Company recognized a gain of $4.5 million in “Gain on acquisition” on the consolidated statements of operations. The Company incurred $9.4 million in transaction-related costs, including legal, advisory, and other professional fees. All transaction costs were recognized as expenses within “Transaction costs” on the consolidated statement of operations. The assets and operations of TURN are included in the Company’s Asset Management segment.
The Company issued $5.7 million shares of its common stock to TURN shareholders in connection with the Business Combination, which represented 44.0 % of the voting interests in the Company upon completion of the Business Combination. The purchase price in a reverse acquisition is determined based on the number of equity interests the legal acquiree would have had to issue to give the owners of the legal acquirer the same percentage equity interest in the combined entity that results from the reverse acquisition.
The table below summarizes the hypothetical number of shares as of September 12, 2025 that Legacy Mount Logan would have to issue to give TURN owners the same percentage ownerships in the combined company.
Hypothetical Legacy Mount Logan Ownership | ||||||||||||||
Number of Legacy Mount Logan shares outstanding | Percentage Ownership | |||||||||||||
| Legacy Mount Logan shareholders | % | |||||||||||||
TURN shareholders | % | |||||||||||||
Total | % | |||||||||||||
The purchase price is calculated based on the number of hypothetical shares of Legacy Mount Logan common stock issued to TURN shareholders multiplied by the share price as demonstrated in the table below (dollars in thousands except for the market price per share).
F-25
Number of hypothetical Legacy Mount Logan shares issued to TURN shareholders | ||||||||
| Legacy Mount Logan market price per share as of September 12, 2025 | $ | |||||||
Purchase price determination of hypothetical Legacy Mount Logan shares issued to TURN shareholders | $ | |||||||
Other deal adjustments for expenses incurred | ||||||||
Purchase price consideration | $ | |||||||
F-26
Note 4. Net gains (losses) from investment activities
The table below summarizes the net gains (losses) from investment activities:
| For the years ended December 31, | 2025 | 2024 | ||||||||||||||||||||||||||||||||||||||||||||||||
| Net realized gains (losses) | Net unrealized gains (losses) | Credit releases (losses) | Total | Net realized gains (losses) | Net unrealized gains (losses) | Credit releases (losses) | Total | |||||||||||||||||||||||||||||||||||||||||||
| Asset Management | ||||||||||||||||||||||||||||||||||||||||||||||||||
| Equity securities | $ | $ | $ | $ | $ | $ | ( | $ | $ | ( | ||||||||||||||||||||||||||||||||||||||||
| Derivatives | ||||||||||||||||||||||||||||||||||||||||||||||||||
| Debt obligation | ( | ( | ||||||||||||||||||||||||||||||||||||||||||||||||
| Net gains (losses) from investment activities — Asset Management | $ | $ | $ | $ | $ | $ | ( | $ | $ | ( | ||||||||||||||||||||||||||||||||||||||||
| Insurance Solutions | ||||||||||||||||||||||||||||||||||||||||||||||||||
| Debt securities: | ||||||||||||||||||||||||||||||||||||||||||||||||||
| U.S. state, territories and municipalities | $ | ( | $ | $ | $ | $ | ( | $ | ( | $ | $ | ( | ||||||||||||||||||||||||||||||||||||||
| Other government and agency | ( | ( | ||||||||||||||||||||||||||||||||||||||||||||||||
| Corporate | ( | ( | ( | ( | ||||||||||||||||||||||||||||||||||||||||||||||
| Asset and mortgage- backed securities | ( | ( | ( | |||||||||||||||||||||||||||||||||||||||||||||||
| Corporate loans | ( | ( | ( | |||||||||||||||||||||||||||||||||||||||||||||||
| Mortgage loans | ( | ( | ( | ( | ||||||||||||||||||||||||||||||||||||||||||||||
| Equity securities | ( | ( | ||||||||||||||||||||||||||||||||||||||||||||||||
| Other invested assets | ( | ( | ( | |||||||||||||||||||||||||||||||||||||||||||||||
| Net gains (losses) from investment activities — Insurance Solutions | $ | ( | $ | $ | ( | $ | $ | ( | $ | ( | $ | ( | $ | ( | ||||||||||||||||||||||||||||||||||||
| Investments of consolidated VIEs | ( | ( | ( | ( | ( | |||||||||||||||||||||||||||||||||||||||||||||
| Net gains (losses) from investment activities — Insurance Solutions including consolidated VIEs | $ | ( | $ | $ | ( | $ | $ | ( | $ | ( | $ | ( | $ | ( | ||||||||||||||||||||||||||||||||||||
F-27
Note 5. Net investment income
Net investment income for the Insurance Solutions segment is comprised primarily of Interest income and Dividend income from common and preferred stock. The table below summarizes Net investment income:
| Years Ended December 31, | ||||||||||||||
| 2025 | 2024 | |||||||||||||
| Debt securities | $ | $ | ||||||||||||
| Corporate loans | ||||||||||||||
| Derivative income (expense) | ( | |||||||||||||
| Mortgage loans | ||||||||||||||
| Equity securities | ||||||||||||||
| Other | ||||||||||||||
| Gross investment income: | $ | $ | ||||||||||||
| Less: | ||||||||||||||
| Investment expenses | ( | ( | ||||||||||||
| Net investment income | $ | $ | ||||||||||||
| Investment income of consolidated VIEs | ||||||||||||||
| Net investment income — Insurance Solutions, including consolidated VIEs | $ | $ | ||||||||||||
Note 6. Investments
The following table outlines the carrying value of the Company’s investments:
| As of | December 31, 2025 | December 31, 2024 | ||||||||||||
| Asset Management | ||||||||||||||
| Corporate loans | $ | $ | ||||||||||||
| Equity securities | ||||||||||||||
| Equity method | ||||||||||||||
| Derivatives | ||||||||||||||
| Other invested assets | ||||||||||||||
| Total investments - Asset Management | $ | $ | ||||||||||||
| Insurance Solutions | ||||||||||||||
| Debt securities | $ | $ | ||||||||||||
| Corporate loans | ||||||||||||||
| Mortgage loans | ||||||||||||||
| Equity securities | ||||||||||||||
| Other invested assets | ||||||||||||||
| Total investments - Insurance Solutions | ||||||||||||||
| Corporate loans of consolidated VIEs | ||||||||||||||
| Equity securities of consolidated VIEs | ||||||||||||||
| Total investments - Insurance Solutions, including consolidated VIEs | ||||||||||||||
| Total investments | $ | $ | ||||||||||||
F-28
Financial assets
The following tables summarize the measurement categories of financial assets held by the Company as of December 31, 2025, and December 31, 2024:
| As of December 31, 2025 | Fair value | Amortized cost | Fair value option | Total | ||||||||||||||||||||||
| Financial assets | ||||||||||||||||||||||||||
| Asset Management | ||||||||||||||||||||||||||
| Corporate loans | $ | — | $ | $ | — | $ | ||||||||||||||||||||
| Equity securities | — | — | ||||||||||||||||||||||||
| Derivatives | — | |||||||||||||||||||||||||
| Other invested assets | ||||||||||||||||||||||||||
Total financial assets — Asset Management¹ | $ | $ | $ | $ | ||||||||||||||||||||||
| Insurance Solutions | ||||||||||||||||||||||||||
| Debt securities: | ||||||||||||||||||||||||||
| U.S. government and agency | — | — | ||||||||||||||||||||||||
| U.S. state, territories and municipalities | — | |||||||||||||||||||||||||
| Other government and agency | — | — | ||||||||||||||||||||||||
| Corporate | — | |||||||||||||||||||||||||
| Asset and mortgage-backed securities | — | |||||||||||||||||||||||||
| Corporate loans | — | |||||||||||||||||||||||||
| Mortgage loans | — | — | ||||||||||||||||||||||||
| Equity securities | — | — | ||||||||||||||||||||||||
Other invested assets² | ||||||||||||||||||||||||||
| Total financial assets — Insurance Solutions | $ | $ | $ | $ | ||||||||||||||||||||||
| Corporate loans of consolidated VIEs | — | — | ||||||||||||||||||||||||
| Equity securities of consolidated VIEs | — | — | ||||||||||||||||||||||||
| Total financial assets — Insurance Solutions, including consolidated VIEs | ||||||||||||||||||||||||||
| Total financial assets | $ | $ | $ | $ | ||||||||||||||||||||||
_______________
(1)The MLC US Holdings Credit Facility (as hereinafter defined) is collateralized by assets held by MLC US Holdings, including assets totaling $34.8 million as of December 31, 2025.
(2)Other invested assets primarily include structured securities and loan receivables.
F-29
| As of December 31, 2024 | Fair value | Amortized cost | Fair value option | Total | ||||||||||||||||||||||
| Financial assets | ||||||||||||||||||||||||||
| Asset Management | ||||||||||||||||||||||||||
| Corporate loans | $ | — | $ | $ | — | $ | ||||||||||||||||||||
| Equity securities | — | — | ||||||||||||||||||||||||
| Total financial assets — Asset Management¹ | $ | $ | $ | — | $ | |||||||||||||||||||||
| Insurance Solutions | ||||||||||||||||||||||||||
| Debt securities: | ||||||||||||||||||||||||||
| U.S. government and agency | $ | $ | — | $ | — | $ | ||||||||||||||||||||
| U.S. state, territories and municipalities | — | |||||||||||||||||||||||||
| Other government and agency | — | — | ||||||||||||||||||||||||
| Corporate | — | |||||||||||||||||||||||||
| Asset and mortgage-backed securities | — | |||||||||||||||||||||||||
| Corporate loans | — | — | ||||||||||||||||||||||||
| Mortgage loans | — | — | ||||||||||||||||||||||||
| Equity securities | — | — | ||||||||||||||||||||||||
| Other invested assets² | ||||||||||||||||||||||||||
| Total financial assets — Insurance Solutions | $ | $ | $ | $ | ||||||||||||||||||||||
| Corporate loans of consolidated VIEs | — | — | ||||||||||||||||||||||||
| Equity securities of consolidated VIEs | — | — | ||||||||||||||||||||||||
| Total financial assets — Insurance Solutions, including consolidated VIEs | ||||||||||||||||||||||||||
| Total financial assets | $ | $ | $ | $ | ||||||||||||||||||||||
_______________
(1)The MLC US Holdings Credit Facility (as hereinafter defined) is collateralized by assets held by MLC US Holdings, including assets totaling $31.2 million as of December 31, 2024.
(2)Other invested assets primarily include structured securities and loan receivables.
Available-for-sale – Insurance Solutions
The following table represents the cost or amortized cost, gross unrealized gains, gross unrealized losses, and fair value of available-for-sale (“AFS”) investments by asset type:
| As of December 31, 2025 | Cost or amortized cost | Gross unrealized gains | Gross unrealized losses | Fair value1 | ||||||||||||||||||||||
| Insurance Solutions | ||||||||||||||||||||||||||
| Debt securities: | ||||||||||||||||||||||||||
| U.S. government and agency | $ | $ | $ | ( | $ | |||||||||||||||||||||
| U.S. state, territories and municipalities | ( | |||||||||||||||||||||||||
| Corporate | ( | |||||||||||||||||||||||||
| Asset and mortgage-backed securities | ( | |||||||||||||||||||||||||
| Other invested assets | ( | |||||||||||||||||||||||||
| Total AFS — Insurance Solutions | $ | $ | $ | ( | $ | |||||||||||||||||||||
F-30
| As of December 31, 2024 | Cost or amortized cost | Gross unrealized gains | Gross unrealized losses | Fair value1 | ||||||||||||||||||||||
| Financial assets | ||||||||||||||||||||||||||
| Insurance Solutions | ||||||||||||||||||||||||||
| Debt securities: | ||||||||||||||||||||||||||
| U.S. government and agency | $ | $ | $ | ( | $ | |||||||||||||||||||||
| U.S. state, territories and municipalities | ( | |||||||||||||||||||||||||
| Corporate | ( | |||||||||||||||||||||||||
| Asset and mortgage-backed securities | ( | |||||||||||||||||||||||||
| Other invested assets | ( | |||||||||||||||||||||||||
| Total AFS — Insurance Solutions | $ | $ | $ | ( | $ | |||||||||||||||||||||
_______________
(1)There is no
The maturity distribution for AFS securities is as follows:
| As of December 31, 2025 | ||||||||||||||
| Cost or amortized cost | Fair value | |||||||||||||
| Due in one year or less | $ | $ | ||||||||||||
| Due after one year through five years | ||||||||||||||
| Due after five years through ten years | ||||||||||||||
| Due after ten years | ||||||||||||||
| Total AFS securities | $ | $ | ||||||||||||
Actual maturities can differ from contractual maturities as borrowers may have the right to call or prepay obligations with or without call or prepayment penalties.
The following table provides information about AFS securities for which an allowance for credit losses has not been recorded aggregated by category and length of time that securities have been continuously in an unrealized loss position:
| Less than 12 months | 12 months or more | Total | |||||||||||||||||||||||||||
| As of December 31, 2025 | Fair value | Unrealized losses | Fair value | Unrealized losses | Fair value | Unrealized losses | |||||||||||||||||||||||
| Insurance Solutions | |||||||||||||||||||||||||||||
| Debt securities: | |||||||||||||||||||||||||||||
| U.S. government and agency | $ | $ | ( | $ | $ | ( | $ | $ | ( | ||||||||||||||||||||
| U.S. state, territories and municipalities | ( | ( | |||||||||||||||||||||||||||
| Corporate | ( | ( | ( | ||||||||||||||||||||||||||
| Asset and mortgage-backed securities | ( | ( | ( | ||||||||||||||||||||||||||
| Other invested assets | ( | ( | |||||||||||||||||||||||||||
| Total AFS securities in a continuous loss position | $ | $ | ( | $ | $ | ( | $ | $ | ( | ||||||||||||||||||||
F-31
| Less than 12 months | 12 months or more | Total | |||||||||||||||||||||||||||
| As of December 31, 2024 | Fair value | Unrealized losses | Fair value | Unrealized losses | Fair value | Unrealized losses | |||||||||||||||||||||||
| Insurance Solutions | |||||||||||||||||||||||||||||
| Debt securities: | |||||||||||||||||||||||||||||
| U.S. government and agency | $ | $ | ( | $ | $ | ( | $ | $ | ( | ||||||||||||||||||||
| U.S. state, territories and municipalities | ( | ( | |||||||||||||||||||||||||||
| Corporate | ( | ( | ( | ||||||||||||||||||||||||||
| Asset and mortgage-backed securities | ( | ( | ( | ||||||||||||||||||||||||||
| Other invested assets | ( | ( | |||||||||||||||||||||||||||
| Total AFS securities in a continuous loss position | $ | $ | ( | $ | $ | ( | $ | $ | ( | ||||||||||||||||||||
Unrealized gains and losses can arise from changes in interest rates or other factors, including changes in credit spreads. The Company had gross unrealized losses on below investment grade AFS securities of $4.0 million and $4.5 million as of December 31, 2025 and December 31, 2024, respectively. The single largest unrealized loss on AFS securities was $1.2 million and $1.2 million as of December 31, 2025 and December 31, 2024, respectively. The Company had 313 and 359 positions in an unrealized loss position as of December 31, 2025 and December 31, 2024, respectively.
As of December 31, 2025 and December 31, 2024, AFS securities in an unrealized loss position for 12 months or more consisted of 207 and 216 debt securities, respectively. These debt securities primarily relate to Corporate and U.S. state, municipal and political subdivisions securities, which have depressed values due primarily to an increase in interest rates since the purchase of these securities. Unrealized losses were not recognized in net income on these debt securities since the Company neither intends to sell the securities nor does it believe that it is more likely than not that it will be required to sell these securities before recovery of their cost or amortized cost basis. For securities with significant declines in value, individual security level analysis was performed utilizing underlying collateral default expectations, market data, and industry analyst reports.
Mortgage and corporate loans carried at amortized cost
Mortgage and corporate loans consist of the following:
| December 31, 2025 | December 31, 2024 | |||||||||||||
| Asset Management | ||||||||||||||
| Corporate loans | $ | $ | ||||||||||||
| Total corporate loans | ||||||||||||||
| Allowance for credit losses | ( | ( | ||||||||||||
| Total corporate loans, net of allowance for credit losses | $ | $ | ||||||||||||
| Insurance Solutions | ||||||||||||||
| Commercial real estate mortgage loans | $ | $ | ||||||||||||
| Multi-family mortgage loans | ||||||||||||||
| Other invested assets - corporate loans | ||||||||||||||
| Total mortgage and corporate loans | $ | $ | ||||||||||||
| Allowance for credit losses | ( | ( | ||||||||||||
| Total mortgage and other invested assets - corporate loans, net of allowance for credit losses | $ | $ | ||||||||||||
F-32
The maturity distribution for commercial real estate, multi-family mortgage loans and corporate loans were as follows as of December 31, 2025:
| Asset Management | Corporate loans | |||||||
| 2026 | $ | |||||||
| 2027 | ||||||||
| 2028 | ||||||||
| 2029 | ||||||||
| 2030 | ||||||||
| 2031 and thereafter | ||||||||
| Total | $ | |||||||
| Insurance Solutions | Commercial real estate mortgage loans | Multi-family mortgage loans | Other invested assets - corporate loans | Total loans | ||||||||||||||||||||||
| 2026 | $ | $ | $ | $ | ||||||||||||||||||||||
| 2027 | ||||||||||||||||||||||||||
| 2028 | ||||||||||||||||||||||||||
| 2029 | ||||||||||||||||||||||||||
| 2030 | ||||||||||||||||||||||||||
| 2031 and thereafter | ||||||||||||||||||||||||||
| Total | $ | $ | $ | $ | ||||||||||||||||||||||
Actual maturities could differ from contractual maturities, because borrowers may have the right to prepay (with or without prepayment penalties) and loans may be refinanced.
The carrying value by credit risk and loan type were as follows:
| Asset Management | ||||||||||||||||||||||||||
| Loans – carrying value by credit risk | December 31, 2025 | December 31, 2024 | ||||||||||||||||||||||||
| Level 1 | $ | % | $ | % | ||||||||||||||||||||||
| Level 2 | — | — | % | — | — | % | ||||||||||||||||||||
| Level 3 | — | — | % | — | — | % | ||||||||||||||||||||
| Level 4 | — | — | % | — | — | % | ||||||||||||||||||||
| Level 5 | — | — | % | — | — | % | ||||||||||||||||||||
| Total by credit risk | $ | 100 | % | $ | 100 | % | ||||||||||||||||||||
| Asset Management | ||||||||||||||||||||||||||
| Loans – carrying value by loan type | December 31, 2025 | December 31, 2024 | ||||||||||||||||||||||||
| Corporate loans | $ | % | $ | % | ||||||||||||||||||||||
| Total by loan type | $ | 100 | % | $ | 100 | % | ||||||||||||||||||||
| Insurance Solutions | ||||||||||||||||||||||||||
| Loans – carrying value by credit risk | December 31, 2025 | December 31, 2024 | ||||||||||||||||||||||||
| Level 1 | $ | % | $ | % | ||||||||||||||||||||||
| Level 2 | % | % | ||||||||||||||||||||||||
| Level 3 | % | % | ||||||||||||||||||||||||
| Level 4 | % | % | ||||||||||||||||||||||||
| Level 5 | % | % | ||||||||||||||||||||||||
| Total by credit risk | $ | 100 | % | $ | 100 | % | ||||||||||||||||||||
F-33
| Insurance Solutions | ||||||||||||||||||||||||||
| Loans – carrying value by loan type | December 31, 2025 | December 31, 2024 | ||||||||||||||||||||||||
| Commercial real estate mortgage loans | $ | % | $ | % | ||||||||||||||||||||||
| Multi-family mortgage loans | % | % | ||||||||||||||||||||||||
| Other invested assets - corporate loans | % | % | ||||||||||||||||||||||||
| Total by loan type | $ | 100 | % | $ | 100 | % | ||||||||||||||||||||
The following tables summarizes the activity related to the allowance for credit losses for the year ended December 31, 2025 and 2024:
| Asset Management | Corporate loans | Total loans | ||||||||||||
| Balance, December 31, 2024 | $ | $ | ||||||||||||
| Charge-offs | — | |||||||||||||
| Recoveries | — | |||||||||||||
| Provision for credit losses | — | |||||||||||||
| Balance, December 31, 2025 | $ | $ | ||||||||||||
| Insurance Solutions | Commercial real estate mortgage loans | Multi-family mortgage loans | Corporate loans | Total loans | ||||||||||||||||||||||
| Balance, December 31, 2024 | $ | $ | $ | $ | ||||||||||||||||||||||
| Charge-offs | — | — | — | |||||||||||||||||||||||
| Recoveries | — | — | — | |||||||||||||||||||||||
| Provision for credit losses | ( | ( | ||||||||||||||||||||||||
| Balance, December 31, 2025 | $ | $ | $ | $ | ||||||||||||||||||||||
| Asset Management | Corporate loans | Total loans | ||||||||||||
| Balance, December 31, 2023 | $ | $ | ||||||||||||
| Charge-offs | — | |||||||||||||
| Recoveries | — | |||||||||||||
| Provision for credit losses | — | |||||||||||||
| Balance, December 31, 2024 | $ | $ | ||||||||||||
| Insurance Solutions | Commercial real estate mortgage loans | Multi-family mortgage loans | Corporate loans | Total loans | ||||||||||||||||||||||
| Balance, December 31, 2023 | $ | $ | $ | $ | ||||||||||||||||||||||
| Charge-offs | — | — | — | |||||||||||||||||||||||
| Recoveries | — | — | — | |||||||||||||||||||||||
| Provision for credit losses | ( | |||||||||||||||||||||||||
| Balance, December 31, 2024 | $ | $ | $ | $ | ||||||||||||||||||||||
F-34
The following tables present an analysis of past-due loans:
| December 31, 2025 | ||||||||||||||||||||||||||||||||||||||
| Asset Management | Loans 30-59 days past due | Loans 60-89 days past due | Loans 90 days or more past due | Nonaccrual loans | Current loans | Total loans | ||||||||||||||||||||||||||||||||
| Corporate loans | $ | — | $ | — | $ | — | $ | $ | $ | |||||||||||||||||||||||||||||
| Total corporate loans | $ | $ | $ | $ | $ | $ | ||||||||||||||||||||||||||||||||
| December 31, 2025 | ||||||||||||||||||||||||||||||||||||||
| Insurance Solutions | Loans 30-59 days past due | Loans 60-89 days past due | Loans 90 days or more past due | Nonaccrual loans | Current loans | Total loans | ||||||||||||||||||||||||||||||||
| Commercial real estate mortgage loans | $ | — | $ | — | $ | — | $ | $ | $ | |||||||||||||||||||||||||||||
| Multi-family mortgage loans | — | — | — | |||||||||||||||||||||||||||||||||||
| Other invested assets - corporate loans | — | — | — | — | ||||||||||||||||||||||||||||||||||
| Total mortgage and other invested assets - corporate loans | $ | $ | $ | $ | $ | $ | ||||||||||||||||||||||||||||||||
| December 31, 2024 | ||||||||||||||||||||||||||||||||||||||
| Asset Management | Loans 30-59 days past due | Loans 60-89 days past due | Loans 90 days or more past due | Nonaccrual loans | Current loans | Total loans | ||||||||||||||||||||||||||||||||
| Corporate loans | $ | — | $ | — | $ | — | $ | $ | $ | |||||||||||||||||||||||||||||
| Total corporate loans | $ | $ | $ | $ | $ | $ | ||||||||||||||||||||||||||||||||
| December 31, 2024 | ||||||||||||||||||||||||||||||||||||||
| Insurance Solutions | Loans 30-59 days past due | Loans 60-89 days past due | Loans 90 days or more past due | Nonaccrual loans | Current loans | Total loans | ||||||||||||||||||||||||||||||||
| Commercial real estate mortgage loans | $ | — | $ | — | $ | — | $ | $ | $ | |||||||||||||||||||||||||||||
| Multi-family mortgage loans | — | — | — | |||||||||||||||||||||||||||||||||||
| Other invested assets - corporate loans | — | — | — | — | ||||||||||||||||||||||||||||||||||
| Total mortgage and other invested assets - corporate loans | $ | $ | $ | $ | $ | $ | ||||||||||||||||||||||||||||||||
The Company designates individually evaluated loans on nonaccrual status as collateral-dependent loans, as well as other loans that management of the Company designates as having higher risk. Collateral dependent loans are loans for which the repayment is expected to be provided substantially through the operation or sale of the collateral and the borrower is experiencing financial difficulty. These loans do not share common risk characteristics and are not included within the collectively evaluated loans for determining the allowance for credit losses.
F-35
The following represents total nonaccrual loans:
| December 31, 2025 | ||||||||||||||||||||
| Insurance Solutions | Nonaccrual loans with no allowance | Nonaccrual loans with an allowance | Total nonaccrual loans | |||||||||||||||||
| Commercial real estate mortgage loans | $ | $ | $ | |||||||||||||||||
| Multi-family mortgage loans | — | |||||||||||||||||||
| Other invested assets - corporate loans | — | — | ||||||||||||||||||
| Total loans | $ | $ | $ | |||||||||||||||||
| December 31, 2024 | ||||||||||||||||||||
| Insurance Solutions | Nonaccrual loans with no allowance | Nonaccrual loans with an allowance | Total nonaccrual loans | |||||||||||||||||
| Commercial real estate mortgage loans | $ | $ | $ | |||||||||||||||||
| Multi-family mortgage loans | — | |||||||||||||||||||
| Other invested assets - corporate loans | — | — | ||||||||||||||||||
| Total loans | $ | $ | $ | |||||||||||||||||
The following represents accrued interest receivables written off:
| As of | December 31, 2025 | December 31, 2024 | ||||||||||||
| Insurance Solutions | ||||||||||||||
| Commercial real estate mortgage loans | $ | $ | ||||||||||||
| Multi-family mortgage loans | ||||||||||||||
| Other invested assets - corporate loans | ||||||||||||||
| Total accrued interest receivables written off | $ | $ | ||||||||||||
F-36
The following table represents the portfolio of mortgage and corporate loans by origination year as of December 31, 2025 and December 31, 2024:
| Performance status as of December 31, 2025 | 2025 | 2024 | 2023 | 2022 | 2021 | Prior | Total | |||||||||||||||||||||||||||||||||||||
| Asset Management | ||||||||||||||||||||||||||||||||||||||||||||
| Corporate loans | ||||||||||||||||||||||||||||||||||||||||||||
| Level 1 | $ | $ | $ | $ | $ | $ | $ | |||||||||||||||||||||||||||||||||||||
| Level 2 | ||||||||||||||||||||||||||||||||||||||||||||
| Level 3 | ||||||||||||||||||||||||||||||||||||||||||||
| Level 4 | ||||||||||||||||||||||||||||||||||||||||||||
| Level 5 | ||||||||||||||||||||||||||||||||||||||||||||
| Total corporate loans | $ | $ | $ | $ | $ | $ | $ | — | $ | |||||||||||||||||||||||||||||||||||
| Insurance Solutions | ||||||||||||||||||||||||||||||||||||||||||||
| Commercial real estate loans | ||||||||||||||||||||||||||||||||||||||||||||
| Level 1 | $ | $ | $ | $ | $ | $ | $ | |||||||||||||||||||||||||||||||||||||
| Level 2 | ||||||||||||||||||||||||||||||||||||||||||||
| Level 3 | ||||||||||||||||||||||||||||||||||||||||||||
| Level 4 | ||||||||||||||||||||||||||||||||||||||||||||
| Level 5 | ||||||||||||||||||||||||||||||||||||||||||||
| Total commercial real estate loans | ||||||||||||||||||||||||||||||||||||||||||||
| Multi-family loans | ||||||||||||||||||||||||||||||||||||||||||||
| Level 1 | ||||||||||||||||||||||||||||||||||||||||||||
| Level 2 | ||||||||||||||||||||||||||||||||||||||||||||
| Level 3 | ||||||||||||||||||||||||||||||||||||||||||||
| Level 4 | ||||||||||||||||||||||||||||||||||||||||||||
| Level 5 | ||||||||||||||||||||||||||||||||||||||||||||
| Total multi-family loans | ||||||||||||||||||||||||||||||||||||||||||||
| Other invested assets - corporate loans | ||||||||||||||||||||||||||||||||||||||||||||
| Level 1 | ||||||||||||||||||||||||||||||||||||||||||||
| Level 2 | ||||||||||||||||||||||||||||||||||||||||||||
| Level 3 | ||||||||||||||||||||||||||||||||||||||||||||
| Level 4 | ||||||||||||||||||||||||||||||||||||||||||||
| Level 5 | ||||||||||||||||||||||||||||||||||||||||||||
| Total other invested assets - corporate loans | ||||||||||||||||||||||||||||||||||||||||||||
| Total mortgage and corporate loans | $ | $ | $ | $ | $ | $ | $ | |||||||||||||||||||||||||||||||||||||
F-37
| Performance status as of December 31, 2024 | 2024 | 2023 | 2022 | 2021 | 2020 | Prior | Total | |||||||||||||||||||||||||||||||||||||
| Asset Management | ||||||||||||||||||||||||||||||||||||||||||||
| Corporate loans | ||||||||||||||||||||||||||||||||||||||||||||
| Level 1 | $ | $ | $ | $ | $ | $ | $ | |||||||||||||||||||||||||||||||||||||
| Level 2 | ||||||||||||||||||||||||||||||||||||||||||||
| Level 3 | ||||||||||||||||||||||||||||||||||||||||||||
| Level 4 | ||||||||||||||||||||||||||||||||||||||||||||
| Level 5 | ||||||||||||||||||||||||||||||||||||||||||||
| Total corporate loans | $ | $ | 0 | 0 | $ | |||||||||||||||||||||||||||||||||||||||
| Insurance Solutions | ||||||||||||||||||||||||||||||||||||||||||||
| Commercial real estate loans | ||||||||||||||||||||||||||||||||||||||||||||
| Level 1 | $ | $ | $ | $ | $ | $ | $ | |||||||||||||||||||||||||||||||||||||
| Level 2 | ||||||||||||||||||||||||||||||||||||||||||||
| Level 3 | ||||||||||||||||||||||||||||||||||||||||||||
| Level 4 | ||||||||||||||||||||||||||||||||||||||||||||
| Level 5 | ||||||||||||||||||||||||||||||||||||||||||||
| Total commercial real estate loans | ||||||||||||||||||||||||||||||||||||||||||||
| Multi-family loans | ||||||||||||||||||||||||||||||||||||||||||||
| Level 1 | ||||||||||||||||||||||||||||||||||||||||||||
| Level 2 | ||||||||||||||||||||||||||||||||||||||||||||
| Level 3 | ||||||||||||||||||||||||||||||||||||||||||||
| Level 4 | ||||||||||||||||||||||||||||||||||||||||||||
| Level 5 | ||||||||||||||||||||||||||||||||||||||||||||
| Total multi-family loans | ||||||||||||||||||||||||||||||||||||||||||||
| Other invested assets - corporate loans | ||||||||||||||||||||||||||||||||||||||||||||
| Level 1 | ||||||||||||||||||||||||||||||||||||||||||||
| Level 2 | ||||||||||||||||||||||||||||||||||||||||||||
| Level 3 | ||||||||||||||||||||||||||||||||||||||||||||
| Level 4 | ||||||||||||||||||||||||||||||||||||||||||||
| Level 5 | ||||||||||||||||||||||||||||||||||||||||||||
| Total other invested assets - corporate loans | ||||||||||||||||||||||||||||||||||||||||||||
| Total mortgage and corporate loans | $ | $ | $ | $ | $ | $ | $ | |||||||||||||||||||||||||||||||||||||
The following represents the carrying value of collateral-dependent loans of the Company as of December 31, 2025 and December 31, 2024:
| December 31, 2025 | December 31, 2024 | |||||||||||||
| Commercial real estate mortgage loans | $ | $ | ||||||||||||
| Multi-family mortgage loans | ||||||||||||||
| Total Loans | $ | $ | ||||||||||||
The Company maintains a separate reserve for credit losses on off-balance sheet credit exposures, including unfunded loan commitments, which is included under the line item entitled “Accrued expenses and other liabilities” on the Consolidated Statements of Financial Position. The reserve for credit losses on off-balance sheet credit exposures is adjusted as a provision for credit losses in the income statement. The estimate includes consideration of the likelihood that funding will occur and an estimate of expected credit losses on commitments expected to be funded over its estimated life, utilizing the same models and approaches for the Company's other loan portfolio segments described above, as these unfunded commitments share similar risk characteristics as its loan portfolio segments. The unfunded off-balance sheet credit line commitments for corporate loans accounted for as held for investments (“HFI”) was $1.4 million for Asset Management and $4.3 million for Insurance Solutions as of December 31, 2025 (December 31, 2024: $1.4 million and $4.7 million, for Asset Management and Insurance Solutions, respectively).
F-38
The liability for credit losses on off-balance sheet credit exposures for these loans included in Accrued expenses and other liabilities was less than $0.1
Note 7. Derivatives
The Company uses derivative instruments to manage interest rate risk. See Note 9. Fair value measurements for information about the fair value hierarchy for derivatives.
The following table presents the notional amount and fair value of freestanding derivative instruments:
| December 31, 2025 | December 31, 2024 | |||||||||||||||||||||||||||||||||||||
| Notional amount | Assets | Liabilities | Notional amount | Assets | Liabilities | |||||||||||||||||||||||||||||||||
| Derivatives designated as hedges | ||||||||||||||||||||||||||||||||||||||
| Interest rate swaps | $ | $ | $ | $ | $ | $ | ||||||||||||||||||||||||||||||||
Derivatives designated as hedges
Cash flow hedges
The Company uses interest rate swaps to convert floating-rate interest receipts on its loan portfolio to fixed-rate interest receipts to reduce exposure to interest rate changes. The interest rate swaps will expire by October 2036. During the year ended December 31, 2025 and December 31, 2024, the Company reported a loss of $0.9 million and $5.2 million in Other Comprehensive Income (“OCI”) associated with these hedges, respectively. There were no amounts deemed ineffective during the year ended December 31, 2025 and December 31, 2024. As of December 31, 2025 and December 31, 2024, less than $0.4 million and $0.9 million is expected to be reclassified into income as part of earnings within the next 12 months, respectively.
Embedded derivatives
The Company has embedded derivatives which are required to be separated from their host contracts and reported as derivatives. Host contracts include reinsurance agreements structured on a modified coinsurance (“Modco”) or funds withheld basis. The fair value of the embedded derivative liability is $29.7 million and $34.8 million as of December 31, 2025 and December 31, 2024, respectively.
Credit risk
The Company may be exposed to credit-related losses in the event of counterparty nonperformance on derivative financial instruments. Generally, the current credit exposure of the Company’s derivative contracts is the fair value at the reporting date less any collateral received from the counterparty.
The Company manages credit risk related to derivatives by entering into transactions with creditworthy counterparties. Where possible, the Company maintains collateral arrangements and uses master netting agreements that provide for a single net payment from one counterparty to another at each due date and upon termination. The Company has also established counterparty exposure limits, where possible, in order to evaluate if there is sufficient collateral to support the net exposure. Collateral arrangements typically require the posting of collateral in connection with its derivative instruments. Collateral agreements often contain posting thresholds, some of which may vary depending on the posting party’s financial strength ratings.
There is no difference between the current presentation of the fair value of the interest rate swaps and the presentation of fair value of the interest rate swaps after the application of any right of offset, as of December 31, 2025.
Note 8. Variable interest entities
Consolidated variable interest entities (“VIEs”) include collateralized loan obligations (“CLOs”) managed by the Company. The assets of consolidated VIEs are not available to creditors of the Company, and the investors in these consolidated VIEs have no recourse against the assets of the Company.
F-39
Revenues of consolidated VIEs - Insurance Solutions
The following summarizes the Consolidated Statements of Operations activity of the consolidated VIEs:
| For the Year Ended December 31, | 2025 | 2024 | ||||||||||||
| Investment income | $ | $ | ||||||||||||
| Investment expense | ( | ( | ||||||||||||
| Net investment income | ||||||||||||||
| Unrealized gain/(loss) on investments | ( | ( | ||||||||||||
| Realized gain/(loss) on investments | ( | |||||||||||||
| Net gains (losses) from investment activities | ( | ( | ||||||||||||
| Net revenues of consolidated variable interest entities | $ | $ | ||||||||||||
Unconsolidated VIEs
The Company holds variable interests in certain VIEs for which it is not the primary beneficiary. The Company’s variable interests include equity interests, loans, and beneficial interests in CLOs and other entities, which are recorded within “Investments” in the Consolidated Statements of Financial Position. The following table presents the Company’s maximum exposure to losses relating to these VIEs for which the Company has a variable interest, but is not the primary beneficiary. The Company has exposure beyond the carrying value of its variable interests due to unfunded commitments on loans.
| December 31, 2025 | December 31, 2024 | |||||||||||||||||||||||||
| Carrying amount | Maximum exposure to loss | Carrying amount | Maximum Exposure to Loss | |||||||||||||||||||||||
| Asset Management | ||||||||||||||||||||||||||
| Variable interests | $ | $ | $ | $ | ||||||||||||||||||||||
| Variable interests in related parties | ||||||||||||||||||||||||||
| Total Asset Management | $ | $ | $ | $ | ||||||||||||||||||||||
| Insurance Solutions | ||||||||||||||||||||||||||
| Variable interests | $ | $ | $ | $ | ||||||||||||||||||||||
| Variable interests in related parties | ||||||||||||||||||||||||||
| Total Insurance Solutions | $ | $ | $ | $ | ||||||||||||||||||||||
| Total | $ | $ | $ | $ | ||||||||||||||||||||||
Note 9. Fair value measurements
The following tables summarize the valuation of assets and liabilities measured at fair value by fair value hierarchy. Investments classified as Equity Method for which the Fair Value Option (“FVO”) has not been elected have been excluded from the table below.
F-40
| Fair Value Measurements | ||||||||||||||||||||||||||||||||
| December 31, 2025 | Level 1 | Level 2 | Level 3 | NAV | Total | |||||||||||||||||||||||||||
| Financial assets | ||||||||||||||||||||||||||||||||
| Asset Management | ||||||||||||||||||||||||||||||||
| Equity securities | $ | $ | $ | $ | — | $ | ||||||||||||||||||||||||||
| Derivatives | — | — | — | |||||||||||||||||||||||||||||
| Other invested assets | — | — | — | |||||||||||||||||||||||||||||
| Total financial assets — Asset Management | — | |||||||||||||||||||||||||||||||
| Insurance Solutions | ||||||||||||||||||||||||||||||||
| Debt securities: | ||||||||||||||||||||||||||||||||
| U.S. government and agency | ||||||||||||||||||||||||||||||||
| U.S. state, territories and municipalities | — | — | — | |||||||||||||||||||||||||||||
| Other government and agency | — | — | — | |||||||||||||||||||||||||||||
| Corporate | — | — | ||||||||||||||||||||||||||||||
| Asset and mortgage-backed securities | — | — | ||||||||||||||||||||||||||||||
| Corporate loans | — | — | ||||||||||||||||||||||||||||||
| Equity securities | ||||||||||||||||||||||||||||||||
| Other invested assets | — | |||||||||||||||||||||||||||||||
| Total financial assets — Insurance Solutions | ||||||||||||||||||||||||||||||||
| Corporate loans of consolidated VIEs | ||||||||||||||||||||||||||||||||
| Equity of consolidated VIEs | — | — | — | |||||||||||||||||||||||||||||
| Total financial assets including consolidated VIEs | ||||||||||||||||||||||||||||||||
| Derivatives | — | — | — | |||||||||||||||||||||||||||||
| Total financial assets | $ | $ | $ | $ | $ | |||||||||||||||||||||||||||
| Financial liabilities | ||||||||||||||||||||||||||||||||
| Insurance Solutions | ||||||||||||||||||||||||||||||||
| Ceded reinsurance - embedded derivative | — | — | — | |||||||||||||||||||||||||||||
| Interest rate swaps | — | — | — | |||||||||||||||||||||||||||||
| Total financial liabilities — Insurance Solutions | — | — | — | |||||||||||||||||||||||||||||
| Total financial liabilities | $ | — | $ | $ | — | $ | — | $ | ||||||||||||||||||||||||
F-41
| Fair Value Measurements | ||||||||||||||||||||||||||||||||
| December 31, 2024 | Level 1 | Level 2 | Level 3 | NAV | Total | |||||||||||||||||||||||||||
| Financial assets | ||||||||||||||||||||||||||||||||
| Asset Management | ||||||||||||||||||||||||||||||||
| Equity securities | $ | $ | — | $ | $ | — | $ | |||||||||||||||||||||||||
| Total financial assets — Asset Management | — | — | ||||||||||||||||||||||||||||||
| Insurance Solutions | ||||||||||||||||||||||||||||||||
| Debt securities: | ||||||||||||||||||||||||||||||||
| U.S. government and agency | — | — | — | |||||||||||||||||||||||||||||
| U.S. state, territories and municipalities | — | — | — | |||||||||||||||||||||||||||||
| Other government and agency | — | — | — | |||||||||||||||||||||||||||||
| Corporate | — | — | — | |||||||||||||||||||||||||||||
| Asset and mortgage-backed securities | — | — | ||||||||||||||||||||||||||||||
| Corporate loans | — | — | — | |||||||||||||||||||||||||||||
| Equity securities | ||||||||||||||||||||||||||||||||
| Other invested assets | — | — | — | |||||||||||||||||||||||||||||
| Total financial assets — Insurance Solutions | ||||||||||||||||||||||||||||||||
| Corporate loans of consolidated VIEs | — | — | — | |||||||||||||||||||||||||||||
| Equity securities of consolidated VIEs | — | — | — | |||||||||||||||||||||||||||||
| Total financial assets including consolidated VIEs | ||||||||||||||||||||||||||||||||
| Total financial assets | $ | $ | $ | $ | $ | |||||||||||||||||||||||||||
| Financial liabilities | ||||||||||||||||||||||||||||||||
| Asset Management | ||||||||||||||||||||||||||||||||
| Debt obligations | — | — | — | |||||||||||||||||||||||||||||
| Total financial liabilities — Asset Management | — | — | — | |||||||||||||||||||||||||||||
| Insurance Solutions | ||||||||||||||||||||||||||||||||
| Ceded reinsurance - embedded derivative | — | — | — | |||||||||||||||||||||||||||||
| Interest rate swaps | — | — | — | |||||||||||||||||||||||||||||
| Total financial liabilities — Insurance Solutions | — | — | — | |||||||||||||||||||||||||||||
| Total financial liabilities | $ | — | $ | $ | $ | — | $ | |||||||||||||||||||||||||
The availability of observable inputs can vary depending on the financial asset and is affected by a wide variety of factors, including, for example, the type of instrument, whether the instrument has recently been issued, whether the instrument is traded on an active exchange or in the secondary market, and current market conditions. To the extent that valuation is based on models or inputs that are less observable or unobservable in the market, the determination of fair value requires additional judgment. Accordingly, the degree of judgment exercised by the Company in determining fair value is greatest for instruments categorized as Level 3. The variability and availability of the observable inputs affected by the factors described above may cause transfers between Levels 1, 2, and 3, as discussed further below.
Transfers between level 1 and level 2
The Company records transfers of assets between Level 1 and Level 2 at their fair values at the end of each reporting period. Assets are transferred out of Level 1 when they are no longer transacted with sufficient frequency and volume in an active market. Conversely, assets are transferred from Level 2 to Level 1 when transaction volume and frequency are indicative of an active market. During the year ended December 31, 2025 and December 31, 2024, there were no assets transferred between Level 1 and Level 2.
Transfers between level 1 or 2 and level 3
The Company records transfers of assets between Level 1 or 2 and Level 3 at the end of each reporting period. Assets are transferred into Level 3 when there is a lack of observable valuation inputs.
Conversely, assets are transferred out of Level 3 when valuation inputs become observable. Whether the assets are transferred into Level 1 or 2 will depend on whether the prices are unadjusted and quoted in an active market.
The following tables summarize changes in the Company’s investment portfolio measured and reporting at fair value for which Level 3 inputs were used in determining fair value:
F-42
| Net Change in Unrealized Appreciation (Depreciation) | ||||||||||||||||||||||||||||||||||||||||||||||||||||||||||||||||||||
| Change in unrealized gains (losses) included in income on Level 3 assets and liabilities still held | Change in unrealized gains (losses) included in OCI on Level 3 assets and liabilities still held | |||||||||||||||||||||||||||||||||||||||||||||||||||||||||||||||||||
| Purchases | Sales and repayments | Net realized gain (loss) | Included in OCI | Transfer in ¹ | Transfer out ¹ | |||||||||||||||||||||||||||||||||||||||||||||||||||||||||||||||
| Year Ended December 31, 2025 | Beginning Balance | Ending Balance | ||||||||||||||||||||||||||||||||||||||||||||||||||||||||||||||||||
| Financial assets | ||||||||||||||||||||||||||||||||||||||||||||||||||||||||||||||||||||
| Asset Management | ||||||||||||||||||||||||||||||||||||||||||||||||||||||||||||||||||||
| Equity securities | $ | $ | $ | ( | $ | — | $ | $ | — | $ | — | $ | — | $ | $ | $ | — | |||||||||||||||||||||||||||||||||||||||||||||||||||
| Derivatives | — | — | — | — | — | — | — | |||||||||||||||||||||||||||||||||||||||||||||||||||||||||||||
| Other invested assets | — | — | — | — | — | — | — | — | — | |||||||||||||||||||||||||||||||||||||||||||||||||||||||||||
| Total assets — Asset Management | ( | — | — | — | — | — | ||||||||||||||||||||||||||||||||||||||||||||||||||||||||||||||
| Insurance Solutions | ||||||||||||||||||||||||||||||||||||||||||||||||||||||||||||||||||||
| Debt securities: | ||||||||||||||||||||||||||||||||||||||||||||||||||||||||||||||||||||
| Corporate | — | — | — | — | — | — | — | |||||||||||||||||||||||||||||||||||||||||||||||||||||||||||||
| Asset and mortgage-backed securities | ( | — | ( | — | — | |||||||||||||||||||||||||||||||||||||||||||||||||||||||||||||||
| Corporate loans | ( | ( | — | — | — | |||||||||||||||||||||||||||||||||||||||||||||||||||||||||||||||
| Equity securities | — | — | — | ( | — | — | ( | — | ||||||||||||||||||||||||||||||||||||||||||||||||||||||||||||
| Other invested assets | ( | ( | ( | — | ( | |||||||||||||||||||||||||||||||||||||||||||||||||||||||||||||||
| Total assets — Insurance Solutions | ( | ( | — | |||||||||||||||||||||||||||||||||||||||||||||||||||||||||||||||||
| Equity securities of consolidated VIEs | ( | — | — | — | — | — | ||||||||||||||||||||||||||||||||||||||||||||||||||||||||||||||
| Corporate loans of consolidated VIEs | ( | ( | ( | — | — | — | ( | — | ||||||||||||||||||||||||||||||||||||||||||||||||||||||||||||
| Total financial assets including consolidated VIEs - Insurance Solutions | ( | ( | — | |||||||||||||||||||||||||||||||||||||||||||||||||||||||||||||||||
| Total financial assets | $ | $ | $ | ( | $ | ( | $ | $ | $ | $ | — | $ | $ | $ | ||||||||||||||||||||||||||||||||||||||||||||||||||||||
| Financial liabilities | ||||||||||||||||||||||||||||||||||||||||||||||||||||||||||||||||||||
| Asset Management | ||||||||||||||||||||||||||||||||||||||||||||||||||||||||||||||||||||
| Debt obligations | $ | $ | — | $ | ( | $ | — | $ | ( | $ | — | $ | — | $ | — | $ | $ | $ | — | |||||||||||||||||||||||||||||||||||||||||||||||||
| Total financial liabilities — Asset Management | $ | $ | — | $ | ( | $ | — | $ | ( | $ | — | $ | — | $ | — | $ | $ | $ | — | |||||||||||||||||||||||||||||||||||||||||||||||||
_______________
(1)Transfers into Level 3 are due to decrease in the quantity and reliability of broker quotes obtained. Transfers out of Level 3 are due to an increase in the quantity and reliability of broker quotes obtained. Transfers are assumed to have occurred at the end of the period.
F-43
| Net Change in Unrealized Appreciation (Depreciation) | ||||||||||||||||||||||||||||||||||||||||||||||||||||||||||||||||||||||||||
| Change in unrealized gains (losses) included in OCI on Level 3 assets and liabilities still held | ||||||||||||||||||||||||||||||||||||||||||||||||||||||||||||||||||||||||||
| Purchases | Sales and repayments | Net realized gain (loss) | Included in income | Transfer in ¹ | Transfer out ¹ | Change in consolidation | ||||||||||||||||||||||||||||||||||||||||||||||||||||||||||||||||||||
| Year Ended December 31, 2024 | Beginning Balance | Ending Balance | ||||||||||||||||||||||||||||||||||||||||||||||||||||||||||||||||||||||||
| Financial assets | ||||||||||||||||||||||||||||||||||||||||||||||||||||||||||||||||||||||||||
| Asset Management | ||||||||||||||||||||||||||||||||||||||||||||||||||||||||||||||||||||||||||
| Equity securities | $ | $ | — | $ | — | $ | — | $ | ( | $ | — | $ | — | $ | — | $ | — | $ | $ | ( | $ | — | ||||||||||||||||||||||||||||||||||||||||||||||||||||
| Total assets — Asset Management | — | — | — | ( | — | — | — | — | ( | — | ||||||||||||||||||||||||||||||||||||||||||||||||||||||||||||||||
| Insurance Solutions | ||||||||||||||||||||||||||||||||||||||||||||||||||||||||||||||||||||||||||
| Debt securities: | ||||||||||||||||||||||||||||||||||||||||||||||||||||||||||||||||||||||||||
| Corporate | — | — | — | — | — | — | — | — | — | — | — | — | ||||||||||||||||||||||||||||||||||||||||||||||||||||||||||||||
| Asset and mortgage-backed securities | — | ( | — | ( | ( | — | — | — | ( | |||||||||||||||||||||||||||||||||||||||||||||||||||||||||||||||||
| Corporate loans | ( | ( | — | — | — | ( | — | |||||||||||||||||||||||||||||||||||||||||||||||||||||||||||||||||||
| Equity securities | — | ( | — | — | — | — | — | — | ||||||||||||||||||||||||||||||||||||||||||||||||||||||||||||||||||
| Other invested assets | — | ( | ( | ( | — | — | — | ( | ( | |||||||||||||||||||||||||||||||||||||||||||||||||||||||||||||||||
| Total assets — Insurance Solutions | ( | ( | ( | — | — | ( | ( | |||||||||||||||||||||||||||||||||||||||||||||||||||||||||||||||||||
| Equity securities of consolidated VIEs | — | — | — | — | — | — | ||||||||||||||||||||||||||||||||||||||||||||||||||||||||||||||||||||
| Corporate loans of consolidated VIEs | ( | ( | — | — | — | — | ( | — | ||||||||||||||||||||||||||||||||||||||||||||||||||||||||||||||||||
| Total financial assets including consolidated VIEs - Insurance Solutions | ( | ( | ( | — | — | ( | ( | |||||||||||||||||||||||||||||||||||||||||||||||||||||||||||||||||||
| Total financial assets | $ | $ | $ | ( | $ | $ | ( | $ | ( | $ | $ | — | $ | — | $ | $ | ( | $ | ( | |||||||||||||||||||||||||||||||||||||||||||||||||||||||
| Financial liabilities | ||||||||||||||||||||||||||||||||||||||||||||||||||||||||||||||||||||||||||
| Asset Management | ||||||||||||||||||||||||||||||||||||||||||||||||||||||||||||||||||||||||||
| Debt obligations | $ | $ | — | $ | — | $ | $ | $ | — | $ | — | $ | — | $ | — | $ | $ | ( | $ | — | ||||||||||||||||||||||||||||||||||||||||||||||||||||||
| Total financial liabilities — Asset Management | $ | $ | — | $ | — | $ | $ | $ | — | $ | — | $ | — | $ | — | $ | $ | ( | $ | — | ||||||||||||||||||||||||||||||||||||||||||||||||||||||
_______________
F-44
The valuation techniques and significant unobservable inputs used in Level 3 valuations were as follows:
| Quantitative Information about Level 3 Fair Value Measurements | ||||||||||||||||||||||||||
| December 31, 2025 | Fair value | Valuation technique/ methodology | Unobservable input | Range (weighted average) | ||||||||||||||||||||||
| Financial assets | ||||||||||||||||||||||||||
| Asset management | ||||||||||||||||||||||||||
| Equity securities | $ | Enterprise value | Multiple | |||||||||||||||||||||||
| Equity securities | Market approach | Privately quoted price | NA | |||||||||||||||||||||||
| Equity securities | Option pricing model | Volatility | ||||||||||||||||||||||||
| Option pricing model | Years to exercise | |||||||||||||||||||||||||
| Other invested assets | Probability-Weighted Expected Return Method | Independent probabilities | ||||||||||||||||||||||||
| Probability-Weighted Expected Return Method | Dependent probabilities | |||||||||||||||||||||||||
| Probability-Weighted Expected Return Method | Years to cash flows | |||||||||||||||||||||||||
| Total — Asset Management | $ | |||||||||||||||||||||||||
| Insurance | ||||||||||||||||||||||||||
Debt securities¹: | ||||||||||||||||||||||||||
| Asset and mortgage-backed securities | $ | Discounted cash flow | Discount rate | |||||||||||||||||||||||
| Corporate | Discounted cash flow | Discount rate | ||||||||||||||||||||||||
| Corporate loans | Discounted cash flow | Discount rate | ||||||||||||||||||||||||
| Equity securities | Recent transaction | Transaction price | NA | |||||||||||||||||||||||
| Equity securities | Enterprise value | Multiple | ||||||||||||||||||||||||
| Equity securities | Discounted cash flow | Discount rate | ||||||||||||||||||||||||
| Other invested assets | Discounted cash flow | Discount rate | ||||||||||||||||||||||||
| Total — Insurance Solutions | $ | |||||||||||||||||||||||||
| Equity securities of consolidated VIEs | $ | Enterprise value | Multiple | |||||||||||||||||||||||
| Corporate loans of consolidated VIEs | Recent transaction | Transaction price | NA | |||||||||||||||||||||||
| Corporate loans of consolidated VIEs | Discounted cash flow | Discount rate | ||||||||||||||||||||||||
| Total assets of consolidated VIEs - Insurance Solutions | $ | |||||||||||||||||||||||||
| Total financial assets including consolidated VIEs - Insurance Solutions | $ | |||||||||||||||||||||||||
| Total financial assets | $ | |||||||||||||||||||||||||
_______________
(1)For debt securities where the recent transaction price does not estimate fair value, the Company determines the fair value utilizing a yield analysis.
F-45
| Quantitative Information about Level 3 Fair Value Measurements | ||||||||||||||||||||||||||
| December 31, 2024 | Fair value | Valuation technique/ methodology | Unobservable input | Range (weighted average) | ||||||||||||||||||||||
| Financial assets | ||||||||||||||||||||||||||
| Asset Management | ||||||||||||||||||||||||||
| Equity securities | $ | Discounted cash flow | Discount rate | |||||||||||||||||||||||
| Equity securities | Enterprise value | Multiple | ||||||||||||||||||||||||
| Total — Asset Management | $ | |||||||||||||||||||||||||
| Insurance Solutions | ||||||||||||||||||||||||||
Debt securities¹: | ||||||||||||||||||||||||||
| Asset and mortgage-backed securities | Recent transaction | Transaction price | NA | |||||||||||||||||||||||
| Asset and mortgage-backed securities | Discounted cash flow | Discount rate | ||||||||||||||||||||||||
| Corporate loans | Discounted cash flow | Discount rate | ||||||||||||||||||||||||
| Corporate loans | Enterprise value | Multiple | ||||||||||||||||||||||||
| Equity securities | Discounted cash flow | Discount rate | ||||||||||||||||||||||||
| Other invested assets | Discounted cash flow | Discount rate | ||||||||||||||||||||||||
| Total — Insurance Solutions | ||||||||||||||||||||||||||
| Equity securities of consolidated VIEs | Discounted cash flow | Discount rate | ||||||||||||||||||||||||
| Corporate loans of consolidated VIEs | Recent transaction | Transaction price | NA | |||||||||||||||||||||||
| Corporate loans of consolidated VIEs | Discounted cash flow | Discount rate | ||||||||||||||||||||||||
| Total assets of consolidated VIEs - Insurance Solutions | $ | |||||||||||||||||||||||||
| Total financial assets including consolidated VIEs - Insurance Solutions | ||||||||||||||||||||||||||
| Total investments | $ | |||||||||||||||||||||||||
| Financial liabilities | ||||||||||||||||||||||||||
| Asset Management | ||||||||||||||||||||||||||
| Debt obligation | $ | Enterprise valuation | Revenue multiple | Not Meaningful (NA) | ||||||||||||||||||||||
| Enterprise valuation | EBITDA | Not Meaningful (NA) | ||||||||||||||||||||||||
| Income Approach | Required rate of return | Not Meaningful (NA) | ||||||||||||||||||||||||
| Total financial liabilities - Asset Management | $ | |||||||||||||||||||||||||
| Total financial liabilities | $ | |||||||||||||||||||||||||
_______________
(1)For debt securities where the recent transaction price does not estimate fair value, the Company determines the fair value utilizing a yield analysis.
The Company typically determines the fair value of its performing Level 3 debt investments utilizing a yield analysis. In a yield analysis, a price is ascribed for each investment based upon an assessment of current and expected market yields for similar investments and risk profiles. Additional consideration is given to the expected life, portfolio company performance since close, and other terms and risks associated with an investment. Among other factors, a determinant of risk is the amount of leverage used by the portfolio company relative to the total enterprise value of the company, and the rights and remedies of the Company’s investment within each portfolio company’s capital structure.
Significant unobservable inputs include an illiquidity spread as well as a credit spread, both of which increase the discount rate. These rates are initially set at a level such that the loan valuation equals the initial purchase cost of the loan and are subsequently adjusted at each valuation date to reflect management’s current assessment of market conditions as well as of loan-specific credit and illiquidity risk. Discount rates are subject to adjustment based on both management’s current assessment of market conditions and the economic performance of individual investments. The significant unobservable inputs used in the fair value measurement of the Company’s Level 3 debt securities primarily include current market yields, including relevant market indices, but may also include quotes from brokers, dealers, and pricing services as indicated by comparable investments.
F-46
Financial instruments not carried at fair value
The following tables present carrying amounts and fair values of the Company’s financial assets and liabilities which are not carried at fair value as of December 31, 2025 and December 31, 2024:
| Fair Value Hierarchy | ||||||||||||||||||||||||||||||||
| December 31, 2025 | Carrying value | Fair value | Level 1 | Level 2 | Level 3 | |||||||||||||||||||||||||||
| Financial Assets | ||||||||||||||||||||||||||||||||
| Asset Management | ||||||||||||||||||||||||||||||||
| Corporate loans | $ | $ | $ | — | $ | — | $ | |||||||||||||||||||||||||
| Total financial assets — Asset Management | — | — | ||||||||||||||||||||||||||||||
| Insurance Solutions | ||||||||||||||||||||||||||||||||
| Mortgage loans | — | — | ||||||||||||||||||||||||||||||
| Other invested assets | — | — | ||||||||||||||||||||||||||||||
| Total financial assets — Insurance Solutions | — | — | ||||||||||||||||||||||||||||||
| Total financial assets | $ | $ | $ | — | $ | — | $ | |||||||||||||||||||||||||
| Financial Liabilities | ||||||||||||||||||||||||||||||||
| Asset Management | ||||||||||||||||||||||||||||||||
| Debt obligations | $ | $ | $ | — | $ | — | $ | |||||||||||||||||||||||||
| Total financial liabilities — Asset Management | — | — | ||||||||||||||||||||||||||||||
| Insurance Solutions | ||||||||||||||||||||||||||||||||
| Debt obligations | — | — | ||||||||||||||||||||||||||||||
| Interest sensitive contract liabilities | — | — | ||||||||||||||||||||||||||||||
| Total financial liabilities —Insurance Solutions | — | |||||||||||||||||||||||||||||||
| Total financial liabilities | $ | $ | $ | — | $ | $ | ||||||||||||||||||||||||||
| Fair Value Hierarchy | ||||||||||||||||||||||||||||||||
| December 31, 2024 | Carrying value | Fair value | Level 1 | Level 2 | Level 3 | |||||||||||||||||||||||||||
| Financial Assets | ||||||||||||||||||||||||||||||||
| Asset Management | ||||||||||||||||||||||||||||||||
| Corporate loans | $ | $ | $ | — | $ | — | $ | |||||||||||||||||||||||||
| Total financial assets — Asset Management | — | — | ||||||||||||||||||||||||||||||
| Insurance Solutions | ||||||||||||||||||||||||||||||||
| Mortgage loans | — | — | ||||||||||||||||||||||||||||||
| Other invested assets | — | — | ||||||||||||||||||||||||||||||
| Total financial assets — Insurance Solutions | — | — | ||||||||||||||||||||||||||||||
| Total financial assets | $ | $ | $ | — | $ | — | $ | |||||||||||||||||||||||||
| Financial Liabilities | ||||||||||||||||||||||||||||||||
| Asset Management | ||||||||||||||||||||||||||||||||
| Debt obligations | $ | $ | $ | — | $ | — | $ | |||||||||||||||||||||||||
| Total financial liabilities — Asset Management | — | — | ||||||||||||||||||||||||||||||
| Insurance Solutions | ||||||||||||||||||||||||||||||||
| Debt obligations | — | — | ||||||||||||||||||||||||||||||
| Interest sensitive contract liabilities | — | — | ||||||||||||||||||||||||||||||
| Total financial liabilities —Insurance Solutions | — | |||||||||||||||||||||||||||||||
| Total financial liabilities | $ | $ | $ | — | $ | $ | ||||||||||||||||||||||||||
F-47
Fair value option
The following table presents the net realized and unrealized gains (losses) on financial instruments for which the FVO was elected:
| For the Year Ended December 31, | 2025 | 2024 | ||||||||||||||||||||||||||||||||||||
| Net realized gains (losses) | Net unrealized gains (losses) | Total | Net realized gains (losses) | Net unrealized gains (losses) | Total | |||||||||||||||||||||||||||||||||
| Asset Management | ||||||||||||||||||||||||||||||||||||||
| Debt obligation | $ | — | $ | $ | $ | — | $ | ( | $ | ( | ||||||||||||||||||||||||||||
| Net gains (losses) from investment activities — Asset Management | $ | — | $ | $ | $ | — | $ | ( | $ | ( | ||||||||||||||||||||||||||||
| Insurance Solutions | ||||||||||||||||||||||||||||||||||||||
| Debt securities: | ||||||||||||||||||||||||||||||||||||||
| U.S. government and agency | $ | — | $ | — | $ | — | $ | — | $ | — | $ | — | ||||||||||||||||||||||||||
| U.S. state, territories and municipalities | — | — | ( | ( | ||||||||||||||||||||||||||||||||||
| Other government and agency | — | — | ( | ( | ||||||||||||||||||||||||||||||||||
| Corporate | ( | — | ( | ( | ||||||||||||||||||||||||||||||||||
| Asset and mortgage- backed securities | ( | ( | ||||||||||||||||||||||||||||||||||||
| Corporate loans | ( | ( | ( | |||||||||||||||||||||||||||||||||||
| Mortgage loans | — | — | — | — | — | — | ||||||||||||||||||||||||||||||||
| Equity securities | — | — | — | — | — | — | ||||||||||||||||||||||||||||||||
| Other invested assets | ( | ( | ( | |||||||||||||||||||||||||||||||||||
| Net gains (losses) from investment activities — Insurance Solutions | ( | ( | ( | |||||||||||||||||||||||||||||||||||
| Investments of consolidated VIEs | ( | ( | ( | ( | ( | |||||||||||||||||||||||||||||||||
| Net gains (losses) from investment activities — Insurance Solutions including consolidated VIEs | $ | ( | $ | $ | $ | $ | ( | $ | ( | |||||||||||||||||||||||||||||
F-48
The following table presents information for loans which the Company elected the FVO.
| December 31, 2025 | Unpaid Principal Balance | Mark to Fair Value | Fair Value | |||||||||||||||||
| Insurance Solutions | ||||||||||||||||||||
| Corporate loans | $ | $ | ( | $ | ||||||||||||||||
| Other invested assets | ( | |||||||||||||||||||
| Insurance Solutions | ( | |||||||||||||||||||
| Corporate loans of consolidated VIEs | ( | |||||||||||||||||||
| Insurance Solutions including consolidated VIEs | $ | $ | ( | $ | ||||||||||||||||
| December 31, 2024 | Unpaid Principal Balance | Mark to Fair Value | Fair Value | |||||||||||||||||
| Insurance Solutions | ||||||||||||||||||||
| Corporate loans | $ | $ | ( | $ | ||||||||||||||||
| Other invested assets | ( | |||||||||||||||||||
| Insurance Solutions | ( | |||||||||||||||||||
| Corporate loans of consolidated VIEs | ( | |||||||||||||||||||
| Insurance Solutions including consolidated VIEs | $ | $ | ( | $ | ||||||||||||||||
As of December 31, 2025 and December 31, 2024, there were no loans accounted for at fair value under the FVO which were 90 days or more past-due or in non-accrual status.
The following table presents the estimated amount of gains (losses) included in earnings attributable to changes in instrument-specific credit risk on corporate loans for which the Company elected the FVO.
| For the Years Ended December 31, | 2025 | 2024 | ||||||||||||
| Insurance Solutions | ||||||||||||||
| Corporate loans | $ | $ | ||||||||||||
| Other invested assets | ( | |||||||||||||
| Insurance Solutions | $ | $ | ( | |||||||||||
| Corporate loans of consolidated VIEs | ( | ( | ||||||||||||
| Insurance Solutions including consolidated VIEs | $ | $ | ( | |||||||||||
The portion of gains and losses attributable to changes in instrument-specific credit risk is estimated by identifying loans with changes in credit ratings meeting certain criteria.
Note 10. Revenue from service contracts
The following table summarizes the Company’s revenue from service contracts for Asset Management:
| Year Ended December 31, | ||||||||||||||
| 2025 | 2024 | |||||||||||||
| Management fees | $ | $ | ||||||||||||
| Incentive fees | ||||||||||||||
| Advisory and transaction fees | ||||||||||||||
Servicing fees (expense)¹ | ( | ( | ||||||||||||
_______________
F-49
Note 11. Goodwill and intangible assets
Goodwill
The carrying amount of goodwill by reportable segment was $1.0 30.2 million and $55.7 million for Insurance Solutions as of December 31, 2025 and December 31, 2024 respectively. The Company performed its annual goodwill impairment assessment as of October 1, 2025 for its reporting units, LTC and MYGA under Insurance Solutions. As of such date, it was noted that the carrying value of the LTC reporting unit exceeded its estimated fair value, which resulted in recording a $25.5 million charge to fully impair the goodwill associated with the LTC reporting unit. The excess carrying value of the LTC reporting unit was primarily driven by an increase in its net assets resulting from lower recorded long‑term care (LTC) reserves following a change in the accounting basis from IFRS to U.S. GAAP. Under U.S. GAAP, the revised reserving methodology reduced the level of recognized LTC reserves, thereby increasing the carrying value of the reporting unit. Consequently, the carrying value exceeded the estimated fair value as of the measurement date, resulting in the impairment. In contrast, the fair value of MYGA reporting unit exceeded its respective carrying value by 30.6 %.
The table below presents the changes in the carrying amount of goodwill by reporting units in Insurance Solutions for the year ended December 31, 2025 and December 31, 2024.
| Reporting Unit | ||||||||||||||||||||
| At December 31, 2025 | MYGA | LTC | Total | |||||||||||||||||
| Goodwill, gross | $ | $ | $ | |||||||||||||||||
Accumulated impairment losses¹ | ( | ( | ||||||||||||||||||
| Goodwill, net | ||||||||||||||||||||
| Goodwill, net as of December 31, 2024 | $ | $ | $ | |||||||||||||||||
| Impairment losses | ( | ( | ||||||||||||||||||
| Goodwill, net as of December 31, 2025 | $ | $ | $ | |||||||||||||||||
(1)Accumulated impairment losses include the $25.5 million impairment loss recognized in relation to the LTC reporting unit during the fourth quarter of 2025 and there was no impairment loss recognized during the year ended 2024.
Intangible assets
| December 31, 2025 | ||||||||||||||||||||||||||
| Gross carrying amount | Accumulated amortization | Accumulated impairment | Net carrying amount | |||||||||||||||||||||||
| Asset Management | ||||||||||||||||||||||||||
| Intangible assets — indefinite life | ||||||||||||||||||||||||||
| Investment management contracts | $ | $ | — | $ | ( | $ | — | |||||||||||||||||||
Profit sharing interest¹ | — | ( | ||||||||||||||||||||||||
| Intangible assets — definite life | ||||||||||||||||||||||||||
| Investment management contracts | ( | ( | ||||||||||||||||||||||||
| Total intangible assets — Asset Management | $ | $ | ( | $ | ( | $ | ||||||||||||||||||||
| Insurance Solutions | ||||||||||||||||||||||||||
| Intangible assets — indefinite life | ||||||||||||||||||||||||||
| State insurance licenses | — | — | ||||||||||||||||||||||||
| Total intangible assets — Insurance Solutions | $ | $ | — | $ | — | $ | ||||||||||||||||||||
_______________
F-50
(1)On July 15, 2025, the merging of Logan Ridge Finance Corporation (“Logan Ridge”) into Portman Ridge Finance Corporation (“Portman Ridge” or “Portman”) closed, with the new combined entity renamed to BCP Investment Corporation (“BCIC”). Upon the close of this merger, the Company’s investment management agreement with Logan Ridge was terminated, resulting in an impairment loss for the full carrying amount of the investment management agreement. Upon termination of the investment management agreement with Logan Ridge, the Company acquired a profit-sharing agreement with the owner of Sierra Crest Investment Management (“SCIM”) which is the manager of BCIC, for no cash consideration. The acquisition of the profit-sharing agreement is presented as a gain that offsets the accumulated impairment loss on the Logan Ridge investment management agreement, in “Amortization and impairment of intangible assets” on the Consolidated Statements of Operations. The profit-sharing agreement was determined to be an indefinite-lived intangible asset given the Company expects SCIM to be the investment manager of BCIC indefinitely, and for the owner of SCIM to hold its equity in SCIM indefinitely. During the fourth quarter of 2025, the valuation of the profit-sharing agreement was refined for changes in assumptions, resulting in a decrease in value that was recognized as an impairment loss on the agreement.
| December 31, 2024 | ||||||||||||||||||||||||||
| Gross carrying amount | Accumulated amortization | Accumulated impairment | Net carrying amount | |||||||||||||||||||||||
| Asset Management | ||||||||||||||||||||||||||
| Intangible assets — indefinite life | ||||||||||||||||||||||||||
| Investment management contracts | $ | $ | — | $ | — | $ | ||||||||||||||||||||
| Intangible assets — definite life | ||||||||||||||||||||||||||
| Investment management contracts | ( | ( | ||||||||||||||||||||||||
| Total intangible assets — Asset Management | $ | $ | ( | $ | ( | $ | ||||||||||||||||||||
| Insurance Solutions | ||||||||||||||||||||||||||
| Intangible assets — indefinite life | ||||||||||||||||||||||||||
| State insurance licenses | — | — | ||||||||||||||||||||||||
| Total intangible assets — Insurance Solutions | $ | $ | — | $ | — | $ | ||||||||||||||||||||
The following table represents estimated intangible amortization expense as of December 31, 2025:
| As of | December 31, 2025 | |||||||
| 2026 | $ | |||||||
| 2027 | ||||||||
| 2028 | ||||||||
| 2029 | ||||||||
| 2030 and thereafter | ||||||||
| Total | $ | |||||||
Note 12. Debt obligations
Asset Management
MLC US Holdings Credit Facility
On August 20, 2021, MLC US Holdings entered into a credit facility with a large US-based asset manager, as administrative agent and collateral agent for the lenders, whereby MLC US Holdings may borrow up to $25.0 million by December 31, 2021 (the “MLC US Holdings Credit Facility”). On September 19, 2022, MLC US Holdings entered into an amendment to its existing credit agreement to increase the term loan available thereunder by $4.5 million. The primary use of the proceeds from the amendment was to seed Opportunistic Credit Interval Fund (“OCIF”), an interval fund managed by ML Management. On May 2, 2023, MLC US Holdings entered into an amendment to the MLC US Holdings Credit Facility to increase the term loan available thereunder by an additional $4.5 million. The primary use of the proceeds from the May 2023 amendment was to finance the acquisition of Ovation on July 5, 2023, and other related fees and expenses. On December 17, 2024, MLC US Holdings entered into an amendment of its existing credit agreement to upsize the facility thereunder by approximately $13.0 million to support key business initiatives as well as for general corporate purposes and paying related transaction fees and expenses. The MLC US Holdings Credit Facility matures on August 20, 2027.
Amounts drawn under the MLC US Holdings Credit Facility initially bore interest at London Interbank Offer Rate (“LIBOR”) plus a spread of 7.50 %. The benchmark, LIBOR, was replaced by the secured overnight financing rate (“SOFR”) upon the transition from LIBOR on May 2, 2023. Upon the most recent amendment to the MLC US Holdings Credit Facility, the credit facility bears interest based on a pricing step-down mechanism as the business continues to
F-51
perform, which is expected to reduce the Company's cost of debt over time. Payments of principal and interest are made on each payment date, with the remaining principal outstanding and accrued but unpaid interest payable on August 20, 2027. The MLC US Holdings Credit Facility is collateralized by assets held by MLC US Holdings. The Company is a guarantor of the MLC US Holdings Credit Facility.
The December 2024 amendment to the MLC US Holdings Credit Facility was treated as a debt modification as the instruments were not substantially different since the present value of the cash flows of the modified debt were less than 10 percent different from the present value of the remaining cash flows of the original debt. In December 2024, costs paid to the lenders of $0.4 million were capitalized and included an original issuance discount (“OID”) and are amortized through interest expense.
On September 12, 2025, MLC US Holdings entered into a Limited Waiver and Amendment No. 5 to its Credit Agreement. The lenders waived a specified event of default arising from MLC US Holdings’ failure to satisfy the Interest Expense Coverage Ratio for the fiscal quarter ended June 30, 2025, and certain terms of the Credit Agreement were amended, including updates to defined terms and covenant calibration (such as schedules for the net leverage and interest coverage ratios and related EBITDA adjustments for the year ending December 31, 2025). The amendment also provided for an amendment fee equal to 0.25 % of the aggregate principal amount of loans outstanding immediately prior to effectiveness.
Following the waiver and amendment, the Company remained in compliance with all debt covenants for all periods presented.
Seller notes
On July 1, 2021, the Company completed the acquisition of the management contract for the investment company, Logan Ridge Finance Corporation (“Logan Ridge”), from Capitala Investment Advisors, LLC (“CIA”), through, in part, the issuance of an unsecured promissory note of $4.0 million, which bears no interest and was initially payable by July 1, 2025 but on June 30, 2025 was extended until November 1, 2025. The repayment amount on the maturity date will be adjusted on the initial maturity date to reflect the performance of the investment portfolio of Logan Ridge since closing and shall not be less than $nil or more than $6.0 million. The Company elected to account for this note under the FVO, and remeasured the note to fair value each reporting period, with changes in fair value recognized in earnings. The note was repaid at its repayment amount of $0.1 million on October 31, 2025.
On October 29, 2021, the Company completed the Ability Acquisition through in part the issuance of an unsecured promissory note of $15.0 million, which bears interest at 5.0 % per annum and is payable by October 29, 2031.
Promissory note
On January 29, 2024, the Company raised $18.8 million of debt through the issuance of 18,752 Initial Debenture Units on a non-brokered private placement basis (the “Debenture Unit Offering”). Each Initial Debenture Unit consists of: (i) one 8.85 % paid-in-kind unsecured debenture of the Company, with a principal amount of $1,000 and a maturity date that is eight (8 ) years from the issuance thereof, and (ii) 50 common share purchase warrants of the Company, each of which was exercisable to acquire one common share of the Company at a price of C$2.75 Canadian Dollars (“CAD” or “C$”) per share for a period of eight (8 ) years, from the issuance thereof, provided that the warrants were not permitted to be exercised within the first twelve (12 ) months from the issuance thereof. Following the completion of the Business Combination with TURN, every 4.22 Debenture Warrants entitled the holder to receive, upon exercise, one share of the Company at a price of C$11.61 per share (as adjusted for the Business Combination in accordance with the provisions of a warrant indenture dated as of January 26, 2024, as supplemented by a supplemental warrant indenture dated September 12, 2025 between the Company, Legacy Mount Logan and Odyssey Trust Company).
On December 31, 2025, the Company issued an additional 2,500 unsecured debentures at a price of $1,000 per additional debenture for an aggregate purchase price of $2.5 million (the “Additional Initial Debentures”). The Additional Initial Debentures mature on January 25, 2032 and shall be governed by the Debenture Indenture on the same terms and conditions as the Initial Debenture Units mentioned above. There were no warrants issued with the Additional Initial Debentures.
F-52
Debt obligations consisted of the following as of December 31, 2025 and December 31, 2024:
| As of December 31, 2025 | Maturity date | Stated interest rate | Effective interest rate | Extension options | Total facility | Outstanding balance | ||||||||||||||||||||||||||||||||
MLC US Holdings Credit Facility1 | August 2027 | SOFR + | % | N/A | $ | $ | ||||||||||||||||||||||||||||||||
| Seller note — Ability Acquisition | October 2031 | % | % | N/A | ||||||||||||||||||||||||||||||||||
Debenture units2 | January 2032 | % | % | N/A | ||||||||||||||||||||||||||||||||||
| Total debt | $ | $ | ||||||||||||||||||||||||||||||||||||
_______________
(1)The MLC US Holdings Credit Facility is secured by all assets and interests in assets and proceeds owned and acquired by MLC US Holdings.
(2)The warrants issued with the Initial Debenture Units are recorded in equity at fair value upon issuance and therefore are not required to be subsequently remeasured at fair value on an ongoing basis.
| December 31, 2024 | Maturity date | Stated interest rate | Effective interest rate | Extension options | Total facility | Outstanding balance | ||||||||||||||||||||||||||||||||
Seller note — Capitala Acquisition1 | July 2025 | — | % | — | % | N/A | $ | $ | ||||||||||||||||||||||||||||||
MLC US Holdings Credit Facility2 | August 2027 | SOFR + | % | N/A | ||||||||||||||||||||||||||||||||||
| Seller note — Ability Acquisition | October 2031 | % | % | N/A | ||||||||||||||||||||||||||||||||||
Debenture units3 | January 2032 | % | % | N/A | ||||||||||||||||||||||||||||||||||
| Total debt | $ | $ | ||||||||||||||||||||||||||||||||||||
_______________
(1)The Company elected FVO for the Seller note – Capitala Acquisition. The following balance represents the fair value of the note as of December 31, 2024.
(2)The MLC US Holdings Credit Facility is secured by all assets and interests in assets and proceeds owned and acquired by MLC US Holdings.
(3)The warrants issued with the Initial Debenture Units are recorded in equity at fair value upon issuance and therefore are not required to be subsequently remeasured at fair value on an ongoing basis.
The scheduled principal repayments are as follows:
| As of | 2025 | ||||
| 2026 | $ | ||||
| 2027 | |||||
| 2028 | |||||
| 2029 | |||||
| 2030 | |||||
| 2031 and thereafter | |||||
| $ | |||||
| Transaction costs (net of amortization) | ( | ||||
| Total debt | $ | ||||
For the year ended December 31, 2025, interest expense, including the amortization of debt issuance costs and PIK interest, was $7.8 million (December 31, 2024 – $7.0 million).
Insurance Solutions
Debt obligations
Ability has the following surplus notes outstanding as of December 31, 2025 and December 31, 2024:
| As of December 31, 2025 | Date issued | Date of maturity | Interest rate | Par value | Carrying value of note | |||||||||||||||||||||||||||
| Sentinel Security Life Insurance Company | February, 2013 | June 2028 | % | $ | $ | |||||||||||||||||||||||||||
| Revol One Insurance Company (formerly known as Pavonia Life Insurance Company of Michigan) | August, 2023 | December, 2032 | % | |||||||||||||||||||||||||||||
| Atlantic Coast Life Insurance Company | March, 2025 | March, 2033 | SOFR+ | |||||||||||||||||||||||||||||
| Total surplus notes | $ | $ | ||||||||||||||||||||||||||||||
F-53
| As of December 31, 2024 | Date issued | Date of maturity | Interest rate | Par value | Carrying value of note | |||||||||||||||||||||||||||
| Sentinel Security Life Insurance Company | February, 2013 | June, 2028 | % | $ | $ | |||||||||||||||||||||||||||
| Revol One Insurance Company (formerly known as Pavonia Life Insurance Company of Michigan) | August, 2023 | December, 2032 | % | |||||||||||||||||||||||||||||
| Total surplus notes | $ | $ | ||||||||||||||||||||||||||||||
For the year ended December 31, 2025, interest paid was $1.3 million (December 31, 2024 - $1.3 million).
Refer to Note 9. Fair value measurements for fair value of financial liabilities carried at amortized cost.
The surplus notes are subordinated in right of payment of all indebtedness, policy claims, and other creditor claims. The note issued to Sentinel Security Life Insurance Company (“SSL”) had an initial maturity date of June 12, 2023; however, in the second quarter of 2023, Ability renewed the note, extending the date of maturity to June 12, 2028. On August 30, 2023, Ability, completed a private offering of $12.0 million aggregate principal amount of 10.0 % Surplus Notes due December 2032. On March 31, 2025, Ability, completed another private offering for an aggregate of $3.0 million principal amount of SOFR+6 % Surplus Notes with interest and principal due and payable on March 31, 2033. Payments of interest or principal shall be paid only if Ability has the required levels of statutory surplus and upon prior authorization by the Director of the Nebraska Department of Insurance.
Note 13. Deferred acquisition costs
Information regarding total deferred acquisition costs (“DAC”) for December 31, 2025 and December 31, 2024:
| For the Year Ended December 31, 2025 | ||||||||||||||||||||||||||
| Beginning Balance | Capitalization | Amortization | Ending Balance | |||||||||||||||||||||||
| DAC: | ||||||||||||||||||||||||||
| MYGA | $ | $ | $ | ( | $ | |||||||||||||||||||||
| For the Year Ended December 31, 2024 | ||||||||||||||||||||||||||
| Beginning Balance | Capitalization | Amortization | Ending Balance | |||||||||||||||||||||||
| DAC: | ||||||||||||||||||||||||||
| MYGA | $ | $ | $ | ( | $ | |||||||||||||||||||||
Significant methodologies and assumptions
The Company amortizes DAC related to long-duration contracts on a straight-line basis, at the individual contract level over the expected term of the related contract.
The amortization expense for DAC is included in the Amortization of deferred acquisition costs in the Consolidated Statements of Operations. The estimated future amortization expense related to DAC for the future years is as follows:
| As of | December 31, 2025 | |||||||
| 2026 | $ | |||||||
| 2027 | ||||||||
| 2028 | ||||||||
| 2029 | ||||||||
| 2030 | ||||||||
| 2031 and thereafter | ||||||||
| Total | $ | |||||||
F-54
Note 14. Future policy benefits and related reinsurance recoverable
Future policy benefits comprise substantially all obligations to insureds in the Company’s insurance operations. A summary of future policy benefits and reinsurance recoverable are presented below.
| As of | December 31, 2025 | December 31, 2024 | ||||||||||||
| Reinsurance recoverable | ||||||||||||||
| Long term care reinsurance | $ | $ | ||||||||||||
| Other | ||||||||||||||
Modco investments Vista¹ | ( | ( | ||||||||||||
| Total reinsurance recoverable | $ | $ | ||||||||||||
| Future policy benefits | ||||||||||||||
| Long term care insurance | $ | $ | ||||||||||||
| Other | ||||||||||||||
| Total future policy benefits | $ | $ | ||||||||||||
| Funds held under reinsurance contracts | ||||||||||||||
Funds held arrangement Front Street Re¹ | $ | $ | ||||||||||||
_______________
(1)The Company has a coinsurance or Modco with funds withheld arrangement with its two reinsurers. The Modco agreement with Vista Re dictates that the assets held as collateral are held with the legal right of offset to the related insurance contract liabilities. Therefore, the collateral held for this agreement is netted against the reserves under this contract. The agreement with Front Street Re does not have the legal right of offset therefore the reserves are not presented net of the collateral held, instead they are in the line item “Funds held under reinsurance contracts” in the Consolidated Statements of Financial Position.
F-55
The following tables summarize balances of and changes in future policy benefits reserves:
| Years Ended December 31, | ||||||||||||||
| Long-term care | 2025 | 2024 | ||||||||||||
| Present value of expected net premiums | ||||||||||||||
| Balance, beginning of year | $ | $ | ||||||||||||
| Beginning balance at locked-in discount rate | $ | $ | ||||||||||||
| Change in effect in cashflow assumptions | ( | |||||||||||||
| Effect of actual variances from expected experience | ( | ( | ||||||||||||
| Adjusted balance | ||||||||||||||
| Interest accrual | ||||||||||||||
| Net premiums collected | ( | ( | ||||||||||||
| Effect of foreign currency | ||||||||||||||
| Ending balance at locked-in discount rate | ||||||||||||||
| Effect of changes in discount rate assumptions | ( | ( | ||||||||||||
| Balance, end of year | $ | $ | ||||||||||||
| Present value of Expected Future Policy Benefits | ||||||||||||||
| Balance, beginning of year | $ | $ | ||||||||||||
| Beginning balance at locked-in discount rate | ||||||||||||||
| Change in effect in cashflow assumptions | ||||||||||||||
| Effect of actual variances from expected experience | ||||||||||||||
| Adjusted balance | ||||||||||||||
| Interest accrual | ||||||||||||||
| Benefit payments | ( | ( | ||||||||||||
| Ending balance at locked-in discount rate | $ | $ | ||||||||||||
| Effect of changes in discount rate assumptions | ( | ( | ||||||||||||
| Balance, end of year | $ | $ | ||||||||||||
Net future policy benefit reserves ¹ | $ | $ | ||||||||||||
Less: Reinsurance recoverables, net of allowance for credit losses ² | ( | ( | ||||||||||||
| Net future policy benefit reserves, after reinsurance recoverables | $ | $ | ||||||||||||
_______________
(1)Net future policy benefit reserves excludes $4.5 million and $4.4 million as of December 31, 2025 and December 31, 2024, respectively, of Medico assumed reserves which are 100
(2)Reinsurance recoverables, net of allowance for credit losses excludes $4.5 million and $4.4 million of reinsurance recoverable as of December 31, 2025 and December 31, 2024, respectively.
During 2025, the underlying cash flow assumptions were reviewed with respect to incurred claims anti-selection. The resulting assumption updates resulted in a $2.6 million increase in the liability for future policy benefits, mainly as a result of unfavorable claim anti-selection experience related to rate increase. The effect of actual variances from expected experience observed a $19.1 million increase in the liability for future policy benefits, mainly driven by the lower than expected future premium receipts and higher claims.
During 2024, the underlying cash flow assumptions were reviewed with respect to mortality, lapse, morbidity incidence and morbidity termination. The resulting assumption updates resulted in an $8.6 million increase in the liability for future policy benefits, mainly as a result of unfavorable mortality experience. The effect of actual variances from expected experience observed a $13.8 million increase in the liability for future policy benefits, mainly due to lower than expected future premium receipts and higher claims.
F-56
The following tables provides the amount of undiscounted and discounted expected future gross premiums and expected future benefits and expenses for the LTC line of business:
| Years Ended December 31, | 2025 | 2024 | ||||||||||||||||||||||||
| Long-term care | Undiscounted | Discounted¹ | Undiscounted | Discounted¹ | ||||||||||||||||||||||
| Expected future gross premiums | $ | $ | $ | $ | ||||||||||||||||||||||
| Benefit payments | $ | $ | $ | $ | ||||||||||||||||||||||
_______________
(1)Discount was determined using the current discount rate as of December 31, 2025 and December 31, 2024.
The following table provides the weighted-average durations of and weighted-average interest rates for the liability for future policy benefits:
| Year Ended December 31, | ||||||||||||||
| Long-term care | 2025 | 2024 | ||||||||||||
| Weighted-average duration of liability (years) at current rate | ||||||||||||||
| Weighted-average duration of liability (years) at original rate | ||||||||||||||
| Weighted-average interest rate at current rate | % | % | ||||||||||||
| Weighted-average interest rate at original rate | % | % | ||||||||||||
Note 15. Interest sensitive contract liabilities
The following table shows the outstanding Interest sensitive contract liabilities which represents the policyholder balances for MYGA product line:
| Years Ended December 31, | ||||||||||||||
| 2025 | 2024 | |||||||||||||
| Balance, beginning of year | $ | $ | ||||||||||||
| Deposits | ||||||||||||||
| Product charges | ( | ( | ||||||||||||
| Surrenders and withdrawals | ( | ( | ||||||||||||
| Benefit payments | ( | ( | ||||||||||||
| Interest credited | ||||||||||||||
| Balance at December 31, | $ | $ | ||||||||||||
| Weighted-average annual crediting rate | ||||||||||||||
| At period end: | ||||||||||||||
| Cash surrender value | $ | $ | ||||||||||||
| Net amount at risk: | ||||||||||||||
In the event of death ¹ | $ | $ | ||||||||||||
_______________
MYGA policyholder account balances totaled $364.0 million and $334.9 million, as of December 31, 2025, and 2024, respectively. Changes in policyholder account balances are primarily attributed to deposits associated with new MYGA policies assumed of $43.0 million and $72.8 million and interest credited of $16.1 million and $15.0 million for the year ended December 31, 2025 and December 31, 2024, respectively. These increases were partially offset by surrenders, withdrawals, benefits and product charges of $30.0 million and $9.5 million for the year ended December 31, 2025 and December 31, 2024, respectively. Interest on policyholder account balances is generally credited at minimum guaranteed rates, primarily between 2 % and 7 % at both December 31, 2025 and December 31, 2024.
Note 16. Reinsurance
The Company enters into reinsurance agreements primarily as a purchaser of reinsurance for its LTC line of business and also as a provider of reinsurance for the LTC and MYGA lines of business. The Company participates in
F-57
reinsurance activities in order to limit losses, minimize exposure to significant risks and provide additional capacity for future growth.
Under the terms of the reinsurance agreements, the reinsurer agrees to reimburse the Company for the ceded amount in the event a claim is paid. Cessions under reinsurance agreements do not discharge the Company’s obligation as the primary insurer. In the event that reinsurers do not meet their obligations under the terms of the reinsurance agreements, Reinsurance recoverable balances could become uncollectible.
Accounting for reinsurance requires extensive use of assumptions and estimates, particularly related to the future performance of the underlying business and the potential impact of counterparty credit risks.
Reinsurance recoverable
The Company reinsures its business through two reinsurers. The Company monitors ratings and evaluates the financial strength of its reinsurers by analyzing their financial statements. In addition, the reinsurance recoverable balance due from each reinsurer is evaluated as part of the overall monitoring process. Recoverability of reinsurance recoverable balances is evaluated based on these analyses. The Company uses collateral for its reinsurance recoverable with funds withheld accounts. These reinsurance recoverable balances are stated net of allowance for expected credit loss of $1.1 million and $0.8 million at December 31, 2025 and December 31, 2024, respectively. The Company had $456.7 million and $450.2 million of net ceded reinsurance recoverable at December 31, 2025 and December 31, 2024, respectively. The Company had $41.3 million and $31.1 million of unsecured Reinsurance recoverable balances at December 31, 2025 and December 31, 2024, respectively.
The amounts in the Consolidated Statements of Financial Position include the impact of reinsurance. Information regarding the significant effects of reinsurance was as follows at:
| Long-term care | December 31, 2025 | December 31, 2024 | ||||||||||||
| Reinsurance recoverable | ||||||||||||||
| Medico Insurance Company | $ | $ | ||||||||||||
| Front Street Re | ||||||||||||||
| Vista Life and Casualty Reinsurance Co | ||||||||||||||
| Vista Modco Funds Withheld | ( | ( | ||||||||||||
| Total reinsurance recoverable | $ | $ | ||||||||||||
| Future policy benefits | ||||||||||||||
| Direct | $ | $ | ||||||||||||
| Reinsurance assumed | ||||||||||||||
| Total future policy benefits | $ | $ | ||||||||||||
The amounts in the Consolidated Statements of Comprehensive Income (Loss) include the impact of reinsurance. Information regarding the significant effects of reinsurance was as follows:
F-58
| Long-term care | ||||||||||||||
| Years Ended December 31, | 2025 | 2024 | ||||||||||||
| Net premiums | ||||||||||||||
| Direct premiums | $ | $ | ||||||||||||
| Reinsurance assumed | ||||||||||||||
| Reinsurance ceded | ( | ( | ||||||||||||
| Total net premiums | $ | ( | $ | ( | ||||||||||
Net policy benefit and claims (remeasurement gain on policy liabilities of $ | ||||||||||||||
| Direct | $ | $ | ||||||||||||
| Reinsurance assumed | ||||||||||||||
Reinsurance ceded, net of provision for credit losses ¹ | ( | ( | ||||||||||||
| Total net policyholder benefits and claims | $ | ( | $ | ( | ||||||||||
_______________
(1)The provision for credit losses for reinsurance recoverables for the year ended December 31, 2025 and December 31, 2024 is $0.3 million, and $(0.4 ) million, respectively.
Note 17. Other assets and Accrued expenses and other liabilities
Other assets consist of the following:
| As of | December 31, 2025 | December 31, 2024 | ||||||||||||
| Asset Management | ||||||||||||||
| Management fee receivable - related parties | $ | $ | ||||||||||||
| Incentive fee receivable - related parties | ||||||||||||||
| Deferred tax assets | ||||||||||||||
| Prepaid income taxes | ||||||||||||||
| Accrued interest and dividends receivable - related parties | ||||||||||||||
Purchase receivables 2 | ||||||||||||||
| Ovation goodwill | ||||||||||||||
| Operating lease right of use asset | ||||||||||||||
| Deferred offering costs | ||||||||||||||
| Prepaid insurance | ||||||||||||||
| Other - related parties | ||||||||||||||
| Other | ||||||||||||||
| Total other assets — Asset Management | ||||||||||||||
| Insurance Solutions | ||||||||||||||
| Accrued investment income | ||||||||||||||
Receivable for investments sold ¹ | ||||||||||||||
| Guaranty funds on deposit | ||||||||||||||
| Other | ||||||||||||||
| Total other assets — Insurance Solutions | ||||||||||||||
| Interest receivable of consolidated VIEs | ||||||||||||||
| Total other assets — Insurance Solutions including consolidated VIEs | ||||||||||||||
| Total other assets | $ | $ | ||||||||||||
_______________
(1)Represents amounts due from third-parties for investment sales for which a cash settlement has not occurred.
(2)All purchase receivables were acquired in the fourth quarter of 2025. For the year ended December 31, 2025, there were no unrealized gains or losses nor interest income recognized in relation to these assets.
F-59
Other liabilities and accrued expenses consist of the following:
| As of | December 31, 2025 | December 31, 2024 | ||||||||||||
| Asset Management | ||||||||||||||
| Operating lease liabilities | $ | $ | ||||||||||||
Accounts payable and accrued liabilities¹ | ||||||||||||||
| Total accrued expenses and other liabilities — Asset Management | ||||||||||||||
| Insurance Solutions | ||||||||||||||
Payable for investments purchased² | ||||||||||||||
| Other accrued expenses | ||||||||||||||
| Total accrued expenses and other liabilities — Insurance Solutions | ||||||||||||||
| Total accrued expenses and other liabilities | $ | $ | ||||||||||||
_______________
(1)As part of its acquisition of TURN in connection with the Business Combination on September 12, 2025, the Company acquired benefit plans which TURN historically administered which provide medical and dental insurance for retirees and their spouses who, at the time of their retirement, attained certain years of service at a certain age. As of December 31, 2025, the Company had $0.4 million accumulated post-retirement benefit obligation. These plans were terminated prior to the acquisition date and provide medical benefits to former employees who are grandfathered under the plan’s former terms. The net periodic post-retirement benefit cost includes service cost and interest cost on the accumulated post-retirement benefit obligation. Unrecognized actuarial gains and losses will be recognized as net periodic benefit cost within general, administrative and other expenses under the Asset Management segment. Unamortized prior service cost was fully amortized prior to the acquisition date. Refer to Note 3. Business combinations for more information on the Company’s acquisition of TURN.
(2)Represents amounts owed to third-parties for investment purchases for which a cash settlement has not occurred.
Note 18. Income taxes
Current tax is the amount of income tax recoverable (payable) in respect of the taxable loss (profit) for a period. Deferred tax is recognized on temporary differences between the carrying amounts of assets and liabilities for accounting and tax purposes. Deferred income tax assets and liabilities are measured at the tax rates expected to apply when temporary differences reverse. Current and deferred taxes are offset only when they are levied by the same tax authority, on the same entity or group of entities, and when there is a legal right to offset.
Income earned through the Company's foreign subsidiaries is generally taxed in the foreign country in which they operate. Prior to the Domestication (as defined below) of Legacy Mount Logan to the United States (US), Legacy Mount Logan was subject to income taxes in Canada, which included taxes on the income earned through Legacy Mount Logan's controlled US subsidiaries, but a deduction was allowed for certain US taxes paid on such income.
F-60
The effective income tax rate reflected in the Consolidated Statements of Operations varies from the United States and Canadian tax rates of 21.0 percent and 26.5 percent for the year ended December 31, 2025 (December 31, 2024 – 21.0 percent and 26.5 percent) for the items outlined in the following table.
| Years Ended December 31, | ||||||||||||||||||||||||||
| 2025 | 2025 | 2024 | 2024 | |||||||||||||||||||||||
| Income (loss) before taxes | $ | ( | $ | ( | ||||||||||||||||||||||
Income tax rate ¹ | ||||||||||||||||||||||||||
| Income tax expense at statutory tax rate | ( | ( | ||||||||||||||||||||||||
State and local income taxes, net of federal (national) income tax effect 2 | ( | % | ||||||||||||||||||||||||
| Foreign tax effects (Canada): | —% | |||||||||||||||||||||||||
| Statutory tax rate difference between Canada and the US | ( | % | ( | |||||||||||||||||||||||
| Nondeductible Differences | ( | % | ( | |||||||||||||||||||||||
Domestication capital gain 1 | ( | % | ||||||||||||||||||||||||
| Partnership differences | ( | % | ||||||||||||||||||||||||
| Foreign accrual property income impact | ( | % | ( | |||||||||||||||||||||||
Net Operating Loss 3 | ( | % | ||||||||||||||||||||||||
Change in valuation allowances 4 | ( | % | ( | |||||||||||||||||||||||
| Dividends Received Deduction | ( | % | ||||||||||||||||||||||||
| Deferred True Up | ( | % | ||||||||||||||||||||||||
| Other | ( | % | ( | |||||||||||||||||||||||
| Income tax expense (benefit) | $ | ( | % | $ | ( | |||||||||||||||||||||
_______________
(1)On September 12, 2025, pursuant to a Plan of Domestication, immediately prior to the Mergers, (i) Legacy Mount Logan domesticated from the Province of Ontario, Canada to the State of Delaware, (ii) immediately following step (i), Mount Logan converted to a limited liability company, and (iii) immediately following (ii), Mount Logan made an election to be treated as a corporation for U.S. federal income tax purposes (the “Domestication”). As a result of the Domestication and the completion of the Business Combination, the Company is subject to a statutory tax rate of 21% in the U.S. as compared to the 26.5% statutory Canadian corporate income tax rate applicable to Legacy Mount Logan prior to the Domestication.
(2)State taxes in Texas, California, Massachusetts, Minnesota, Georgia, New Jersey, Utah, New York and New York City make up the majority of the tax effect in this category.
(3)As a result of the Domestication, the NOL generated in Canada is not expected to provide a future tax benefit as the Company does not anticipate future taxable income or tax due in Canada.
Income taxes paid
The Company’s cash paid for taxes included in the consolidated statements of cash flows consists of the following:
F-61
| Years Ended December 31, | ||||||||||||||
| 2025 | 2024 | |||||||||||||
| US Federal | $ | $ | ||||||||||||
| NY State | ||||||||||||||
| NY City | ||||||||||||||
| Texas | ||||||||||||||
| Massachusetts | ||||||||||||||
| Minnesota | ||||||||||||||
| Georgia | ||||||||||||||
| Other States | ||||||||||||||
| Foreign | ||||||||||||||
| Income taxes paid | $ | $ | ||||||||||||
For the year ended December 31, 2025, the Company received $0.3 million in tax refunds (December 31, 2024 - $0.1 million).
Components of income tax provision
The details of income (loss) before income taxes by jurisdiction are as follows:
| Years Ended December 31, | ||||||||||||||
| 2025 | 2024 | |||||||||||||
| United States | $ | ( | $ | ( | ||||||||||
| Foreign | ( | ( | ||||||||||||
| Income (loss) before taxes | $ | ( | $ | ( | ||||||||||
The details of the income tax provision by jurisdiction are as follows:
| Years Ended December 31, | ||||||||||||||
| 2025 | 2024 | |||||||||||||
| Current tax | ||||||||||||||
| Federal | $ | ( | $ | |||||||||||
| State | ||||||||||||||
| Foreign | ||||||||||||||
| Total current tax | $ | $ | ||||||||||||
| Deferred tax | ||||||||||||||
| Federal | $ | $ | ( | |||||||||||
| State | ||||||||||||||
| Foreign | ||||||||||||||
| Total deferred tax | $ | $ | ( | |||||||||||
| Income tax expense (benefit) | $ | $ | ||||||||||||
F-62
Deferred tax assets and liabilities consists of the following temporary differences:
| December 31, 2025 | December 31, 2024 | |||||||||||||
| Assets | ||||||||||||||
| Tax benefit of loss carryforward | $ | $ | ||||||||||||
| Tax benefit of expenditure pools | ||||||||||||||
| Deferred acquisition costs | ||||||||||||||
| Unrealized losses on remeasurement of investments | ||||||||||||||
| Other assets tax value in excess of book value | ||||||||||||||
| Total deferred tax assets | ||||||||||||||
| Valuation allowance | ( | ( | ||||||||||||
| Total deferred tax assets, net of valuation allowance | $ | $ | ||||||||||||
| Liabilities | ||||||||||||||
| Insurance reserves | $ | ( | $ | ( | ||||||||||
| Other | ( | ( | ||||||||||||
| Total deferred tax liabilities | $ | ( | $ | ( | ||||||||||
| Net deferred tax assets | $ | $ | ||||||||||||
The Company considers its significant tax jurisdictions to include the United States and before the acquisition of TURN, Canada. The Company remains subject to income tax examination in Canada for years after 2021, and U.S. federal jurisdiction for years after 2022.
On August 16, 2022, the U.S. enacted the Inflation Reduction Act of 2022 (“IRA”) which is generally effective for years beginning after December 31, 2022. Notably, the bill created a 15% corporate alternative minimum tax (“CAMT”) on corporations with three-year average financial statement income over $1 billion. The Internal Revenue Service has issued proposed regulations and multiple interim notices addressing CAMT computations, status determinations, and administrative relief; final regulations are pending. The Company has made certain interpretations and assumptions to comply with CAMT. The Company’s financial statement income is below $1 billion, therefore it is not expected that the Company would have a CAMT liability. If CAMT is paid in the future, the amount would be indefinitely available as a credit carryforward that would reduce tax in future years and would be treated as a temporary item reflected within deferred taxes. The Company has no uncertain tax positions.
As of December 31, 2025, the Company’s U.S. income tax returns for tax years 2022 through 2025 generally remain subject to examination by the applicable taxing authorities, although tax year 2021 may remain open in certain U.S. state jurisdictions. In Canada, tax years 2021 through 2025 generally remain open to examination.
The Company has reviewed and made an assessment of the potential exposure to Pillar Two income taxes. The review was generally based on the most recent information available from tax filings, country-by-country reporting and financial statements, and takes into account known changes in the group and its operations. Based on the review and assessment the Company has concluded that they do not have any potential exposure to Pillar Two income taxes.
On July 4, 2025, the One Big Beautiful Bill Act ('OBBBA') was enacted. The Company has evaluated its provisions and concluded there is no material impact on the consolidated financial statements or effective tax rate for the year ended December 31, 2025. Furthermore, no material impact is expected on future results of operations, financial condition, or cash flows. The Company will continue to monitor any guidance or regulations issued by the Treasury Department.
Note 19. Equity
Common shares
The number of shares issued and outstanding, earnings per share, additional paid-in capital, dividends paid per share and all references to share quantities of the Company have been retrospectively adjusted to reflect the Company’s existing capital structure post merger with TURN. Refer to Note 3. Business combinations for further detail.
F-63
The Company is authorized to issue 150 million common shares, par value $0.001 per share. The common shares are not redeemable or convertible. Dividends are declared by the Company’s Board of Directors (the “Board”) at its discretion. Historically, the board of directors of Legacy Mount Logan has declared dividends on a quarterly basis and the amount could vary from quarter to quarter.
As of December 31, 2025, there were 12,786,770 6,133,631 382,809 shares (net of tax) in respect of vested RSUs (inclusive of Dividend Equivalent Units (“DEUs”)), 4,101 shares in satisfaction of debt obligations owed in connection with the provision of certain consulting services, 637,880 common shares for the minority investment in Runway Growth Capital LLC (“Runway”), 122,308 common shares for the further investment in a Canadian fixed income manager, and 5,666,700 shares for the reverse acquisition of TURN during the year ended December 31, 2025. The issuances of these shares occurred for common stock in the Company both pre- and post-Business Combination. Upon the completion of the Business Combination, the outstanding common shares of Legacy Mount Logan were converted into the common shares of the Company. Subsequent to the Business Combination, the Company repurchased 160,658 common shares and cancelled one common share due to the effect of rounding upon conversion of the Company’s legacy shares to the new capital structure. The Company issued 161,877 shares (net of tax) in respect of vested RSUs (inclusive of DEUs) during the year ended December 31, 2024. There were no other transactions with shareholders for the year ended December 31, 2025 and 2024.
Preferred shares
The Company is authorized to issue 50 0.001
Dividends
Dividends to the Company's shareholders are recorded on the declaration date. The payment of any cash dividend to shareholders of the Company in the future will be at the discretion of the Board and will depend on, among other things, the financial condition, capital requirements and earnings of the Company, and any other factors that the Board may consider relevant.
The following table reflects the distributions declared on the common shares of the Company during the year ended December 31, 2025 and December 31, 2024:
| Dividend amount per share | Total dividend amount | |||||||||||||||||||||||||||||||||||||
| Declaration Date | Record Date | Payment Date | CAD | USD ¹ | CAD | USD ¹ | ||||||||||||||||||||||||||||||||
| March 13, 2025 | April 3, 2025 | April 10, 2025 | $ | $ | $ | $ | ||||||||||||||||||||||||||||||||
| May 15, 2025 | May 27, 2025 | June 2, 2025 | ||||||||||||||||||||||||||||||||||||
| August 7, 2025 | August 19, 2025 | August 25, 2025 | ||||||||||||||||||||||||||||||||||||
| November 5, 2025 | November 25, 2025 | December 11, 2025 | ||||||||||||||||||||||||||||||||||||
| $ | $ | |||||||||||||||||||||||||||||||||||||
| Dividend amount per share | Total dividend amount | |||||||||||||||||||||||||||||||||||||
| Declaration Date | Record Date | Payment Date | CAD | USD ¹ | CAD | USD ¹ | ||||||||||||||||||||||||||||||||
| March 13, 2024 | March 25, 2024 | April 2, 2024 | $ | $ | $ | $ | ||||||||||||||||||||||||||||||||
| May 9, 2024 | May 22, 2024 | May 31, 2024 | ||||||||||||||||||||||||||||||||||||
| August 8, 2024 | November 22, 2024 | November 29, 2024 | ||||||||||||||||||||||||||||||||||||
| November 7, 2024 | November 22, 2024 | November 29, 2024 | ||||||||||||||||||||||||||||||||||||
| $ | $ | |||||||||||||||||||||||||||||||||||||
_______________
(1)Dividends were issued and paid in CAD until the December 2025 dividend payment which was issued and paid in USD. For reporting purposes, CAD dividend amounts recorded in equity were translated to USD using the daily exchange rate on the date of declaration. Going forward, the Company expects to declare and pay dividends in USD.
Warrants
On October 19, 2018, Legacy Mount Logan announced the completion of a plan of arrangement under the provisions of the Business Corporations Act (Ontario) pursuant to which, among other things, each common share in the
F-64
capital of Legacy Mount Logan was exchanged for one common share in the capital of the company created pursuant to the arrangement and pursuant to which Legacy Mount Logan changed its name from Marret Resource Corp. to Mount Logan Capital Inc. (the “Arrangement”). Upon closing of the Arrangement and in accordance with the terms of the Arrangement, Legacy Mount Logan issued to shareholders who made an election to acquire warrants under the Arrangement warrants to acquire an aggregate of 20,468,128 common shares of Legacy Mount Logan (the “Arrangement Warrants”). As a result of a share consolidation completed on December 3, 2019, every eight (8) Arrangement Warrants entitled the holder to receive, upon exercise, one common share of Legacy Mount Logan at a price of C$6.16 per common share. On September 12, 2025, the Company completed a business combination pursuant to which the businesses of Legacy Mount Logan and 180 Degree Capital Corp., a corporation organized under the laws of the State of New York (“180 Degree Capital”) were combined, and pursuant to which, among other things, each of 180 Degree Capital and Legacy Mount Logan became direct wholly-owned subsidiaries of the Company and each of the issued and outstanding shares of each of 180 Degree Capital and Legacy Mount Logan were cancelled and (other than with respect to certain excluded shares) converted into the right to receive a certain number of shares of the Company’s common stock (the “Business Combination”). Following the completion of the Business Combination, every 33.78 Arrangement Warrants entitled the holder to receive, upon exercise, one common share of the Company at a price of C$26.01 per share. Accordingly, as of December 31, 2025, an aggregate of up to 606,009 shares of the Company were issuable upon the exercise of the 20,468,128 outstanding Arrangement Warrants. The Arrangement Warrants expired on October 19, 2025.
Separately on January 26, 2024, Legacy Mount Logan issued 50 common share purchase warrants (each, a “Debenture Warrant”) for each of the 18,752 debenture units that were issued on a non-brokered private placement (refer to Note 12. Debt obligations for further detail). Each Debenture Warrant was exercisable to acquire one common share of Legacy Mount Logan at a price of C$2.75 per share for a period of eight (8 ) years from the issuance thereof, provided that the Debenture Warrants were not exercisable during the first twelve (12 ) months following the issuance. Following the completion of the Business Combination, every 4.22 Debenture Warrants entitled the holder to receive, upon exercise, one share of the Company at a price of C$11.61 per share (as adjusted for the Business Combination in accordance with the provisions of a warrant indenture dated as of January 26, 2024, as supplemented by a supplemental warrant indenture dated September 12, 2025 between the Company, Legacy Mount Logan and Odyssey Trust Company). Accordingly, an aggregate of up to 222,079 shares of the Company are issuable upon the exercise of the 937,600 outstanding Debenture Warrants as of December 31, 2025 (December 31, 2024 - 222,079 ).
F-65
Accumulated other comprehensive income (loss)
| Unrealized investment gains (losses) on available-for-sale securities | Unrealized gains (losses) on hedging instruments | Remeasurement gains (losses) on future policy benefits related to discount rate | Cumulative translation adjustment | Accumulated other comprehensive income (loss) | ||||||||||||||||||||||||||||
| Balance at December 31, 2024 | $ | ( | $ | ( | $ | $ | ( | $ | ||||||||||||||||||||||||
| Other comprehensive income (loss), before reclassifications | ( | — | ( | |||||||||||||||||||||||||||||
| Less: reclassification adjustments for gains (losses) realized | ( | ( | — | — | ( | |||||||||||||||||||||||||||
| Less: Income tax expense (benefit) | — | — | — | — | ||||||||||||||||||||||||||||
| Balance at December 31, 2025 | $ | ( | $ | ( | $ | $ | ( | $ | ||||||||||||||||||||||||
| Unrealized investment gains (losses) on available-for-sale securities | Unrealized gains (losses) on hedging instruments | Remeasurement gains (losses) on future policy benefits related to discount rate | Cumulative translation adjustment | Accumulated other comprehensive income (loss) | ||||||||||||||||||||||||||||
| Balance at December 31, 2023 | $ | ( | $ | $ | $ | ( | $ | |||||||||||||||||||||||||
| Other comprehensive income (loss), before reclassifications | ( | — | ||||||||||||||||||||||||||||||
| Less: reclassification adjustments for gains (losses) realized | ( | — | — | ( | ||||||||||||||||||||||||||||
| Less: Income tax expense (benefit) | — | — | — | — | ||||||||||||||||||||||||||||
| Balance at December 31, 2024 | $ | ( | $ | ( | $ | $ | ( | $ | ||||||||||||||||||||||||
Note 20. Equity based compensation
On May 30, 2019, the Company’s shareholders approved (i) a stock option plan (the “2019 Option Plan”) and (ii) a restricted share unit plan (the “2019 RSU Plan”), which were amended and re-approved by shareholders of the Company on June 7, 2024 to, among other things, increase the rolling limit thereunder from 10 % to 15 % of the common shares then issued and outstanding. Following the approval of Legacy Mount Logan shareholders on August 22, 2025 and the closing of the Business Combination, on November 5, 2025, the Board approved and ratified the 2025 Omnibus Incentive Plan (the “2025 Plan”). The effective date of the 2025 Plan was September 12, 2025 and upon its effectiveness, the 2019 Option Plan and 2019 RSU Plan were terminated and no further awards will be granted under either the 2019 Option Plan or the 2019 RSU Plan.
As of December 31, 2025, no awards have been granted under the 2025 Plan.
There were no nil
Under the 2019 RSU Plan, RSU grants were made in the form of equity-settled awards that typically vest one-third annually beginning one year after the grant date (unless approved otherwise by the Board to vest based on specified terms over a specified period), whereby one vested RSU will be exchanged for one common share. The grant date fair value of each equity-settled RSU unit was calculated based on the grant date’s previous day closing price per common share of the Company on Cboe Canada.
The Company awarded 652,135 RSUs with a grant date fair value of $1.2 million during the year ended December 31, 2025. The Company awarded 1,435,700 RSUs with a grant date fair value of $2.1 million during the year ended December 31, 2024.
For the year ended December 31, 2025 and 2024, the Company recorded equity-based compensation expense related to RSUs awarded from profit sharing arrangements of $2.8 million and $0.6 million, respectively. On September
F-66
12, 2025, all unvested RSUs were accelerated and fully vested due to the change in control event upon the closing of the Business Combination. As such, as of December 31, 2025, equity-based compensation expense related to RSUs had been fully recognized. The Company elected to account for forfeitures as they occurred. Expense was recognized on a straight-line basis over the life of the award.
A summary of the status of service-vesting awards granted under the RSU Plan for the year ended December 31, 2025 is presented below:
| RSUs and DEUs Outstanding | ||||||||||||||||||||||||||||||||
| RSUs | Weighted average grant date fair value | DEUs | Weighted average grant date fair value | Total | ||||||||||||||||||||||||||||
| Unvested balance, January 1, 2025 | $ | $ | ||||||||||||||||||||||||||||||
| Granted | ||||||||||||||||||||||||||||||||
| Vested | ( | ( | ( | |||||||||||||||||||||||||||||
| Forfeitures | ( | ( | ( | |||||||||||||||||||||||||||||
| Unvested balance, December 31, 2025 | ||||||||||||||||||||||||||||||||
Note 21. Earnings per share
Basic earnings per share is calculated by dividing net income or loss attributable to common shareholders by the weighted average number of common shares outstanding during the period. Diluted earnings per share is calculated in the same manner, with further adjustments made to reflect the dilutive impact of instruments convertible into the Company’s common shares.
The Company has granted RSUs that provide the right to receive, subject to vesting during continued employment, shares of common stock pursuant to the RSU Plan. Any dividend equivalent paid to an employee on RSUs will be returned to the Company upon forfeiture of the award by the employee. Unvested RSUs that are entitled to forfeitable dividend equivalents do not qualify as participating securities and are excluded in the Company’s basic and diluted earnings per share computations. Vested RSUs qualify as participating securities and are included in the Company’s diluted earnings per share computation.
The Company also has issued warrants which are exercisable to acquire one common share at a defined exercise price.
The following table sets forth the computation of basic and diluted income (loss) per common share for the year ended December 31, 2025 and December 31, 2024:
| Years Ended December 31, | ||||||||||||||
| 2025 | 2024 | |||||||||||||
| Basic earnings per share | ||||||||||||||
| Net income (loss) | $ | ( | $ | ( | ||||||||||
| Weighted-average number of common shares outstanding | ||||||||||||||
| Basic earnings (loss) per share | $ | ( | $ | ( | ||||||||||
| Diluted earnings per share | ||||||||||||||
| Net income (loss) | $ | ( | $ | ( | ||||||||||
| Weighted-average number of common shares outstanding | ||||||||||||||
| Incremental Common Shares | ||||||||||||||
Assumed exercise of warrants ¹ | ||||||||||||||
Common shares potentially issuable ² | ||||||||||||||
| Weighted-average number of diluted common shares outstanding | ||||||||||||||
| Diluted earnings (loss) per share | $ | ( | $ | ( | ||||||||||
________________
(1)For the years ended December 31, 2025 and 2024, both the Arrangement Warrants and debt warrants were anti-dilutive and are excluded from the calculation of diluted earnings per share.
(2)For the years ended December 31, 2025 and 2024, RSUs granted were anti-dilutive and are excluded from the calculation of diluted earnings per share.
F-67
The following table summarizes the anti-dilutive securities that are excluded from the computation of diluted income (loss) per share:
| Years Ended December 31, | ||||||||||||||
| 2025 | 2024 | |||||||||||||
| Anti-dilutive Securities | ||||||||||||||
| Weighted-average number of unexcercised warrants | ||||||||||||||
| Weighted-average number RSUs outstanding, inclusive of DEUs | ||||||||||||||
| Total common shares equivalent | ||||||||||||||
The basic and diluted weighted average number of shares issued, anti-dilutive securities, and earnings per share have been retrospectively adjusted to reflect the equivalent number of shares issued to holders of the Company post merger with TURN.
Note 22. Related parties
Servicing Agreement
On November 20, 2018, the Company entered into a servicing agreement (the “Servicing Agreement”) with BC Partners Advisors L.P. (“BCPA”). Under the terms of the Servicing Agreement, BCPA as servicing agent (the “Servicing Agent”) performs (or oversees, or arranges for, the performance of) the administrative services necessary for the operation of the Company, including, without limitation, office facilities, equipment, bookkeeping and recordkeeping services and such other services the Servicing Agent, subject to review by the Board, shall from time to time deem necessary or useful to perform its obligations under this Servicing Agreement. The Servicing Agent is authorized to enter into sub-administration agreements as determined to be necessary in order to carry out the administrative services.
Unless earlier terminated as described below, the Servicing Agreement will remain in effect from year-to-year if approved annually by (i) the vote of the Board and (ii) the vote of a majority of the Company’s directors who are not parties to the Servicing Agreement or a “related party” of the Servicing Agent, or of any of its affiliates. The Servicing Agreement may be terminated at any time, without the payment of any penalty, upon 60 days’ written notice by the vote of the Board or by the Servicing Agent.
The Company reimburses BCPA for an allocable portion of compensation paid to the Company’s Chief Financial Officer, associated management personnel (based on a percentage of time such individuals devote, on an estimated basis, to the business affairs of the Company), and out-of-pocket expenses. While the Servicing Agent performs certain administrative functions for the Company, the management functions of the Company are wholly performed by the Company’s management team. For the year ended December 31, 2025, the Company incurred administrative fees of $5.9 million (December 31, 2024 – $3.9 million). As of December 31, 2025, administrative fees payable to BCPA was $1.7 million (December 31, 2024 – $1.2 million).
Staffing and Resource Agreement
On November 18, 2025, the Company entered into a Staffing and Resource Agreement with BCPA (the “Staffing and Resource Agreement”), pursuant to which BCPA makes available certain personnel and other resources to the Company and certain of its subsidiaries to support the Company’s investment advisory operations and related business activities. Personnel provided by BCPA are not employees of the Company. In consideration for providing staffing and other services, the Company pays BCPA a quarterly service fee calculated as a percentage of fee-earning assets under management at rates specified in the Staffing and Resource Agreement and, from time to time, equity-based compensation as mutually agreed. The Staffing and Resource Agreement has an initial one-year term and automatically renews for successive one-year periods, and may be terminated by either party on 60 days’ prior written notice or immediately in specified circumstances. For the year ended December 31, 2025, the Company incurred fees payable to BCPA under the Staffing and Resource Agreement of $1.0 million (December 31, 2024 – $nil ). As of December 31, 2025, fees payable to BCPA under the Staffing and Resource Agreement was $1.0 million (December 31, 2024 – $nil).
Transactions with Affiliates - servicing fees
The Company, through MLC US Holdings, a wholly-owned subsidiary of the Company, provides certain administrative services to SCIM in respect of the management of Alternative Credit Income Fund (“ACIF”) in exchange for a servicing fee. Servicing fees are determined quarterly based on an amount equal to the aggregate base management fee and incentive fees received by SCIM from ACIF in respect of such quarter, net of debt servicing expense, a quarterly fee to be retained by SCIM comprised of a specified amount, and an allocable portion of the compensation of SCIM’s
F-68
investment professionals in connection with their performance of investment advisory services for ACIF (collectively, the “Retained Benefits”). In addition, SCIM is reimbursed by MLC US Holdings quarterly for certain expenses it incurs in connection with the investment advisory services provided to ACIF. Pursuant to this arrangement, the Company receives the net economic benefit derived by SCIM under the ACIF advisory agreement, subject to the holdback of the Retained Benefits and expense reimbursements. For the year ended December 31, 2025, the Company incurred servicing fees of $2.1 million (December 31, 2024 – $2.5 million).
The Company, through MLC US Holdings, a wholly-owned subsidiary, issued a promissory note to SCIM on October 30, 2020, with a maturity of October 30, 2040. The note’s value is not to exceed $15 M and bears interest at 8.0 % per annum, payable quarterly, for the first 10 years. During the second 10 years outstanding, repayments of the note shall occur in equal quarterly installment payments, bearing interest at 8.0 % per annum, plus an additional 2 % annually on overdue principal. As of December 31, 2025, the outstanding principal value of the note was $13.6 million (December 31, 2024: $13.6 million). For the year ended December 31, 2025, total interest income was $1.1 million (December 31, 2024: $1.1 million). As of December 31, 2025, the total accrued interest income receivable was $3.0 million (December 31, 2024: $1.9 million).
Transactions with Affiliates - profit sharing interest
On July 15, 2025, Portman Ridge Finance Corporation (“Portman” or “Portman Ridge”) and Logan Ridge, business development companies previously managed by SCIM and ML Management, respectively, completed a merger whereby Logan Ridge merged with and into Portman (the “Portman-Logan Merger”). Pursuant to the Portman-Logan Merger, Portman was the surviving public entity and continues to be advised by SCIM, which the Company holds a minority ownership interest of 24.99 %. The Portman-Logan Merger resulted in the existing IMA between ML Management and Logan Ridge being terminated. In connection with the closing of the Portman-Logan Merger, MLCSC Holdings LLC, our wholly-owned subsidiary (“MLCSC”), entered into a Profit-Sharing Agreement with BCPSC Holdings LLC, a wholly-owned subsidiary of BCPA and the majority owner of SCIM (the “Profit-Sharing Agreement”). Pursuant to the Profit-Sharing Agreement, MLCSC is entitled to 16.03 % of BCPA’s distributions from SCIM. The value of the Profit-Sharing Agreement was determined to be $11.2 million at inception and subsequently refined to $8.2 million in the fourth quarter of 2025, and is considered an indefinite lived intangible asset. Income earned as a result of the profit sharing agreement is recorded as “Other income (loss), net” on the consolidated statement of operations. For the year ended December 31, 2025, income earned on the profit sharing agreement was $0.4 million (December 31, 2024: nil ).
Potential Conflicts of Interest
The Company's senior management team is comprised of substantially the same personnel as the senior management team of BCPA, and such personnel may serve in similar or other capacities for BCPA or to future investment vehicles affiliated with BC Partners. As a result, such personnel provide investment advisory services to the Company and certain investment vehicles considered affiliates of BC Partners.
Compensation of Key Management Personnel
The Company's key management personnel are those personnel who have the authority and responsibility for planning, directing and controlling the activities of the Company. Directors (both executive and non-executive) are considered key personnel. Certain directors and officers of the Company are affiliated with BCPA. For the year ended December 31, 2025, the Chief Executive Officer (“CEO”) and Co-presidents received no cash salary or bonuses of any kind. Instead, their compensation was 100 % equity-based compensation granted pursuant to the Company's security-based compensation arrangements that vest over time for services rendered. The CEO and Co-presidents had no RSUs, inclusive of DEUs outstanding as of December 31, 2025 (December 31, 2024 - 659,557 ). All remaining RSUs, inclusive of DEUs were accelerated and fully vested upon the closing of the Business Combination on September 12, 2025. There were no RSUs and 16,790 DEUs issued to the CEO and Co-presidents during the year ended December 31, 2025 (December 31, 2024 - 595,000 RSUs and 8,441 DEU). See Note 20. Equity based compensation and Note 21. Earnings per share for more information. No person or employee of the Servicing Agent or its affiliates that serves as a director of the Company receives any compensation from the Company for his or her services as a director.
Common shares held by directors and officers of the Company who are affiliated with BCPA at December 31, 2025 were 282,461 (December 31, 2024 – 190,596 ). All outstanding shares of Legacy Mount Logan were converted upon closing of the Business Combination on September 12, 2025 into the Company’s common shares. See Note 3. Business combinations for further details.
F-69
Other Transactions with BCPA or their Affiliates
The Servicing Agent may, from time to time, pay amounts owed by the Company to third-party providers of goods or services, and the Company will subsequently reimburse the Servicing Agent for such amounts paid on its behalf. Amounts payable to the Servicing Agent are settled in the normal course of business without any formal payment terms. As of December 31, 2025, operating expenses reimbursable to BC Partners for amounts paid on behalf of the Company was $4.5 million (December 31, 2024 – $7.4 million).
The Company may, from time to time, enter into transactions in the normal course of operations with entities that are considered affiliates involved in the credit business of BCPA (“BCPA Credit Affiliates”). At December 31, 2025, Asset Management held investments with affiliates of BCPA Credit Affiliates totaling $25.4 million (December 31, 2024 – $20.9 million), and Insurance Solutions held investments with affiliates of BCPA Credit Affiliates totaling $20.9 million (December 31, 2024 – $23.7 million). On these investments, Asset Management recognized (i) interest income of $1.1 million for the year ended December 31, 2025 (December 31, 2024 - $1.1 million), (ii) earnings on equity method investments of $1.0 million for the year ended December 31, 2025 (December 31, 2024 - $0.7 million), and (iii) dividend income on equity securities of $0.1 million for the year ended December 31, 2025 (December 31, 2024 – $0.4 million). On these investments, Insurance Solutions recognized (i) interest income of $1.3 million for the year ended December 31, 2025 (December 31, 2024 - $2.4 million) and (ii) dividend income of $0.2 million for the year ended December 31, 2025 (December 31, 2024 - $0.3 million).
Further, for the year ended December 31, 2025, the Company incurred expenses of $7.0 million (December 31, 2024 - $7.2 million) to an affiliate, for third party administrative services relating to Ability for administering its long-term care block of business. As of December 31, 2025, there was a payable to this affiliate of $0.6 million (December 31, 2024 – $0.6 million).
Note 23. Segments
The Company conducts its business through two reportable segments: Asset Management and Insurance Solutions. The Company defines operating segments by type of product and business line. The Asset Management segment comprises all fee generating activities. The Insurance Solutions segment consists of two product lines within the insurance business, LTC and MYGA.
Segment information is utilized by the Company’s chief operating decision maker (“CODM”) to assess performance and to allocate resources. The Company’s Chief Executive Officer (“CEO”) is the CODM, who is also solely responsible for decisions related to the allocation of resources on a Company-wide basis.
For each segment, the CODM uses the key measure of Segment Income to allocate resources (including employees, financial or capital resources) to that segment in the annual budget and forecasting process. The performance is measured by the Company’s CODM on an unconsolidated basis because the CODM makes operating decisions and assesses the performance of each of the Company’s business segments based on financial and operating metrics and data that exclude the effects of consolidation. Each reportable segment is then responsible for managing its operating results, developing products, defining strategies for services and distributions based on the profile and needs of its business and market.
Segment Income
Segment Income is the key performance measure used by the CODM in evaluating the performance of the asset management and insurance solutions segments. The CODM uses Segment Income to make key operating decisions such as the following:
•decisions related to the allocation of resources such as staffing decisions, including hiring and locations for deployment of the new hires;
•decisions related to capital deployment such as providing capital to facilitate growth for the business and/or to facilitate expansion into new businesses; and
•decisions related to expenses, such as determining annual discretionary bonuses and equity-based compensation awards to its employees and/or service providers.
Segment Income is a measure of profitability and has certain limitations in that it does not take into account certain items included under U.S. GAAP. Segment Income is the sum of (i) Fee Related Earnings and (ii) Spread Related
F-70
Earnings (“SRE”). Segment Income excludes the effects of the consolidation of each segment, taxes and related payables, and other items unique to deriving each segment’s performance metric as explained respectively below.
Segment Income may not be comparable to similarly titled measures used by other companies and is not a measure of performance calculated in accordance with U.S. GAAP. We use Segment Income as a measure of operating performance, not as a measure of liquidity. Segment Income should not be considered in isolation or as a substitute for net income or other income data prepared in accordance with U.S. GAAP. The use of Segment Income without consideration of related U.S. GAAP measures is not adequate due to the adjustments described above. Management compensates for these limitations by using Segment Income as a supplemental measure to U.S. GAAP results, to provide a more complete understanding of our performance as management measures it. A reconciliation of Segment Income to its most directly comparable U.S. GAAP measure of income (loss) before income tax provision can be found in this footnote.
Fee Related Earnings
Fee Related Earnings (“FRE”) is a component of Segment Income that is used to assess the performance of the Asset Management segment. FRE is the sum of (i) management fees, (ii) performance fees received from certain managed funds, (iii) advisory and transactions fees, (iv) equity investment earnings related to fee generating vehicles, (v) interest income attributable to investment management activity, and (vi) other fee-related income derived from the Company’s profit-sharing agreement over a fee-generating vehicle less (a) fee-related compensation, excluding equity-based compensation, and (b) other associated operating expenses, which excludes amortization of acquisition-related intangible assets and interest and other credit facility expenses.
FRE excludes non-fee generating revenues and expenses, transaction-related charges, equity-based compensation costs, the amortization of intangible assets, the operating results of VIEs that are included in the Consolidated Financial Statements, and any other non-recurring income and expenses. In addition, FRE excludes interest and other financing costs related to the Company not attributable to any specific segment, and corporate overhead expenses incurred to support the operations of the business rather than directly fee-related. Management considers these types of costs corporate in nature, and are included only for reconciliation purposes to income (loss) before income tax (provision) benefit.
Spread Related Earnings
SRE is a component of Segment Income that is used to assess the performance of the Insurance Solutions segment, excluding certain market volatility, which consists of investment gains (losses), other income and certain general, administrative & other expenses. For the Insurance Solutions segment, SRE equals the sum of (i) the net investment earnings on Insurance Solutions segment’s net invested assets (excluding investment earnings on funds held under reinsurance contracts and Modco agreement), less (ii) cost of funds (as described below), (iii) compensation and benefits, (iv) interest expense and (v) operating expenses.
Cost of funds includes liability costs associated with the crediting cost on MYGA liabilities as well as other liability costs. Other liability costs include DAC amortization, the cost of liabilities associated with LTC, net of reinsurance, which includes change in reserves, premiums, actual claim experience including related expenses and certain product charges related to MYGA.
The following presents financial data for the Company’s reportable segments and the reconciliation of Segment Income to Income (loss) before taxes reported in the Consolidated Statements of Operations:
F-71
| Years Ended December 31, | ||||||||||||||
| 2025 | 2024 | |||||||||||||
| Asset Management | ||||||||||||||
| Management fees | $ | $ | ||||||||||||
| Incentive fees | ||||||||||||||
| Advisory and transaction fees, net | ||||||||||||||
| Equity investment earnings | ||||||||||||||
Interest income¹ | ||||||||||||||
| Other fee-related income | ||||||||||||||
| Fee-related compensation | ( | ( | ||||||||||||
| Other operating expenses: | ||||||||||||||
| Administration and servicing fees | ( | ( | ||||||||||||
| General, administrative and other | ( | ( | ||||||||||||
| Fee related earnings | ||||||||||||||
| Insurance Solutions | ||||||||||||||
| Net investment income and realized gain (loss), net | ||||||||||||||
| Cost of funds | ( | ( | ||||||||||||
| Compensation and benefits | ( | ( | ||||||||||||
| Interest expense | ( | ( | ||||||||||||
| General, administrative and other | ( | ( | ||||||||||||
| Spread related earnings | ( | |||||||||||||
| Segment income | $ | $ | ||||||||||||
| Asset Management Adjustments: | ||||||||||||||
| Intersegment management fee eliminations | ( | ( | ||||||||||||
Administration and servicing fees ² | ( | ( | ||||||||||||
| Transaction costs | ( | ( | ||||||||||||
Compensation and benefits ² | ( | ( | ||||||||||||
| Equity-based compensation | ( | ( | ||||||||||||
| Amortization and impairment of intangible assets | ( | ( | ||||||||||||
| Interest and other credit facility expenses | ( | ( | ||||||||||||
General, administrative and other ² | ( | ( | ||||||||||||
| Net gains (losses) from investment activities | ( | |||||||||||||
| Dividend income | ||||||||||||||
| Interest income - bank interest | ||||||||||||||
| Other income (loss), net | ||||||||||||||
| Gain on acquisition | ||||||||||||||
| Insurance Solutions Adjustments: | — | — | ||||||||||||
| Equity-based compensation | ( | ( | ||||||||||||
| Net unrealized gains (losses) from investment activities | ( | |||||||||||||
| Other income | ||||||||||||||
| Intersegment management fee eliminations | ||||||||||||||
General, administrative and other ³ | ( | ( | ||||||||||||
| Impairment loss - Goodwill | ( | |||||||||||||
| Income (loss) before taxes | $ | ( | $ | ( | ||||||||||
_______________
(1)Represents interest income on a loan asset related to a fee generating vehicle.
(2)Represents corporate overhead allocated to each segment.
(3)Represents costs incurred by the insurance segment for purposes of U.S. GAAP reporting but not the day-to-day operations of the insurance company.
F-72
The following presents financial data for the Company’s reportable segments and the reconciliation of Segment Revenue to total revenue reported in the Consolidated Statements of Operations:
| Years Ended December 31, | ||||||||||||||
| 2025 | 2024 | |||||||||||||
| Segment Revenues | ||||||||||||||
| Asset Management | $ | $ | ||||||||||||
| Insurance Solutions | ||||||||||||||
| Total segment revenues | ||||||||||||||
| Asset Management Adjustments: | ||||||||||||||
| Intersegment management fee eliminations | ( | ( | ||||||||||||
| Interest income | ( | ( | ||||||||||||
| Other fee-related income | ( | |||||||||||||
| Insurance Solutions Adjustments: | — | — | ||||||||||||
| Net Premiums | ( | ( | ||||||||||||
| Product charges | ||||||||||||||
| Net gains (losses) from investment activities | ( | |||||||||||||
| Other income | ||||||||||||||
| Intersegment management fee eliminations | ||||||||||||||
| Total revenues | $ | $ | ||||||||||||
The following presents financial data for the Company’s reportable segments and the reconciliation of the Company’s total reportable segment assets to total assets reported in the Consolidated Statements of Financial Position:
| As of | December 31, 2025 | December 31, 2024 | ||||||||||||
| Segments Assets | ||||||||||||||
| Asset Management | $ | $ | ||||||||||||
| Insurance Solutions | ||||||||||||||
| Total segment assets | ||||||||||||||
| Asset Management Adjustments: | ||||||||||||||
| Intersegment investments | ( | ( | ||||||||||||
| Intersegment receivables | ( | ( | ||||||||||||
| Total assets | $ | $ | ||||||||||||
Note 24. Commitments and contingencies
Investment commitments
In the normal course of business, the Company may enter into commitments to fund investments, which are not reflected in the Consolidated Financial Statements. There were $1.4 million and $49.5 million of outstanding investment commitments as of December 31, 2025 for Asset Management and Insurance Solutions, respectively (December 31, 2024 – $1.4 million and $43.2 million).
In connection with the Capitala Acquisition, ML Management issued a promissory note to CIA for $4.0 million, which pursuant to the terms in the agreement, may have increased to $6.0 million, based on the maturity date asset values of a predefined list of assets held by Logan Ridge. Refer to Note 12. Debt obligations for further detail on this liability which was repaid on October 31, 2025.
Contingent liabilities and litigation
The Company may be subject to lawsuits in the normal course of business. Insurance in particular is a highly regulated industry and lawsuits related to claim payments should be expected in the normal course of business. In the Asset Management business certain types of investment vehicles, especially those offered to individual investors, may subject the Company to a variety of risks, including new and greater levels of public and regulatory scrutiny, regulation, risk of litigation and reputation risk, which could materially and adversely affect the Company. Other potential lawsuits include allegations of mis-selling in the Insurance Solutions segment, among others. The Company considers this risk to be less likely given that Ability no longer directly writes insurance policies.
F-73
Ability at different times may receive notifications of the insolvency of various insurance companies. It is expected that such insolvencies would result in a Guaranty Fund Assessment against Ability at some future date. At this time, the Company is unable to estimate the possible amounts, if any, of such assessments as no data is available from the National Organization of Life and Health Guaranty Associations in the United States. Accordingly, the Company is unable to determine the impact, if any, that such assessments may have on its financial position or results of operations.
Ability is subject to lawsuits and regulatory actions in the normal course of business that do not arise from or directly relate to claims on insurance policies. This category of business litigation typically involves, among other things, allegations of underwriting errors or misconduct and litigation related to regulatory activity. These nonclaims litigation matters are considered when determining general expense accruals are necessary. As of December 31, 2025 there were no litigation related expense accruals. Potential legal and regulatory actions are subject to inherent uncertainties, and future events could change management’s assessment of the probability or estimated amount of potential losses from pending or threatened legal and regulatory matters. A future adverse ruling by the courts in any pending cases could have a material adverse impact on the financial condition of Ability. Based on management’s best assessment at this time, Ability is adequately reserved for these cases as of December 31, 2025.
Note 25. Capital management and regulatory requirements
The Company’s capital structure consists of equity and debt. In order to maintain or adjust the capital structure, the Company actively manages its equity as capital and may adjust the amount of debt borrowings, dividends paid to shareholders, return capital to shareholders, issue new shares or sell assets. The Company's capital management framework takes into account the requirements of the Company as a whole as well as the needs and requirements of each of its subsidiaries. The Company’s officers and senior management are responsible for managing the Company’s capital and do so through quarterly portfolio management meetings and regular review of financial information.
As of December 31, 2025, the Company was in compliance with all financial covenants in its debt facilities. These include restrictions on the distribution capacity from MLC US Holdings to the Company.
Insurance capital requirements
Ability is subject to minimum capital and surplus requirements. Insurance companies typically operate in excess of such requirements. Failure to maintain such minimum capital will result in regulatory actions, including in certain circumstances regulatory takeover of the insurance company.
Ability is subject to risk based capital (“RBC”) standards and other minimum capital and surplus requirements imposed by state laws. Regulatory capital requirements for Ability are determined in accordance with statutory requirements of the Nebraska Department of Insurance. The RBC requirement is a statutory minimum level of capital that is based on multiple factors including: an insurance company's size, and the inherent riskiness of its financial assets, liabilities and operations. That is, the company must hold capital in proportion to its risk. The RBC formula is intended to measure the adequacy of the insurance company’s statutory surplus in relation to the risks inherent in its business. The RBC formula requires higher surplus in relation to items deemed to have higher risk. Regulatory action is triggered beginning at 200% RBC and below. The minimum RBC ratio for Ability is 200% and Ability must have a ratio in excess of 300% to be able to reinsure new business. Ability’s RBC ratio is tested annually at the end of Ability’s financial year and estimated on a quarterly basis. When calculated at December 31, 2025 it was 501 % which was in excess of the minimum requirement. From time to time during a particular financial year, Ability may take steps to increase its RBC ratio to ensure it remains above the minimum requirement or exceeds the ratio required to write new business, which steps may include, among other things, securing additional funding. Ability’s minimum capital requirements do not require a minimum level of cash to be held. Ability does not have to include cash as part of its regulatory capital provided the minimum capital requirements are satisfied.
Insurance subsidiary dividend restrictions
Ability’s statutory statements are presented on the basis of accounting practices determined by the Nebraska Department of Insurance (“NEDOI”). The NEDOI recognizes only permits and/or prescribes certain statutory accounting practices determining and reporting the financial condition and results of operations of an insurance company and for determining its solvency under insurance law. The amount of dividends that Ability may pay in a twelve-month period, without prior approval by Ability, is restricted by the laws of Nebraska.
Under Nebraska law, dividends payable from Ability's unassigned funds during any twelve-month period without prior approval of the state’s Insurance Director are limited to the greater of 10% of Ability’s surplus as shown on the immediately preceding calendar year’s statutory financial statement on file with the NEDOI or 100% net gain from
F-74
operations for the prior calendar year. Any dividend in excess of such limitation must be approved by the Insurance Director. Based on these restrictions, Ability could not pay any dividends to its parent absent regulatory approval as of each of December 31, 2025 and December 31, 2024.
Note 26. Concentration of Risks
Our current operations subject us to the following concentrations of risk:
Insurance Solutions
Historically, we have assumed our MYGA products, which is a part of our insurance operations, from two insurance companies, ACL and SSL. We have made a decision to no longer assume business from ACL and SSL as of June 30, 2024. However, the Company will continue to earn investment income from the cash proceeds of the existing MYGA contracts and the holders will continue to be a diversified base of numerous individuals. Effective March 31, 2025, Ability entered a new reinsurance treaty for additional MYGA with National Security Group (“NSG”), further diversifying its reinsurance partners.
Certain concentrations of credit risk related to reinsurance recoverable exist with the insurance organizations listed in the table below:
| As of December 31, 2025 | A.M. Best credit rating | Net reinsurance recoverable1 | Funds withheld payable | Net reinsurance credit exposure | ||||||||||||||||||||||
| Medico Insurance Company | A | $ | $ | $ | ||||||||||||||||||||||
| Front Street Re | Not Rated | |||||||||||||||||||||||||
| Vista Life and Casualty Reinsurance Co | Not Rated | |||||||||||||||||||||||||
| Total | $ | $ | $ | |||||||||||||||||||||||
| As of December 31, 2024 | A.M. Best credit rating | Net reinsurance recoverable1 | Funds withheld payable | Net reinsurance credit exposure | ||||||||||||||||||||||
| Medico Insurance Company | A | $ | $ | $ | ||||||||||||||||||||||
| Front Street Re | Not Rated | |||||||||||||||||||||||||
| Vista Life and Casualty Reinsurance Co | Not Rated | |||||||||||||||||||||||||
| Total | $ | $ | $ | |||||||||||||||||||||||
_______________
(1)Includes credit loss allowance of $1.1 million and $0.8 million as of December 31, 2025 and December 31, 2024, respectively, held against reinsurance recoverable.
Further, our Insurance Solutions segment has the following investment concentration risk:
| As of December 31, 2025 | ||||||||||||||
| Fair value | % of total | |||||||||||||
| Insurance Solutions | ||||||||||||||
| United States | $ | % | ||||||||||||
| Cayman Islands | % | |||||||||||||
Other¹ | % | |||||||||||||
| Total insurance solutions | 100 | % | ||||||||||||
| Insurance Solutions consolidated VIEs | ||||||||||||||
| United States | % | |||||||||||||
Other² | % | |||||||||||||
| Total insurance solutions consolidated VIEs | 100 | % | ||||||||||||
| Total | $ | |||||||||||||
_______________
(1)Other consists of nominal investments primarily in Bermuda, Canada, Cayman Islands and United Kingdom.
(2)Other consists of nominal investments primarily in Ireland and Canada.
F-75
| As of December 31, 2024 | ||||||||||||||
| Fair value | % of total | |||||||||||||
| Insurance Solutions | ||||||||||||||
| United States | $ | % | ||||||||||||
| Canada | % | |||||||||||||
Other¹ | % | |||||||||||||
| Total insurance solutions | 100 | % | ||||||||||||
| Insurance Solutions consolidated VIEs | ||||||||||||||
| United States | % | |||||||||||||
| Canada | % | |||||||||||||
| Other | % | |||||||||||||
| Total insurance solutions consolidated VIEs | 100 | % | ||||||||||||
| Total | $ | |||||||||||||
_______________
The Asset Management segment does not have meaningful investment concentration risk.
Note 27. Subsequent events
Management of the Company has evaluated subsequent events through the date these financial statements were issued. Based upon this evaluation, management has determined there were no items requiring adjustment of the financial statements. Management does note the following:
On January 1, 2026, the Company’s office lease for Ovation, a fully owned subsidiary of ML Management, was transferred to BC Partners. Refer to Note 17. Other assets and Accrued expenses and other liabilities for details on the right of use asset and lease liabilities associated with this operating lease.
On January 26, 2026, the Company closed its debt offering of $40 million in aggregate principal amount of senior unsecured notes (“the Notes”). The Notes will mature on January 31, 2031, and may be redeemed in whole or in part at any time or from time to time at the Company’s option on or after January 31, 2028. The Notes bear interest at a rate of 8.00 % per year, payable quarterly, with the first interest payment occurring on April 30, 2026.
On February 2, 2026, the Company’s offer to purchase for cash up to $15 million of its shares of common stock, $0.001 par value, at a fixed price of $9.43 1,590,601 shares of the Company’s common stock, adjusted to avoid the purchase of fractional shares, at a purchase price of $9.43 15 million, excluding fees and expenses relating to the Tender Offer. The Company accepted the shares on a pro rata basis. The shares purchased represent approximately 12 % of the Company’s common stock issued and outstanding as of February 2, 2026.
On February 23, 2026, the Company announced the board of directors’ approval of a $10.0 million share repurchase program through December 31, 2027 (the “Share Repurchase Program”). Under the Share Repurchase Program, repurchases may be made from time to time using a variety of methods, which may include open market purchases, privately negotiated transactions, or by other means in accordance with applicable securities laws and subject to market conditions and other factors. The size and timing of any repurchases will be determined by the Company at its discretion and will depend on factors including, but not limited to, prevailing stock prices, general economic and market conditions, along with other considerations. The program does not obligate the Company to repurchase any specific amount of Common Stock and may be suspended or discontinued at any time.
On February 24, 2026, BC Partners Lending Corporation (“BCPL”) and Alternative Credit Income Fund (“ACIF”) announced that they have entered into an agreement under which ACIF will merge with and into BCPL (the “Proposed Merger”), subject to approval by ACIF shareholders and the satisfaction of other closing conditions. Given the Proposed Merger is still subject to approval, there is no impact to the Consolidated Financial Statements.
On March 5, 2026, the Board declared a cash dividend in the amount of $0.03 per common share to be paid on April 15, 2026 to shareholders of record on March 30, 2026.
F-76
On March 18, 2026, Opportunistic Credit Interval Fund (“OCIF”), a fund managed by ML Management, entered into definitive agreements to acquire the assets of Yieldstreet Alternative Income Fund (“YS AIF”) (the “Asset Acquisition”). In connection with the Asset Acquisition, ML Management entered into a Transaction Services Agreement with Willow Asset Management LLC (“Willow”), the advisor of YS AIF, pursuant to which Willow will provide access to books and records of YS AIF, certain transition services and licenses in exchange for aggregate consideration of up to $5 million, payable in cash and shares of the Company’s common stock. The transaction is expected to close in the third quarter of 2026, subject to regulatory and YS AIF shareholder approvals. Given the transaction is still subject to approvals, there is no impact to the Consolidated Financial Statements.
F-77
Item 9. Changes in and Disagreements with Accountants on Accounting and Financial Disclosure
None.
Item 9A. Controls and Procedures
Evaluation of Disclosure Controls and Procedures.
The Company’s management, under the supervision and with the participation of various members of management, including its Chief Executive Officer (“CEO”) and its Chief Financial Officer (“CFO”), has evaluated the effectiveness of its disclosure controls and procedures (as defined in Rule 13a-15(e) or Rule 15d-15(e) of the Exchange Act) as of the end of the period covered by this Annual Report on Form 10-K. Based upon that evaluation, the Company’s CEO and CFO have concluded that the Company’s disclosure controls and procedures are effective to ensure that information required to be disclosed by us in reports that we file or submit under the Exchange Act are recorded, processed, summarized, and reported within the time periods specified in the SEC’s rules and forms, and that information required to be disclosed by us in the reports that we file or submit under the Exchange Act is accumulated and communicated to our management, including our CEO and CFO, as appropriate to allow timely decisions regarding required disclosures as of the end of the period covered by this Annual Report on Form 10-K.
Management’s Report on Internal Control Over Financial Reporting.
General. The Company’s management is responsible for establishing and maintaining adequate internal control over financial reporting as defined in Rules 13a-15(f) of the Exchange Act. The Company’s internal control over financial reporting is designed to provide reasonable assurance regarding the reliability of financial reporting and the preparation of financial statements for external purposes in accordance with generally accepted accounting principles.
Scope of Management’s Report on Internal Control Over Financial Reporting. The Company’s internal control over financial reporting includes those policies and procedures that:
•Pertain to the maintenance of records that in reasonable detail accurately and fairly reflect the transactions and dispositions of the assets of the Company;
•Provide reasonable assurance that transactions are recorded as necessary to permit preparation of the consolidated financial statements in accordance with generally accepted accounting principles, and that the Company’s receipts and expenditures are being made only in accordance with authorizations of the Company’s management and directors; and
•Provide reasonable assurance regarding prevention or timely detection of unauthorized acquisition, use or disposition of the Company’s assets that could have a material effect on the Company’s consolidated financial statements.
•Because of its inherent limitations, internal control over financial reporting may not prevent or detect misstatements. Also, projections of any evaluation of effectiveness to future periods are subject to the risk that controls may become inadequate because of changes in conditions, or that the degree of compliance with the policies or procedures may deteriorate.
Conclusion. Management, including the Company’s CEO and CFO, assessed the effectiveness of the Company’s internal control over financial reporting as of December 31, 2025. In making this assessment, management used the criteria established in the 2013 Internal Control-Integrated Framework issued by the Committee of Sponsoring Organizations of the Treadway Commission (COSO). Based on management’s assessment, management concluded, subject to the limitations described under “Scope of Management’s Report on Internal Control Over Financial Reporting” above, that the Company maintained effective internal control over financial reporting as of December 31, 2025.
Attestation Report of the Independent Registered Public Accounting Firm.
This Annual Report on Form 10-K does not include an attestation report of our independent registered public accounting firm regarding internal control over financial reporting. We were not required to have, nor have we, engaged our independent registered public accounting firm to perform an audit of the Company’s internal control over financial reporting as of December 31, 2025 pursuant to the rules of the SEC that permit us to provide only management's report in this Annual Report on Form 10-K.
Changes in Internal Control Over Financial Reporting.
75
There have been no changes in our internal control over financial reporting during the fourth quarter of 2025 that have materially affected, or are reasonably likely to materially affect, our internal control over financial reporting.
Item 9B. Other Information
Rule 10b5-1 Trading Plans
During the three months ended December 31, 2025, none of the Company’s directors or Section 16 officers adopted terminated
Item 9C. Disclosure Regarding Foreign Jurisdictions that Prevent Inspections
Not applicable.
76
PART III
Item 10. Directors, Executive Officers and Corporate Governance
The information required by this item is incorporated by reference to the information contained in our definitive Proxy Statement with respect to our 2026 Annual Meeting of Stockholders, which we intend to file with the SEC no later than 120 days after the end of our fiscal year ended December 31, 2025.
Item 11. Executive Compensation
The information required by this item is incorporated by reference to the information contained in our definitive Proxy Statement with respect to our 2026 Annual Meeting of Stockholders, which we intend to file with the SEC no later than 120 days after the end of our fiscal year ended December 31, 2025.
Item 12. Security Ownership of Certain Beneficial Owners and Management and Related Stockholder Matters
The information required by this item is incorporated by reference to the information contained in our definitive Proxy Statement with respect to our 2026 Annual Meeting of Stockholders, which we intend to file with the SEC no later than 120 days after the end of our fiscal year ended December 31, 2025.
Item 13. Certain Relationships and Related Transactions, and Director Independence
The information required by this item is incorporated by reference to the information contained in our definitive Proxy Statement with respect to our 2026 Annual Meeting of Stockholders, which we intend to file with the SEC no later than 120 days after the end of our fiscal year ended December 31, 2025.
Item 14. Principal Accountant Fees and Services
The information required by this item is incorporated by reference to the information contained in our definitive Proxy Statement with respect to our 2026 Annual Meeting of Stockholders, which we intend to file with the SEC no later than 120 days after the end of our fiscal year ended December 31, 2025.
77
PART IV
Item 15. Exhibits and Financial Statement Schedules
(a)(1) Financial Statements. For a list of the consolidated financial information included herein, see “Index to Financial Statements” on page 74.
(a)(2) Financial Statement Schedules. For a list of other financial statement schedules included herein, see “Index to Financial Statements” on page 74.
(a)(3) Exhibits.
Exhibit Number | Description | |||||||
2.1 | Agreement and Plan of Merger, dated as of January 16, 2025, by and among Mount Logan Capital Inc., 180 Degree Capital Corp., Yukon New Parent, Inc., Polar Merger Sub, Inc. and Moose Merger Sub, LLC (incorporated herein by reference to Exhibit 2.1 to the registrant’s Current Report on Form 8-K filed September 16, 2025). | |||||||
2.2 | Amendment to Agreement and Plan of Merger, dated as of July 6, 2025, by and among Mount Logan Capital Inc., 180 Degree Capital Corp., Yukon New Parent, Inc., Polar Merger Sub, Inc. and Moose Merger Sub, LLC (incorporated herein by reference to Exhibit 2.2 to the registrant’s Current Report on Form 8-K filed September 16, 2025). | |||||||
2.3 | Amendment No. 2 to Agreement and Plan of Merger, dated as of August 17, 2025, by and among Mount Logan Capital Inc., 180 Degree Capital Corp., Yukon New Parent, inc., Polar Merger Sub, Inc. and Moose Merger Sub, LLC (incorporated herein by reference to Exhibit 2.3 to the registrant’s Current Report on Form 8-K filed September 16, 2025). | |||||||
3.1 | Amended and Restated Certificate of Incorporation of Mount Logan Capital Inc. (incorporated herein by reference to Exhibit 3.1 to the registrant’s Current Report on Form 8-K filed September 16, 2025). | |||||||
3.2 | Amended and Restated Bylaws of Mount Logan Capital Inc. (incorporated herein by reference to Exhibit 3.2 to the registrant’s Current Report on Form 8-K filed September 16, 2025). | |||||||
4.1* | ||||||||
4.2 | Indenture, dated as of January 26, 2026, between Mount Logan Capital Inc. and U.S. Bank Trust Company, National Association (incorporated by reference to Exhibit 4.1 to the registrant’s Current Report on Form 8-K filed on January 26, 2026), | |||||||
4.3 | First Supplemental Indenture, dated as of January 26, 2026, between Mount Logan Capital Inc. and U.S. Bank Trust Company, National Association (incorporated by reference to Exhibit 4.2 to the registrant’s Current Report on Form 8-K filed on January 26, 2026). | |||||||
4.4 | Form of Global Note (incorporated by reference to Exhibit 4.3 to the registrant’s Current Report on Form 8-K filed on January 26, 2026). | |||||||
| 4.5 | Warrant Indenture, dated as of October 19, 2018, between Legacy MLC and Computershare Trust Company of Canada (incorporated by reference to Exhibit 4.1 to the registrant’s Current Report on Form 8-K (File No. 001-42813) filed on September 16, 2025). | |||||||
| 4.6 | Warrant Indenture, dated as of January 26, 2024, between Legacy MLC and Odyssey Trust Company (incorporated by reference to Exhibit 4.2 to the registrant’s Current Report on Form 8-K filed on September 16, 2025). | |||||||
| 4.7 | Supplemental Warrant Indenture, dated as of September 12, 2025, among Legacy MLC, Computershare Trust Company of Canada and the registrant (incorporated by reference to Exhibit 4.3 to the registrant’s Current Report on Form 8-K filed on September 16, 2025). | |||||||
| 4.8 | Supplemental Warrant Indenture, dated as of September 12, 2025, among Legacy MLC, Odyssey Trust Company and the registrant (incorporated by reference to Exhibit 4.4 to the registrant’s Current Report on Form 8-K filed on September 16, 2025). | |||||||
10.1+ | Profit-Sharing Agreement, dated as of July 15, 2025, by and between BCPSC Holdings LLC and MLCSC Holdings LLC (incorporated by reference to Exhibit 10.1 to the registrant’s Quarterly Report on Form 10-Q filed on November 13, 2025). | |||||||
10.2*^ | ||||||||
10.3+ | Staffing and Resource Agreement, dated as of November 18, 2025, by and between Mount Logan Capital Inc. and BC Partners Advisors L.P. (incorporated by reference to Exhibit 10.1 to the registrant’s Current Report on Form 8-K filed on November 19, 2025). | |||||||
78
10.4+ | Third Amended and Restated Servicing Agreement, dated as of March 17, 2023, by and between Mount Logan Capital Inc. and BC Partners Advisors L.P. (incorporated by reference to Exhibit 10.4 to the registrant’s Registration Statement on Form S-4 (File No. 333-286043) filed on June 12, 2025). | |||||||
10.5+ | 2025 Omnibus Equity Incentive Plan (incorporated by reference to Exhibit 99.1 to the registrant’s Registration Statement on Form S-8 (File No. 333-291939) filed on December 4, 2025). | |||||||
10.6 | Investment Advisory Agreement between Opportunistic Credit Interval Fund and Mount Logan Management LLC (incorporated by reference to Exhibit 10.6 to the registrant’s Registration Statement on Form S-4 (File No. 333-286043) filed on June 12, 2025). | |||||||
10.7 | Form of Subscription Agreement for Debenture Units of Mount Logan Capital Inc. (incorporated by reference to Exhibit 10.8 to the registrant’s Registration Statement on Form S-4 (File No. 333-286043) filed on June 12, 2025). | |||||||
10.8*^ | ||||||||
10.9 | Amended and Restated Promissory Note from Sierra Crest Investment Management LLC to MLC US Holdings LLC (incorporated by reference to Exhibit 10.10 to the registrant’s Registration Statement on Form S-4 (File No. 333-286043) filed on June 12, 2025). | |||||||
10.10 | Amended and Restated Master Services Agreement between MLC US Holdings LLC and Sierra Crest Investment Management LLC (incorporated by reference to Exhibit 10.11 to the registrant’s Registration Statement on Form S-4 (File No. 333-286043) filed on June 12, 2025). | |||||||
10.11 | Amended and Restated Membership Interest and Asset Purchase Agreement by and among OFM II Ovation Management LLC, Ovation Partners, LP and Mount Logan Capital Inc. (incorporated by reference to Exhibit 10.13 to the registrant’s Registration Statement on Form S-4 (File No. 333-286043) filed on June 12, 2025). | |||||||
10.12^ | Credit Agreement, dated as of August 20, 2021, by and among MLC US Holdings LLC, the financial institutions party thereto, the Lenders party thereto, and the Agent party thereto, as amended by Incremental Amendment No. 1, dated as of September 19, 2022, Incremental Amendment No. 2, dated as of May 2, 2023, Incremental Amendment No. 4, dated December 17, 2024, and the Limited Waiver and Amendment No. 5, dated September 12, 2025 (included in Exhibit 10.2). | |||||||
| 10.13 | Form of Indemnification Agreement (incorporated by reference to Exhibit 10.3 to the registrant’s Registration Statement on Form S-4 (File No. 333-286043) filed on July 9, 2025). | |||||||
19.1* | ||||||||
21.1 | Subsidiaries of the Registrant (incorporated by referenced to Exhibit 21.1 to the registrant’s registration statement on Form S-1 (File No. 333-292668) filed on January 12, 2026). | |||||||
23.1* | ||||||||
31.1* | ||||||||
31.2* | ||||||||
32.1* | ||||||||
97.1* | ||||||||
| 99.9 | Schedule of Debenture Units Investors (incorporated by reference to Exhibit 99.9 to the registrant’s Registration Statement on Form S-4 (File No. 333-286043) filed on June 12, 2025). | |||||||
101.INS* | Inline XBRL Instance Document – the instance document does not appear in the Interactive Data File because XBRL tags are embedded within the Inline XBRL document | |||||||
101.SCH* | Inline XBRL Taxonomy Extension Schema Document | |||||||
101.CAL* | Inline XBRL Taxonomy Extension Calculation Linkbase Document | |||||||
101.DEF* | Inline XBRL Taxonomy Extension Definition Linkbase Document | |||||||
101.LAB* | Inline XBRL Taxonomy Extension Label Linkbase Document | |||||||
101.PRE* | Inline XBRL Taxonomy Extension Presentation Linkbase Document | |||||||
104 | Cover Page Interactive Data File (embedded within the Inline XBRL document) | |||||||
* Filed herewith.
+ Denotes a management contract or compensatory plan or arrangement.
^ Certain information contained in this exhibit has been omitted because it is not material and is the type that the registrant treats as private or confidential.
79
Item 16. Form 10-K Summary
None.
80
SIGNATURES
Pursuant to the requirements of Section 13 or 15(d) of the Securities Exchange Act of 1934, as amended, the registrant has duly caused this report to be signed on its behalf by the undersigned thereunto duly authorized.
Mount Logan Capital Inc. | ||||||||
Date: March 19, 2026 | By: | /s/ Ted Goldthorpe | ||||||
Ted Goldthorpe | ||||||||
Chief Executive Officer and Director | ||||||||
(Principal Executive Officer) | ||||||||
Date: March 19, 2026 | By: | /s/ Nikita Klassen | ||||||
Nikita Klassen | ||||||||
Chief Financial Officer and Corporate Secretary | ||||||||
(Principal Financial and Accounting Officer) | ||||||||
Pursuant to the requirements of the Securities Exchange Act of 1934, this report has been signed below by the following persons on behalf of the registrant and in the capacities and on the dates indicated.
Date: March 19, 2026 | By: | /s/ Ted Goldthorpe | ||||||
Ted Goldthorpe | ||||||||
Chief Executive Officer and Director (Principal Executive Officer) | ||||||||
Date: March 19, 2026 | By: | /s/ Nikita Klassen | ||||||
Nikita Klassen | ||||||||
Chief Financial Officer and Corporate Secretary | ||||||||
(Principal Financial and Accounting Officer) | ||||||||
Date: March 19, 2026 | By: | /s/ David Allen | ||||||
David Allen | ||||||||
Director | ||||||||
Date: March 19, 2026 | By: | /s/ Sabrina Liak | ||||||
Sabrina Liak | ||||||||
Director | ||||||||
Date: March 19, 2026 | By: | /s/ Buckley Ratchford | ||||||
Buckley Ratchford | ||||||||
Director | ||||||||
i
Date: March 19, 2026 | By: | /s/ Rudolph Reinfrank | ||||||
Rudolph Reinfrank | ||||||||
Director | ||||||||
Date: March 19, 2026 | By: | /s/ Parker A. Weil | ||||||
Parker A. Weil | ||||||||
Director | ||||||||
Date: March 19, 2026 | By: | /s/ Matthew Westwood | ||||||
Matthew Westwood | ||||||||
Director | ||||||||
ii