EX-99.2
Published on November 24, 2025
MOUNT LOGAN CAPITAL INC.
CONDENSED CONSOLIDATED STATEMENTS OF FINANCIAL POSITION (UNAUDITED)
| (in thousands, except per share data) | June 30, 2025 | December 31, 2024 | |||||||||
| ASSETS | |||||||||||
| Asset Management | |||||||||||
| Cash and cash equivalents | $ | 2,748 | $ | 8,933 | |||||||
| Investments (including related party amounts of $24,966 and $20,871 at June 30, 2025 and December 31, 2024, respectively) | 25,417 | 21,370 | |||||||||
| Intangible assets | 23,141 | 25,940 | |||||||||
| Other assets (including related party amounts of $2,937 and $2,657 at June 30, 2025 and December 31, 2024, respectively) | 10,146 | 9,179 | |||||||||
| 61,452 | 65,422 | ||||||||||
| Insurance Solutions | |||||||||||
| Cash and cash equivalents | 97,533 | 51,999 | |||||||||
| Restricted cash | 11,258 | 15,716 | |||||||||
| Investments (including related party amounts of $21,990 and $23,659 at June 30, 2025 and December 31, 2024, respectively) | 926,276 | 915,556 | |||||||||
| Assets of consolidated variable interest entities | |||||||||||
| Cash and cash equivalents | 22,233 | 25,056 | |||||||||
| Investments | 129,053 | 125,898 | |||||||||
| Other assets | 1,144 | 1,048 | |||||||||
| Reinsurance recoverable | 267,068 | 259,454 | |||||||||
| Intangible assets | 2,444 | 2,444 | |||||||||
| Deferred acquisition costs | 8,457 | 6,524 | |||||||||
| Goodwill | 55,697 | 55,697 | |||||||||
| Other assets | 20,453 | 37,135 | |||||||||
| 1,541,616 | 1,496,527 | ||||||||||
| Total assets | $ | 1,603,068 | $ | 1,561,949 | |||||||
| LIABILITIES | |||||||||||
| Asset Management | |||||||||||
| Due to related parties | $ | 13,567 | $ | 10,470 | |||||||
| Debt obligations | 73,995 | 74,963 | |||||||||
| Accrued expenses and other liabilities | 10,423 | 5,669 | |||||||||
| 97,985 | 91,102 | ||||||||||
| Insurance Solutions | |||||||||||
| Future policy benefits | 779,860 | 769,533 | |||||||||
| Interest sensitive contract liabilities | 363,284 | 334,876 | |||||||||
| Funds held under reinsurance contracts | 237,281 | 239,918 | |||||||||
| Debt obligations | 17,250 | 14,250 | |||||||||
| Derivatives | 457 | 5,192 | |||||||||
| Accrued expenses and other liabilities | 7,243 | 2,995 | |||||||||
| 1,405,375 | 1,366,764 | ||||||||||
| Total liabilities | 1,503,360 | 1,457,866 | |||||||||
| Commitments and Contingencies (See Note 23) | |||||||||||
| EQUITY | |||||||||||
| Common shares | 121,372 | 116,118 | |||||||||
| Warrants | 1,426 | 1,426 | |||||||||
| Additional paid-in-capital | 8,166 | 7,777 | |||||||||
| Retained earnings (accumulated deficit) | (66,727) | (58,279) | |||||||||
| Accumulated other comprehensive income (loss) | 35,471 | 37,041 | |||||||||
| Total equity | 99,708 | 104,083 | |||||||||
| Total liabilities and equity | $ | 1,603,068 | $ | 1,561,949 | |||||||
The accompanying notes are an integral part of these Condensed Consolidated Financial Statements (Unaudited).
F-1
MOUNT LOGAN CAPITAL INC.
CONDENSED CONSOLIDATED STATEMENTS OF OPERATIONS (UNAUDITED)
| Three months ended June, 30 | Six months ended June, 30 | ||||||||||||||||||||||
| (in thousands, except per share data) | 2025 | 2024 | 2025 | 2024 | |||||||||||||||||||
| REVENUES | |||||||||||||||||||||||
| Asset Management | |||||||||||||||||||||||
| Management fees | $ | 2,809 | $ | 2,825 | $ | 6,049 | $ | 5,416 | |||||||||||||||
| Incentive fees | 478 | 1,008 | 777 | 1,911 | |||||||||||||||||||
| Equity investment earning | 42 | (57) | 324 | 167 | |||||||||||||||||||
| 3,329 | 3,776 | 7,150 | 7,494 | ||||||||||||||||||||
| Insurance Solutions | |||||||||||||||||||||||
| Net premiums | (4,238) | (3,717) | (8,251) | (7,330) | |||||||||||||||||||
| Product charges | 722 | 73 | 1,582 | 107 | |||||||||||||||||||
| Net investment income | 16,678 | 19,023 | 31,629 | 36,400 | |||||||||||||||||||
| Net gains (losses) from investment activities | 3,838 | (1,293) | 5,310 | (2,067) | |||||||||||||||||||
| Net revenues of consolidated variable interest entities | 3,549 | 3,964 | 7,182 | 8,643 | |||||||||||||||||||
| Net investment income (loss) on funds withheld | (6,826) | (7,926) | (12,576) | (15,312) | |||||||||||||||||||
| Other income | 78 | 76 | 154 | 158 | |||||||||||||||||||
| 13,801 | 10,200 | 25,030 | 20,599 | ||||||||||||||||||||
| Total revenues | 17,130 | 13,976 | 32,180 | 28,093 | |||||||||||||||||||
| EXPENSES | |||||||||||||||||||||||
| Asset Management | |||||||||||||||||||||||
| Administration and servicing fees | 1,812 | 1,952 | 3,049 | 3,375 | |||||||||||||||||||
| Transaction costs | 2,753 | (198) | 7,298 | 53 | |||||||||||||||||||
| Compensation and benefits | 1,836 | 1,873 | 4,216 | 3,576 | |||||||||||||||||||
| Amortization and impairment of intangible assets | 1,889 | 482 | 2,799 | 964 | |||||||||||||||||||
| Interest and other credit facility expenses | 1,960 | 1,661 | 3,906 | 3,363 | |||||||||||||||||||
| General, administrative and other | 1,258 | 1,042 | 2,981 | 3,274 | |||||||||||||||||||
| 11,508 | 6,812 | 24,249 | 14,605 | ||||||||||||||||||||
| Insurance Solutions | |||||||||||||||||||||||
| Net policy benefit and claims (remeasurement gain on policy liabilities of $2,945 and $3,025 and $1,881 and $7,306 for the three and six months ended June 30, 2025 and 2024, respectively) | (1,064) | (887) | 729 | (5,148) | |||||||||||||||||||
| Interest sensitive contract benefits | 3,997 | 3,733 | 7,815 | 7,138 | |||||||||||||||||||
| Amortization of deferred acquisition costs | 905 | 550 | 1,460 | 1,037 | |||||||||||||||||||
| Compensation and benefits | 223 | 465 | 467 | 649 | |||||||||||||||||||
| Interest expense | 407 | 328 | 735 | 656 | |||||||||||||||||||
| General, administrative and other (including related party amounts of $1,753 and $3,485 and $1,802 and $3,569 for the three and six months ended June 30, 2025 and 2024, respectively) | 3,270 | 4,272 | 6,956 | 8,606 | |||||||||||||||||||
| 7,738 | 8,461 | 18,162 | 12,938 | ||||||||||||||||||||
| Total expenses | 19,246 | 15,273 | 42,411 | 27,543 | |||||||||||||||||||
| Investment and other income (loss) - Asset Management | |||||||||||||||||||||||
| Net gains (losses) from investment activities | 867 | (896) | 1,708 | (1,114) | |||||||||||||||||||
| Dividend income | 29 | 113 | 67 | 225 | |||||||||||||||||||
| Interest income | 271 | 272 | 539 | 543 | |||||||||||||||||||
| Other income (loss), net | 6 | — | 305 | — | |||||||||||||||||||
| Total investment and other income (loss) | 1,173 | (511) | 2,619 | (346) | |||||||||||||||||||
| Income (loss) before taxes | (943) | (1,808) | (7,612) | 204 | |||||||||||||||||||
| Income tax (expense) benefit — Asset Management | 9 | (189) | (27) | (184) | |||||||||||||||||||
| Net income (loss) | $ | (934) | $ | (1,997) | $ | (7,639) | $ | 20 | |||||||||||||||
| Earnings per share | |||||||||||||||||||||||
| Net income (loss) attributable to common shareholders - Basic | $ | (0.03) | $ | (0.08) | $ | (0.27) | NM | ||||||||||||||||
| Net income (loss) attributable to common shareholders - Diluted | (0.03) | (0.08) | (0.27) | NM | |||||||||||||||||||
| Weighted average shares outstanding – Basic | 28,666,080 | 25,797,739 | 28,215,408 | 25,771,715 | |||||||||||||||||||
| Weighted average shares outstanding – Diluted | 28,666,080 | 25,797,739 | 28,215,408 | 26,003,327 | |||||||||||||||||||
Note: “NM” denotes not meaningful
The accompanying notes are an integral part of these Condensed Consolidated Financial Statements (Unaudited).
F-2
MOUNT LOGAN CAPITAL INC.
CONDENSED CONSOLIDATED STATEMENTS OF COMPREHENSIVE INCOME (LOSS) (UNAUDITED)
| Three months ended June 30, | Six months ended June 30, | |||||||||||||||||||||||||
| (in thousands, except per share data) | 2025 | 2024 | 2025 | 2024 | ||||||||||||||||||||||
| Net income (loss) | $ | (934) | $ | (1,997) | $ | (7,639) | $ | 20 | ||||||||||||||||||
| Other comprehensive income (loss), before tax: | ||||||||||||||||||||||||||
| Unrealized investment gains (losses) on available-for-sale securities | (917) | 955 | 1,687 | 4,179 | ||||||||||||||||||||||
| Unrealized gains (losses) on hedging instruments | 1,407 | (1,787) | 4,735 | (2,458) | ||||||||||||||||||||||
| Remeasurement gains (losses) on future policy benefits related to discount rate | (2,849) | 4,597 | (7,992) | 10,817 | ||||||||||||||||||||||
| Other comprehensive income (loss), before tax | (2,359) | 3,765 | (1,570) | 12,538 | ||||||||||||||||||||||
| Income tax expense (benefit) related to other comprehensive income (loss) | — | — | — | — | ||||||||||||||||||||||
| Other comprehensive income (loss) | (2,359) | 3,765 | (1,570) | 12,538 | ||||||||||||||||||||||
| Comprehensive income (loss) | $ | (3,293) | $ | 1,768 | $ | (9,209) | $ | 12,558 | ||||||||||||||||||
The accompanying notes are an integral part of these Condensed Consolidated Financial Statements (Unaudited).
F-3
MOUNT LOGAN CAPITAL INC.
CONDENSED CONSOLIDATED STATEMENTS OF CHANGES IN EQUITY (UNAUDITED)
(in thousands, except for number of shares)
| Three and Six Months Ended June 30, 2025 | Number of Voting Common Shares | Common Shares | Warrants | Additional Paid in Capital | Retained Earnings (Accumulated Deficit) | Accumulated Other Comprehensive Income (loss) | Total Equity | |||||||||||||||||||||||||||||||||||||
| Balance at April 1, 2025 | 28,666,080 | $ | 121,372 | $ | 1,426 | $ | 7,825 | $ | (65,383) | $ | 37,830 | $ | 103,070 | |||||||||||||||||||||||||||||||
| Share issuance | — | — | — | — | — | — | — | |||||||||||||||||||||||||||||||||||||
| Equity based compensation | — | — | — | 341 | — | — | 341 | |||||||||||||||||||||||||||||||||||||
| Restricted stock release | — | — | — | — | — | — | — | |||||||||||||||||||||||||||||||||||||
| Shareholder dividends | — | — | — | — | (410) | — | (410) | |||||||||||||||||||||||||||||||||||||
| Net income (loss) | — | — | — | — | (934) | — | (934) | |||||||||||||||||||||||||||||||||||||
| Other comprehensive income (loss) | — | — | — | — | — | (2,359) | (2,359) | |||||||||||||||||||||||||||||||||||||
| Balance at June 30, 2025 | 28,666,080 | $ | 121,372 | $ | 1,426 | $ | 8,166 | $ | (66,727) | $ | 35,471 | $ | 99,708 | |||||||||||||||||||||||||||||||
| Balance at January 1, 2025 | 25,895,612 | $ | 116,118 | $ | 1,426 | $ | 7,777 | $ | (58,279) | $ | 37,041 | $ | 104,083 | |||||||||||||||||||||||||||||||
| Share issuance | 2,693,071 | 5,000 | — | — | — | — | 5,000 | |||||||||||||||||||||||||||||||||||||
| Equity based compensation | 17,315 | 45 | — | 674 | — | — | 719 | |||||||||||||||||||||||||||||||||||||
| Restricted stock release | 60,082 | 209 | — | (285) | — | — | (76) | |||||||||||||||||||||||||||||||||||||
| Shareholder dividends | — | — | — | — | (809) | — | (809) | |||||||||||||||||||||||||||||||||||||
| Net income (loss) | — | — | — | — | (7,639) | — | (7,639) | |||||||||||||||||||||||||||||||||||||
| Other comprehensive income (loss) | — | — | — | — | — | (1,570) | (1,570) | |||||||||||||||||||||||||||||||||||||
| Balance at June 30, 2025 | 28,666,080 | $ | 121,372 | $ | 1,426 | $ | 8,166 | $ | (66,727) | $ | 35,471 | $ | 99,708 | |||||||||||||||||||||||||||||||
| Three and Six Months Ended June 30, 2024 | Number of Voting Common Shares | Common Shares | Warrants | Additional Paid in Capital | Retained Earnings (Accumulated Deficit) | Accumulated Other Comprehensive Income (Loss) | Total Equity | |||||||||||||||||||||||||||||||||||||
| Balance at April 1, 2024 | 25,797,739 | $ | 115,845 | $ | 1,426 | $ | 7,605 | $ | (44,752) | $ | 35,859 | $ | 115,983 | |||||||||||||||||||||||||||||||
| Issuance of warrants | — | — | — | — | — | — | — | |||||||||||||||||||||||||||||||||||||
| Equity based compensation | — | — | — | 67 | — | — | 67 | |||||||||||||||||||||||||||||||||||||
| Restricted stock release | — | — | — | — | — | — | — | |||||||||||||||||||||||||||||||||||||
| Shareholder dividends | — | — | — | — | (375) | — | (375) | |||||||||||||||||||||||||||||||||||||
| Net income (loss) | — | — | — | — | (1,997) | — | (1,997) | |||||||||||||||||||||||||||||||||||||
| Other comprehensive income (loss) | — | — | — | — | — | 3,765 | 3,765 | |||||||||||||||||||||||||||||||||||||
| Balance at June 30, 2024 | 25,797,739 | $ | 115,845 | $ | 1,426 | $ | 7,672 | $ | (47,124) | $ | 39,624 | $ | 117,443 | |||||||||||||||||||||||||||||||
| Balance at January 1, 2024 | 25,733,735 | $ | 115,607 | $ | 1,129 | $ | 7,820 | $ | (46,386) | $ | 27,086 | $ | 105,256 | |||||||||||||||||||||||||||||||
| Issuance of warrants | — | — | 297 | — | — | — | 297 | |||||||||||||||||||||||||||||||||||||
| Equity based compensation | — | — | — | 142 | — | — | 142 | |||||||||||||||||||||||||||||||||||||
| Restricted stock release | 64,004 | 238 | — | (290) | — | — | (52) | |||||||||||||||||||||||||||||||||||||
| Shareholder dividends | — | — | — | — | (758) | — | (758) | |||||||||||||||||||||||||||||||||||||
| Net income (loss) | — | — | — | — | 20 | — | 20 | |||||||||||||||||||||||||||||||||||||
| Other comprehensive income (loss) | — | — | — | — | — | 12,538 | 12,538 | |||||||||||||||||||||||||||||||||||||
| Balance at June 30, 2024 | 25,797,739 | $ | 115,845 | $ | 1,426 | $ | 7,672 | $ | (47,124) | $ | 39,624 | $ | 117,443 | |||||||||||||||||||||||||||||||
The accompanying notes are an integral part of these Condensed Consolidated Financial Statements (Unaudited).
F-4
MOUNT LOGAN CAPITAL INC.
CONDENSED CONSOLIDATED STATEMENTS OF CASH FLOWS (UNAUDITED)
| Six months ended June 30, | |||||||||||
| (in thousands) | 2025 | 2024 | |||||||||
| Cash Flows from Operating Activities | |||||||||||
| Net income (loss) | $ | (7,639) | $ | 20 | |||||||
| Adjustments to reconcile net income (loss) to net cash used in operating activities: | |||||||||||
| Net realized (gains) losses on investments | 1,996 | (840) | |||||||||
| Net realized (gains) losses on foreign currency | 11 | 2 | |||||||||
| Net change in unrealized (gains) losses on investments | (7,316) | 3,300 | |||||||||
| Net change in (gain) loss on foreign currency | (36) | 26 | |||||||||
| Change in fair value of debt obligation | (1,339) | 261 | |||||||||
| Payment in-kind interest | 144 | (418) | |||||||||
| Equity investment earnings | (324) | (167) | |||||||||
| Amortization of debt issuance costs | 251 | 177 | |||||||||
| Amortization of deferred acquisition costs | 1,460 | 1,037 | |||||||||
| Amortization of intangible assets | 2,799 | 964 | |||||||||
| Net amortization of premiums and accretion of discounts on investments | 177 | (524) | |||||||||
| Equity based compensation | 643 | 90 | |||||||||
| Increase (decrease) in estimated credit losses | 218 | 861 | |||||||||
| (Increase) decrease in operating assets: | |||||||||||
| Reinsurance recoverable | 3,623 | 18,378 | |||||||||
| Change in deferred acquisition costs | (3,393) | (2,179) | |||||||||
| Distributions from equity method investments | 892 | 1,051 | |||||||||
| Other assets | (1,024) | 2,788 | |||||||||
| Other assets of consolidated VIEs | (96) | (199) | |||||||||
| Purchases of investments by consolidated VIEs | (33,952) | (58,580) | |||||||||
| Proceeds from sale of investments by consolidated VIEs | 30,932 | 48,366 | |||||||||
| Increase (decrease) in operating liabilities: | |||||||||||
| Due to affiliates | 3,086 | 509 | |||||||||
| Future policy benefits | (8,903) | (27,049) | |||||||||
| Interest sensitive contract liabilities | 7,815 | 7,138 | |||||||||
| Funds held under reinsurance contracts | (2,637) | 1,869 | |||||||||
| Accrued expenses and other liabilities | 5,619 | (18,938) | |||||||||
| Net cash used in operating activities | $ | (6,993) | $ | (22,057) | |||||||
| Investing Activities | |||||||||||
| Purchases of investments | $ | (130,680) | $ | (152,127) | |||||||
| Proceeds from sales and repayments of investments | 147,725 | 114,869 | |||||||||
| Net cash provided by (used in) investing activities | $ | 17,045 | $ | (37,258) | |||||||
| Financing Activities | |||||||||||
| Shareholder dividends | $ | (809) | $ | (758) | |||||||
| Proceeds from borrowings of asset management business | — | 18,752 | |||||||||
| Repayments of borrowings of asset management business | (768) | (15,063) | |||||||||
| Proceeds from borrowings of insurance business | 3,000 | — | |||||||||
| Deposits on investment-type policies and contracts | 42,996 | 75,933 | |||||||||
| Withdrawals on investment-type policies and contracts | (22,403) | (8,743) | |||||||||
| Net cash provided by (used in) financing activities | $ | 22,016 | $ | 70,121 | |||||||
| Net increase (decrease) in cash, cash equivalents and restricted cash, and cash and cash equivalents of consolidated VIEs | 32,068 | 10,806 | |||||||||
| Cash, cash equivalents and restricted cash, and cash and cash equivalents of consolidated VIEs, beginning of the period | 101,704 | 90,220 | |||||||||
The accompanying notes are an integral part of these Condensed Consolidated Financial Statements (Unaudited).
F-5
| Six months ended June 30, | |||||||||||
| (in thousands) | 2025 | 2024 | |||||||||
| Cash Flows from Operating Activities | |||||||||||
| Cash, cash equivalents and restricted cash, and cash and cash equivalents of consolidated VIEs, end of period | $ | 133,772 | $ | 101,026 | |||||||
| Cash, cash equivalents, restricted cash and cash and cash equivalents of consolidated VIEs | |||||||||||
| Asset Management | |||||||||||
| Cash and cash equivalents | 2,748 | 2,869 | |||||||||
| Total Asset Management | 2,748 | 2,869 | |||||||||
| Insurance Solutions | |||||||||||
| Cash and cash equivalents | 97,533 | 67,704 | |||||||||
| Restricted cash | 11,258 | 13,324 | |||||||||
| Cash and cash equivalents of consolidated VIEs | 22,233 | 17,129 | |||||||||
| Total Insurance Solutions | 131,024 | 98,157 | |||||||||
| Total cash, cash equivalents and restricted cash, and cash and cash equivalents of consolidated VIEs | $ | 133,772 | $ | 101,026 | |||||||
| Supplemental disclosures of cash flow information | |||||||||||
| Interest received | $ | 44,178 | $ | 43,487 | |||||||
| Interest paid | 3,431 | 1,862 | |||||||||
| Dividends received | 742 | 999 | |||||||||
| Income taxes paid | 243 | 178 | |||||||||
| Supplemental Disclosures of Non-Cash Investing and Financing Activities | |||||||||||
| Cashless repayment on borrowings | — | 13,636 | |||||||||
| Issuance of common shares for vested Restricted Share Units | 209 | 238 | |||||||||
| Issuance of common shares for investment purchases | 5,000 | — | |||||||||
| Issuance of common shares for share based compensation | 45 | — | |||||||||
The accompanying notes are an integral part of these Condensed Consolidated Financial Statements (Unaudited).
F-6
MOUNT LOGAN CAPITAL INC.
NOTES TO CONDENSED CONSOLIDATED FINANCIAL STATEMENTS (UNAUDITED)
(All amounts in thousands, except share and per share data, and except where noted)
Note 1. Organization
Mount Logan ("MLC," the "Company" or "we"), together with its consolidated subsidiaries is a diversified alternative asset management and insurance solutions platform. Our mission is to provide our investors access to a diversified and differentiated set of private market investment solutions to address their capital needs. Mount Logan conducts its business primarily in the United States through its two business segments: Asset Management and Insurance Solutions. Our Asset Management segment is conducted by Mount Logan Management LLC (“ML Management”), our SEC-registered investment adviser, manages a significant portion of our Assets Under Management (“AUM”) across our various managed funds supported by permanent and semi-permanent capital bases. Management also directly manages the capital of our wholly-owned insurance company, Ability Insurance Company (“Ability”), for the benefit of policyholders. The Company’s Insurance Solutions segment is conducted by Ability, a Nebraska domiciled insurer, specializes in reinsuring annuity products for the increasing number of individuals seeking to fund retirement needs and represents all of our insurance solutions operations.
Note 2. Summary of significant accounting policies
Basis of presentation
The accompanying unaudited Condensed Consolidated Financial Statements ("Condensed Consolidated Financial Statements") have been prepared in accordance with accounting principles generally accepted in the United States of America (“U.S. GAAP”). Certain disclosures included in the annual audited Consolidated Financial Statements have been condensed or omitted as they are not required for interim Consolidated Financial Statements. The operating results presented for interim periods are not necessarily indicative of the results that may be expected for any other interim period or for the entire year. These Condensed Consolidated Financial Statements should be read in conjunction with the annual audited Consolidated Financial Statements.
The condensed consolidated financial statements reflect all adjustments, both normal and recurring which, in the opinion of management, are necessary for the fair presentation of the Company’s condensed consolidated statements of operations and condensed consolidated statements of financial position for the periods presented.
The results of the Company and its subsidiaries are presented on a consolidated basis. All intercompany transactions and balances are eliminated on consolidation.
The Company's Asset Management and Insurance Solutions segments possess distinct characteristics, and as a result are presented separately from each other. The Company believes that separate presentation provides a more informative view of the Company’s consolidated financial position and results of operations than an aggregated presentation and that reporting insurance solutions separately is appropriate given, among other factors, the relative significance of Ability's policy liabilities, which do not provide recourse to the remaining assets of MLC.
The summary of the significant accounting policies includes a section for common accounting policies and an accounting policy section for each of the two operating segments when a policy is specific to one operating segment and not the other. Unless otherwise specified, the significant accounting policy applies to both segments.
Due to rounding, numbers presented throughout these Condensed Consolidated Financial Statements may not add up precisely to the totals provided and percentages may not precisely reflect the absolute figures.
Recently adopted accounting pronouncements
In March 2024, the Financial Accounting Standards Board (“FASB”) issued Accounting Standards Update (“ASU”) 2024-01, Compensation-Stock Compensation (Topic 718): Scope Application of Profits Interest and Similar Awards, which clarifies how an entity determines whether a profits interest or similar award (hereafter a “profits interest award”) is (1) within the scope of FASB ASC 718, Share-Based Payments, or (2) not a share-based payment arrangement and therefore within the scope of other guidance. This ASU is effective for annual periods beginning after December 15,
F-7
2024, and interim periods within those annual periods. The Company adopted this accounting standard effective January 1, 2025 and its adoption on a prospective basis did not have an impact on the Condensed Consolidated Financial Statements.
Recently issued accounting pronouncements
In December 2023, the FASB issued ASU 2023-09, Income Taxes (Topic 740): Improvements to Income Tax Disclosures. This ASU requires additional quantitative and qualitative income tax disclosures to allow readers of the financial statements to assess how the Company’s operations, related tax risks and tax planning affect its tax rate and prospects for future cash flows. For public business entities, ASU 2023-09 is effective for annual periods beginning after December 15, 2024. The Company is currently evaluating the impact that the adoption of this ASU will have on its Condensed Consolidated Financial Statements.
In March 2024, the FASB issued ASU 2024-02, Codification Improvements-Amendments to Remove References to the Concepts Statements. This ASU contains amendments to the Codification that remove references to various FASB Concepts Statements. The effort facilitates Codification updates for technical corrections such as conforming amendments, clarifications to guidance, simplifications to wording or the structure of guidance and other minor improvements. While the amendments are not expected to result in significant changes for most entities, the FASB provided transition guidance since some entities could be affected. This ASU will be effective for fiscal years beginning after December 15, 2024, with early adoption permitted. The Company has determined that the ASU will not have a material impact on its Condensed Consolidated Financial Statements.
In November 2024, the FASB issued ASU 2024-03, Income Statement – Reporting Comprehensive Income – Expense Disaggregation Disclosures. This ASU requires disaggregation of certain expense captions into specified categories in disclosures within the footnotes to the financial statements. The ASU requires presentation in a tabular format of each pertinent expense category on the face of the income statement, such as employee compensation, depreciation, amortization of intangible assets, and other applicable expenses. This ASU will be effective for fiscal years beginning after December 15, 2026, and interim reporting periods beginning after December 15, 2027. Early adoption of the ASU is permitted, including adoption in any interim period for which financial statements have not been issued. The Company is currently evaluating the impact of adopting this ASU on its Condensed Consolidated Financial Statements.
In May 2025, the FASB issued ASU 2025–03, “Business Combinations (Topic 805) and Consolidation (Topic 810): Determining the Accounting Acquirer in the Acquisition of a Variable Interest Entity” (“ASU 2025–03”). ASU 2025–03 requires an entity involved in an acquisition transaction effected primarily by exchanging equity interests when the legal acquiree is a variable interest entity (“VIE”) that meets the definition of a business to consider factors to determine which entity is the accounting acquirer. When considering those factors, the reporting entity may determine that a transaction in which the legal acquiree is a VIE represents a reverse acquisition. The update will be effective for annual periods (and interim periods in annual reporting periods) beginning after December 15, 2026. The Company is currently evaluating the impact of adopting this ASU on its Condensed Consolidated Financial Statements.
Note 3. Net gains (losses) from investment activities
The table below summarizes the net gains (losses) from investment activities:
| For the three months ended June 30, | 2025 | 2024 | ||||||||||||||||||||||||||||||||||||||||||||||||
| Net realized gains (losses) | Net unrealized gains (losses) | Credit releases (losses) | Total | Net realized gains (losses) | Net unrealized gains (losses) | Credit releases (losses) | Total | |||||||||||||||||||||||||||||||||||||||||||
| Asset Management | ||||||||||||||||||||||||||||||||||||||||||||||||||
| Equity securities | $ | 22 | $ | 474 | $ | — | $ | 496 | $ | 146 | $ | (928) | $ | — | $ | (782) | ||||||||||||||||||||||||||||||||||
| Debt obligation | — | 371 | — | 371 | — | (114) | — | (114) | ||||||||||||||||||||||||||||||||||||||||||
| Net gains (losses) from investment activities — Asset Management | 22 | 845 | — | 867 | 146 | (1,042) | — | (896) | ||||||||||||||||||||||||||||||||||||||||||
| Insurance Solutions | ||||||||||||||||||||||||||||||||||||||||||||||||||
| Debt securities: | ||||||||||||||||||||||||||||||||||||||||||||||||||
F-8
| For the three months ended June 30, | 2025 | 2024 | ||||||||||||||||||||||||||||||||||||||||||||||||
| Net realized gains (losses) | Net unrealized gains (losses) | Credit releases (losses) | Total | Net realized gains (losses) | Net unrealized gains (losses) | Credit releases (losses) | Total | |||||||||||||||||||||||||||||||||||||||||||
| U.S. state, territories and municipalities | $ | — | $ | 5 | $ | — | $ | 5 | $ | — | $ | 21 | $ | — | $ | 21 | ||||||||||||||||||||||||||||||||||
| Other government and agency | — | (1) | — | (1) | — | (68) | — | (68) | ||||||||||||||||||||||||||||||||||||||||||
| Corporate | (1,057) | 1,049 | — | (8) | — | (2,210) | — | (2,210) | ||||||||||||||||||||||||||||||||||||||||||
| Asset and mortgage- backed securities | (94) | (299) | — | (393) | (8) | 1,807 | — | 1,799 | ||||||||||||||||||||||||||||||||||||||||||
| Corporate loans | (2) | 637 | — | 635 | (4) | (117) | — | (121) | ||||||||||||||||||||||||||||||||||||||||||
| Mortgage loans | — | — | (296) | (296) | — | — | (457) | (457) | ||||||||||||||||||||||||||||||||||||||||||
| Equity securities | — | 8 | — | 8 | — | 7 | — | 7 | ||||||||||||||||||||||||||||||||||||||||||
| Other invested assets | (755) | 4,607 | 36 | 3,888 | — | (12) | (252) | (264) | ||||||||||||||||||||||||||||||||||||||||||
| Net gains (losses) from investment activities — Insurance Solutions | (1,908) | 6,006 | (260) | 3,838 | (12) | (572) | (709) | (1,293) | ||||||||||||||||||||||||||||||||||||||||||
| Investments of consolidated VIEs | 177 | (464) | — | (287) | 416 | (974) | — | (558) | ||||||||||||||||||||||||||||||||||||||||||
| Net gains (losses) from investment activities — Insurance Solutions including consolidated VIEs | $ | (1,731) | $ | 5,542 | $ | (260) | $ | 3,551 | $ | 404 | $ | (1,546) | $ | (709) | $ | (1,851) | ||||||||||||||||||||||||||||||||||
| For the six months ended June 30, | 2025 | 2024 | ||||||||||||||||||||||||||||||||||||||||||||||||
| Net realized gains (losses) | Net unrealized gains (losses) | Credit releases (losses) | Total | Net realized gains (losses) | Net unrealized gains (losses) | Credit releases (losses) | Total | |||||||||||||||||||||||||||||||||||||||||||
| Asset Management | ||||||||||||||||||||||||||||||||||||||||||||||||||
| Equity securities | $ | 81 | $ | 288 | $ | — | $ | 369 | $ | 146 | $ | (999) | $ | — | $ | (853) | ||||||||||||||||||||||||||||||||||
| Debt obligation | — | 1,339 | — | 1,339 | — | (261) | — | (261) | ||||||||||||||||||||||||||||||||||||||||||
| Net gains (losses) from investment activities — Asset Management | 81 | 1,627 | — | 1,708 | 146 | (1,260) | — | (1,114) | ||||||||||||||||||||||||||||||||||||||||||
| Insurance Solutions | ||||||||||||||||||||||||||||||||||||||||||||||||||
| Debt securities: | ||||||||||||||||||||||||||||||||||||||||||||||||||
| U.S. state, territories and municipalities | $ | (4) | $ | 62 | $ | — | $ | 58 | $ | (5) | $ | 29 | $ | — | $ | 24 | ||||||||||||||||||||||||||||||||||
| Other government and agency | — | (2) | — | (2) | — | (39) | — | (39) | ||||||||||||||||||||||||||||||||||||||||||
| Corporate | (1,068) | 2,236 | — | 1,168 | (1) | (4,099) | — | (4,100) | ||||||||||||||||||||||||||||||||||||||||||
| Asset and mortgage- backed securities | (252) | (184) | — | (436) | 80 | 3,272 | — | 3,352 | ||||||||||||||||||||||||||||||||||||||||||
| Corporate loans | — | 1,426 | — | 1,426 | 22 | (719) | — | (697) | ||||||||||||||||||||||||||||||||||||||||||
| Mortgage loans | — | — | (284) | (284) | — | — | (916) | (916) | ||||||||||||||||||||||||||||||||||||||||||
| Equity securities | (246) | 98 | — | (148) | (3) | 312 | — | 309 | ||||||||||||||||||||||||||||||||||||||||||
| Other invested assets | (755) | 4,217 | 66 | 3,528 | — | (56) | 56 | — | ||||||||||||||||||||||||||||||||||||||||||
| Net gains (losses) from investment activities — Insurance Solutions | (2,325) | 7,853 | (218) | 5,310 | 93 | (1,300) | (860) | (2,067) | ||||||||||||||||||||||||||||||||||||||||||
F-9
| For the six months ended June 30, | 2025 | 2024 | ||||||||||||||||||||||||||||||||||||||||||||||||
| Net realized gains (losses) | Net unrealized gains (losses) | Credit releases (losses) | Total | Net realized gains (losses) | Net unrealized gains (losses) | Credit releases (losses) | Total | |||||||||||||||||||||||||||||||||||||||||||
| Investments of consolidated VIEs | 237 | (789) | — | (552) | 599 | (1,027) | — | (428) | ||||||||||||||||||||||||||||||||||||||||||
| Net gains (losses) from investment activities — Insurance Solutions including consolidated VIEs | $ | (2,088) | $ | 7,064 | $ | (218) | $ | 4,758 | $ | 692 | $ | (2,327) | $ | (860) | $ | (2,495) | ||||||||||||||||||||||||||||||||||
Note 4. Net investment income
Net investment income for the Insurance Solutions segment is comprised primarily of Interest income and Dividend income from common and preferred stock. The table below summarizes Net investment income:
| Three months ended June 30, | Six months ended June 30, | |||||||||||||||||||||||||
| 2025 | 2024 | 2025 | 2024 | |||||||||||||||||||||||
| Debt securities | $ | 9,571 | $ | 11,999 | $ | 22,605 | $ | 24,558 | ||||||||||||||||||
| Corporate loans | (2,481) | 3,546 | (782) | 6,320 | ||||||||||||||||||||||
| Derivatives | 7,216 | — | 6,780 | — | ||||||||||||||||||||||
| Mortgage loans | 1,908 | 2,411 | 4,734 | 4,413 | ||||||||||||||||||||||
| Equity securities | 217 | 390 | 393 | 1,279 | ||||||||||||||||||||||
| Other | 277 | 998 | 737 | 1,555 | ||||||||||||||||||||||
| Gross investment income: | 16,708 | 19,344 | 34,467 | 38,125 | ||||||||||||||||||||||
| Less: | ||||||||||||||||||||||||||
| Investment expenses | (30) | (321) | (2,838) | (1,725) | ||||||||||||||||||||||
| Net investment income | $ | 16,678 | $ | 19,023 | $ | 31,629 | $ | 36,400 | ||||||||||||||||||
| Investment income of consolidated VIEs | 3,836 | 4,522 | 7,734 | 9,071 | ||||||||||||||||||||||
| Net investment income — Insurance Solutions, including consolidated VIEs | $ | 20,514 | $ | 23,545 | $ | 39,363 | $ | 45,471 | ||||||||||||||||||
F-10
Note 5. Investments
The following table outlines the carrying value of the Company’s investments:
| As of | June 30, 2025 | December 31, 2024 | ||||||||||||
| Asset Management | ||||||||||||||
| Corporate loans | $ | 13,287 | $ | 13,287 | ||||||||||
| Equity securities | 6,891 | 2,276 | ||||||||||||
| Equity method | 5,239 | 5,807 | ||||||||||||
| Total investments - Asset Management | $ | 25,417 | $ | 21,370 | ||||||||||
| Insurance Solutions | ||||||||||||||
| Debt securities | $ | 590,860 | $ | 615,460 | ||||||||||
| Corporate loans | 162,716 | 114,735 | ||||||||||||
| Mortgage loans | 143,662 | 147,640 | ||||||||||||
| Equity securities | 7,776 | 16,404 | ||||||||||||
| Other invested assets | 21,262 | 21,317 | ||||||||||||
| Total investments - Insurance Solutions | $ | 926,276 | $ | 915,556 | ||||||||||
| Corporate loans of consolidated VIEs | 128,806 | 125,757 | ||||||||||||
| Equity securities of consolidated VIEs | 247 | 141 | ||||||||||||
| Total investments - Insurance Solutions, including consolidated VIEs | 1,055,329 | 1,041,454 | ||||||||||||
| Total investments | $ | 1,080,746 | $ | 1,062,824 | ||||||||||
F-11
Financial assets
The following tables summarize the measurement categories of financial assets held by the Company as of June 30, 2025, and December 31, 2024:
| As of June 30, 2025 | Fair value | Amortized cost | Fair value option | Total | ||||||||||||||||||||||
| Financial assets | ||||||||||||||||||||||||||
| Asset Management | ||||||||||||||||||||||||||
| Corporate loans | $ | — | $ | 13,287 | $ | — | $ | 13,287 | ||||||||||||||||||
| Equity securities | 6,891 | — | — | 6,891 | ||||||||||||||||||||||
| Total financial assets — Asset Management¹ | $ | 6,891 | $ | 13,287 | $ | — | $ | 20,178 | ||||||||||||||||||
| Insurance Solutions | ||||||||||||||||||||||||||
| Debt securities: | ||||||||||||||||||||||||||
| U.S. government and agency | $ | 6,135 | $ | — | $ | — | $ | 6,135 | ||||||||||||||||||
| U.S. state, territories and municipalities | 3,399 | — | 1,935 | 5,334 | ||||||||||||||||||||||
| Other government and agency | — | — | 2,363 | 2,363 | ||||||||||||||||||||||
| Corporate | 116,873 | — | 104,474 | 221,347 | ||||||||||||||||||||||
| Asset and mortgage-backed securities | 234,709 | — | 120,972 | 355,681 | ||||||||||||||||||||||
| Corporate loans | (1) | — | 162,717 | 162,716 | ||||||||||||||||||||||
| Mortgage loans | — | 143,662 | — | 143,662 | ||||||||||||||||||||||
| Equity securities | 7,776 | — | — | 7,776 | ||||||||||||||||||||||
| Other invested assets² | 3,162 | 16,910 | 1,190 | 21,262 | ||||||||||||||||||||||
| Total financial assets — Insurance Solutions | $ | 372,053 | $ | 160,572 | $ | 393,651 | $ | 926,276 | ||||||||||||||||||
| Corporate loans of consolidated VIEs | — | — | 128,806 | 128,806 | ||||||||||||||||||||||
| Equity securities of consolidated VIEs | 247 | — | — | 247 | ||||||||||||||||||||||
| Total financial assets — Insurance Solutions, including consolidated VIEs | 372,300 | 160,572 | 522,457 | 1,055,329 | ||||||||||||||||||||||
| Total financial assets | $ | 379,191 | $ | 173,859 | $ | 522,457 | $ | 1,075,507 | ||||||||||||||||||
(1)The MLC US Holdings Credit Facility (as hereinafter defined) is collateralized by assets held by MLC US Holdings, including assets totaling $28.5 million as of June 30, 2025.
(2)Other invested assets primarily include structured securities and loan receivables.
F-12
| As of December 31, 2024 | Fair value | Amortized cost | Fair value option | Total | ||||||||||||||||||||||
| Financial assets | ||||||||||||||||||||||||||
| Asset Management | ||||||||||||||||||||||||||
| Corporate loans | $ | — | $ | 13,287 | $ | — | $ | 13,287 | ||||||||||||||||||
| Equity securities | 2,276 | — | — | 2,276 | ||||||||||||||||||||||
| Total financial assets — Asset Management¹ | $ | 2,276 | $ | 13,287 | $ | — | $ | 15,563 | ||||||||||||||||||
| Insurance Solutions | ||||||||||||||||||||||||||
| Debt securities: | ||||||||||||||||||||||||||
| U.S. government and agency | 8,075 | $ | — | $ | — | $8,075 | ||||||||||||||||||||
| U.S. state, territories and municipalities | $ | 3,370 | $ | — | $ | 1,882 | $ | 5,252 | ||||||||||||||||||
| Other government and agency | — | — | 2,369 | 2,369 | ||||||||||||||||||||||
| Corporate | 119,895 | — | 106,354 | 226,249 | ||||||||||||||||||||||
| Asset and mortgage-backed securities | 253,935 | — | 119,581 | 373,516 | ||||||||||||||||||||||
| Corporate loans | — | — | 114,734 | 114,734 | ||||||||||||||||||||||
| Mortgage loans | — | 147,640 | — | 147,640 | ||||||||||||||||||||||
| Equity securities | 16,404 | — | — | 16,404 | ||||||||||||||||||||||
| Other invested assets² | 3,632 | 16,742 | 943 | 21,317 | ||||||||||||||||||||||
| Total financial assets — Insurance Solutions | $ | 405,311 | $ | 164,382 | $ | 345,863 | $ | 915,556 | ||||||||||||||||||
| Corporate loans of consolidated VIEs | — | — | 125,757 | 125,757 | ||||||||||||||||||||||
| Equity securities of consolidated VIEs | 141 | — | — | 141 | ||||||||||||||||||||||
| Total financial assets — Insurance Solutions, including consolidated VIEs | 405,452 | 164,382 | 471,620 | 1,041,454 | ||||||||||||||||||||||
| Total financial assets | $ | 407,728 | $ | 177,669 | $ | 471,620 | $ | 1,057,017 | ||||||||||||||||||
(1)The MLC US Holdings Credit Facility (as hereinafter defined) is collateralized by assets held by MLC US Holdings, including assets totaling $31.2 million as of December 31, 2024.
(2)Other invested assets primarily include structured securities and loan receivables.
Available-for-sale – Insurance Solutions
The following table represents the cost or amortized cost, gross unrealized gains, gross unrealized losses, and fair value of AFS investments by asset type:
| As of June 30, 2025 | Cost or amortized cost | Gross unrealized gains | Gross unrealized losses | Fair value(1) | ||||||||||||||||||||||
| Financial assets | ||||||||||||||||||||||||||
| Insurance Solutions | ||||||||||||||||||||||||||
| Debt securities: | ||||||||||||||||||||||||||
| U.S. government and agency | $ | 6,546 | $ | 3 | $ | (414) | $ | 6,135 | ||||||||||||||||||
| U.S. state, territories and municipalities | 4,192 | — | (793) | 3,399 | ||||||||||||||||||||||
| Corporate | 129,132 | 1,346 | (13,607) | 116,871 | ||||||||||||||||||||||
| Asset and mortgage-backed securities | 238,691 | 2,220 | (6,202) | 234,709 | ||||||||||||||||||||||
| Other invested assets | 5,347 | — | (2,184) | 3,163 | ||||||||||||||||||||||
| Total AFS — Insurance Solutions | $ | 383,908 | $ | 3,569 | $ | (23,200) | $ | 364,277 | ||||||||||||||||||
F-13
| As of December 31, 2024 | Cost or amortized cost | Gross unrealized gains | Gross unrealized losses | Fair value(1) | ||||||||||||||||||||||
| Financial assets | ||||||||||||||||||||||||||
| Insurance Solutions | ||||||||||||||||||||||||||
| Debt securities: | ||||||||||||||||||||||||||
| U.S. government and agency | $ | 8,627 | $ | 13 | $ | (565) | $ | 8,075 | ||||||||||||||||||
| U.S. state, territories and municipalities | 4,268 | — | (898) | 3,370 | ||||||||||||||||||||||
| Corporate | 133,527 | 1,196 | (14,827) | 119,895 | ||||||||||||||||||||||
| Asset and mortgage-backed securities | 258,483 | 2,089 | (6,637) | 253,935 | ||||||||||||||||||||||
| Other invested assets | 5,321 | — | (1,689) | 3,632 | ||||||||||||||||||||||
| Total AFS — Insurance Solutions | $ | 410,226 | $ | 3,298 | $ | (24,616) | $ | 388,907 | ||||||||||||||||||
(1)There is no allowance for credit losses for AFS investments as of June 30, 2025 and December 31, 2024.
The maturity distribution for AFS securities is as follows:
| June 30, 2025 | ||||||||||||||
| Cost or amortized cost | Fair value | |||||||||||||
| Due in one year or less | $ | 432 | $ | 421 | ||||||||||
| Due after one year through five years | 87,265 | 87,902 | ||||||||||||
| Due after five years through ten years | 136,581 | 132,875 | ||||||||||||
| Due after ten years | 159,630 | 143,079 | ||||||||||||
| Total AFS securities | $ | 383,908 | $ | 364,277 | ||||||||||
Actual maturities can differ from contractual maturities as borrowers may have the right to call or prepay obligations with or without call or prepayment penalties.
The following table provides information about AFS securities for which an allowance for credit losses has not been recorded aggregated by category and length of time that securities have been continuously in an unrealized loss position:
| Less than 12 months | 12 months or more | Total | |||||||||||||||||||||||||||
| As of June 30, 2025 | Fair value | Unrealized losses | Fair value | Unrealized losses | Fair value | Unrealized losses | |||||||||||||||||||||||
| Insurance Solutions | |||||||||||||||||||||||||||||
| Debt securities: | |||||||||||||||||||||||||||||
| U.S. government and agency | $ | 995 | $ | (49) | $ | 4,878 | $ | (365) | $ | 5,873 | $ | (414) | |||||||||||||||||
| U.S. state, territories and municipalities | — | — | 3,399 | (793) | 3,399 | (793) | |||||||||||||||||||||||
| Corporate | 12,790 | (503) | 45,458 | (13,104) | 58,248 | (13,607) | |||||||||||||||||||||||
| Asset and mortgage-backed securities | 45,594 | (614) | 87,423 | (5,588) | 133,017 | (6,202) | |||||||||||||||||||||||
| Other invested assets | — | — | 3,163 | (2,184) | 3,163 | (2,184) | |||||||||||||||||||||||
| Total AFS securities in a continuous loss position | $ | 59,379 | $ | (1,166) | $ | 144,321 | $ | (22,034) | $ | 203,700 | $ | (23,200) | |||||||||||||||||
F-14
| Less than 12 months | 12 months or more | Total | |||||||||||||||||||||||||||
| As of December 31, 2024 | Fair value | Unrealized losses | Fair value | Unrealized losses | Fair value | Unrealized losses | |||||||||||||||||||||||
| Insurance Solutions | |||||||||||||||||||||||||||||
| Debt securities: | |||||||||||||||||||||||||||||
| U.S. government and agency | $ | 983 | $ | (50) | $ | 4,725 | $ | (515) | $ | 5,708 | $ | (565) | |||||||||||||||||
| U.S. state, territories and municipalities | — | — | 3,370 | (898) | 3,370 | (898) | |||||||||||||||||||||||
| Corporate | 31,867 | (629) | 48,706 | (14,199) | 80,573 | (14,828) | |||||||||||||||||||||||
| Asset and mortgage-backed securities | 50,961 | (1,405) | 91,990 | (5,231) | 142,951 | (6,636) | |||||||||||||||||||||||
| Other invested assets | — | — | 3,632 | (1,689) | 3,632 | (1,689) | |||||||||||||||||||||||
| Total AFS securities in a continuous loss position | $ | 83,811 | $ | (2,084) | $ | 152,423 | $ | (22,532) | $ | 236,234 | $ | (24,616) | |||||||||||||||||
Unrealized gains and losses can be created by changing interest rates or several other factors, including changing credit spreads. The Company had gross unrealized losses on below investment grade AFS securities of $4.6 million and $4.5 million as of June 30, 2025 and December 31, 2024, respectively. The single largest unrealized loss on AFS securities was $1.4 million and $1.2 million as of June 30, 2025 and December 31, 2024, respectively. The Company had 340 and 359 positions in an unrealized loss position as of June 30, 2025 and December 31, 2024, respectively.
As of June 30, 2025 and December 31, 2024, AFS securities in an unrealized loss position for 12 months or more consisted of 206 and 216 debt securities. These debt securities primarily relate to Corporate, and U.S. state, municipal and political subdivisions securities, which have depressed values due primarily to an increase in interest rates since the purchase of these securities. Unrealized losses were not recognized in net income on these debt securities since the Company neither intends to sell the securities nor does it believe that it is more likely than not that it will be required to sell these securities before recovery of their cost or amortized cost basis. For securities with significant declines in value, individual security level analysis was performed utilizing underlying collateral default expectations, market data, and industry analyst reports.
Mortgage and corporate loans carried at amortized cost
Mortgage and corporate loans consist of the following:
| June 30, 2025 | December 31, 2024 | |||||||||||||
| Asset Management | ||||||||||||||
| Corporate loans | $ | 13,586 | $ | 13,586 | ||||||||||
| Total corporate loans | 13,586 | 13,586 | ||||||||||||
| Allowance for credit losses | (299) | (299) | ||||||||||||
| Total corporate loans, net of allowance for credit losses | $ | 13,287 | $ | 13,287 | ||||||||||
| Insurance Solutions | ||||||||||||||
| Commercial real estate mortgage loans | $ | 64,959 | $ | 60,429 | ||||||||||
| Multi-family mortgage loans | 84,921 | 93,186 | ||||||||||||
| Other invested assets - corporate loans | 17,922 | 17,820 | ||||||||||||
| Total mortgage and corporate loans | 167,802 | 171,435 | ||||||||||||
| Allowance for credit losses | (7,230) | (7,053) | ||||||||||||
| Total mortgage and other invested assets - corporate loans, net of allowance for credit losses | $ | 160,572 | $ | 164,382 | ||||||||||
F-15
The maturity distribution for commercial real estate, multi-family mortgage loans and corporate loans were as follows as of June 30, 2025:
| Asset Management | Corporate loans | |||||||
| Remainder of 2025 | $ | — | ||||||
| 2026 | — | |||||||
| 2027 | — | |||||||
| 2028 | — | |||||||
| 2029 | — | |||||||
| 2030 and thereafter | 13,586 | |||||||
| Total | $ | 13,586 | ||||||
| Insurance Solutions | Commercial real estate mortgage loans | Multi-family mortgage loans | Other invested assets - corporate loans | Total loans | ||||||||||||||||||||||
| Remainder of 2025 | $ | 10,168 | $ | 22,539 | $ | — | $ | 32,707 | ||||||||||||||||||
| 2026 | 40,616 | 42,101 | — | 82,717 | ||||||||||||||||||||||
| 2027 | 9,299 | 8,299 | — | 17,598 | ||||||||||||||||||||||
| 2028 | 4,876 | 11,982 | — | 16,858 | ||||||||||||||||||||||
| 2029 | — | — | — | — | ||||||||||||||||||||||
| 2030 and thereafter | — | — | 17,922 | 17,922 | ||||||||||||||||||||||
| Total | $ | 64,959 | $ | 84,921 | $ | 17,922 | $ | 167,802 | ||||||||||||||||||
Actual maturities could differ from contractual maturities, because borrowers may have the right to prepay (with or without prepayment penalties) and loans may be refinanced.
The carrying value by credit risk and loan type were as follows:
| Asset Management | ||||||||||||||||||||||||||
| Loans – carrying value by credit risk | June 30, 2025 | December 31, 2024 | ||||||||||||||||||||||||
| Level 1 | $13,586 | 100 | % | $13,586 | 100 | % | ||||||||||||||||||||
| Level 2 | — | — | % | — | — | % | ||||||||||||||||||||
| Level 3 | — | — | % | — | — | % | ||||||||||||||||||||
| Level 4 | — | — | % | — | — | % | ||||||||||||||||||||
| Level 5 | — | — | % | — | — | % | ||||||||||||||||||||
| Total by credit risk | $13,586 | 100 | % | $13,586 | 100 | % | ||||||||||||||||||||
| Asset Management | ||||||||||||||||||||||||||
| Loans – carrying value by loan type | June 30, 2025 | December 31, 2024 | ||||||||||||||||||||||||
| Corporate loans | $ | 13,586 | 100 | % | $ | 13,586 | 100 | % | ||||||||||||||||||
| Total by loan type | $ | 13,586 | 100 | % | $ | 13,586 | 100 | % | ||||||||||||||||||
| Insurance Solutions | ||||||||||||||||||||||||||
| Loans – carrying value by credit risk | June 30, 2025 | December 31, 2024 | ||||||||||||||||||||||||
| Level 1 | $ | 22,799 | 13.6 | % | $ | 22,731 | 13.3 | % | ||||||||||||||||||
| Level 2 | 79,264 | 47.2 | % | 83,448 | 48.6 | % | ||||||||||||||||||||
| Level 3 | 4,482 | 2.7 | % | 6,997 | 4.1 | % | ||||||||||||||||||||
| Level 4 | — | — | % | — | — | % | ||||||||||||||||||||
| Level 5 | 61,257 | 36.5 | % | 58,259 | 34.0 | % | ||||||||||||||||||||
| Total by credit risk | $ | 167,802 | 100 | % | $ | 171,435 | 100 | % | ||||||||||||||||||
F-16
| Insurance Solutions | ||||||||||||||||||||||||||
| Loans – carrying value by loan type | June 30, 2025 | December 31, 2024 | ||||||||||||||||||||||||
| Commercial real estate mortgage loans | $ | 64,959 | 38.7 | % | $ | 60,429 | 35.2 | % | ||||||||||||||||||
| Multi-family mortgage loans | 84,921 | 50.5 | % | 93,186 | 54.4 | % | ||||||||||||||||||||
| Other invested assets - corporate loans | 17,922 | 10.7 | % | 17,820 | 10.4 | % | ||||||||||||||||||||
| Total by loan type | $ | 167,802 | 100 | % | $ | 171,435 | 100 | % | ||||||||||||||||||
The following tables summarizes the activity related to the allowance for credit losses for the six months ended June 30, 2025 and 2024:
| Asset Management | Corporate loans | Total loans | ||||||||||||
| Balance, December 31, 2024 | $ | 299 | $ | 299 | ||||||||||
| Charge-offs | — | — | ||||||||||||
| Recoveries | — | — | ||||||||||||
| Provision for credit losses | — | — | ||||||||||||
| Balance, June 30, 2025 | $ | 299 | $ | 299 | ||||||||||
| Insurance Solutions | Commercial real estate mortgage loans | Multi-family mortgage loans | Corporate loans | Total loans | ||||||||||||||||||||||
| Balance, December 31, 2024 | $ | 2,615 | $ | 3,360 | $ | 1,078 | $ | 7,053 | ||||||||||||||||||
| Charge-offs | — | — | — | — | ||||||||||||||||||||||
| Recoveries | — | — | — | — | ||||||||||||||||||||||
| Provision for credit losses | 2 | 241 | (66) | 177 | ||||||||||||||||||||||
| Balance, June 30, 2025 | $ | 2,617 | $ | 3,601 | $ | 1,012 | $ | 7,230 | ||||||||||||||||||
| Asset Management | Corporate loans | Total loans | ||||||||||||
| Balance, December 31, 2023 | $ | 299 | $ | 299 | ||||||||||
| Charge-offs | — | — | ||||||||||||
| Recoveries | — | — | ||||||||||||
| Provision for credit losses | — | — | ||||||||||||
| Balance, June 30, 2024 | $ | 299 | $ | 299 | ||||||||||
| Insurance Solutions | Commercial real estate mortgage loans | Multi-family mortgage loans | Corporate loans | Total loans | ||||||||||||||||||||||
| Balance, December 31, 2023 | $ | 632 | $ | 620 | $ | 1,541 | $ | 2,793 | ||||||||||||||||||
| Charge-offs | — | — | — | — | ||||||||||||||||||||||
| Recoveries | — | — | — | — | ||||||||||||||||||||||
| Provision for credit losses | 139 | 918 | (364) | 693 | ||||||||||||||||||||||
| Balance, June 30, 2024 | $ | 771 | $ | 1,538 | $ | 1,177 | $ | 3,486 | ||||||||||||||||||
F-17
The following tables present an analysis of past-due loans:
| June 30, 2025 | ||||||||||||||||||||||||||||||||||||||
| Asset Management | Loans 30-59 days past due | Loans 60-89 days past due | Loans 90 days or more past due | Nonaccrual loans | Current loans | Total loans | ||||||||||||||||||||||||||||||||
| Corporate loans | $ | — | $ | — | $ | — | $ | — | $ | 13,586 | $ | 13,586 | ||||||||||||||||||||||||||
| Total corporate loans | $ | — | $ | — | $ | — | $ | — | $ | 13,586 | $ | 13,586 | ||||||||||||||||||||||||||
| June 30, 2025 | ||||||||||||||||||||||||||||||||||||||
| Insurance Solutions | Loans 30-59 days past due | Loans 60-89 days past due | Loans 90 days or more past due | Nonaccrual loans | Current loans | Total loans | ||||||||||||||||||||||||||||||||
| Commercial real estate mortgage loans | $ | — | $ | — | $ | — | $ | 14,246 | $ | 50,713 | $ | 64,959 | ||||||||||||||||||||||||||
| Multi-family mortgage loans | — | — | — | 8,987 | 75,934 | 84,921 | ||||||||||||||||||||||||||||||||
| Other invested assets - corporate loans | — | — | — | — | 17,922 | 17,922 | ||||||||||||||||||||||||||||||||
| Total mortgage and other invested assets - corporate loans | $ | — | $ | — | $ | — | $ | 23,233 | $ | 144,569 | $ | 167,802 | ||||||||||||||||||||||||||
| December 31, 2024 | ||||||||||||||||||||||||||||||||||||||
| Asset Management | Loans 30-59 days past due | Loans 60-89 days past due | Loans 90 days or more past due | Nonaccrual loans | Current loans | Total loans | ||||||||||||||||||||||||||||||||
| Corporate loans | $ | — | $ | — | $ | — | $ | — | $ | 13,586 | $ | 13,586 | ||||||||||||||||||||||||||
| Total corporate loans | $ | — | $ | — | $ | — | $ | — | $ | 13,586 | $ | 13,586 | ||||||||||||||||||||||||||
| December 31, 2024 | ||||||||||||||||||||||||||||||||||||||
| Insurance Solutions | Loans 30-59 days past due | Loans 60-89 days past due | Loans 90 days or more past due | Nonaccrual loans | Current loans | Total loans | ||||||||||||||||||||||||||||||||
| Commercial real estate mortgage loans | $ | — | $ | — | $ | — | $ | 10,799 | $ | 49,630 | $ | 60,429 | ||||||||||||||||||||||||||
| Multi-family mortgage loans | — | — | — | 10,969 | 82,217 | 93,186 | ||||||||||||||||||||||||||||||||
| Other invested assets - corporate loans | — | — | — | — | 17,820 | 17,820 | ||||||||||||||||||||||||||||||||
| Total mortgage and other invested assets - corporate loans | $ | — | $ | — | $ | — | $ | 21,768 | $ | 149,667 | $ | 171,435 | ||||||||||||||||||||||||||
The Company designates individually evaluated loans on nonaccrual status as collateral-dependent loans, as well as other loans that management of the Company designates as having higher risk. Collateral dependent loans are loans for which the repayment is expected to be provided substantially through the operation or sale of the collateral and the borrower is experiencing financial difficulty. These loans do not share common risk characteristics and are not included within the collectively evaluated loans for determining the allowance for credit losses.
F-18
The following represents total nonaccrual loans:
| June 30, 2025 | ||||||||||||||||||||
| Insurance Solutions | Nonaccrual loans with no allowance | Nonaccrual loans with an allowance | Total nonaccrual loans | |||||||||||||||||
| Commercial real estate mortgage loans | $ | — | $ | 14,246 | $ | 14,246 | ||||||||||||||
| Multi-family mortgage loans | — | 8,987 | 8,987 | |||||||||||||||||
| Other invested assets - corporate loans | — | — | — | |||||||||||||||||
| Total loans | $ | — | $ | 23,233 | $ | 23,233 | ||||||||||||||
| December 31, 2024 | ||||||||||||||||||||
| Insurance Solutions | Nonaccrual loans with no allowance | Nonaccrual loans with an allowance | Total nonaccrual loans | |||||||||||||||||
| Commercial real estate mortgage loans | $ | — | $ | 10,799 | $ | 10,799 | ||||||||||||||
| Multi-family mortgage loans | — | 10,969 | 10,969 | |||||||||||||||||
| Other invested assets - corporate loans | — | — | — | |||||||||||||||||
| Total loans | $ | — | $ | 21,768 | $ | 21,768 | ||||||||||||||
There were no accrued interest receivables written off for the six months ended June 30, 2025 and 2024.
F-19
The following table represents the portfolio of mortgage and corporate loans by origination year as of June 30, 2025 and December 31, 2024:
| Performance status as of June 30, 2025 | 2025 | 2024 | 2023 | 2022 | 2021 | Prior | Total | ||||||||||||||||||||||||||||||||||
| Asset Management | |||||||||||||||||||||||||||||||||||||||||
| Corporate loans | |||||||||||||||||||||||||||||||||||||||||
| Level 1 | $ | — | $ | — | $ | — | $ | — | $ | — | $ | 13,586 | $ | 13,586 | |||||||||||||||||||||||||||
| Level 2 | — | — | — | — | — | — | — | ||||||||||||||||||||||||||||||||||
| Level 3 | — | — | — | — | — | — | — | ||||||||||||||||||||||||||||||||||
| Level 4 | — | — | — | — | — | — | — | ||||||||||||||||||||||||||||||||||
| Level 5 | — | — | — | — | — | — | — | ||||||||||||||||||||||||||||||||||
| Total corporate loans | $ | — | $ | — | $ | — | $ | — | $ | — | $ | 13,586 | $ | 13,586 | |||||||||||||||||||||||||||
| Insurance Solutions | |||||||||||||||||||||||||||||||||||||||||
| Commercial real estate loans | |||||||||||||||||||||||||||||||||||||||||
| Level 1 | $ | — | $ | — | $ | 4,876 | $ | — | $ | — | $ | — | $ | 4,876 | |||||||||||||||||||||||||||
| Level 2 | — | 12,720 | 12,421 | 10,840 | 3,460 | — | 39,441 | ||||||||||||||||||||||||||||||||||
| Level 3 | — | — | — | — | 4,482 | — | 4,482 | ||||||||||||||||||||||||||||||||||
| Level 4 | — | — | — | — | — | — | — | ||||||||||||||||||||||||||||||||||
| Level 5 | — | 6,720 | 4,079 | 1,914 | — | 3,447 | 16,160 | ||||||||||||||||||||||||||||||||||
| Total commercial real estate loans | — | 19,440 | 21,376 | 12,754 | 7,942 | 3,447 | 64,959 | ||||||||||||||||||||||||||||||||||
| Multi-family loans | |||||||||||||||||||||||||||||||||||||||||
| Level 1 | — | — | — | — | — | — | — | ||||||||||||||||||||||||||||||||||
| Level 2 | 11,982 | 10,533 | 7,593 | — | 9,715 | — | 39,823 | ||||||||||||||||||||||||||||||||||
| Level 3 | — | — | — | — | — | — | — | ||||||||||||||||||||||||||||||||||
| Level 4 | — | — | — | — | — | — | — | ||||||||||||||||||||||||||||||||||
| Level 5 | — | — | — | 11,427 | 21,829 | 11,842 | 45,098 | ||||||||||||||||||||||||||||||||||
| Total multi-family loans | 11,982 | 10,533 | 7,593 | 11,427 | 31,544 | 11,842 | 84,921 | ||||||||||||||||||||||||||||||||||
| Other invested assets - corporate loans | |||||||||||||||||||||||||||||||||||||||||
| Level 1 | 102 | 48 | 596 | 74 | 17,102 | — | 17,922 | ||||||||||||||||||||||||||||||||||
| Level 2 | — | — | — | — | — | — | — | ||||||||||||||||||||||||||||||||||
| Level 3 | — | — | — | — | — | — | — | ||||||||||||||||||||||||||||||||||
| Level 4 | — | — | — | — | — | — | — | ||||||||||||||||||||||||||||||||||
| Level 5 | — | — | — | — | — | — | — | ||||||||||||||||||||||||||||||||||
| Total other invested assets - corporate loans | 102 | 48 | 596 | 74 | 17,102 | — | 17,922 | ||||||||||||||||||||||||||||||||||
| Total mortgage and corporate loans | $ | 12,084 | $ | 30,021 | $ | 29,565 | $ | 24,255 | $ | 56,588 | $ | 15,289 | $ | 167,802 | |||||||||||||||||||||||||||
F-20
| Performance status as of December 31, 2024 | 2024 | 2023 | 2022 | 2021 | 2020 | Prior | Total | ||||||||||||||||||||||||||||||||||
| Asset Management | |||||||||||||||||||||||||||||||||||||||||
| Corporate loans | |||||||||||||||||||||||||||||||||||||||||
| Level 1 | $ | — | $ | — | $ | — | $ | — | $ | 13,586 | $ | — | $ | 13,586 | |||||||||||||||||||||||||||
| Level 2 | — | — | — | — | — | — | — | ||||||||||||||||||||||||||||||||||
| Level 3 | — | — | — | — | — | — | — | ||||||||||||||||||||||||||||||||||
| Level 4 | — | — | — | — | — | — | — | ||||||||||||||||||||||||||||||||||
| Level 5 | — | — | — | — | — | — | — | ||||||||||||||||||||||||||||||||||
| Total corporate loans | $ | — | $ | — | $ | — | $ | — | $ | 13,586 | $ | — | $ | 13,586 | |||||||||||||||||||||||||||
| Insurance Solutions | |||||||||||||||||||||||||||||||||||||||||
| Commercial real estate loans | |||||||||||||||||||||||||||||||||||||||||
| Level 1 | $ | — | $ | 4,910 | $ | — | $ | — | $ | — | $ | — | $ | 4,910 | |||||||||||||||||||||||||||
| Level 2 | 4,000 | 15,416 | 11,800 | 3,661 | — | — | 34,877 | ||||||||||||||||||||||||||||||||||
| Level 3 | — | — | — | 4,482 | — | — | 4,482 | ||||||||||||||||||||||||||||||||||
| Level 4 | — | — | — | — | — | — | — | ||||||||||||||||||||||||||||||||||
| Level 5 | 6,720 | 4,079 | 1,914 | — | — | 3,447 | 16,160 | ||||||||||||||||||||||||||||||||||
| Total commercial real estate loans | 10,720 | 24,405 | 13,714 | 8,143 | — | 3,447 | 60,429 | ||||||||||||||||||||||||||||||||||
| Multi-family loans | |||||||||||||||||||||||||||||||||||||||||
| Level 1 | — | — | — | — | — | — | — | ||||||||||||||||||||||||||||||||||
| Level 2 | 33,389 | 5,469 | — | 9,715 | — | — | 48,573 | ||||||||||||||||||||||||||||||||||
| Level 3 | — | — | 2,515 | — | — | — | 2,515 | ||||||||||||||||||||||||||||||||||
| Level 4 | — | — | — | — | — | — | — | ||||||||||||||||||||||||||||||||||
| Level 5 | — | — | 8,714 | 21,782 | 11,602 | — | 42,098 | ||||||||||||||||||||||||||||||||||
| Total multi-family loans | 33,389 | 5,469 | 11,229 | 31,497 | 11,602 | — | 93,186 | ||||||||||||||||||||||||||||||||||
| Other invested assets - corporate loans | |||||||||||||||||||||||||||||||||||||||||
| Level 1 | 48 | 596 | 74 | 17,102 | — | — | 17,820 | ||||||||||||||||||||||||||||||||||
| Level 2 | — | — | — | — | — | — | — | ||||||||||||||||||||||||||||||||||
| Level 3 | — | — | — | — | — | — | — | ||||||||||||||||||||||||||||||||||
| Level 4 | — | — | — | — | — | — | — | ||||||||||||||||||||||||||||||||||
| Level 5 | — | — | — | — | — | — | — | ||||||||||||||||||||||||||||||||||
| Total other invested assets - corporate loans | 48 | 596 | 74 | 17,102 | — | — | 17,820 | ||||||||||||||||||||||||||||||||||
| Total mortgage and corporate loans | $ | 44,157 | $ | 30,470 | $ | 25,017 | $ | 56,742 | $ | 11,602 | $ | 3,447 | $ | 171,435 | |||||||||||||||||||||||||||
The following represents the carrying value of collateral-dependent loans of the Company as of June 30, 2025 and December 31, 2024:
| June 30, 2025 | December 31, 2024 | |||||||||||||
| Commercial real estate mortgage loans | $ | 10,799 | $ | 10,799 | ||||||||||
The Company maintains a separate reserve for credit losses on off-balance sheet credit exposures, including unfunded loan commitments, which is included in Accrued expenses and other liabilities on the Condensed Consolidated Statements of Financial Position. The reserve for credit losses on off-balance sheet credit exposures is adjusted as a provision for credit losses in the income statement. The estimate includes consideration of the likelihood that funding will occur and an estimate of expected credit losses on commitments expected to be funded over its estimated life, utilizing the same models and approaches for the Company's other loan portfolio segments described above, as these unfunded commitments share similar risk characteristics as its loan portfolio segments. The unfunded off-balance sheet credit line commitments for Corporate Loans accounted for as held for investments (“HFI”) was $1.4 million for Asset Management and $2.7 million for Insurance Solutions as of June 30, 2025 (December 31, 2024: $1.4 million and $4.7 million, for Asset Management and Insurance Solutions, respectively)
The liability for credit losses on off-balance sheet credit exposures for these loans included in Accrued expenses and other liabilities was less than $0.1 million for both Asset Management and Insurance Solutions as of June 30, 2025 and
The liability for credit losses on off-balance sheet credit exposures for these loans included in Accrued expenses and other liabilities was less than $0.1 million for both Asset Management and Insurance Solutions as of June 30, 2025 and
F-21
December 31, 2024, respectively. Refer to Note 23. Commitments and contingencies for additional information of the Company’s investment commitments.
Note 6. Derivatives
The Company uses derivative instruments to manage interest rate risk. See Note 8. Fair value measurements for information about the fair value hierarchy for derivatives.
The following table presents the notional amount and fair value of freestanding derivative instruments:
| June 30, 2025 | December 31, 2024 | |||||||||||||||||||||||||||||||||||||
| Notional amount | Assets | Liabilities | Notional amount | Assets | Liabilities | |||||||||||||||||||||||||||||||||
| Derivatives designated as hedges | ||||||||||||||||||||||||||||||||||||||
| Interest rate swaps | $ | 187,000 | $ | — | $ | 457 | $ | 187,000 | $ | — | $ | 5,192 | ||||||||||||||||||||||||||
Derivatives designated as hedges
Cash flow hedges
The Company uses interest rate swaps to convert floating-rate interest receipts to fixed-rate interest receipts to reduce exposure to interest rate changes. The interest rate swaps will expire by October 2036. During the six months ended June 30, 2025, the Company reported losses of $0.5 million in Other Comprehensive Income (“OCI”) associated with these hedges. There were no amounts deemed ineffective during the six months ended June 30, 2025. As of June 30, 2025, $0.4 million is expected to be reclassified into expense as part as earnings within the next 12 months.
Embedded derivatives
The Company has embedded derivatives which are required to be separated from their host contracts and reported as derivatives. Host contracts include reinsurance agreements structured on a modco or funds withheld basis. The fair value of the embedded derivative liability is $32.8 million and $34.8 million as of June 30, 2025 and December 31, 2024, respectively.
Credit risk
The Company may be exposed to credit-related losses in the event of counterparty nonperformance on derivative financial instruments. Generally, the current credit exposure of the Company’s derivative contracts is the fair value at the reporting date less any collateral received from the counterparty.
The Company manages credit risk related to derivatives by entering into transactions with creditworthy counterparties. Where possible, the Company maintains collateral arrangements and uses master netting agreements that provide for a single net payment from one counterparty to another at each due date and upon termination. The Company has also established counterparty exposure limits, where possible, in order to evaluate if there is sufficient collateral to support the net exposure. Collateral arrangements typically require the posting of collateral in connection with its derivative instruments. Collateral agreements often contain posting thresholds, some of which may vary depending on the posting party’s financial strength ratings.
There is no difference between the current presentation of the fair value of the interest rate swaps and the presentation of fair value of the interest rate swaps after the application of any right of offset, as of June 30, 2025.
Note 7. Variable interest entities
Consolidated VIEs include CLOs managed by the Company. The assets of consolidated VIEs are not available to creditors of the Company, and the investors in these consolidated VIEs have no recourse against the assets of the Company.
F-22
Revenues of consolidated VIEs - Insurance Solutions
The following summarizes the Condensed Consolidated Statements of Operations activity of the consolidated VIEs:
| For the three months ended June 30, | 2025 | 2024 | ||||||||||||
| Investment income | $ | 4,075 | $ | 4,765 | ||||||||||
| Investment expense | (239) | (243) | ||||||||||||
| Net investment income | 3,836 | 4,522 | ||||||||||||
| Unrealized gain/(loss) on investments | (464) | (974) | ||||||||||||
| Realized gain/(loss) on investments | 177 | 416 | ||||||||||||
| Net gains (losses) from investment activities | (287) | (558) | ||||||||||||
| Net revenues of consolidated variable interest entities | $ | 3,549 | $ | 3,964 | ||||||||||
| For the six months ended June 30, | 2025 | 2024 | ||||||||||||
| Investment income | $ | 8,109 | $ | 9,413 | ||||||||||
| Investment expense | (375) | (342) | ||||||||||||
| Net investment income | 7,734 | 9,071 | ||||||||||||
| Unrealized gain/(loss) on investments | (789) | (1,027) | ||||||||||||
| Realized gain/(loss) on investments | 237 | 599 | ||||||||||||
| Net gains (losses) from investment activities | (552) | (428) | ||||||||||||
| Net revenues of consolidated variable interest entities | $ | 7,182 | $ | 8,643 | ||||||||||
Unconsolidated VIEs
The Company has variable interests in VIEs which it was determined not to be the primary beneficiary. The Company’s variable interests include equity interests, loans, and beneficial interests in CLOs and other entities, which are recorded in Investments in the Condensed Consolidated Statements of Financial Position. The following table presents the maximum exposure to losses relating to these VIEs for which the Company has a variable interest, but that it is not the primary beneficiary. The Company has exposure beyond the carrying value of its variable interests due to unfunded commitments on loans.
| June 30, 2025 | December 31, 2024 | |||||||||||||||||||||||||
| Carrying amount | Maximum exposure to loss | Carrying amount | Maximum Exposure to Loss | |||||||||||||||||||||||
| Asset Management | ||||||||||||||||||||||||||
| Variable interests | $ | — | $ | — | $ | 29 | $ | 29 | ||||||||||||||||||
| Variable interests in related parties | 26,372 | 27,785 | 21,004 | 22,417 | ||||||||||||||||||||||
| Total Asset Management | $ | 26,372 | $ | 27,785 | $ | 21,033 | $ | 22,446 | ||||||||||||||||||
| Insurance Solutions | ||||||||||||||||||||||||||
| Variable interests | $ | 17,223 | $ | 17,223 | $ | 17,689 | $ | 17,689 | ||||||||||||||||||
| Variable interests in related parties | 16,888 | 16,888 | 19,333 | 19,333 | ||||||||||||||||||||||
| Total Insurance Solutions | $ | 34,111 | $ | 34,111 | $ | 37,022 | $ | 37,022 | ||||||||||||||||||
| Total | $ | 60,483 | $ | 61,896 | $ | 58,055 | $ | 59,468 | ||||||||||||||||||
Note 8. Fair value measurements
The following tables summarize the valuation of assets and liabilities measured at fair value by fair value hierarchy. Investments classified as Equity Method for which the FVO has not been elected have been excluded from the table below.
F-23
| Fair Value Measurements | ||||||||||||||||||||||||||||||||
| June 30, 2025 | Level 1 | Level 2 | Level 3 | NAV | Total | |||||||||||||||||||||||||||
| Financial assets | ||||||||||||||||||||||||||||||||
| Asset Management | ||||||||||||||||||||||||||||||||
| Equity securities | $ | 1,042 | $ | — | $ | 5,849 | $ | — | $ | 6,891 | ||||||||||||||||||||||
| Total financial assets — Asset Management | $ | 1,042 | $ | — | $ | 5,849 | $ | — | $ | 6,891 | ||||||||||||||||||||||
| Insurance Solutions | ||||||||||||||||||||||||||||||||
| Debt securities: | ||||||||||||||||||||||||||||||||
| U.S. government and agency | $ | — | $ | 6,135 | $ | — | $ | — | $ | 6,135 | ||||||||||||||||||||||
| U.S. state, territories and municipalities | $ | — | $ | 5,334 | $ | — | $ | — | $ | 5,334 | ||||||||||||||||||||||
| Other government and agency | — | 2,363 | — | — | 2,363 | |||||||||||||||||||||||||||
| Corporate | — | 216,281 | 5,067 | — | 221,347 | |||||||||||||||||||||||||||
| Asset and mortgage-backed securities | — | 340,568 | 15,113 | — | 355,681 | |||||||||||||||||||||||||||
| Corporate loans | — | 27,975 | 134,741 | — | 162,716 | |||||||||||||||||||||||||||
| Equity securities | 237 | 2,612 | 3,000 | 1,927 | 7,776 | |||||||||||||||||||||||||||
| Other invested assets | — | 888 | 3,163 | 302 | 4,353 | |||||||||||||||||||||||||||
| Total financial assets — Insurance Solutions | $ | 237 | $ | 602,155 | $ | 161,083 | $ | 2,229 | $ | 765,704 | ||||||||||||||||||||||
| Corporate loans of consolidated VIEs | — | — | 128,806 | — | 128,806 | |||||||||||||||||||||||||||
| Equity of consolidated VIEs | — | — | 247 | — | 247 | |||||||||||||||||||||||||||
| Total financial assets including consolidated VIEs | $ | 237 | $ | 602,155 | $ | 290,136 | $ | 2,229 | $ | 894,757 | ||||||||||||||||||||||
| Total financial assets | $ | 1,279 | $ | 602,155 | $ | 295,985 | $ | 2,229 | $ | 901,648 | ||||||||||||||||||||||
| Financial liabilities | ||||||||||||||||||||||||||||||||
| Asset Management | ||||||||||||||||||||||||||||||||
| Debt obligations | — | — | 132 | — | 132 | |||||||||||||||||||||||||||
| Total financial liabilities — Asset Management | $ | — | $ | — | $ | 132 | $ | — | $ | 132 | ||||||||||||||||||||||
| Insurance Solutions | ||||||||||||||||||||||||||||||||
| Ceded reinsurance - embedded derivative | — | 32,789 | — | — | 32,789 | |||||||||||||||||||||||||||
| Interest rate swaps | — | 457 | — | — | 457 | |||||||||||||||||||||||||||
| Total financial liabilities — Insurance Solutions | $ | — | $ | 33,245 | $ | — | $ | — | $ | 33,245 | ||||||||||||||||||||||
| Total financial liabilities | $ | — | $ | 33,245 | $ | 132 | $ | — | $ | 33,377 | ||||||||||||||||||||||
| Fair Value Measurements | ||||||||||||||||||||||||||||||||
| December 31, 2024 | Level 1 | Level 2 | Level 3 | NAV | Total | |||||||||||||||||||||||||||
| Financial assets | ||||||||||||||||||||||||||||||||
| Asset Management | ||||||||||||||||||||||||||||||||
| Equity securities | $ | 1,777 | $ | — | $ | 499 | $ | — | $ | 2,276 | ||||||||||||||||||||||
| Total financial assets — Asset Management | $ | 1,777 | $ | — | $ | 499 | $ | — | $ | 2,276 | ||||||||||||||||||||||
| Insurance Solutions | ||||||||||||||||||||||||||||||||
| Debt securities: | ||||||||||||||||||||||||||||||||
| U.S. government and agency | $ | — | $ | 8,075 | $ | — | $ | — | $ | 8,075 | ||||||||||||||||||||||
| U.S. state, territories and municipalities | — | 5,252 | — | — | 5,252 | |||||||||||||||||||||||||||
| Other government and agency | — | 2,369 | — | — | 2,369 | |||||||||||||||||||||||||||
| Corporate | — | 226,249 | — | — | 226,249 | |||||||||||||||||||||||||||
| Asset and mortgage-backed securities | — | 364,875 | 8,641 | — | 373,516 | |||||||||||||||||||||||||||
| Corporate loans | — | — | 114,734 | — | 114,734 | |||||||||||||||||||||||||||
| Equity securities | 310 | 11,134 | 2,918 | 2,042 | 16,404 | |||||||||||||||||||||||||||
| Other invested assets | — | — | 4,575 | — | 4,575 | |||||||||||||||||||||||||||
| Total financial assets — Insurance Solutions | $ | 310 | $ | 617,954 | $ | 130,868 | $ | 2,042 | $ | 751,174 | ||||||||||||||||||||||
| Corporate loans of consolidated VIEs | — | — | 125,757 | — | 125,757 | |||||||||||||||||||||||||||
| Equity securities of consolidated VIEs | — | — | 141 | — | 141 | |||||||||||||||||||||||||||
| Total financial assets including consolidated VIEs | $ | 310 | $ | 617,954 | $ | 256,766 | $ | 2,042 | $ | 877,072 | ||||||||||||||||||||||
| Total financial assets | $ | 2,087 | $ | 617,954 | $ | 257,265 | $ | 2,042 | $ | 879,348 | ||||||||||||||||||||||
F-24
| Fair Value Measurements | ||||||||||||||||||||||||||||||||
| December 31, 2024 | Level 1 | Level 2 | Level 3 | NAV | Total | |||||||||||||||||||||||||||
| Financial liabilities | ||||||||||||||||||||||||||||||||
| Asset Management | ||||||||||||||||||||||||||||||||
| Debt obligations | $ | — | $ | — | $ | 1,471 | $ | — | $ | 1,471 | ||||||||||||||||||||||
| Total financial liabilities — Asset Management | $ | — | $ | — | $ | 1,471 | $ | — | $ | 1,471 | ||||||||||||||||||||||
| Insurance Solutions | ||||||||||||||||||||||||||||||||
| Ceded reinsurance - embedded derivative | $ | — | $ | 34,770 | $ | — | $ | — | $ | 34,770 | ||||||||||||||||||||||
| Interest rate swaps | — | 5,192 | — | — | 5,192 | |||||||||||||||||||||||||||
| Total financial liabilities — Insurance Solutions | $ | — | $ | 39,962 | $ | — | $ | — | $ | 39,962 | ||||||||||||||||||||||
| Total financial liabilities | $ | — | $ | 39,962 | $ | 1,471 | $ | — | $ | 41,433 | ||||||||||||||||||||||
The availability of observable inputs can vary depending on the financial asset and is affected by a wide variety of factors, including, for example, the type of instrument, whether the instrument has recently been issued, whether the instrument is traded on an active exchange or in the secondary market, and current market conditions. To the extent that valuation is based on models or inputs that are less observable or unobservable in the market, the determination of fair value requires additional judgment. Accordingly, the degree of judgment exercised by the Company in determining fair value is greatest for instruments categorized as Level 3. The variability and availability of the observable inputs affected by the factors described above may cause transfers between Levels 1, 2, and 3, as discussed further below.
Transfers between level 1 and level 2
The Company records transfers of assets between Level 1 and Level 2 at their fair values at the end of each reporting period. Assets are transferred out of Level 1 when they are no longer transacted with sufficient frequency and volume in an active market. Conversely, assets are transferred from Level 2 to Level 1 when transaction volume and frequency are indicative of an active market. During the three and six months ended June 30, 2025 and June 30, 2024, there were no assets transferred between Level 1 and Level 2.
Transfers between level 1 or 2 and level 3
The Company records transfers of assets between Level 1 or 2 and Level 3 at the end of each reporting period. Assets are transferred into Level 3 when there is a lack of observable valuation inputs.
Conversely, assets are transferred out of Level 3 when valuation inputs become observable. Whether the assets are transferred into Level 1 or 2 will depend on whether the prices are unadjusted and quoted in an active market.
F-25
The following tables summarize changes in the Company’s investment portfolio measured and reporting at fair value for which Level 3 inputs were used in determining fair value:
| Net Change in Unrealized Appreciation (Depreciation) | |||||||||||||||||||||||||||||||||||
| Three months ended June 30, 2025 | Beginning Balance | Purchases | Sales and Repayments | Net Realized Gain (Loss) | Included in Income | Included in OCI | Transfer in ¹ | Transfer out ¹ | Ending Balance | Change in unrealized gains (losses) included in Income on Level 3 assets and liabilities still held | Change in Unrealized Gains (Losses) included in OCI on Level 3 Assets and Liabilities Still Held | ||||||||||||||||||||||||
| Financial assets | |||||||||||||||||||||||||||||||||||
| Asset Management | |||||||||||||||||||||||||||||||||||
| Equity securities | $ | 5,372 | $ | — | $ | (19) | $ | — | $ | 496 | $ | — | $ | — | $ | — | $ | 5,849 | $ | 460 | $ | — | |||||||||||||
| Total assets — Asset Management | 5,372 | — | (19) | — | 496 | — | — | — | 5,849 | 460 | — | ||||||||||||||||||||||||
| Insurance Solutions | |||||||||||||||||||||||||||||||||||
| Debt securities: | |||||||||||||||||||||||||||||||||||
| Corporate | 5,039 | — | — | — | — | 28 | — | — | 5,067 | — | 28 | ||||||||||||||||||||||||
| Asset and mortgage-backed securities | 15,323 | — | (302) | — | — | 92 | — | — | 15,113 | — | 92 | ||||||||||||||||||||||||
| Corporate loans | 117,525 | 14,291 | (3,729) | — | 653 | 1 | 6,000 | — | 134,741 | 647 | — | ||||||||||||||||||||||||
| Equity securities | 2,931 | — | — | — | 69 | — | — | — | 3,000 | 69 | — | ||||||||||||||||||||||||
| Other invested assets | 4,006 | — | (4,433) | (745) | 4,633 | (299) | — | — | 3,162 | 475 | (299) | ||||||||||||||||||||||||
| Total assets — Insurance Solutions | 144,824 | 14,291 | (8,464) | (745) | 5,355 | (178) | 6,000 | — | 161,083 | 1,191 | (179) | ||||||||||||||||||||||||
| Equity securities of consolidated VIEs | 141 | — | — | — | 106 | — | — | — | 247 | 106 | — | ||||||||||||||||||||||||
| Corporate loans of consolidated VIEs | 132,252 | 16,080 | (19,516) | 177 | (187) | — | — | — | 128,806 | (569) | — | ||||||||||||||||||||||||
| Total financial assets including consolidated VIEs - Insurance Solutions | 277,217 | 30,371 | (27,980) | (568) | 5,274 | (178) | 6,000 | — | 290,136 | 728 | (179) | ||||||||||||||||||||||||
| Total financial assets | $ | 282,589 | $ | 30,371 | $ | (27,999) | $ | (568) | $ | 5,770 | $ | (178) | $ | 6,000 | $ | — | $ | 295,985 | $ | 1,188 | $ | (179) | |||||||||||||
| Financial liabilities | |||||||||||||||||||||||||||||||||||
| Asset Management | |||||||||||||||||||||||||||||||||||
| Debt obligations | $ | 503 | $ | — | $ | — | $ | — | $ | (371) | $ | — | $ | — | $ | — | $ | 132 | $ | 371 | $ | — | |||||||||||||
| Total financial liabilities — Asset Management | $ | 503 | $ | — | $ | — | $ | — | $ | (371) | $ | — | $ | — | $ | — | $ | 132 | $ | 371 | $ | — | |||||||||||||
F-26
| Net Change in Unrealized Appreciation (Depreciation) | |||||||||||||||||||||||||||||||||||
| Six months ended June 30, 2025 | Beginning Balance | Purchases | Sales and Repayments | Net Realized Gain (Loss) | Included in Income | Included in OCI | Transfer in ¹ | Transfer out ¹ | Ending Balance | Change in Unrealized Gains (Losses) included in Income on Level 3 Assets and Liabilities Still Held | Change in Unrealized Gains (Losses) included in OCI on Level 3 Assets and Liabilities Still Held | ||||||||||||||||||||||||
| Financial assets | |||||||||||||||||||||||||||||||||||
| Asset Management | |||||||||||||||||||||||||||||||||||
| Equity securities | $ | 499 | $ | 5,000 | $ | (19) | $ | — | $ | 369 | $ | — | $ | — | $ | — | $ | 5,849 | $ | 344 | $ | — | |||||||||||||
| Total assets — Asset Management | 499 | 5,000 | (19) | — | 369 | — | — | — | 5,849 | 344 | — | ||||||||||||||||||||||||
| Insurance Solutions | |||||||||||||||||||||||||||||||||||
| Debt securities: | |||||||||||||||||||||||||||||||||||
| Corporate | — | — | — | — | — | 67 | 5,000 | — | 5,067 | — | 67 | ||||||||||||||||||||||||
| Asset and mortgage-backed securities | 8,641 | — | (530) | — | (1) | 150 | 6,853 | — | 15,113 | — | 150 | ||||||||||||||||||||||||
| Corporate loans | 114,734 | 17,142 | (4,574) | — | 1,439 | — | 6,000 | — | 134,741 | 1,429 | — | ||||||||||||||||||||||||
| Equity securities | 2,918 | — | — | — | 82 | — | — | — | 3,000 | 82 | — | ||||||||||||||||||||||||
| Other invested assets | 4,575 | — | (4,433) | (745) | 4,260 | (495) | — | — | 3,162 | 84 | (495) | ||||||||||||||||||||||||
| Total assets — Insurance Solutions | 130,868 | 17,142 | (9,537) | (745) | 5,780 | (278) | 17,853 | — | 161,083 | 1,595 | (278) | ||||||||||||||||||||||||
| Equity securities of consolidated VIEs | 141 | — | — | — | 106 | — | — | — | 247 | 106 | — | ||||||||||||||||||||||||
| Corporate loans of consolidated VIEs | 125,757 | 33,952 | (30,933) | 237 | (207) | — | — | — | 128,806 | (895) | — | ||||||||||||||||||||||||
| Total financial assets including consolidated VIEs - Insurance Solutions | 256,766 | 51,094 | (40,470) | (508) | 5,679 | (278) | 17,853 | — | 290,136 | 806 | (278) | ||||||||||||||||||||||||
| Total financial assets | $ | 257,265 | $ | 56,094 | $ | (40,489) | $ | (508) | $ | 6,048 | $ | (278) | $ | 17,853 | $ | — | $ | 295,985 | $ | 1,150 | $ | (278) | |||||||||||||
| Financial liabilities | |||||||||||||||||||||||||||||||||||
| Asset Management | |||||||||||||||||||||||||||||||||||
| Debt obligations | $ | 1,471 | $ | — | $ | — | $ | — | $ | (1,339) | $ | — | $ | — | $ | — | $ | 132 | $ | 1,339 | $ | — | |||||||||||||
| Total financial liabilities — Asset Management | $ | 1,471 | $ | — | $ | — | $ | — | $ | (1,339) | $ | — | $ | — | $ | — | $ | 132 | $ | 1,339 | $ | — | |||||||||||||
(1)Transfers into Level 3 are due to decrease in the quantity and reliability of broker quotes obtained. Transfers out of Level 3 are due to an increase in the quantity and reliability of broker quotes obtained. Transfers are assumed to have occurred at the end of the period.
F-27
| Net Change in Unrealized Appreciation (Depreciation) | |||||||||||||||||||||||||||||||||||
| Three months ended June 30, 2024 | Beginning Balance | Purchases | Sales and Repayments | Net Realized Gain (Loss) | Included in Income | Included in OCI | Transfer in ¹ | Transfer out ¹ | Ending Balance | Change in Unrealized Gains (Losses) included in Income on Level 3 Assets and Liabilities Still Held | Change in Unrealized Gains (Losses) included in OCI on Level 3 Assets and Liabilities Still Held | ||||||||||||||||||||||||
| Financial assets | |||||||||||||||||||||||||||||||||||
| Asset Management | |||||||||||||||||||||||||||||||||||
| Equity securities | $ | 1,615 | $ | — | $ | — | $ | — | $ | (753) | $ | — | $ | — | $ | — | $ | 862 | $ | (744) | $ | — | |||||||||||||
| Total assets — Asset Management | 1,615 | — | — | — | (753) | — | — | — | 862 | (744) | — | ||||||||||||||||||||||||
| Insurance Solutions | |||||||||||||||||||||||||||||||||||
| Debt securities: | |||||||||||||||||||||||||||||||||||
| Corporate | — | — | — | — | — | — | — | — | — | — | — | ||||||||||||||||||||||||
| Asset and mortgage-backed securities | 6,604 | — | (365) | — | (1) | 26 | — | — | 6,264 | — | 26 | ||||||||||||||||||||||||
| Corporate loans | 128,269 | 881 | (10,259) | (4) | (83) | — | 2,000 | — | 120,804 | (93) | — | ||||||||||||||||||||||||
| Equity securities | 2,806 | — | — | — | 30 | — | — | — | 2,836 | 30 | — | ||||||||||||||||||||||||
| Other invested assets | 10,402 | — | — | — | 14 | (490) | — | — | 9,926 | (12) | (490) | ||||||||||||||||||||||||
| Total assets — Insurance Solutions | 148,081 | 881 | (10,624) | (4) | (40) | (464) | 2,000 | — | 139,830 | (75) | (464) | ||||||||||||||||||||||||
| Equity securities of consolidated VIEs | 131 | 131 | — | — | 25 | — | — | — | 287 | 25 | — | ||||||||||||||||||||||||
| Corporate loans of consolidated VIEs | 137,949 | 58,449 | (48,366) | 525 | (68) | — | — | — | 148,489 | (1,002) | — | ||||||||||||||||||||||||
| Total financial assets including consolidated VIEs - Insurance Solutions | 286,161 | 59,461 | (58,990) | 521 | (83) | (464) | 2,000 | — | 288,606 | (1,052) | (464) | ||||||||||||||||||||||||
| Total financial assets | $ | 287,776 | $ | 59,461 | $ | (58,990) | $ | 521 | $ | (835) | $ | (464) | $ | 2,000 | $ | — | $ | 289,469 | $ | (1,796) | $ | (464) | |||||||||||||
| Financial liabilities | |||||||||||||||||||||||||||||||||||
| Asset Management | |||||||||||||||||||||||||||||||||||
| Debt obligations | $ | 1,322 | $ | — | $ | — | $ | — | $ | 114 | $ | — | $ | — | $ | — | $ | 1,436 | $ | (114) | $ | — | |||||||||||||
| Total liabilities — Asset Management | 1,322 | — | — | — | 114 | — | — | — | 1,436 | (114) | — | ||||||||||||||||||||||||
| Total financial liabilities — Asset Management | $ | 1,322 | $ | — | $ | — | $ | — | $ | 114 | $ | — | $ | — | $ | — | $ | 1,436 | $ | (114) | $ | — | |||||||||||||
F-28
| Net Change in Unrealized Appreciation (Depreciation) | |||||||||||||||||||||||||||||||||||
| Six months ended June 30, 2024 | Beginning Balance | Purchases | Sales and Repayments | Net Realized Gain (Loss) | Included in Income | Included in OCI | Transfer in ¹ | Transfer out ¹ | Ending Balance | Change in Unrealized Gains (Losses) included in Income on Level 3 Assets and Liabilities Still Held | Change in Unrealized Gains (Losses) included in OCI on Level 3 Assets and Liabilities Still Held | ||||||||||||||||||||||||
| Financial assets | |||||||||||||||||||||||||||||||||||
| Asset Management | |||||||||||||||||||||||||||||||||||
| Equity securities | $ | 1,670 | $ | — | $ | — | $ | — | $ | (808) | $ | — | $ | — | $ | — | $ | 862 | $ | (782) | $ | — | |||||||||||||
| Total assets — Asset Management | 1,670 | — | — | — | (808) | — | — | — | 862 | (782) | — | ||||||||||||||||||||||||
| Insurance Solutions | |||||||||||||||||||||||||||||||||||
| Debt securities: | |||||||||||||||||||||||||||||||||||
| Corporate | — | — | — | — | — | — | — | — | — | — | — | ||||||||||||||||||||||||
| Asset and mortgage-backed securities | 2,240 | — | (382) | — | (1) | (28) | 4,434 | — | 6,263 | — | (28) | ||||||||||||||||||||||||
| Corporate loans | 104,588 | 8,898 | (17,229) | (1) | (446) | — | 24,997 | — | 120,807 | (466) | — | ||||||||||||||||||||||||
| Equity securities | 3,107 | — | (250) | — | (21) | — | — | — | 2,836 | (21) | — | ||||||||||||||||||||||||
| Other invested assets | 10,605 | — | — | — | (2) | (676) | — | — | 9,927 | (56) | (676) | ||||||||||||||||||||||||
| Total assets — Insurance Solutions | 120,540 | 8,898 | (17,861) | (1) | (470) | (704) | 29,431 | — | 139,833 | (543) | (704) | ||||||||||||||||||||||||
| Equity securities of consolidated VIEs | — | 131 | — | — | 25 | — | — | — | 156 | 25 | — | ||||||||||||||||||||||||
| Corporate loans of consolidated VIEs | 124,637 | 58,449 | (48,366) | 525 | (68) | — | — | — | 135,177 | (1,055) | — | ||||||||||||||||||||||||
| Total financial assets including consolidated VIEs - Insurance Solutions | 245,177 | 67,478 | (66,227) | 524 | (513) | (704) | 29,431 | — | 275,166 | (1,573) | (704) | ||||||||||||||||||||||||
| Total financial assets | $ | 246,847 | $ | 67,478 | $ | (66,227) | $ | 524 | $ | (1,321) | $ | (704) | $ | 29,431 | $ | — | $ | 276,028 | $ | (2,355) | $ | (704) | |||||||||||||
| Financial liabilities | |||||||||||||||||||||||||||||||||||
| Asset Management | |||||||||||||||||||||||||||||||||||
| Debt obligations | $ | 1,175 | $ | — | $ | — | $ | — | $ | 261 | $ | — | $ | — | $ | — | $ | 1,436 | $ | (261) | $ | — | |||||||||||||
| Total liabilities — Asset Management | 1,175 | — | — | — | 261 | — | — | — | 1,436 | (261) | — | ||||||||||||||||||||||||
| Total financial liabilities — Asset Management | $ | 1,175 | $ | — | $ | — | $ | — | $ | 261 | $ | — | $ | — | $ | — | $ | 1,436 | $ | (261) | $ | — | |||||||||||||
(1)Transfers into Level 3 are due to a decrease in the quantity and reliability of broker quotes obtained. Transfers out of Level 3 are due to an increase in the quantity and reliability of broker quotes obtained. Transfers are assumed to have occurred at the end of the period.
The valuation techniques and significant unobservable inputs used in Level 3 valuations were as follows:
| Quantitative Information about Level 3 Fair Value Measurements | ||||||||||||||||||||||||||
| June 30, 2025 | Fair value | Valuation technique/ methodology | Unobservable input | Range (weighted average) | ||||||||||||||||||||||
| Financial assets | ||||||||||||||||||||||||||
| Asset management | ||||||||||||||||||||||||||
| Equity securities | 451 | Recent transaction | Transaction price | NA | ||||||||||||||||||||||
| Equity securities | 5,398 | Enterprise value | Multiple | 9.50x - 11.50x (10.5x) | ||||||||||||||||||||||
| Total — Asset Management | $ | 5,849 | ||||||||||||||||||||||||
F-29
| Quantitative Information about Level 3 Fair Value Measurements | ||||||||||||||||||||||||||
| June 30, 2025 | Fair value | Valuation technique/ methodology | Unobservable input | Range (weighted average) | ||||||||||||||||||||||
| Insurance | ||||||||||||||||||||||||||
| Debt securities ¹: | ||||||||||||||||||||||||||
| Asset and mortgage-backed securities | $ | 33 | Recent transaction | Transaction price | NA | |||||||||||||||||||||
| Asset and mortgage-backed securities | 15,080 | Discounted cash flow | Discount rate | 6.4% -9.0% (7.8%) | ||||||||||||||||||||||
| Corporate | 5,067 | Discounted cash flow | Discount rate | 7.1% - 8.1% (7.6%) | ||||||||||||||||||||||
| Corporate loans | 134,713 | Discounted cash flow | Discount rate | -0.3% - 20.4% (8.8%) | ||||||||||||||||||||||
| Corporate loans | 28 | Enterprise value | Multiple | 0.195x -0.195x (0.195x) | ||||||||||||||||||||||
| Equity securities | 3,000 | Discounted cash flow | Discount rate | 4.9% - 4.9% (4.9%) | ||||||||||||||||||||||
| Other invested assets | 3,162 | Discounted cash flow | Discount rate | 8.06% - 18.6% (9.6%) | ||||||||||||||||||||||
| Total — Insurance Solutions | $ | 161,083 | ||||||||||||||||||||||||
| Equity securities of consolidated VIEs | 247 | Discounted cash flow | Discount rate | 14.4% - 14.4% (14.4%) | ||||||||||||||||||||||
| Corporate loans of consolidated VIEs | 33,618 | Recent transaction | Transaction price | NA | ||||||||||||||||||||||
| Corporate loans of consolidated VIEs | 95,188 | Discounted cash flow | Discount rate | 6.8% - 19.7% (10.1%) | ||||||||||||||||||||||
| Total assets of consolidated VIEs - Insurance Solutions | 129,053 | |||||||||||||||||||||||||
| Total financial assets including consolidated VIEs - Insurance Solutions | $ | 290,136 | ||||||||||||||||||||||||
| Total financial assets | 295,985 | |||||||||||||||||||||||||
| Financial liabilities | ||||||||||||||||||||||||||
| Asset Management | ||||||||||||||||||||||||||
| Debt obligations | $ | 132 | Enterprise valuation | Revenue multiple | Not Meaningful (NA) | |||||||||||||||||||||
| Enterprise valuation | EBITDA | Not Meaningful (NA) | ||||||||||||||||||||||||
| Income approach | Required rate of return | Not Meaningful (NA) | ||||||||||||||||||||||||
| Total financial liabilities - Asset Management | $ | 132 | ||||||||||||||||||||||||
| Total financial liabilities | $ | 132 | ||||||||||||||||||||||||
(1)For debt securities where the recent transaction price does not estimate fair value, the Company determines the fair value utilizing a yield analysis.
| Quantitative Information about Level 3 Fair Value Measurements | ||||||||||||||||||||||||||
| December 31, 2024 | Fair value | Valuation technique/ methodology | Unobservable input | Range (weighted average) | ||||||||||||||||||||||
| Financial assets | ||||||||||||||||||||||||||
| Asset Management | ||||||||||||||||||||||||||
| Equity securities | $ | 30 | Discounted cash flow | Discount rate | 22.0% - 27.0% (24.5%) | |||||||||||||||||||||
| Equity securities | 469 | Enterprise value | Multiple | 5.13x - 6.13x (5.63x) | ||||||||||||||||||||||
| Total — Asset Management | $ | 499 | ||||||||||||||||||||||||
| Insurance Solutions | ||||||||||||||||||||||||||
| Debt securities ¹: | ||||||||||||||||||||||||||
F-30
| Quantitative Information about Level 3 Fair Value Measurements | ||||||||||||||||||||||||||
| December 31, 2024 | Fair value | Valuation technique/ methodology | Unobservable input | Range (weighted average) | ||||||||||||||||||||||
| Asset and mortgage-backed securities | $ | 53 | Recent transaction | Transaction price | NA | |||||||||||||||||||||
| Asset and mortgage-backed securities | 8,588 | Discounted cash flow | Discount rate | 5.7% - 9.3% (8.0%) | ||||||||||||||||||||||
| Corporate loans | 113,062 | Discounted cash flow | Discount rate | 3.6% - 17.5% (10.6%) | ||||||||||||||||||||||
| Corporate loans | 1,672 | Enterprise value | Multiple | 0.3x - 8.25x (8.04x) | ||||||||||||||||||||||
| Equity securities | 2,918 | Discounted cash flow | Discount rate | 10.1% - 10.1% (10.1%) | ||||||||||||||||||||||
| Other invested assets | 4,575 | Discounted cash flow | Discount rate | 14.9% - 19.3% (18.4%) | ||||||||||||||||||||||
| Total — Insurance Solutions | $ | 130,868 | ||||||||||||||||||||||||
| Equity securities of consolidated VIEs | 141 | Discounted cash flow | Discount rate | 14.37% - 14.37% (14.37%) | ||||||||||||||||||||||
| Corporate loans of consolidated VIEs | 50,585 | Recent transaction | Transaction price | NA | ||||||||||||||||||||||
| Corporate loans of consolidated VIEs | 75,172 | Discounted cash flow | Discount rate | 4.3% - 17.1% (6.7%) | ||||||||||||||||||||||
| Total assets of consolidated VIEs - Insurance Solutions | 125,898 | |||||||||||||||||||||||||
| Total financial assets including consolidated VIEs - Insurance Solutions | $ | 256,766 | ||||||||||||||||||||||||
| Total investments | $ | 257,265 | ||||||||||||||||||||||||
| Financial liabilities | ||||||||||||||||||||||||||
| Asset Management | ||||||||||||||||||||||||||
| Debt obligation | $ | 1,471 | Enterprise valuation | Revenue multiple | Not Meaningful (NA) | |||||||||||||||||||||
| Enterprise valuation | EBITDA | Not Meaningful (NA) | ||||||||||||||||||||||||
| Income Approach | Required rate of return | Not Meaningful (NA) | ||||||||||||||||||||||||
| Total financial liabilities - Asset Management | $ | 1,471 | ||||||||||||||||||||||||
| Total financial liabilities | $ | 1,471 | ||||||||||||||||||||||||
(1)For debt securities where the recent transaction price does not estimate fair value, the Company determines the fair value utilizing a yield analysis.
The Company typically determines the fair value of its performing Level 3 debt investments utilizing a yield analysis. In a yield analysis, a price is ascribed for each investment based upon an assessment of current and expected market yields for similar investments and risk profiles. Additional consideration is given to the expected life, portfolio company performance since close, and other terms and risks associated with an investment. Among other factors, a determinant of risk is the amount of leverage used by the portfolio company relative to the total enterprise value of the company, and the rights and remedies of the Company’s investment within each portfolio company’s capital structure.
Significant unobservable inputs include an illiquidity spread as well as a credit spread, both of which increase the discount rate. These rates are initially set at a level such that the loan valuation equals the initial purchase cost of the loan and are subsequently adjusted at each valuation date to reflect management’s current assessment of market conditions as well as of loan-specific credit and illiquidity risk. Discount rates are subject to adjustment based on both management’s current assessment of market conditions and the economic performance of individual investments. The significant unobservable inputs used in the fair value measurement of the Company’s Level 3 debt securities primarily include current market yields, including relevant market indices, but may also include quotes from brokers, dealers, and pricing services as indicated by comparable investments.
F-31
Financial instruments not carried at fair value
The following tables present carrying amounts and fair values of the Company’s financial assets and liabilities which are not carried at fair value as of June 30, 2025 and December 31, 2024:
| Fair Value Hierarchy | |||||||||||||||||||||||||||||
| June 30, 2025 | Carrying value | Fair value | Level 1 | Level 2 | Level 3 | ||||||||||||||||||||||||
| Financial Assets | |||||||||||||||||||||||||||||
| Asset Management | |||||||||||||||||||||||||||||
| Corporate loans | $ | 13,287 | $ | 13,167 | $ | — | $ | — | $ | 13,167 | |||||||||||||||||||
| Total financial assets — Asset Management | $ | 13,287 | $ | 13,167 | $ | — | $ | — | $ | 13,167 | |||||||||||||||||||
| Insurance Solutions | |||||||||||||||||||||||||||||
| Mortgage loans | $ | 143,662 | $ | 149,882 | $ | — | $ | — | $ | 149,882 | |||||||||||||||||||
| Other invested assets | 16,910 | 17,062 | — | — | 17,062 | ||||||||||||||||||||||||
| Total financial assets — Insurance Solutions | $ | 160,572 | $ | 166,944 | $ | — | $ | — | $ | 166,944 | |||||||||||||||||||
| Total financial assets | $ | 173,859 | $ | 180,111 | $ | — | $ | — | $ | 180,111 | |||||||||||||||||||
| Financial Liabilities | |||||||||||||||||||||||||||||
| Asset Management | |||||||||||||||||||||||||||||
| Debt obligations | $ | 73,863 | $ | 71,100 | $ | — | $ | — | $ | 71,100 | |||||||||||||||||||
| Total financial liabilities — Asset Management | $ | 73,863 | $ | 71,100 | $ | — | $ | — | $ | 71,100 | |||||||||||||||||||
| Insurance Solutions | |||||||||||||||||||||||||||||
| Debt obligations | $ | 17,250 | $ | 17,450 | $ | — | $ | — | $ | 17,450 | |||||||||||||||||||
| Interest sensitive contract liabilities | 363,284 | 363,284 | — | 363,284 | — | ||||||||||||||||||||||||
| Total financial liabilities —Insurance Solutions | $ | 380,534 | $ | 380,734 | $ | — | $ | 363,284 | $ | 17,450 | |||||||||||||||||||
| Total financial liabilities | $ | 454,397 | $ | 451,834 | $ | — | $ | 363,284 | $ | 88,550 | |||||||||||||||||||
| Fair Value Hierarchy | |||||||||||||||||||||||||||||
| December 31, 2024 | Carrying value | Fair value | Level 1 | Level 2 | Level 3 | ||||||||||||||||||||||||
| Financial Assets | |||||||||||||||||||||||||||||
| Asset Management | |||||||||||||||||||||||||||||
| Corporate loans | $ | 13,287 | $ | 13,184 | $ | — | $ | — | $ | 13,184 | |||||||||||||||||||
| Total financial assets — Asset Management | $ | 13,287 | $ | 13,184 | $ | — | $ | — | $ | 13,184 | |||||||||||||||||||
| Insurance Solutions | |||||||||||||||||||||||||||||
| Mortgage loans | 147,640 | 153,619 | — | — | 153,619 | ||||||||||||||||||||||||
| Other invested assets | 16,742 | 16,512 | — | — | 16,512 | ||||||||||||||||||||||||
| Total financial assets — Insurance Solutions | $ | 164,382 | $ | 170,131 | $ | — | $ | — | $ | 170,131 | |||||||||||||||||||
| Total financial assets | $ | 177,669 | $ | 183,315 | $ | — | $ | — | $ | 183,315 | |||||||||||||||||||
| Financial Liabilities | |||||||||||||||||||||||||||||
| Asset Management | |||||||||||||||||||||||||||||
| Debt obligations | $ | 73,492 | $ | 69,776 | $ | — | $ | — | $ | 69,776 | |||||||||||||||||||
| Total financial liabilities — Asset Management | $ | 73,492 | $ | 69,776 | $ | — | $ | — | $ | 69,776 | |||||||||||||||||||
| Insurance Solutions | |||||||||||||||||||||||||||||
| Debt obligations | 14,250 | 14,450 | — | — | 14,450 | ||||||||||||||||||||||||
| Interest sensitive contract liabilities | 334,876 | 334,876 | — | 334,876 | — | ||||||||||||||||||||||||
| Total financial liabilities —Insurance Solutions | $ | 349,126 | $ | 349,326 | $ | — | $ | 334,876 | $ | 14,450 | |||||||||||||||||||
| Total financial liabilities | $ | 422,618 | $ | 419,102 | $ | — | $ | 334,876 | $ | 84,226 | |||||||||||||||||||
F-32
Fair value option
The following table presents the net realized and unrealized gains (losses) on financial instruments for which the FVO was elected:
| For the three months ended June 30, | 2025 | 2024 | ||||||||||||||||||||||||||||||||||||
| Net realized gains (losses) | Net unrealized gains (losses) | Total | Net realized gains (losses) | Net unrealized gains (losses) | Total | |||||||||||||||||||||||||||||||||
| Asset Management | ||||||||||||||||||||||||||||||||||||||
| Debt obligation | $ | — | $ | 371 | $ | 371 | $ | — | $ | (114) | $ | (114) | ||||||||||||||||||||||||||
| Net gains (losses) from investment activities — Asset Management | $ | — | $ | 371 | $ | 371 | $ | — | $ | (114) | $ | (114) | ||||||||||||||||||||||||||
| Insurance Solutions | ||||||||||||||||||||||||||||||||||||||
| Debt securities: | ||||||||||||||||||||||||||||||||||||||
| U.S. government and agency | $ | — | $ | — | $ | — | $ | — | $ | — | $ | — | ||||||||||||||||||||||||||
| U.S. state, territories and municipalities | — | 5 | 5 | — | 21 | 21 | ||||||||||||||||||||||||||||||||
| Other government and agency | — | (1) | (1) | — | (68) | (68) | ||||||||||||||||||||||||||||||||
| Corporate | (1,059) | 1,049 | (10) | — | (2,210) | (2,210) | ||||||||||||||||||||||||||||||||
| Asset and mortgage- backed securities | (149) | (299) | (448) | 1 | 1,807 | 1,808 | ||||||||||||||||||||||||||||||||
| Corporate loans | (2) | 637 | 635 | (4) | (117) | (121) | ||||||||||||||||||||||||||||||||
| Mortgage loans | — | — | — | — | — | — | ||||||||||||||||||||||||||||||||
| Equity securities | — | — | — | — | — | — | ||||||||||||||||||||||||||||||||
| Other invested assets | (755) | 4,607 | 3,852 | — | (12) | (12) | ||||||||||||||||||||||||||||||||
| Net gains (losses) from investment activities — Insurance Solutions | $ | (1,965) | $ | 5,998 | $ | 4,033 | $ | (3) | $ | (579) | $ | (582) | ||||||||||||||||||||||||||
| Investments of consolidated VIEs | 177 | (464) | (287) | 416 | (963) | (547) | ||||||||||||||||||||||||||||||||
| Net gains (losses) from investment activities — Insurance Solutions including consolidated VIEs | $ | (1,788) | $ | 5,534 | $ | 3,746 | $ | 413 | $ | (1,542) | $ | (1,129) | ||||||||||||||||||||||||||
| For the six months ended June 30, | 2025 | 2024 | ||||||||||||||||||||||||||||||||||||
| Net realized gains (losses) | Net unrealized gains (losses) | Total | Net realized gains (losses) | Net unrealized gains (losses) | Total | |||||||||||||||||||||||||||||||||
| Asset Management | ||||||||||||||||||||||||||||||||||||||
| Debt obligation | $ | — | $ | 1,339 | $ | 1,339 | $ | — | $ | (261) | $ | (261) | ||||||||||||||||||||||||||
| Net gains (losses) from investment activities — Asset Management | $ | — | $ | 1,339 | $ | 1,339 | $ | — | $ | (261) | $ | (261) | ||||||||||||||||||||||||||
| Insurance Solutions | ||||||||||||||||||||||||||||||||||||||
| Debt securities: | ||||||||||||||||||||||||||||||||||||||
| U.S. government and agency | $ | — | $ | — | $ | — | $ | — | $ | — | $ | — | ||||||||||||||||||||||||||
| U.S. state, territories and municipalities | — | 62 | 62 | — | 29 | 29 | ||||||||||||||||||||||||||||||||
| Other government and agency | — | (2) | (2) | — | (39) | (39) | ||||||||||||||||||||||||||||||||
| Corporate | (1,109) | 2,235 | 1,126 | — | (4,100) | (4,100) | ||||||||||||||||||||||||||||||||
| Asset and mortgage- backed securities | (295) | (184) | (479) | 32 | 3,272 | 3,304 | ||||||||||||||||||||||||||||||||
| Corporate loans | — | 1,426 | 1,426 | 22 | (719) | (697) | ||||||||||||||||||||||||||||||||
| Mortgage loans | — | — | — | — | — | — | ||||||||||||||||||||||||||||||||
| Equity securities | — | — | — | — | — | — | ||||||||||||||||||||||||||||||||
| Other invested assets | (755) | 4,217 | 3,462 | — | (56) | (56) | ||||||||||||||||||||||||||||||||
F-33
| For the six months ended June 30, | 2025 | 2024 | ||||||||||||||||||||||||||||||||||||
| Net realized gains (losses) | Net unrealized gains (losses) | Total | Net realized gains (losses) | Net unrealized gains (losses) | Total | |||||||||||||||||||||||||||||||||
| Net gains (losses) from investment activities — Insurance Solutions | $ | (2,159) | $ | 7,754 | $ | 5,595 | $ | 54 | $ | (1,613) | $ | (1,559) | ||||||||||||||||||||||||||
| Investments of consolidated VIEs | 237 | (789) | (552) | 599 | (1,027) | (428) | ||||||||||||||||||||||||||||||||
| Net gains (losses) from investment activities — Insurance Solutions including consolidated VIEs | $ | (1,922) | $ | 6,965 | $ | 5,043 | $ | 653 | $ | (2,640) | $ | (1,987) | ||||||||||||||||||||||||||
The following table presents information for loans which the Company elected the FVO.
| June 30, 2025 | Unpaid Principal Balance | Mark to Fair Value | Fair Value | |||||||||||||||||
| Insurance Solutions | ||||||||||||||||||||
| Corporate loans | $ | 164,529 | $ | (1,813) | $ | 162,716 | ||||||||||||||
| Other invested assets | — | — | — | |||||||||||||||||
| Insurance Solutions | $ | 164,529 | $ | (1,813) | $ | 162,716 | ||||||||||||||
| Corporate loans of consolidated VIEs | 135,404 | (6,598) | 128,806 | |||||||||||||||||
| Insurance Solutions including consolidated VIEs | $ | 299,933 | $ | (8,411) | $ | 291,522 | ||||||||||||||
| December 31, 2024 | Unpaid Principal Balance | Mark to Fair Value | Fair Value | |||||||||||||||||
| Insurance Solutions | ||||||||||||||||||||
| Corporate loans | $ | 117,823 | $ | (3,089) | $ | 114,734 | ||||||||||||||
| Other invested assets | 5,756 | (4,813) | 943 | |||||||||||||||||
| Insurance Solutions | $ | 123,579 | $ | (7,902) | $ | 115,677 | ||||||||||||||
| Corporate loans of consolidated VIEs | 132,194 | (6,296) | 125,898 | |||||||||||||||||
| Insurance Solutions including consolidated VIEs | $ | 255,773 | $ | (14,198) | $ | 241,575 | ||||||||||||||
As of June 30, 2025 and December 31, 2024, there were no loans accounted for at fair value under the FVO which were 90 days or more past-due or in non-accrual status.
The following table presents the estimated amount of gains (losses) included in earnings attributable to changes in instrument-specific credit risk on corporate loans for which the Company elected the FVO.
| For the six months ended June 30, | 2025 | 2024 | ||||||||||||
| Insurance Solutions | ||||||||||||||
| Corporate loans | $ | 1,136 | $ | (324) | ||||||||||
| Other invested assets | 3,471 | (56) | ||||||||||||
| Insurance Solutions | 4,607 | (380) | ||||||||||||
| Corporate loans of consolidated VIEs | (909) | 39 | ||||||||||||
| Insurance Solutions including consolidated VIEs | $ | 3,698 | $ | (341) | ||||||||||
The portion of gains and losses attributable to changes in instrument-specific credit risk is estimated by identifying loans with changes in credit ratings meeting certain criteria.
F-34
Note 9. Revenue from service contracts
The following table summarizes the Company’s revenue from service contracts for Asset Management:
| Three Months Ended June 30, | Six Months Ended June 30, | |||||||||||||||||||||||||
| 2025 | 2024 | 2025 | 2024 | |||||||||||||||||||||||
| Management fees | $ | 2,809 | $ | 2,825 | $ | 6,049 | $ | 5,416 | ||||||||||||||||||
| Incentive fees | 478 | 1,008 | 777 | 1,911 | ||||||||||||||||||||||
| Servicing fees (expense)¹ | (744) | (953) | (1,042) | (1,509) | ||||||||||||||||||||||
(1)Servicing fees were a net expense for the Company as reimbursements to SCIM for certain costs and the specified investment advisory fee retained by SCIM exceeded the net economic benefit derived under the ACIF advisory agreement, for the three and six months ended June 30, 2025, and June 30, 2024. Servicing fees are included within Administration and servicing fees in the Condensed Consolidated Statements of Operations.
Note 10. Goodwill and intangible assets
Goodwill
The carrying amount of goodwill by reportable segment was $1.0 million as of both June 30, 2025 and December 31, 2024 for Asset Management, which is included in Other assets in the Condensed Consolidated Statements of Financial Position. The carrying amount of goodwill was $55.7 million for Insurance Solutions as of both June 30, 2025 and December 31, 2024.
Intangible assets
Intangible assets consist of the following as of June 30, 2025 and December 31, 2024:
| June 30, 2025 | ||||||||||||||||||||||||||
| Gross carrying amount | Accumulated amortization | Accumulated impairment | Net carrying amount | |||||||||||||||||||||||
| Asset Management | ||||||||||||||||||||||||||
| Intangible assets — indefinite life | ||||||||||||||||||||||||||
| Investment management contracts | $ | 19,204 | $ | — | $ | — | $ | 19,204 | ||||||||||||||||||
| Intangible assets — definite life | ||||||||||||||||||||||||||
| Investment management contracts | 11,544 | (7,607) | — | 3,937 | ||||||||||||||||||||||
| Total intangible assets — Asset Management | 30,748 | (7,607) | — | 23,141 | ||||||||||||||||||||||
| Insurance Solutions | ||||||||||||||||||||||||||
| Intangible assets — indefinite life | ||||||||||||||||||||||||||
| State insurance licenses | 2,444 | — | — | 2,444 | ||||||||||||||||||||||
| Total intangible assets — Insurance Solutions | $ | 2,444 | $ | — | $ | — | $ | 2,444 | ||||||||||||||||||
F-35
| December 31, 2024 | ||||||||||||||||||||||||||
| Gross carrying amount | Accumulated amortization | Accumulated impairment | Net carrying amount | |||||||||||||||||||||||
| Asset Management | ||||||||||||||||||||||||||
| Intangible assets — indefinite life | ||||||||||||||||||||||||||
| Investment management contracts | $ | 19,204 | $ | — | $ | — | $ | 19,204 | ||||||||||||||||||
| Intangible assets — definite life | ||||||||||||||||||||||||||
| Investment management contracts | 13,379 | (4,808) | (1,835) | 6,736 | ||||||||||||||||||||||
| Total intangible assets — Asset Management | 32,583 | (4,808) | (1,835) | 25,940 | ||||||||||||||||||||||
| Insurance Solutions | ||||||||||||||||||||||||||
| Intangible assets — indefinite life | ||||||||||||||||||||||||||
| State insurance licenses | 2,444 | — | — | 2,444 | ||||||||||||||||||||||
| Total intangible assets — Insurance Solutions | $ | 2,444 | $ | — | $ | — | $ | 2,444 | ||||||||||||||||||
The following table represents estimated intangible amortization expense as of June 30, 2025:
| As of | June 30, 2025 | |||||||
| Remainder of 2025 | $ | 1,634 | ||||||
| 2026 | 1,479 | |||||||
| 2027 | 764 | |||||||
| 2028 | 60 | |||||||
| 2029 | — | |||||||
| 2030 and thereafter | — | |||||||
| Total | $ | 3,937 | ||||||
Note 11. Debt obligations
Asset Management
MLC US Holdings Credit Facility
On August 20, 2021, MLC US Holdings entered into a credit facility with a large US-based asset manager, as administrative agent and collateral agent for the lenders, whereby MLC US Holdings may borrow up to $25.0 million by December 31, 2021 (the “MLC US Holdings Credit Facility”). On September 19, 2022, MLC US Holdings entered into an amendment to its existing credit agreement to increase the term loan available thereunder by $4.5 million. The primary use of the proceeds from the amendment was to seed Opportunistic Credit Interval Fund (“OCIF”), an interval fund managed by ML Management. On May 2, 2023, MLC US Holdings entered into an amendment to the MLC US Holdings Credit Facility to increase the term loan available thereunder by an additional $4.5 million. The primary use of the proceeds from the most recent amendment was to finance the acquisition of Ovation on July 5, 2023, and other related fees and expenses. On December 17, 2024, MLC US Holdings entered into an amendment its existing credit agreement to upsize the facility thereunder by approximately $13.0 million to support key business initiatives as well as for general corporate purposes and paying related transaction fees and expenses. The MLC US Holdings Credit Facility matures on August 20, 2027.
Amounts drawn under the MLC US Holdings Credit Facility initially bore interest at London Interbank Offer Rate (“LIBOR") plus a spread of 7.50%. The benchmark, LIBOR, was replaced by the secured overnight financing rate ("SOFR") upon the transition from LIBOR on May 2, 2023. Upon the most recent amendment to the MLC US Holdings Credit Facility, the credit facility bears interest based on a pricing step-down mechanism as the business continues to perform, which is expected to reduce the Company's cost of debt over time. Payments of principal and interest are made on each payment date, with the remaining principal outstanding and accrued but unpaid interest payable on August 20, 2027. The MLC US Holdings Credit Facility is collateralized by assets held by MLC US Holdings. The Company is a guarantor of the MLC US Holdings Credit Facility.
The most recent amendment to the MLC US Holdings Credit Facility was treated as a debt modification as the instruments were not substantially different since the present value of the cash flows of the modified debt were less than 10 percent different from the present value of the remaining cash flows of the original debt. As of December 31, 2024, costs
F-36
paid to the lenders of $0.4 million were capitalized and included an original issuance discount (“OID”) and were amortized through interest expense.
The Company was in compliance with all debt covenants for all periods presented.
Seller notes
On July 1, 2021, the Company completed the acquisition of the management contract for the investment company, Logan Ridge Finance Corporation (“Logan Ridge”), from Capitala Investment Advisors, LLC (“CIA”), through, in part, the issuance of an unsecured promissory note of $4.0 million, which bears no interest and was initially payable by July 1, 2025 but on June 30, 2025 was extended until November 1, 2025. The repayment amount on the maturity date will be adjusted on the initial maturity date to reflect the performance of the investment portfolio of Logan Ridge Finance Corporation since closing and shall not be less than $nil or more than $6.0 million. The Company elected to account for this note under the FVO, where the Company marks the note to fair value each reporting period, with changes in fair value recognized in earnings.
On October 29, 2021, the Company completed the Ability Acquisition through in part the issuance of an unsecured promissory note of $15.0 million, which bears interest at 5.0% per annum and is payable by October 29, 2031.
Promissory note
On January 29, 2024, the Company raised $18.8 million of debt through the issuance of 18,752 Debenture Units on a non-brokered private placement basis (the "Debenture Unit Offering"). Each Debenture Unit consists of: (i) one 8.85% paid-in-kind unsecured debenture of the Company in the principal amount of less than $0.1 million maturing on the date that is eight (8) years from the issuance thereof, and (ii) 50 common share purchase warrants of the Company, each of which is exercisable to acquire one common share of the Company at a price of C$2.75 Canadian Dollars (“CAD” or “C$”) per share for a period of eight (8) years, from the issuance thereof, provided that the warrants are not permitted to be exercised within the first twelve (12) months from the issuance thereof.
Debt obligations consisted of the following as of June 30, 2025 and December 31, 2024:
| As at June 30, 2025 | Maturity date | Stated interest rate | Effective interest rate | Extension options | Total facility | Outstanding balance | |||||||||||||||||||||||||||||
| Seller note — Capitala Acquisition ¹ | November 2025 | — | — | N/A | $ | 4,000 | $ | 132 | |||||||||||||||||||||||||||
| MLC US Holdings Credit Facility ² | August 2027 | SOFR +7.50% | 12.06 | % | N/A | 40,000 | 39,232 | ||||||||||||||||||||||||||||
| Seller note — Ability Acquisition | October 2031 | 5.0 | % | 5.0 | % | N/A | 15,000 | 15,000 | |||||||||||||||||||||||||||
| Debenture units ³ | January 2032 | 8.5 | % | 8.9 | % | N/A | 18,752 | 20,708 | |||||||||||||||||||||||||||
| Total debt | $ | 77,752 | $ | 75,072 | |||||||||||||||||||||||||||||||
(1)The Company elected FVO for the Seller note – Capitala Acquisition. The following balance represents the fair value of the note as of June 30, 2025.
(2)The MLC US Holdings Credit Facility is secured by all assets and interests in assets and proceeds owned and acquired by MLC US Holdings.
(3)The warrants issued with the Debenture Units are recorded in equity at fair value upon issuance and therefore are not required to be subsequently remeasured at fair value on an ongoing basis.
F-37
| As at December 31, 2024 | Maturity date | Stated interest rate | Effective interest rate | Extension options | Total facility | Outstanding balance | |||||||||||||||||||||||||||||
| Seller note — Capitala Acquisition ¹ | July 2025 | — | — | % | N/A | $ | 4,000 | $ | 1,471 | ||||||||||||||||||||||||||
| MLC US Holdings Credit Facility ² | August 2027 | SOFR +7.50% | 12.37 | % | N/A | 40,000 | 40,000 | ||||||||||||||||||||||||||||
| Seller note — Ability Acquisition | October 2031 | 5.0 | % | 5.0 | % | N/A | 15,000 | 15,000 | |||||||||||||||||||||||||||
| Debenture units ³ | January 2032 | 8.5 | % | 8.9 | % | N/A | 18,752 | 19,821 | |||||||||||||||||||||||||||
| Total debt | $ | 77,752 | $ | 76,292 | |||||||||||||||||||||||||||||||
(1)The Company elected FVO for the Seller note – Capitala Acquisition. The following balance represents the fair value of the note as of December 31, 2024.
(2)The MLC US Holdings Credit Facility is secured by all assets and interests in assets and proceeds owned and acquired by MLC US Holdings.
(3)The warrants issued with the Debenture Units are recorded in equity at fair value upon issuance and therefore are not required to be subsequently remeasured at fair value on an ongoing basis.
The scheduled principal repayments are as follows:
| As of | June 30, 2025 | |||||||
| Remainder of 2025 | $ | 1,364 | ||||||
| 2026 | 2,000 | |||||||
| 2027 | 39,000 | |||||||
| 2028 | 3,000 | |||||||
| 2029 | 3,000 | |||||||
| 2030 and thereafter | 26,708 | |||||||
| 75,072 | ||||||||
| Transaction costs (net of amortization) | (1,076) | |||||||
| Total debt | $ | 73,995 | ||||||
For the three months ended June 30, 2025, interest expense, including the amortization of debt issuance costs and PIK interest, was $2.0 million (June 30, 2024 –$1.7 million), For the six months ended June 30, 2025, interest expense, including the amortization of debt issuance costs and PIK interest, was $3.9 million (June 30, 2024 – $3.4 million).
Insurance Solutions
Debt obligations
Ability has the following surplus notes outstanding as of June 30, 2025 and December 31, 2024:
| As at June 30, 2025 | Date issued | Date of maturity | Interest rate | Par value | Carrying value of note | ||||||||||||||||||||||||
| Sentinel Security Life Insurance Company | Feb-13 | Jun-28 | 5.00 | % | $ | 2,250 | $ | 2,250 | |||||||||||||||||||||
| Pavonia Life Insurance Company of Michigan | Aug-23 | Dec-32 | 10.00 | % | 12,000 | 12,000 | |||||||||||||||||||||||
| Atlantic Coast Life Insurance Company | Mar-25 | Mar-33 | SOFR+6.00% | 3,000 | 3,000 | ||||||||||||||||||||||||
| Total surplus notes | $ | 17,250 | $ | 17,250 | |||||||||||||||||||||||||
| As at December 31, 2024 | Date issued | Date of maturity | Interest rate | Par value | Carrying value of note | ||||||||||||||||||||||||
| Sentinel Security Life Insurance Company | Feb-13 | Jun-28 | 5.00 | % | $ | 2,250 | $ | 2,250 | |||||||||||||||||||||
| Pavonia Life Insurance Company of Michigan | Aug-23 | Dec-32 | 10.00 | % | 12,000 | 12,000 | |||||||||||||||||||||||
| Total surplus notes | $ | 14,250 | $ | 14,250 | |||||||||||||||||||||||||
For the six months ended June 30, 2025, interest paid was $0.7 million (June 30, 2024 - $0.7 million).
F-38
Refer to Note 8. Fair value measurements for fair value of financial liabilities carried at amortized cost.
The surplus notes are subordinated in right of payment of all indebtedness, policy claims, and other creditor claims. The note issued to Sentinel Security Life Insurance Company had an initial maturity date of June 12, 2023; however, in the second quarter of 2023, Ability renewed the note, extending the date of maturity to June 12, 2028. On August 30, 2023, Ability, completed a private offering of $12.0 million aggregate principal amount of 10.0% Surplus Notes due December 2032. On March 31, 2025, Ability, completed another private offering for an aggregate of $3.0 million principal amount of 6%+SOFR Surplus Notes with interest and principal due and payable on March 31, 2033. Payments of interest or principal shall be paid only if Ability has the required levels of statutory surplus and upon prior authorization by the Director of the Nebraska Department of Insurance.
Note 12. Deferred acquisition costs
Information regarding total deferred acquisition costs (“DAC”) for June 30, 2025 and June 30, 2024:
| For the six months ended June 30, 2025 | ||||||||||||||||||||||||||
| Beginning Balance | Capitalization | Amortization | Ending Balance | |||||||||||||||||||||||
| DAC: | ||||||||||||||||||||||||||
| MYGA | $ | 6,524 | $ | 3,393 | $ | (1,460) | $ | 8,457 | ||||||||||||||||||
| For the six months ended June 30, 2024 | ||||||||||||||||||||||||||
| Beginning Balance | Capitalization | Amortization | Ending Balance | |||||||||||||||||||||||
| DAC: | ||||||||||||||||||||||||||
| MYGA | $ | 6,342 | $ | 2,179 | $ | (1,037) | $ | 7,484 | ||||||||||||||||||
Significant methodologies and assumptions
The Company amortizes DAC related to long-duration contracts on a straight-line basis, at the individual level over the expected term of the related contract.
The amortization expense for DAC is included in the Amortization of deferred acquisition costs in the Condensed Consolidated Statements of Operations. The estimated future amortization expense related to DAC for the future years is as follows:
| As of | June 30, 2025 | |||||||
| Remainder of 2025 | $ | 1,265 | ||||||
| 2026 | 2,749 | |||||||
| 2027 | 2,357 | |||||||
| 2028 | 1,472 | |||||||
| 2029 | 415 | |||||||
| 2030 and thereafter | 199 | |||||||
| Total | $ | 8,457 | ||||||
F-39
Note 13. Future policy benefits and related reinsurance recoverable
Future policy benefits comprise substantially all obligations to insureds in the Company’s insurance operations. A summary of future policy benefits and reinsurance recoverable are presented below.
| As of | June 30, 2025 | December 31, 2024 | ||||||||||||
| Reinsurance recoverable | ||||||||||||||
| Long term care reinsurance | $ | 450,696 | $ | 445,847 | ||||||||||
| Other | 4,404 | 4,378 | ||||||||||||
| Modco investments Vista¹ | (188,032) | (190,771) | ||||||||||||
| Total reinsurance recoverable | $ | 267,068 | $ | 259,454 | ||||||||||
| Future policy benefits | ||||||||||||||
| Long term care insurance | $ | 775,454 | $ | 765,155 | ||||||||||
| Other | 4,406 | 4,378 | ||||||||||||
| Total future policy benefits | $ | 779,860 | $ | 769,533 | ||||||||||
| Funds held under reinsurance contracts | ||||||||||||||
| Funds held arrangement Front Street Re¹ | $ | 237,281 | $ | 239,918 | ||||||||||
(1)The Company has a coinsurance or modified coinsurance with funds withheld arrangement with its two reinsurers. The Modco agreement with Vista Re dictates that the assets held as collateral are held with the legal right of offset to the related insurance contract liabilities. Therefore, the collateral held for this agreement is netted against the reserves under this contract. The agreement with Front Street Re does not have the legal right of offset therefore the reserves are not presented net of the collateral held, instead they are in the line item “Funds held under reinsurance contracts” in the Condensed Consolidated Statements of Financial Position.
The following tables summarize balances of and changes in future policy benefits reserves:
| Six months ended June 30, | ||||||||||||||
| Long-term care | 2025 | 2024 | ||||||||||||
| Present value of expected net premiums | ||||||||||||||
| Balance, beginning of year | $ | 306,206 | $ | 363,367 | ||||||||||
| Beginning balance at locked-in discount rate | $ | 343,705 | $ | 405,083 | ||||||||||
| Change in effect in cashflow assumptions | — | — | ||||||||||||
| Effect of actual variances from expected experience | (7,536) | (5,775) | ||||||||||||
| Adjusted balance | 336,169 | 399,308 | ||||||||||||
| Interest accrual | 3,655 | 3,442 | ||||||||||||
| Net premiums collected | (22,722) | (24,228) | ||||||||||||
| Effect of foreign currency | — | — | ||||||||||||
| Ending balance at locked-in discount rate | 317,102 | 378,522 | ||||||||||||
| Effect of changes in discount rate assumptions | (29,000) | (44,902) | ||||||||||||
| Balance, end of year | $ | 288,102 | $ | 333,620 | ||||||||||
| Present value of Expected Future Policy Benefits | ||||||||||||||
| Balance, beginning of year | $ | 1,071,361 | $ | 1,170,790 | ||||||||||
| Beginning balance at locked-in discount rate | $ | 1,306,356 | $ | 1,388,200 | ||||||||||
| Change in effect in cashflow assumptions | — | — | ||||||||||||
| Effect of actual variances from expected experience | 5,663 | 1,869 | ||||||||||||
| Adjusted balance | 1,312,019 | 1,390,069 | ||||||||||||
| Interest accrual | 14,297 | 12,024 | ||||||||||||
| Benefit payments | (55,495) | (53,038) | ||||||||||||
| Ending balance at locked-in discount rate | $ | 1,270,821 | $ | 1,349,055 | ||||||||||
F-40
| Six months ended June 30, | ||||||||||||||
| Long-term care | 2025 | 2024 | ||||||||||||
| Effect of changes in discount rate assumptions | (207,265) | (245,902) | ||||||||||||
| Balance, end of year | $ | 1,063,556 | $ | 1,103,153 | ||||||||||
| Net future policy benefit reserves ¹ | $ | 775,454 | $ | 769,533 | ||||||||||
| Less: Reinsurance recoverables, net of allowance for credit losses ² | (450,696) | (444,160) | ||||||||||||
| Net future policy benefit reserves, after reinsurance recoverables | $ | 324,758 | $ | 325,373 | ||||||||||
(1)Net future policy benefit reserves excludes $4.4 million as of June 30, 2025 and June 30, 2024, respectively, of Medico assumed reserves which are 100% ceded.
(2)Reinsurance recoverables, net of allowance for credit losses excludes $4.4 million of reinsurance recoverable as of June 30, 2025 and June 30, 2024.
In the first half of 2025, the underlying cash flow assumptions remained unchanged. The effect of actual variances from expected experience observed a $13 million increase in the liability for future policy benefits, mainly driven by lower than expected future premium receipts and higher claims.
In the first half of 2024, the underlying cash flow assumptions remained unchanged. The effect of actual variances from expected experience observed a $8 million increase in the liability for future policy benefits, mainly driven by lower than expected future premium receipts and higher claims.
The following tables provides the amount of undiscounted and discounted expected future gross premiums and expected future benefits and expenses for the LTC line of business:
| Six months ended June 30, | 2025 | 2024 | ||||||||||||||||||||||||
| Long-term care | Undiscounted | Discounted (1) | Undiscounted | Discounted (1) | ||||||||||||||||||||||
| Expected future gross premiums | $ | 383,493 | $ | 288,102 | $ | 455,930 | $ | 333,620 | ||||||||||||||||||
| Benefit payments | 1,791,870 | 1,063,556 | 1,885,828 | 1,103,153 | ||||||||||||||||||||||
(1)Discount was determined using the current discount rate as of June 30, 2025, and June 30, 2024.
The following table provides the weighted-average durations of and weighted-average interest rates for the liability for future policy benefits:
| Six months ended June 30, | ||||||||||||||
| Long-term care | 2025 | 2024 | ||||||||||||
| Weighted-average duration of liability (years) at current rate | 9.75 | 9.95 | ||||||||||||
| Weighted-average duration of liability (years) at original rate | 11.43 | 11.80 | ||||||||||||
| Weighted-average interest rate at current rate | 5.06% | 5.16% | ||||||||||||
| Weighted-average interest rate at original rate | 3.05% | 2.96% | ||||||||||||
F-41
Note 14. Interest sensitive contract liabilities
The following table shows the outstanding Interest sensitive contract liabilities which represents the policyholder balances for MYGA product line:
| Six months ended June 30, | ||||||||||||||
| 2025 | 2024 | |||||||||||||
| Balance, beginning of year | $ | 334,876 | $ | 256,569 | ||||||||||
| Deposits | 42,996 | 75,933 | ||||||||||||
| Product charges | (1,582) | (107) | ||||||||||||
| Surrenders and withdrawals | (16,023) | (1,286) | ||||||||||||
| Benefit payments | (4,798) | (7,350) | ||||||||||||
| Interest credited | 7,815 | 7,138 | ||||||||||||
| Balance at June 30, | $ | 363,284 | $ | 330,897 | ||||||||||
| Weighted-average annual crediting rate | 5.00 | % | 5.00 | % | ||||||||||
| At period end: | ||||||||||||||
| Cash surrender value | $ | 335,775 | $ | 287,953 | ||||||||||
| Net amount a risk: | ||||||||||||||
| In the event of death ¹ | $ | 363,284 | $ | 330,897 | ||||||||||
(1)For benefits that are payable in the event of death, the net amount at risk is generally defined as the current death benefit in excess of the current account balances at the Condensed Consolidated Statements of Financial Position date. It represents the amount of the claim that the Company would incur if death claims were filed on all contracts at the Condensed Consolidated Statements of Financial Position date.
MYGA policyholder account balances totaled $363.3 million and $330.9 million, as of June 30, 2025, and 2024, respectively. Changes in policyholder account balances are primarily attributed to deposits associated with new MYGA policies assumed of $43 million and $76 million and interest credited of $7.8 million and $7.1 million for the six months ended June 30, 2025 and June 30, 2024, respectively. These increases were partially offset by surrenders, withdrawals, benefits and product charges of $22.4 million and $8.7 million for the six months ended June 30, 2025 and June 30, 2024, respectively. Interest on policyholder account balances is generally credited at minimum guaranteed rates, primarily between 2% and 7% at both June 30, 2025, and June 30, 2024.
Note 15. Reinsurance
The Company enters into reinsurance agreements primarily as a purchaser of reinsurance for its LTC line of business and also as a provider of reinsurance for the LTC and MYGA lines of business. The Company participates in reinsurance activities in order to limit losses, minimize exposure to significant risks and provide additional capacity for future growth.
Under the terms of the reinsurance agreements, the reinsurer agrees to reimburse the Company for the ceded amount in the event a claim is paid. Cessions under reinsurance agreements do not discharge the Company’s obligation as the primary insurer. In the event that reinsurers do not meet their obligations under the terms of the reinsurance agreements, Reinsurance recoverable balances could become uncollectible.
Accounting for reinsurance requires extensive use of assumptions and estimates, particularly related to the future performance of the underlying business and the potential impact of counterparty credit risks.
Reinsurance recoverable
The Company reinsures its business through two reinsurers. The Company monitors ratings and evaluates the financial strength of its reinsurers by analyzing their financial statements. In addition, the reinsurance recoverable balance due from each reinsurer is evaluated as part of the overall monitoring process. Recoverability of reinsurance recoverable balances is evaluated based on these analyses. The Company uses collateral for its reinsurance recoverable with funds withheld accounts. These reinsurance recoverable balances are stated net of allowance for expected credit loss of $1.0
F-42
million and $0.8 million at June 30, 2025 and December 31, 2024, respectively. The Company had $455.1 million and $450.2 million of net ceded Reinsurance recoverable at June 30, 2025 and December 31, 2024, respectively. The Company had $38.7 million and $31.1 million of unsecured Reinsurance recoverable balances at June 30, 2025 and December 31, 2024, respectively.
The amounts in the Condensed Consolidated Statements of Financial Position include the impact of reinsurance. Information regarding the significant effects of reinsurance was as follows at:
| Long-term care | June 30, 2025 | December 31, 2024 | ||||||||||||
| Reinsurance recoverable | ||||||||||||||
| Medico Insurance Company | $ | 4,404 | $ | 4,376 | ||||||||||
| Front Street Re | 271,554 | 266,629 | ||||||||||||
| Vista Life and Casualty Reinsurance Co | 179,142 | 179,220 | ||||||||||||
| Vista Modco Funs Withheld | (188,032) | (190,771) | ||||||||||||
| Total reinsurance recoverable | $ | 267,068 | $ | 259,454 | ||||||||||
| Future policy benefits | ||||||||||||||
| Direct | $ | 672,912 | $ | 666,617 | ||||||||||
| Reinsurance assumed | 106,948 | 102,916 | ||||||||||||
| Total future policy benefits | $ | 779,860 | $ | 769,533 | ||||||||||
The amounts in the Condensed Consolidated Statements of Comprehensive Income (Loss) include the impact of reinsurance. Information regarding the significant effects of reinsurance was as follows:
| Long-term care | ||||||||||||||
| For the three months ended June 30, | 2025 | 2024 | ||||||||||||
| Net premiums | ||||||||||||||
| Direct premiums | $ | 10,142 | $ | 11,196 | ||||||||||
| Reinsurance assumed | 988 | 836 | ||||||||||||
| Reinsurance ceded | (15,368) | (15,749) | ||||||||||||
| Total net premiums | $ | (4,238) | $ | (3,717) | ||||||||||
| Net policy benefit and claims (remeasurement gain on policy liabilities of $2,945 and $1,881, respectively) | ||||||||||||||
| Direct | $ | 20,370 | $ | 22,879 | ||||||||||
| Reinsurance assumed | 2,056 | 1,469 | ||||||||||||
| Reinsurance ceded, net of provision for credit losses¹ | (23,490) | (25,235) | ||||||||||||
| Total net policyholder benefits and claims | $ | (1,064) | $ | (887) | ||||||||||
| Long-term care | ||||||||||||||
| For the six months ended June 30, | 2025 | 2024 | ||||||||||||
| Net premiums | ||||||||||||||
| Direct premiums | $ | 21,109 | $ | 22,364 | ||||||||||
| Reinsurance assumed | 2,078 | 1,980 | ||||||||||||
| Reinsurance ceded | (31,438) | (31,674) | ||||||||||||
| Total net premiums | $ | (8,251) | $ | (7,330) | ||||||||||
| Net policy benefit and claims (remeasurement gain on policy liabilities of $3,025 and $7,306, respectively) | ||||||||||||||
| Direct | $ | 35,590 | $ | 36,196 | ||||||||||
| Reinsurance assumed | 7,677 | 1,910 | ||||||||||||
| Reinsurance ceded, net of provision for credit losses(1) | (42,538) | (43,254) | ||||||||||||
| Total net policyholder benefits and claims | $ | 729 | $ | (5,148) | ||||||||||
F-43
(1) The provision for credit losses for reinsurance recoverables for the three and six months ended June 30, 2025, and June 30, 2024 is $0.1 million and $0.2 million and ($0.2) million and ($0.6) million , respectively.
Note 16. Other assets and Accrued expenses and other liabilities
Other assets consist of the following:
| As of | June 30, 2025 | December 31, 2024 | ||||||||||||
| Asset Management | ||||||||||||||
| Management fee receivable - related parties | $ | 2,458 | $ | 2,113 | ||||||||||
| Incentive fee receivable - related parties | 479 | 544 | ||||||||||||
| Deferred tax assets | 2,668 | 2,296 | ||||||||||||
| Prepaid income taxes | 319 | 476 | ||||||||||||
| Accrued interest and dividends receivable | 2,448 | 1,909 | ||||||||||||
| Ovation goodwill | 1,000 | 1,000 | ||||||||||||
| Operating lease right of use asset | 486 | 560 | ||||||||||||
| Deferred offering costs | — | — | ||||||||||||
| Prepaid insurance | 250 | 222 | ||||||||||||
| Other | 38 | 59 | ||||||||||||
| Total other assets — Asset Management | 10,146 | 9,179 | ||||||||||||
| Insurance Solutions | ||||||||||||||
| Accrued investment income | 17,778 | 17,532 | ||||||||||||
| Receivable for investments sold ¹ | 283 | 17,045 | ||||||||||||
| Guaranty funds on deposit | 67 | 99 | ||||||||||||
| Other | 2,325 | 2,459 | ||||||||||||
| Total other assets — Insurance Solutions | 20,453 | 37,135 | ||||||||||||
| Interest receivable of consolidated VIEs | 1,144 | 1,048 | ||||||||||||
| Total other assets — Insurance Solutions including consolidated VIEs | 21,597 | 38,183 | ||||||||||||
| Total other assets | $ | 31,743 | $ | 47,362 | ||||||||||
(1)Represents amounts due from third-parties for investment sales for which a cash settlement has not occurred.
Other liabilities and accrued expenses consist of the following:
| As of | June 30, 2025 | December 31, 2024 | ||||||||||||
| Asset Management | ||||||||||||||
| Payable for investments purchased ¹ | $ | — | $ | — | ||||||||||
| Operating lease liabilities | 492 | 572 | ||||||||||||
| Accounts payable and accrued liabilities | 9,931 | 5,097 | ||||||||||||
| Total accrued expenses and other liabilities — Asset Management | 10,423 | 5,669 | ||||||||||||
| Insurance Solutions | ||||||||||||||
| Payable for investments purchased ¹ | 3,021 | — | ||||||||||||
| Other accrued expenses | 4,222 | 2,995 | ||||||||||||
| Total accrued expenses and other liabilities — Insurance Solutions | $ | 7,243 | $ | 2,995 | ||||||||||
| Total accrued expenses and other liabilities | $ | 17,666 | $ | 8,664 | ||||||||||
(1)Represents amounts owed to third-parties for investment purchases for which a cash settlement has not occurred.
Note 17. Income taxes
Current tax is the amount of income tax recoverable (payable) in respect of the taxable loss (profit) for a period. Deferred tax is recognized on temporary differences between the carrying amounts of assets and liabilities for accounting and tax purposes. Deferred income tax assets and liabilities are measured at the tax rates expected to apply when temporary
F-44
differences reverse. Current and deferred taxes are offset only when they are levied by the same tax authority, on the same entity or group of entities, and when there is a legal right to offset.
Income earned through the Company's foreign subsidiaries is generally taxed in the foreign country in which they operate. Canada also taxes the income earned through the Company's controlled foreign subsidiaries and a deduction is allowed for certain foreign taxes paid on such income.
The effective income tax rate reflected in the Condensed Consolidated Statements of Operations varies from the Canadian tax rate of 26.5 percent for the three and six months ended June 30, 2025 (June 30, 2024 – 26.5 percent) for the items outlined in the following table.
| Three months ended June 30, | Six months ended June 30, | |||||||||||||||||||||||||
| 2025 | 2024 | 2025 | 2024 | |||||||||||||||||||||||
| Income (loss) before taxes | $ | (943) | $ | (1,808) | $ | (7,612) | $ | 204 | ||||||||||||||||||
| Income tax rate | 26.5 | % | 26.5 | % | 26.5 | % | 26.5 | % | ||||||||||||||||||
| Income tax expense at Canadian statutory tax rate | (250) | (479) | (2,017) | 54 | ||||||||||||||||||||||
| Permanent differences in tax rate on income not subject to tax | 992 | (27) | 1,809 | (75) | ||||||||||||||||||||||
| Deferred tax asset not recognized | (361) | 868 | 1,769 | (3,618) | ||||||||||||||||||||||
| Effect of tax rate of foreign jurisdictions | (185) | (28) | (196) | (192) | ||||||||||||||||||||||
| Foreign accrual property income impact | (166) | (196) | (1,181) | 4,049 | ||||||||||||||||||||||
| Other | (39) | 50 | (157) | (35) | ||||||||||||||||||||||
| Income tax expense (benefit) — Asset Management | $ | (9) | $ | 189 | $ | 27 | $ | 184 | ||||||||||||||||||
Deferred tax assets
The details of income (loss) before income taxes by jurisdiction for Asset Management are as follows:
| Three months ended June 30, | Six months ended June 30, | |||||||||||||||||||||||||
| 2025 | 2024 | 2025 | 2024 | |||||||||||||||||||||||
| Canadian | $ | (4,331) | $ | (1,975) | $ | (11,240) | $ | (3,328) | ||||||||||||||||||
| Foreign | 3,389 | 167 | 3,629 | 3,532 | ||||||||||||||||||||||
| Income (loss) before taxes | $ | (943) | $ | (1,808) | $ | (7,612) | $ | 204 | ||||||||||||||||||
The details of the income tax provision by jurisdiction for Asset Management are as follows:
| Three months ended June 30, | Six months ended June 30, | |||||||||||||||||||||||||
| 2025 | 2024 | 2025 | 2024 | |||||||||||||||||||||||
| Current tax | ||||||||||||||||||||||||||
| Canadian | $ | 20 | $ | — | $ | 37 | $ | — | ||||||||||||||||||
| Foreign | 221 | 462 | 362 | 627 | ||||||||||||||||||||||
| Total current tax | 242 | 462 | 400 | 627 | ||||||||||||||||||||||
| Deferred tax | ||||||||||||||||||||||||||
| Canadian | — | — | — | — | ||||||||||||||||||||||
| Foreign | (250) | (273) | (372) | (443) | ||||||||||||||||||||||
| Total deferred tax | (250) | (273) | (372) | (443) | ||||||||||||||||||||||
| Income tax expense (benefit) — Asset Management | $ | (9) | $ | 189 | $ | 27 | $ | 184 | ||||||||||||||||||
F-45
Deferred tax assets and liabilities consists of the following temporary differences:
| June 30, 2025 | December 31, 2024 | |||||||||||||
| Assets | ||||||||||||||
| Tax benefit of loss carryforward | $ | 20,539 | $ | 20,275 | ||||||||||
| Tax benefit of expenditure pools | 14,098 | 13,415 | ||||||||||||
| Deferred acquisition costs | 6,446 | 6,009 | ||||||||||||
| Unrealized losses on remeasurement of investments | 10,943 | 10,478 | ||||||||||||
| Other assets tax value in excess of book value | 12,014 | 10,284 | ||||||||||||
| Total deferred tax assets | 64,039 | 60,461 | ||||||||||||
| Valuation allowance | (53,013) | (44,604) | ||||||||||||
| Total deferred tax assets, net of valuation allowance | $ | 11,026 | $ | 15,857 | ||||||||||
| Liabilities | ||||||||||||||
| Insurance reserves | $ | (4,813) | $ | (12,172) | ||||||||||
| Other | (3,545) | (1,389) | ||||||||||||
| Total deferred tax liabilities | $ | (8,358) | $ | (13,561) | ||||||||||
| Net deferred tax assets | $ | 2,668 | $ | 2,296 | ||||||||||
The Company considers its significant tax jurisdictions to include Canada and the United States. The Company remains subject to income tax examination in Canada for years after 2017, and U.S. federal jurisdiction for years after 2020.
Note 18. Equity
Common shares
The Company is authorized to issue an unlimited number of common shares, without par value, for unlimited consideration. The common shares are not redeemable or convertible. Dividends are declared by the Board at its discretion. Historically, the Board has declared dividends on a quarterly basis and the amount can vary from quarter to quarter.
As of June 30, 2025, there were 28,666,080 common shares issued and outstanding (June 30, 2024 – 25,797,739). The Company issued 60,082 shares (net of tax) in respect of vested RSUs (inclusive of Dividend Equivalent Units (“DEUs”)), 17,315 shares in satisfaction of debt obligations owed in connection with the provision of certain consulting services, and 2,693,071 common shares for the minority investment in Runway Growth Capital LLC (“Runway”) during the six months ended June 30, 2025. The Company issued 64,004 shares (net of tax) in respect of vested RSUs (inclusive of DEUs) during the six months ended June 30, 2024. There were no other transactions with shareholders for the three and six months ended June 30, 2025 and 2024.
Preference shares
The Company is authorized to issue an unlimited number of preference shares, without par value, in series, for unlimited consideration. There were no preference shares outstanding as of June 30, 2025 and December 31, 2024.
Dividends
Dividends to the Company's shareholders are recorded on the declaration date. The payment of any cash dividend to shareholders of the Company in the future will be at the discretion of the Board and will depend on, among other things, the financial condition, capital requirements and earnings of the Company, and any other factors that the Board may consider relevant.
The Business Corporations Act (Ontario) ("OBCA") provides that a corporation may not declare or pay a dividend if there are reasonable grounds for believing that the corporation is, or would be after the payment of the dividend, unable to pay its liabilities as they become due or the realizable value of its assets would thereby be less than the aggregate of its
F-46
liabilities and stated capital of all classes of shares of its capital. Furthermore, holders of common shares may be subject to the prior dividends rights of holders of preference shares, if any, then outstanding.
The following table reflects the distributions declared on the common shares of the Company during the six months ended June 30, 2025 and June 30, 2024:
| Dividend amount per share | Total dividend amount | |||||||||||||||||||||||||||||||
| Declaration Date | Record Date | Payment Date | CAD | USD ¹ | CAD | USD ¹ | ||||||||||||||||||||||||||
| March 13, 2025 | April 3, 2025 | April 10, 2025 | $ | 0.020 | $ | 0.014 | $ | 573 | $ | 399 | ||||||||||||||||||||||
| May 15, 2025 | May 27, 2025 | June 2, 2025 | $ | 0.020 | $ | 0.014 | $ | 573 | $ | 410 | ||||||||||||||||||||||
| $ | 1,146 | $ | 809 | |||||||||||||||||||||||||||||
| Dividend amount per share | Total dividend amount | |||||||||||||||||||||||||||||||
| Declaration Date | Record Date | Payment Date | CAD | USD ¹ | CAD | USD ¹ | ||||||||||||||||||||||||||
| March 13, 2024 | March 25, 2024 | April 2, 2024 | $ | 0.020 | $ | 0.015 | $ | 516 | $ | 383 | ||||||||||||||||||||||
| May 9, 2024 | May 22, 2024 | May 31, 2024 | $ | 0.020 | $ | 0.015 | $ | 516 | $ | 375 | ||||||||||||||||||||||
| $ | 1,032 | $ | 758 | |||||||||||||||||||||||||||||
(1)Dividends are issued and paid in CAD. For reporting purposes, amounts recorded in equity are translated to USD using the daily exchange rate on the date of declaration.
Warrants
On October 19, 2018, the Company (formerly Marret Resource Corp.) announced the completion of a plan of arrangement under the provisions of the Business Corporations Act (Ontario) pursuant to which, among other things, each common share in the capital of the Company was exchanged for one common share in the capital of the company created pursuant to the arrangement and pursuant to which the Company changed its name to Mount Logan Capital Inc. (the "Arrangement"). Upon closing of the Arrangement and in accordance with the terms of the Arrangement, the Company issued to shareholders who made an election to acquire warrants under the Arrangement warrants to acquire an aggregate of 20,468,128 common shares of the Company (the "Arrangement Warrants"). As at June 30, 2025 and December 31, 2024, the Company had 20,468,128 Arrangement Warrants outstanding, which are exercisable at any time up to October 19, 2025. As a result of a share consolidation completed on December 3, 2019, every eight (8) Arrangement Warrants entitled the holder to receive, upon exercise, one common share of the Company at a price of C$6.16 per common share. Accordingly, an aggregate of up to 2,558,516 common shares are issuable upon the exercise of the 20,468,128 outstanding Arrangement Warrants as at June 30, 2025 and December 31, 2024.
Separately on January 26, 2024, the Company issued 50 common share purchase warrants for each of the 18,752 debenture units that were issued on a non-brokered private placement (refer to Note 11. Debt obligations for further detail). Each of the debt warrants is exercisable to acquire one common share of MLC at a price of C$2.75 per share for a period of eight (8) years, from the issuance thereof, provided that the warrants are not permitted to be exercised within the first twelve (12) months from the issuance thereof. Accordingly, an aggregate of up to 937,600 common shares are issuable upon the exercise of the 937,600 outstanding debt warrants as at June 30, 2025 (December 31, 2024 - 937,600).
F-47
Accumulated other comprehensive income (loss)
| Unrealized investment gains (losses) on available-for-sale securities | Unrealized gains (losses) on hedging instruments | Remeasurement gains (losses) on future policy benefits related to discount rate | Cumulative translation adjustment | Accumulated other comprehensive income (loss) | |||||||||||||||||||||||||
| Balance at December 31, 2024 | $ | (21,318) | $ | (5,192) | $ | 85,409 | $ | (21,858) | $ | 37,041 | |||||||||||||||||||
| Other comprehensive income (loss), before reclassifications | 1,767 | 3,953 | (7,992) | — | (2,272) | ||||||||||||||||||||||||
| Less: reclassification adjustments for gains (losses) realized | 80 | (782) | — | — | (702) | ||||||||||||||||||||||||
| Less: Income tax expense (benefit) | — | — | — | — | — | ||||||||||||||||||||||||
| Balance at June 30, 2025 | $ | (19,631) | $ | (457) | $ | 77,417 | $ | (21,858) | $ | 35,471 | |||||||||||||||||||
| Unrealized investment gains (losses) on available-for-sale securities | Unrealized gains (losses) on hedging instruments | Remeasurement gains (losses) on future policy benefits related to discount rate | Cumulative translation adjustment | Accumulated other comprehensive income (loss) | |||||||||||||||||||||||||
| Balance at December 31, 2023 | $ | (28,872) | $ | — | $ | 77,816 | $ | (21,858) | $ | 27,086 | |||||||||||||||||||
| Other comprehensive income (loss), before reclassifications | 4,223 | (2,459) | 10,817 | — | 12,581 | ||||||||||||||||||||||||
| Less: reclassification adjustments for gains (losses) realized | 43 | — | — | — | 43 | ||||||||||||||||||||||||
| Less: Income tax expense (benefit) | — | — | — | — | — | ||||||||||||||||||||||||
| Balance at June 30, 2024 | $ | (24,692) | $ | (2,459) | $ | 88,633 | $ | (21,858) | $ | 39,624 | |||||||||||||||||||
Note 19. Equity based compensation
Stock option plan and performance and restricted share unit plan
On May 30, 2019, the Company’s shareholders approved (i) a stock option plan (the “Option Plan”) and (ii) the RSU Plan, which were each re-approved by shareholders of the Company on June 7, 2024. On June 7, 2024, shareholders of the Company approved certain amendments to both the Option Plan and RSU Plan to, among other things, increase the rolling limit thereunder from 10% to 15% of the common shares then issued and outstanding.
Option Plan
The Option Plan provides that the administrators may, from time to time, at their discretion, grant to directors, officers, employees and certain other service providers of the Company or its subsidiaries options to purchase common shares of the Company in connection with their employment or position. The aggregate number of common shares that are issuable under the Option Plan upon the exercise of options which have been granted and are outstanding, together with common shares that are issuable pursuant to outstanding awards and grants under any other share compensation arrangement of the Company (including the RSU Plan), shall not at any time exceed 15% of the common shares then issued and outstanding. The purchase price for any common shares underlying an option shall not be less than the fair market value of a common share on the date the option is granted, being the closing price of the common shares listed on Cboe Canada on the last trading day before the date of grant. Options granted under the Option Plan have a maximum term of 10 years from the date of grant.
There were no options or awards issued or outstanding under the Option Plan as of June 30, 2025 (December 31, 2024 – nil).
RSU Plan
The aggregate number of common shares that are issuable under the RSU Plan to pay awards which have been granted and are outstanding under the RSU Plan, together with common shares that are issuable pursuant to outstanding
F-48
awards or grants under any other share compensation arrangement of the Company (including the Option Plan), shall not exceed at any time 15% of the common shares then issued and outstanding.
RSU grants are made in the form of equity-settled awards that typically vest one-third annually beginning one year after the grant date (unless approved otherwise by the Board to vest based on specified terms over a specified period), whereby one vested RSU will be exchanged for one common share. The grant date fair value of each equity-settled RSU unit is calculated based on the grant date’s previous day closing price per common share of the Company on Cboe Canada.
The Company awarded 652,135 RSUs with a grant date fair value of $1.2 million during the six months ended June 30, 2025. No RSUs were awarded during the six months ended June 30, 2024.
For the three months ended June 30, 2025 and 2024, the Company recorded equity-based compensation expense related to RSUs awarded from profit sharing arrangements of $0.3 million and $0.1 million, respectively. For the six months ended June 30, 2025 and 2024, the Company recorded equity-based compensation expense related to RSUs awarded from profit sharing arrangements of $0.7 million and $0.1 million, respectively. As of June 30, 2025, there was $2.3 million of total unrecognized equity-based compensation expense related to unvested RSUs, which is expected to be recognized over a weighted-average term of 1.9 years. The Company has elected to account for forfeitures as they occur. Expense is recognized on a straight line basis over the life of the award.
A summary of the status of service-vesting awards granted under the RSU Plan for the six months ended June 30, 2025 is presented below:
| RSUs and DEUs Outstanding | ||||||||||||||||||||||||||||||||
| RSUs | Weighted average grant date fair value | DEUs | Weighted average grant date fair value | Total | ||||||||||||||||||||||||||||
| Unvested balance, January 1, 2025 | 1,409,780 | $ | 1.67 | 23,172 | $ | 1.73 | 1,432,952 | |||||||||||||||||||||||||
| Granted | 652,135 | 1.69 | 32,022 | 1.74 | 684,157 | |||||||||||||||||||||||||||
| Vested | (86,968) | 3.16 | (13,011) | 1.92 | (99,979) | |||||||||||||||||||||||||||
| Forfeitures | (17,098) | 1.57 | (268) | 1.59 | (17,366) | |||||||||||||||||||||||||||
| Unvested balance, June 30, 2025 | 1,957,849 | $ | 1.61 | 41,915 | $ | 1.68 | 1,999,764 | |||||||||||||||||||||||||
Note 20. Earnings per share
Basic earnings per share is calculated by dividing net income or loss attributable to common shareholders by the weighted average number of common shares outstanding during the period. Diluted earnings per share is calculated in the same manner, with further adjustments made to reflect the dilutive impact of instruments convertible into the Company’s common shares.
The Company has granted RSUs that provide the right to receive, subject to vesting during continued employment, shares of common stock pursuant to the RSU Plan. Any dividend equivalent paid to an employee on RSUs will be returned to the Company upon forfeiture of the award by the employee. Unvested RSUs that are entitled to forfeitable dividend equivalents do not qualify as participating securities and are excluded in the Company’s basic and diluted earnings per share computations. Vested RSUs qualify as participating securities and are included in the Company’s diluted earnings per share computation.
The Company also has issued warrants which are exercisable to acquire one common share at a defined exercise price.
F-49
The following table sets forth the computation of basic and diluted income (loss) per common share for the three and six months ended June 30, 2025, and June 30, 2024:
| Three months ended June 30, | Six months ended June 30, | |||||||||||||||||||||||||
| 2025 | 2024 | 2025 | 2024 | |||||||||||||||||||||||
| Basic earnings per share | ||||||||||||||||||||||||||
| Net income (loss) | $ | (934) | $ | (1,997) | $ | (7,639) | $ | 20 | ||||||||||||||||||
| Weighted-average number of common shares outstanding | 28,666,080 | 25,797,739 | 28,215,408 | 25,771,715 | ||||||||||||||||||||||
| Basic earnings per share | $ | (0.03) | $ | (0.08) | $ | (0.27) | NM | |||||||||||||||||||
| Diluted earnings per share | ||||||||||||||||||||||||||
| Net income (loss) | $ | (934) | $ | (1,997) | $ | (7,639) | $ | 20 | ||||||||||||||||||
| Weighted-average number of common shares outstanding | 28,666,080 | 25,797,739 | 28,215,408 | 25,771,715 | ||||||||||||||||||||||
| Incremental Common Shares | ||||||||||||||||||||||||||
| Assumed exercise of warrants ¹ | — | — | — | — | ||||||||||||||||||||||
| Common shares potentially issuable ² | — | — | — | 232 | ||||||||||||||||||||||
| Weighted-average number of diluted common shares outstanding | 28,666,080 | 25,797,739 | 28,215,408 | 26,003,327 | ||||||||||||||||||||||
| Diluted earnings per share | $ | (0.03) | $ | (0.08) | $ | (0.27) | NM | |||||||||||||||||||
(1)For the three and six months ended June 30, 2025 and 2024, respectively, both the Arrangement Warrants and debt warrants are excluded from the calculation of diluted earnings per share given the exercise price on both sets of warrants is greater than the average market price of the Company's common shares (i.e., they were "out of the money"), and they also would have been anti-dilutive for the three and six months ended June 30, 2025, and the three months ended June 30, 2024.
(2)For the three and six months ended June 30, 2025 and the three months ended June 30, 2024, RSUs granted were anti-dilutive and are excluded from the calculation of diluted earnings per share.
The following table summarizes the anti-dilutive securities that are excluded from the computation of diluted income (loss) per share:
| Three months ended June 30, | Six months ended June 30, | |||||||||||||||||||||||||
| 2025 | 2024 | 2025 | 2024 | |||||||||||||||||||||||
| Anti-dilutive Securities | ||||||||||||||||||||||||||
| Weighted-average number of unexcercised warrants | 3,496,116 | 3,496,116 | 3,496,116 | 3,366,613 | ||||||||||||||||||||||
| Weighted-average number RSUs outstanding, inclusive of DEUs | 1,992,743 | 204,709 | 1,960,311 | 231,612 | ||||||||||||||||||||||
| Total common shares equivalent | 5,488,859 | 3,700,825 | 5,456,427 | 3,598,225 | ||||||||||||||||||||||
Note 21. Related parties
Servicing Agreement
On November 20, 2018, the Company entered into a servicing agreement (the “Servicing Agreement”) with BC Partners Advisors L.P. ("BCPA"). Under the terms of the Servicing Agreement, BCPA as servicing agent (the "Servicing Agent") performs (or oversees, or arranges for, the performance of) the administrative services necessary for the operation of the Company, including, without limitation, office facilities, equipment, bookkeeping and recordkeeping services and such other services the Servicing Agent, subject to review by the Board, shall from time to time deem necessary or useful to perform its obligations under this Servicing Agreement. The Servicing Agent is authorized to enter into sub-administration agreements as determined to be necessary in order to carry out the administrative services.
Unless earlier terminated as described below, the Servicing Agreement will remain in effect from year-to-year if approved annually by (i) the vote of the Board and (ii) the vote of a majority of the Company’s directors who are not parties to the Servicing Agreement or a "related party" of the Servicing Agent, or of any of its affiliates. The Servicing
F-50
Agreement may be terminated at any time, without the payment of any penalty, upon 60 days’ written notice by the vote of the Board or by the Servicing Agent.
The Company reimburses BCPA for an allocable portion of compensation paid to the Company’s Chief Financial Officer, associated management personnel (based on a percentage of time such individuals devote, on an estimated basis, to the business affairs of the Company), and out-of-pocket expenses. While the Servicing Agent performs certain administrative functions for the Company, the management functions of the Company are wholly performed by the Company’s management team. For the three months ended June 30, 2025, the Company incurred administrative fees of $1.2 million (June 30, 2024 – $1.0 million). For the six months ended June 30, 2025, the Company incurred administrative fees of $2.4 million (June 30, 2024 – $1.9 million). As of June 30, 2025, administrative fees payable to BCPA was $1.9 million (December 31, 2024 – $1.2 million).
Transactions with Affiliates - servicing fees
The Company, through MLC US Holdings, a wholly-owned subsidiary of the Company, provides certain administrative services to SCIM in respect of the management of an investment fund ("ACIF") in exchange for a servicing fee. Servicing fees are determined quarterly based on an amount equal to the aggregate base management fee and incentive fees received by SCIM from ACIF in respect of such quarter, net of debt servicing expense, a quarterly fee to be retained by SCIM comprised of a specified amount, and an allocable portion of the compensation of SCIM’s investment professionals in connection with their performance of investment advisory services for ACIF (collectively, the "Retained Benefits"). In addition, SCIM is reimbursed by MLC US Holdings quarterly for certain expenses it incurs in connection with the investment advisory services provided to ACIF. Pursuant to this arrangement, the Company receives the net economic benefit derived by SCIM under the ACIF advisory agreement, subject to the holdback of the Retained Benefits and expense reimbursements. For the three months ended June 30, 2025 the Company incurred servicing fees of $0.7 million (June 30, 2024 – $1.0 million). For the six months ended June 30, 2025, the Company incurred servicing fees of $1.0 million (June 30, 2024 – $1.5 million).
The Company, through MLC US Holdings, a wholly-owned subsidiary of the Company, issued a promissory note to SCIM on October 30, 2020, with a maturity of October 30, 2040. The note’s value is not to exceed $15M and bears interest at 8.0% per annum, payable quarterly, for the first 10 years. During the second 10 years outstanding, repayments of the note shall occur in equal quarterly installment payments, bearing interest at 8.0% per annum, plus an additional 2% annually on overdue principal. As of June 30, 2025, the outstanding principal value of the note was $13.6 million (December 31, 2024: $13.6 million). For the three months ended June 30, 2025, total interest income was $0.3 million (June 30, 2024: $0.3 million). For the six months ended June 30, 2025, total interest income was $0.5 million (June 30, 2024: $0.5 million). As of June 30, 2025, the total accrued interest income receivable was $2.4 million (December 31, 2024: $1.9 million).
Potential Conflicts of Interest
The Company's senior management team is comprised of substantially the same personnel as the senior management team of BCPA, and such personnel may serve in similar or other capacities for BCPA or to future investment vehicles affiliated with BC Partners. As a result, such personnel provide investment advisory services to the Company and certain investment vehicles considered affiliates of BC Partners.
Compensation of Key Management Personnel
The Company's key management personnel are those personnel who have the authority and responsibility for planning, directing and controlling the activities of the Company. Directors (both executive and non-executive) are considered key personnel. Certain directors and officers of the Company are affiliated with BCPA. For the six months ended June 30, 2025, the Chief Executive Officer ("CEO") and Co-presidents received no cash salary or bonuses of any kind. Instead, their compensation was 100% equity-based compensation granted pursuant to the Company's security-based compensation arrangements that vest over time for services rendered. The CEO and Co-presidents had a total of 609,298 Restricted Share Units ("RSUs"), inclusive of DEUs outstanding as at June 30, 2025 (December 31, 2024 - 659,557), which vest over two to three years. There were 9,722 DEUs declared and issued to the CEO and Co-presidents during the six months ended June 30, 2025 (June 30, 2024 - 2,265). See Note 19. Equity based compensation and Note 20. Earnings per share for more information. No person or employee of the Servicing Agent or its affiliates that serves as a director of the Company receives any compensation from the Company for his or her services as a director.
F-51
Common shares held by directors and officers of the Company who are affiliated with BCPA at of June 30, 2025 were 837,003 (December 31, 2024 – 804,679).
Other Transactions with BCPA or their Affiliates
The Servicing Agent may, from time to time, pay amounts owed by the Company to third-party providers of goods or services, and the Company will subsequently reimburse the Servicing Agent for such amounts paid on its behalf. Amounts payable to the Servicing Agent are settled in the normal course of business without any formal payment terms. As of June 30, 2025, operating expenses reimbursable to BC Partners for amounts paid on behalf of the Company was $8.0 million (December 31, 2024 – $7.4 million).
The Company may, from time to time, enter into transactions in the normal course of operations with entities that are considered affiliates involved in the credit business of BCPA (“BCPA Credit Affiliates”). At June 30, 2025, Asset Management held investments with affiliates of BCPA Credit Affiliates totaling $25.0 million (December 31, 2024 – $20.9 million), and Insurance Solutions held investments with affiliates of BCPA Credit Affiliates totaling $22.0 million (December 31, 2024 – $23.7 million). On these investments, Asset Management recognized (i) interest income of $0.3 million and $0.5 million for the three and six months ended June 30, 2025 (June 30, 2024 - $0.3 million and 0.5 million) respectively, (ii) earnings on equity method investments of less than $0.1 million and $0.3 million for the three and six months ended June 30, 2025 (June 30, 2024 - $(0.1) million and $0.2 million) respectively, and (iii) dividend income on equity securities of less than $0.1 million and 0.1 million for the three and six months ended June 30, 2025 (June 30, 2024: $0.1 million and $0.2 million) respectively. On these investments, Insurance Solutions recognized (i) interest income of $0.6 million for the six months ended June 30, 2025 (June 30, 2024 - $1.3 million) and (ii) dividend income of $0.1 million for the six months ended June 30, 2025 (June 30, 2024 - less than $0.2 million).
Further, for the six months ended June 30, 2025, the Company incurred expenses of $3.5 million (June 30, 2024 - $3.6 million) to an affiliate, for third party administrative services relating to Ability for administering its long-term care block of business. As of June 30, 2025, there was a payable to this affiliate of $1.2 million (December 31, 2024 – $0.6 million).
Note 22. Segments
The Company conducts its business through two reportable segments: Asset Management and Insurance Solutions. The Company defines operating segments by type of product and business line. The Asset Management segment comprises of a single operating segment encompassing all fee generating activities. The Insurance Solutions segment consists of two product lines within the insurance business, LTC and MYGA, that are a single reportable segment.
Segment information is utilized by the Company’s chief operating decision maker (“CODM”) to assess performance and to allocate resources. The Company’s Chief Executive Officer (“CEO”) is the CODM, who is also solely responsible for decisions related to the allocation of resources on a company-wide basis.
For each segment, the CODM uses the key measure of Segment Income to allocate resources (including employees, financial or capital resources) to that segment in the annual budget and forecasting process. The performance is measured by the Company’s CODM on an unconsolidated basis because the CODM makes operating decisions and assesses the performance of each of the Company’s business segments based on financial and operating metrics and data that exclude the effects of consolidation. Each reportable segment is then responsible for managing its operating results, developing products, defining strategies for services and distributions based on the profile and needs of its business and market.
Segment Income
Segment Income is the key performance measure used by the CODM in evaluating the performance of the asset management and insurance solutions segments. The CODM uses Segment Income to make key operating decisions such as the following:
■decisions related to the allocation of resources such as staffing decisions, including hiring and locations for deployment of the new hires;
F-52
■decisions related to capital deployment such as providing capital to facilitate growth for the business and/or to facilitate expansion into new businesses;
■decisions related to expenses, such as determining annual discretionary bonuses and equity-based compensation awards to its employees and/or service providers.
Segment Income is a measure of profitability and has certain limitations in that it does not take into account certain items included under U.S. GAAP. Segment Income is the sum of (i) Fee Related Earnings and (ii) Spread Related Earnings. Segment Income excludes the effects of the consolidation of each segment, taxes and related payables, and other items unique to deriving each segment’s performance metric as explained respectively below.
Segment Income may not be comparable to similarly titled measures used by other companies and is not a measure of performance calculated in accordance with U.S. GAAP. We use Segment Income as a measure of operating performance, not as a measure of liquidity. Segment Income should not be considered in isolation or as a substitute for net income or other income data prepared in accordance with U.S. GAAP. The use of Segment Income without consideration of related U.S. GAAP measures is not adequate due to the adjustments described above. Management compensates for these limitations by using Segment Income as a supplemental measure to U.S. GAAP results, to provide a more complete understanding of our performance as management measures it. A reconciliation of Segment Income to its most directly comparable U.S. GAAP measure of income (loss) before income tax provision can be found in this footnote.
Fee Related Earnings
Fee Related Earnings (“FRE”) is a component of Segment Income that is used to assess the performance of the Asset Management segment. FRE is the sum of (i) management fees, (ii) performance fees received from certain managed funds (iii) equity investment earnings related to fee generating vehicles, and (iv) interest income attributable to investment management activity, less (a) fee-related compensation, excluding equity-based compensation, and (b) other associated operating expenses, which excludes amortization of acquisition-related intangible assets and interest and other credit facility expenses.
FRE excludes non-fee generating revenues and expenses, transaction-related charges, equity-based compensation costs, the amortization of intangible assets, the operating results of VIEs that are included in the Condensed Consolidated Financial Statements, and any other non-recurring income and expenses. In addition, FRE excludes interest and other financing costs related to the Company not attributable to any specific segment, and corporate overhead expenses incurred to support the operations of the business rather than directly fee-related. Management considers these types of costs corporate in nature, and are included only for reconciliation purposes to income (loss) before income tax (provision) benefit.
Spread Related Earnings
Spread Related Earnings (“SRE”) is a component of Segment Income that is used to assess the performance of the Insurance Solutions segment, excluding certain market volatility, which consists of investment gains (losses), other income and certain general, administrative & other expenses. For the Insurance Solutions segment, SRE equals the sum of (i) the net investment earnings on Insurance Solutions segment’s net invested assets (excluding investment earnings on funds held under reinsurance contracts and modified coinsurance agreement), less (ii) cost of funds (as described below), (iii) compensation and benefits, (iv) interest expense and (v) operating expenses.
Cost of funds includes liability costs associated with the crediting cost on MYGA liabilities as well as other liability costs. Other liability costs include DAC amortization, the cost of liabilities associated with LTC, net of reinsurance, which includes change in reserves, premiums, actual claim experience including related expenses and certain product charges related to MYGA.
F-53
The following presents financial data for the Company’s reportable segments and the reconciliation of Segment Income to Income (loss) before taxes reported in the Condensed Consolidated Statements of Operations:
| Three months ended June 30, | Six months ended June 30, | |||||||||||||||||||||||||
| 2025 | 2024 | 2025 | 2024 | |||||||||||||||||||||||
| Asset Management | ||||||||||||||||||||||||||
| Management fees | $ | 4,422 | $ | 4,354 | $ | 8,829 | $ | 8,374 | ||||||||||||||||||
| Incentive fees | 478 | 1,008 | 777 | 1,911 | ||||||||||||||||||||||
| Equity investment earnings | 42 | (57) | 324 | 167 | ||||||||||||||||||||||
| Interest income¹ | 271 | 272 | 539 | 543 | ||||||||||||||||||||||
| Fee-related compensation | (1,105) | (1,300) | (2,573) | (2,384) | ||||||||||||||||||||||
| Other operating expenses: | ||||||||||||||||||||||||||
| Administration and servicing fees | (1,205) | (1,523) | (1,938) | (2,580) | ||||||||||||||||||||||
| General, administrative and other | (666) | (593) | (1,438) | (1,668) | ||||||||||||||||||||||
| Fee related earnings | 2,237 | 2,161 | 4,520 | 4,363 | ||||||||||||||||||||||
| Insurance Solutions | ||||||||||||||||||||||||||
| Net investment income and realized gain (loss), net | 10,993 | 13,851 | 24,005 | 26,886 | ||||||||||||||||||||||
| Cost of funds | (7,354) | (7,039) | (16,673) | (10,249) | ||||||||||||||||||||||
| Compensation and benefits | (223) | (465) | (467) | (649) | ||||||||||||||||||||||
| Interest expense | (407) | (328) | (735) | (656) | ||||||||||||||||||||||
| General, administrative and other | (3,100) | (4,032) | (6,184) | (7,920) | ||||||||||||||||||||||
| Spread related earnings | (91) | 1,987 | (54) | 7,412 | ||||||||||||||||||||||
| Segment income | $ | 2,146 | $ | 4,148 | $ | 4,466 | $ | 11,775 | ||||||||||||||||||
| Asset Management Adjustments: | ||||||||||||||||||||||||||
| Intersegment management fee eliminations | $ | (1,613) | $ | (1,529) | $ | (2,780) | $ | (2,958) | ||||||||||||||||||
| Administration and servicing fees² | (607) | (429) | (1,111) | (795) | ||||||||||||||||||||||
| Transaction costs | (2,753) | 198 | (7,298) | (53) | ||||||||||||||||||||||
| Compensation and benefits² | (392) | (506) | (970) | (1,050) | ||||||||||||||||||||||
| Equity-based compensation | (219) | (43) | (416) | (92) | ||||||||||||||||||||||
| Amortization and impairment of intangible assets | (1,889) | (482) | (2,799) | (964) | ||||||||||||||||||||||
| Interest and other credit facility expenses | (1,960) | (1,661) | (3,906) | (3,363) | ||||||||||||||||||||||
| General, administrative and other² | (592) | (449) | (1,543) | (1,606) | ||||||||||||||||||||||
| Net gains (losses) from investment activities | 867 | (896) | 1,708 | (1,114) | ||||||||||||||||||||||
| Dividend income | 29 | 113 | 67 | 225 | ||||||||||||||||||||||
| Other income (loss), net | 6 | — | 305 | — | ||||||||||||||||||||||
| Insurance Solutions Adjustments: | ||||||||||||||||||||||||||
| Equity-based compensation | (120) | (24) | (257) | (51) | ||||||||||||||||||||||
| Net unrealized gains (losses) from investment activities | 4,633 | (1,611) | 4,760 | (2,180) | ||||||||||||||||||||||
| Other income | 78 | 76 | 154 | 158 | ||||||||||||||||||||||
| Intersegment management fee eliminations | 1,613 | 1,529 | 2,780 | 2,958 | ||||||||||||||||||||||
| General, administrative and other³ | (170) | (242) | (772) | (686) | ||||||||||||||||||||||
| Income (loss) before taxes | $ | (943) | $ | (1,808) | $ | (7,612) | $ | 204 | ||||||||||||||||||
(1)Represents interest income on a loan asset related to a fee generating vehicle.
(2)Represents corporate overhead allocated to each segment.
(3)Represents costs incurred by the insurance segment for purposes of U.S. GAAP reporting but not the day-to-day operations of the insurance company.
F-54
The following presents financial data for the Company’s reportable segments and the reconciliation of Segment Revenue to Total revenue reported in the Condensed Consolidated Statements of Operations:
| Three months ended June 30, | Six months ended June 30, | |||||||||||||||||||||||||
| 2025 | 2024 | 2025 | 2024 | |||||||||||||||||||||||
| Segment Revenues | ||||||||||||||||||||||||||
| Asset Management | $ | 5,214 | $ | 5,577 | $ | 10,469 | $ | 10,995 | ||||||||||||||||||
| Insurance Solutions | 10,993 | 13,851 | 24,005 | 26,886 | ||||||||||||||||||||||
| Total segment revenues | 16,207 | 19,428 | 34,474 | 37,881 | ||||||||||||||||||||||
| Asset Management Adjustments: | ||||||||||||||||||||||||||
| Intersegment management fee eliminations | (1,613) | (1,529) | (2,780) | (2,958) | ||||||||||||||||||||||
| Interest income | (271) | (272) | (539) | (543) | ||||||||||||||||||||||
| Insurance Solutions Adjustments: | ||||||||||||||||||||||||||
| Net Premiums | (4,238) | (3,717) | (8,251) | (7,330) | ||||||||||||||||||||||
| Product charges | 722 | 73 | 1,582 | 107 | ||||||||||||||||||||||
| Net gains (losses) from investment activities | 4,633 | (1,612) | 4,760 | (2,180) | ||||||||||||||||||||||
| Other income | 78 | 76 | 154 | 158 | ||||||||||||||||||||||
| Intersegment management fee eliminations | 1,613 | 1,529 | 2,780 | 2,958 | ||||||||||||||||||||||
| Total revenues | $ | 17,130 | $ | 13,976 | $ | 32,180 | $ | 28,093 | ||||||||||||||||||
The following presents financial data for the Company’s reportable segments and the reconciliation of the Company’s total reportable segment assets to total assets reported in the Condensed Consolidated Statements of Financial Position:
| As of | June 30, 2025 | December 31, 2024 | ||||||||||||
| Segments Assets | ||||||||||||||
| Asset Management | $ | 124,368 | $ | 124,377 | ||||||||||
| Insurance Solutions | 1,541,616 | 1,496,527 | ||||||||||||
| Total segment assets | 1,665,984 | 1,620,904 | ||||||||||||
| Asset Management Adjustments: | ||||||||||||||
| Intersegment investments | (56,101) | (53,601) | ||||||||||||
| Intersegment receivables | (6,816) | (5,354) | ||||||||||||
| Total assets | $ | 1,603,068 | $ | 1,561,949 | ||||||||||
Note 23. Commitments and contingencies
Investment commitments
In the normal course of business, the Company may enter into commitments to fund investments, which are not reflected in the Condensed Consolidated Financial Statements. There were $1.4 million and $38.7 million of outstanding investment commitments as of June 30, 2025 for Asset Management and Insurance Solutions, respectively (December 31, 2024 – $1.4 million and $43.2 million).
In connection with the Capitala Acquisition, ML Management issued a promissory note to CIA for $4.0 million, which pursuant to the terms in the agreement, may increase to $6.0 million, based on the maturity date asset values of a predefined list of assets held by Logan Ridge. Refer to Note 11. Debt obligations for the expected cash outflow on this liability based on the fair value as of June 30, 2025.
Contingent liabilities and litigation
The Company may be subject to lawsuits in the normal course of business. Insurance in particular is a highly regulated industry and lawsuits related to claim payments should be expected in the normal course of business. In the Asset Management business certain types of investment vehicles, especially those offered to individual investors, may subject the Company to a variety of risks, including new and greater levels of public and regulatory scrutiny, regulation, risk of litigation and reputation risk, which could materially and adversely affect the Company. Other potential lawsuits include
F-55
allegations of mis-selling in the Insurance Solutions segment, among others. The Company considers this risk to be less likely given that Ability no longer directly writes insurance policies.
Ability at different times may receive notifications of the insolvency of various insurance companies. It is expected that such insolvencies would result in a Guaranty Fund Assessment against Ability at some future date. At this time, the Company is unable to estimate the possible amounts, if any, of such assessments as no data is available from the National Organization of Life and Health Guaranty Associations in the United States. Accordingly, the Company is unable to determine the impact, if any, that such assessments may have on its financial position or results of operations.
Ability is subject to lawsuits and regulatory actions in the normal course of business that do not arise from or directly relate to claims on insurance policies. This category of business litigation typically involves, among other things, allegations of underwriting errors or misconduct and litigation related to regulatory activity. These nonclaims litigation matters are considered when determining general expense accruals are necessary. As of June 30, 2025, there were no litigation related expense accruals. Potential legal and regulatory actions are subject to inherent uncertainties, and future events could change management’s assessment of the probability or estimated amount of potential losses from pending or threatened legal and regulatory matters. A future adverse ruling by the courts in any pending cases could have a material adverse impact on the financial condition of Ability. Based on management’s best assessment at this time, Ability is adequately reserved for these cases as of June 30, 2025.
Note 24. Capital management and regulatory requirements
The Company’s capital structure consists of equity and debt. In order to maintain or adjust the capital structure, the Company actively manages its equity as capital and may adjust the amount of debt borrowings, dividends paid to shareholders, return capital to shareholders, issue new shares or sell assets. The Company's capital management framework takes into account the requirements of the Company as a whole as well as the needs and requirements of each of its subsidiaries. The Company’s officers and senior management are responsible for managing the Company’s capital and do so through quarterly portfolio management meetings and regular review of financial information.
As of June 30, 2025, the Company was in compliance with all financial covenants in its debt facilities. These include restrictions on the distribution capacity from MLC US Holdings to the Company.
Insurance capital requirements
Ability is subject to minimum capital and surplus requirements. Insurance companies typically operate in excess of such requirements. Failure to maintain such minimum capital will result in regulatory actions, including in certain circumstances regulatory takeover of the insurance company.
Ability is subject to risk based capital ("RBC") standards and other minimum capital and surplus requirements imposed by state laws. Regulatory capital requirements for Ability are determined in accordance with statutory requirements of the Nebraska Department of Insurance. The RBC requirement is a statutory minimum level of capital that is based on multiple factors including: an insurance company's size, and the inherent riskiness of its financial assets, liabilities and operations. That is, the company must hold capital in proportion to its risk. The RBC formula is intended to measure the adequacy of the insurance company’s statutory surplus in relation to the risks inherent in its business. The RBC formula requires higher surplus in relation to items deemed to have higher risk. Regulatory action is triggered beginning at 200% RBC and below. The minimum RBC ratio for Ability is 200% and Ability must have a ratio in excess of 300% to be able to reinsure new business. Ability’s RBC ratio is tested annually at the end of Ability’s financial year and estimated on a quarterly basis. When calculated at December 31, 2024 it was 325% which was in excess of the minimum requirement. From time to time during a particular financial year, Ability may take steps to increase its RBC ratio to ensure it remains above the minimum requirement or exceeds the ratio required to write new business, which steps may include, among other things, securing additional funding. Ability’s minimum capital requirements do not require a minimum level of cash to be held. Ability does not have to include cash as part of its regulatory capital provided the minimum capital requirements are satisfied.
Insurance subsidiary dividend restrictions
Ability’s statutory statements are presented on the basis of accounting practices determined by the Nebraska Department of Insurance (“NEDOI”). The NEDOI recognizes only permits and/or prescribes certain statutory accounting practices determining and reporting the financial condition and results of operations of an insurance company and for
F-56
determining its solvency under insurance law. The amount of dividends that Ability may pay in a twelve-month period, without prior approval by Ability, is restricted by the laws of Nebraska.
Under Nebraska law, dividends payable from Ability's unassigned funds during any twelve-month period without prior approval of the state’s Insurance Director are limited to the greater of 10% of Ability’s surplus as shown on the immediately preceding calendar year’s statutory financial statement on file with the NEDOI or 100% net gain from operations for the prior calendar year. Any dividend in excess of such limitation must be approved by the Insurance Director. Based on these restrictions, Ability could not pay any dividends to its parent absent regulatory approval as of each of June 30, 2025 and December 31, 2024.
Note 25. Concentration of Risks
Our current operations subject us to the following concentrations of risk:
Insurance Solutions
Historically, we have assumed our MYGA products, which is a part of our insurance operations, from two insurance companies, ACL and SSL. We have made a decision to no longer assume business from ACL and SSL as of June 30, 2024. However, the Company will continue to earn investment income from the cash proceeds of the existing MYGA contracts and the holders will continue to be a diversified base of numerous individuals. Effective March 31, 2025, Ability entered a new reinsurance treaty for additional MYGA with National Security Group (“NSG”), further diversifying its reinsurance partners.
Certain concentrations of credit risk related to reinsurance recoverable exist with the insurance organizations listed in the table below:
| As at June 30, 2025 | A.M. Best credit rating | Net reinsurance recoverable ¹ | Funds withheld payable | Net reinsurance credit exposure | ||||||||||||||||||||||
| Medico Insurance Company | A | $ | 4,404 | $ | — | $ | 4,404 | |||||||||||||||||||
| Front Street Re | Not Rated | 271,554 | 237,281 | 34,273 | ||||||||||||||||||||||
| Vista Life and Casualty Reinsurance Co | Not Rated | 179,142 | 188,032 | — | ||||||||||||||||||||||
| Total | $ | 455,100 | $ | 425,313 | $ | 38,677 | ||||||||||||||||||||
| As at December 31, 2024 | A.M. Best credit rating | Net reinsurance recoverable ¹ | Funds withheld payable | Net reinsurance credit exposure | ||||||||||||||||||||||
| Medico Insurance Company | A | $ | 4,376 | $ | — | $ | 4,376 | |||||||||||||||||||
| Front Street Re | Not Rated | 266,629 | 239,918 | 26,711 | ||||||||||||||||||||||
| Vista Life and Casualty Reinsurance Co | Not Rated | 179,220 | 190,771 | — | ||||||||||||||||||||||
| Total | $ | 450,225 | $ | 430,689 | $ | 31,087 | ||||||||||||||||||||
(1)Includes credit loss allowance of $1.0 million and $0.8 million as of June 30, 2025 and December 31, 2024, respectively, held against reinsurance recoverable.
F-57
Further, our Insurance Solutions segment has the following investment concentration risk:
| June 30, 2025 | ||||||||||||||
| Fair value | % of total | |||||||||||||
| Insurance Solutions | ||||||||||||||
| United States | $ | 649,944 | 70 | % | ||||||||||
| Cayman Islands | 227,093 | 24 | % | |||||||||||
| Other¹ | 49,239 | 5 | % | |||||||||||
| Total insurance solutions | 926,276 | 100 | % | |||||||||||
| Insurance Solutions consolidated VIEs | ||||||||||||||
| United States | 123,160 | 95 | % | |||||||||||
| Other² | 5,893 | 5 | % | |||||||||||
| Total insurance solutions consolidated VIEs | 129,053 | 100 | % | |||||||||||
| Total | $ | 1,055,329 | ||||||||||||
(1) Other consists of nominal investments primarily in Bermuda, Canada, and Cayman Islands.
(2) Other consists of nominal investments primarily in Ireland and Canada.
| December 31, 2024 | ||||||||||||||
| Fair value | % of total | |||||||||||||
| Insurance Solutions | ||||||||||||||
| United States | $ | 643,438 | 70 | % | ||||||||||
| Canada | 6,579 | 1 | % | |||||||||||
| Other¹ | 265,539 | 29 | % | |||||||||||
| Total insurance solutions | 915,556 | 100 | % | |||||||||||
| Insurance Solutions consolidated VIEs | ||||||||||||||
| United States | 120,144 | 95 | % | |||||||||||
| Canada | 1,075 | 1 | % | |||||||||||
| Other | 4,679 | 4 | % | |||||||||||
| Total insurance solutions consolidated VIEs | 125,898 | 100 | % | |||||||||||
| Total | $ | 1,041,454 | ||||||||||||
(1) Other consists of nominal investments primarily in Cayman Islands, Bermuda, and United Kingdom.
The Asset Management segment does not have meaningful investment concentration risk.
Note 26. Subsequent events
Management of the Company has evaluated subsequent events through the date these financial statements were issued. Based upon this evaluation, management has determined there were no items requiring adjustment of the financial statements. Management does note the following:
On July 2, 2025, the Company completed a series of transactions pursuant to which: (i) first, it sold its then-existing minority stake in a certain Canadian asset manager for cash consideration equal to $617,285; (ii) second, it purchased a minority stake in the capital of such Canadian asset manager and, in consideration therefor, the Company issued 516,372 common shares in the capital of the Company to the vendor thereof; and (iii) finally, the Company sold its minority stake acquired under (ii) to a third party purchaser thereof for cash consideration equal to $1,187,656.
On July 15, 2025, Portman Ridge Finance Corporation (NASDAQ: PTMN) (“Portman Ridge”) announced the closing of the merger of Logan Ridge Finance Corporation (NASDAQ: LRFC) (“Logan Ridge”). The Company, through ML Management, previously acquired an investment management agreement (“IMA”) through an asset purchase that resulted in ML Management becoming the investment advisor of Logan Ridge. Under the Logan Ridge IMA, ML Management has been entitled to a fee for investment advisory and management services consisting of two components - a 1.75% annual base management fee based upon gross assets and an incentive fee tied to performance. At the reporting date of June 30, 2025, the Company recognized the IMA as an indefinite life intangible asset, and recognized management fees
F-58
earned and not subject to reversal for the quarter. The merging of Logan Ridge into Portman Ridge results in existing IMA agreements being terminated and therefore, the Company's management fee stream from Logan Ridge ceasing. This constitutes an impairment indicator on the IMA, however is a non-adjusting subsequent event. An impairment loss of $19.2 million will be taken in the quarter ended September 30, 2025. The merger was still subject to Board approval dependent on various factors that made the event not a condition that existed at the end of the reporting period, but reflects circumstances that arose subsequently upon closing. In connection with the merger, the Company through Mount Logan Management, also entered into an agreement with Logan Ridge pursuant to which, contingent upon the closing of the merger, as Logan Ridge's investment adviser, Mount Logan Management will finance a pre-closing cash dividend to Logan Ridge shareholders. On July 25, 2025, this cash dividend was paid.
On July 15, 2025, the Company issued 122,578 common shares of the Company (net of shares withheld for tax) to settle vested restricted share units and dividend equivalents under the RSU Plan.
On August 7, 2025, the Board declared a cash dividend in the amount of C$0.02 per common share which was paid on August 25, 2025 to shareholders of record on August 19, 2025.
On September 12, 2025, the Company completed the all-stock business combination with 180 Degree Capital Corp. (NASDAQ: TURN) (“180 Degree Capital”). The combined company will operate under the name Mount Logan Capital Inc. (“New Mount Logan” or “MLCI”), a Delaware corporation, and has begun trading on The Nasdaq Capital Market on September 15, 2025, under the ticker symbol “MLCI”.
F-59
Item 2. MANAGEMENT’S DISCUSSION AND ANALYSIS OF FINANCIAL CONDITION AND RESULTS OF OPERATIONS OF MOUNT LOGAN
The following discussion should be read in conjunction with Mount Logan Capital Inc.'s condensed consolidated financial statements and the related notes within this quarterly report. This discussion contains forward-looking statements that are subject to known and unknown risks and uncertainties. Actual results and the timing of events may differ significantly from those expressed or implied in such forward-looking statements due to a number of factors, including those included in the section entitled “Risk Factors” in the proxy statement/prospectus filed with the Securities and Exchange Commission (“SEC”) pursuant to Rule 424(b) on July 11, 2025 (the “Joint Proxy Statement/Prospectus”) and in the Company’s other more recent filings with the SEC. The highlights listed below have had significant effects on many items within our condensed consolidated financial statements and affect the comparison of the current period’s activity with those of prior periods.
Unless the context otherwise requires, (i) all references herein following the closing of the Business Combination (as defined in the Joint Proxy Statement/Prospectus) on September 12, 2025 to “we,” “us,” “our,” the “Company,” and “Mount Logan” refer to Mount Logan Capital Inc. (formerly, Yukon New Parent, Inc.), as the registrant, and its consolidated subsidiaries and (ii) all references prior to the closing refer to Legacy Mount Logan (as defined in the Joint Proxy Statement/Prospectus).
Nature of Business
General
Mount Logan’s Business
Mount Logan, together with its consolidated subsidiaries is an alternative asset management and insurance solutions company. Mount Logan manages its business through two business segments: Asset Management and Insurance Solutions. Its Asset Management segment is focused on investing in and actively managing credit investment opportunities in North America through its wholly-owned subsidiary Mount Logan Management LLC (“ML Management”). The Insurance Solutions segment is conducted by Ability Insurance Company (“Ability”), a Nebraska domiciled insurer, that specializes in reinsuring annuity products for the increasing number of individuals seeking to fund retirement needs. Ability also holds a run-off book of long-term care policies. As of June 30, 2025, Mount Logan had a team of 27 full time employees.
Asset Management
Our Asset Management segment focuses on generating recurring asset management fee streams across a variety of credit investing strategies. Mount Logan raises, invests and manages funds, accounts and other vehicles with an emphasis on private credit. As of June 30, 2025, Mount Logan had a total AUM of $2.3 billion.
As an alternative asset manager, through Mount Logan’s wholly and partially owned SEC-registered investment advisers (“RIAs”), Mount Logan earns management and incentive fees for providing investment advisory and management services to multiple diversified investment vehicles, which include Mount Logan’s Insurance Solutions segment. The majority of these vehicles are permanent or semi-permanent capital, generating recurring management and fee-related performance fees from indefinite term vehicles, that are measured and received on a recurring basis, primarily focused on North American and European direct and indirect private loan origination in the middle-market across the capital structure, as well as corporate credit, specialty finance, and other mandates across managed accounts and CLOs. Mount Logan benefits from its investment in and expansion into high-growth areas of private credit and private solutions investing, including asset-backed finance, opportunistic credit, and venture and growth lending. Beyond participation in the traditional primary and secondary credit markets, through Mount Logan’s origination and corporate solutions capabilities, Mount Logan seeks to originate assets with attractive risk-adjusted returns, in the funds Mount Logan manages, through the employment of rigorous and deep diligence on the opportunities Mount Logan assesses.
Through Mount Logan’s RIAs, Mount Logan seeks to invest in well-established middle market businesses that operate across a wide range of industries (i.e., no concentration in any one industry). Mount Logan employs fundamental credit analysis, targeting investments in businesses with relatively low levels of cyclicality and operating risk. Mount Logan has experience managing levered vehicles, both public and private, and seek to enhance returns through the prudent use of leverage with a conservative approach that prioritizes downside protection and capital preservation. Mount Logan
believes this strategy and approach offers attractive risk-adjusted returns with lower volatility featuring the potential for fewer defaults and greater resilience through market cycles.
The amount of fees charged for managing these assets depends on the underlying investment strategy, vehicle being managed, liquidity profile, and, ultimately, Mount Logan’s ability to generate returns for Mount Logan’s clients. After expenses associated with generating fee-related revenues, Mount Logan measures the resulting earnings stream “Fee Related Earnings” or “FRE”, which represents the primary performance measure for the Asset Management segment. FRE is the sum of (i) management fees, (ii) performance fees received from certain managed funds (iii) equity investment earnings related to fee generating vehicles, and (iv) interest income attributable to investment management activity, less (a) fee-related compensation, excluding equity-based compensation, and (b) other associated operating expenses, which excludes amortization of acquisition-related intangible assets and interest and other credit facility expenses. FRE excludes non-fee generating revenues and expenses, transaction-related charges, equity-based compensation costs, the amortization of intangible assets, the operating results of VIEs that are included in the consolidated financial statements, and any other non-recurring income and expenses. In addition, FRE excludes interest and other financing costs related to the Company not attributable to any specific segment, and corporate overhead expenses incurred to support the operations of the business rather than directly fee-related. Management considers these types of costs corporate in nature, and are included only for reconciliation purposes to income (loss) before income tax (provision) benefit.
The Asset Management segment also holds minority interests in a Canadian asset manager and in Sierra Crest Investment Management ("SCIM"), which manages BCP Investment Corporation (“BCIC”), formerly known as Portman Ridge Finance Corp. ("Portman"), a United States business development company, and Alternative Credit Income Fund ("ACIF"), a closed-end interval fund that invests in a portfolio of public and private credit investments. SCIM is majority owned by BCPA.
Insurance Solutions
Mount Logan’s Insurance Solutions segment is operated by Ability, a Nebraska domiciled insurer and reinsurer of long-term care ("LTC") policies and retirement savings products, licensed in 42 states and the District of Columbia. Upon closing of the acquisition of Ability in late 2021, ML Management entered into an investment management agreement with Ability (the "Ability IMA") to manage certain of Ability’s assets that are within the scope of ML Management’s expertise in providing investment management advisory services (the assets of Ability managed by ML Management referred to herein as the "Managed Ability Portfolio"). In the second quarter of 2022, management began to implement its plan to expand and diversify the Insurance Solutions business, including ceasing to insure new long-term care risk and, instead, reinsuring multi-year guaranteed annuity ("MYGA") policies. The Insurance Solutions segment also includes the economic benefits of the three Cornhusker CLOs (collectively, the "Cornhusker CLOs"), which represent consolidated variable interest entities ("VIEs"). Annuity policies are contracts with insurers where individuals agree to pay a certain amount of money, either in a lump sum or through installments, which entitles them to receive a series of payments at a future date.
Long-term care insurance policies reimburse policyholders a daily amount, upon meeting certain requirements, for services to assist with daily living as they age. Ability's long-term care portfolio's morbidity risk has been largely reinsured to third-parties.
A reinsurance contract is a type of insurance contract that is issued by an entity (the reinsurer) to compensate another entity (the cedant) for claims arising from insurance contract(s) issued by the cedant.
Consistent with the overall business strategy, Ability assumes certain policy risks written by other insurance companies and cedes insurance risks to reinsurers. Reinsurance accounting is applied for reinsurance transactions when risk transfer provisions have been met. Ability reviews all contractual features, particularly those that may limit the amount of insurance risk to which the reinsurer is subject or features that delay the timely reimbursement of claims. Ability does not have any assumed or ceded reinsurance contracts for the LTC line of business that do not meet risk transfer requirements. The MYGA line of business does not meet the risk requirements to qualify as an insurance contract and is therefore considered an investment contract.
Ability uses ceded reinsurance contracts in the normal course of business to manage its risk exposure. For each of its reinsurance agreements, cessions under reinsurance agreements do not discharge Ability’s obligations as the primary insurer. Reinsurance assets represent the benefit derived from reinsurance agreements in force at the reporting date, considering the financial condition of the reinsurer. Amounts recoverable from reinsurers are estimated in accordance with
the terms of the relevant reinsurance contract and historical reinsurance recovery information. Amounts recoverable from reinsurers are based on what Ability believes are reasonable estimates and the balance is reported as an asset in the Insurance section of the Consolidated Statements of Financial Position. However, the ultimate amount of the reinsurance recoverable is not known until all claims are settled.
Mount Logan provides a full suite of services for Ability's investment portfolio, including direct investment management, asset allocation, mergers and acquisitions asset diligence and certain operational support services, including investment compliance, tax, legal and risk management support. Mount Logan’s Insurance Solutions business focuses on generating spread income by combining the two core competencies of (1) sourcing long-term, persistent liabilities through reinsurance treaties and (2) using the scale and reach of Mount Logan’s Asset Management business to actively source or originate assets with Ability's preferred risk and return characteristics. Ability's investment philosophy is to invest a portion of its assets in securities that earn an incremental yield by taking measured liquidity and complexity risk and capitalize on its long-dated, persistent liability profile to prudently achieve higher net investment earned rates, rather than assuming incremental credit risk. Because Ability maintains discipline in reinsuring attractively priced liabilities, it has the ability to invest in a broad range of high-quality assets to generate attractive earnings.
Mount Logan uses Spread Related Earnings (“SRE”) to assess the performance of the Insurance Solutions segment. SRE is a component of Segment Income that is used to assess the performance of the Insurance Solutions segment, excluding certain market volatility, which consists of investment gains (losses), other income and certain general, administrative & other expenses. For the Insurance Solutions segment, SRE equals the sum of (i) the net investment earnings on Insurance Solutions segment’s net invested assets (excluding investment earnings on funds held under reinsurance contracts and modified coinsurance agreement), less (ii) cost of funds (as described below), (iii) compensation and benefits, (iv) interest expense and (v) operating expenses. SRE represents the difference between actual earnings generated on the assets and investments made and the interest or crediting rate guaranteed to policyholders or participants. Rather than increasing allocations to higher risk securities to increase yields, or returns, on the assets invested, Ability and ML Management focus on proprietary origination of high-quality, predominantly senior secured loans and assets, which Mount Logan believes reduce downside risk.
The diagram below depicts Mount Logan’s organizational structure as of June 30, 2025:
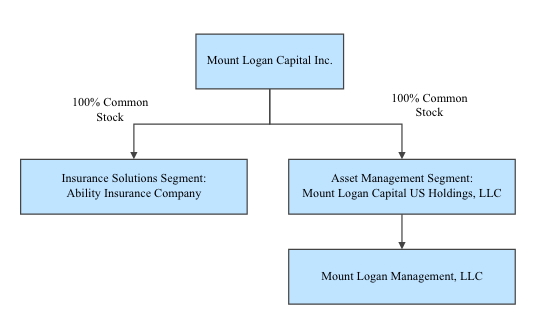
Note: The organizational structure chart above depicts a simplified version of the Mount Logan structure. It does not include all legal entities in the structure.
Business Environment
Industry Trends and Market Conditions
Mount Logan’s asset management and insurance solutions businesses are affected by the conditions in the political environment and financial markets and economic conditions of the United States, such as changes in interest rates, availability of credit, and inflation rates (including persistent inflation). These conditions can significantly impact the
performance of Mount Logan’s business, including, but not limited to, the valuation of investments, including those of the vehicles Mount Logan manages, and related income Mount Logan may recognize.
Mount Logan carefully monitors economic and market conditions that could potentially give rise to market volatility and affect its business operations, which include inflation and benchmark interest rates. According to the U.S. Bureau of Labor Statistics, the annual U.S. inflation rate increased slightly from 2.4% as of March 31, 2025 to 2.7% as of June 30, 2025. This heightening of inflation was part of a broader trend of increasing inflationary pressures. The Federal Reserve finished the second quarter of 2025 with a benchmark interest rate target range of 4.25% to 4.5%, unchanged from its December 2024 meeting. While the Federal Reserve in the United States and central banks in other countries have begun to cut interest rates as inflation rates have gradually weakened, they may raise rates again in the future due to ongoing inflation concerns. This potential increase, combined with reduced government spending and financial market volatility, could further elevate economic uncertainty and associated risks. Additionally, interest rate hikes or other government measures aimed at curbing inflation might lead to recessionary pressures globally. Such a recession could significantly and adversely impact Mount Logan’s business, financial condition, operational results, liquidity, and cash flows.
Moreover, Ability is materially affected by conditions in the capital markets and the U.S. economy generally. Actual or perceived stressed conditions, volatility and disruptions in financial asset classes or various capital and credit markets may have an adverse effect on Mount Logan’s insurance business because such conditions may decrease the returns on, and value of, its investment portfolio.
Interest Rate Environment
Medium-term rates generally declined while long-term rates remained relatively stable between the first and second quarter of 2025, with the U.S. 10-year Treasury yield at 4.24% as of June 30, 2025 compared to 4.23% as of March 31, 2025. Short term rates remained relatively flat in the second quarter of 2025, with the 3-month secured overnight financing rate at 4.29% as of June 30, 2025 and March 31, 202,5 respectively.
With respect to the Insurance Solutions segment, Ability's investment portfolio consists predominantly of fixed maturity investments. Both rising and declining interest rates can negatively affect the income Ability derives from these interest rate spreads. During periods of rising interest rates, Ability may be contractually obligated to reimburse its clients for the greater amounts they credit on certain interest-sensitive products. However, Ability may not have the ability to immediately acquire investments with interest rates sufficient to offset the increased crediting rates on its reinsurance contracts. During periods of falling interest rates, Ability’s investment earnings will be lower because new investments in fixed maturity securities will likely bear lower interest rates. Ability may not be able to fully offset the decline in investment earnings with lower crediting rates on underlying annuity products related to certain of its reinsurance contracts. Higher interest rates may result in increased surrenders on interest-based products of Ability’s clients, which may affect its fees and earnings on those products. Lower interest rates may result in lower sales of certain insurance and investment products of Ability’s clients, which would reduce the demand for its reinsurance of these products. If interest rates remain low for an extended period, it may adversely affect Ability’s cash flows, financial condition and results of operations. Ability addresses interest rate risk through managing the duration of the liabilities it sources with assets it acquires through asset/liability management (“ALM”) programs. As part of its investment strategy, Ability purchases floating rate investments, which are expected to perform well in a rising interest rate environment and are expected to underperform in a declining rate environment. Ability manages its floating interest rate risk in a declining rate environment through hedging activity.
As of June 30, 2025, Ability's net invested asset portfolio included $378 million of floating rate investments, or 50% of its net invested assets. In periods of prolonged low interest rates, the net investment spread may be negatively impacted by reduced investment income to the extent that Ability is unable to adequately reduce policyholder crediting rates due to policyholder guarantees in the form of minimum crediting rates or otherwise due to market conditions. A significant majority of the MYGA policies Ability reinsures have crediting rates that reset upon renewal. While Ability has the contractual right to not accept the renewals, its willingness to do so may be limited by competitive pressures.
Significant interest rate risk may arise from mismatches in the timing of cash flows from Ability’s assets and liabilities. Management of interest rate risk at the company-wide level, and at the various operating company levels, is one of the main risk management activities in which MLC senior management engages.
Interest rate sensitivity
The following table summarizes the potential impact on net income of hypothetical base rate changes in interest rates on Mount Logan’s debt investments, future policy benefits, and interest rate swaps assuming a parallel shift in the yield curve, with all other variables remaining constant for the Insurance Solutions segment. The impact of interest rates sensitivity on the Asset Management segment is immaterial.
| As at | June 30, 2025 | December 31, 2024 | |||||||||
| 50 basis point increase ¹ | $ | 955 | $ | 1,911 | |||||||
| 50 basis point decrease ¹ | (955) | (1,911) | |||||||||
(A)Losses are presented in brackets and gains are presented as positive numbers
Actual results may differ significantly from these sensitivity analyses. As such, the sensitivities should only be viewed as directional estimates of the underlying sensitivities for the respective factors based on the assumptions outlined above.
During the first quarter of 2024, Mount Logan entered into interest rate swaps to economically hedge fair value interest rate risk on floating rate debt investments. Mount Logan does not designate derivatives (interest rate swaps) as hedging instruments under a fair value hedge accounting model. Derivatives are initially measured at fair value with subsequent changes therein recognized in the Consolidated Statements of Comprehensive Income (Loss). Mount Logan's derivative instruments are disclosed below:
| As at June 30, 2025 | Notional | Derivative assets | Derivative liabilities | ||||||||||||||
| Interest rate swaps | $ | 187,000 | $ | — | $ | 457 | |||||||||||
| Total | 187,000 | — | 457 | ||||||||||||||
| As at December 31, 2024 | Notional | Derivative assets | Derivative liabilities | ||||||||||||||
| Interest rate swaps | $ | 187,000 | $ | — | $ | 5,192 | |||||||||||
| Total | 187,000 | — | 5,192 | ||||||||||||||
The interest rate swaps are recorded in the Consolidated Statement of Financial Position as "Derivatives" within the Insurance Solutions segment with the mark-to-market changes in fair value being recorded as part of "Net gains (losses) from investment activities" within the Insurance Solutions segment on the Consolidated Statement of Comprehensive Income.
Restricted cash posted as collateral consists of cash deposited at a bank that is pledged as collateral in connection with the interest rate swaps. The table below represents the cash posted as collateral associated with open derivative positions:
| As at | June 30, 2025 | December 31, 2024 | |||||||||
| Restricted cash posted as collateral | $ | 11,258 | $ | 15,716 | |||||||
| Total | 11,258 | 15,716 | |||||||||
Overview of Results of Operations
Financial Measures under U.S. GAAP - Asset Management
The following discussion of financial measures under U.S. GAAP is based on Mount Logan's Asset Management business as of June 30, 2025.
Revenues
Management fees
Mount Logan provides investment management services to investment funds, CLOs, managed accounts and other vehicles in exchange for a management fee. The significant growth of assets Mount Logan manages has had a positive effect on Mount Logan’s revenues. Management fees are determined quarterly using an annual rate which are generally based upon (i) a percentage of the capital committed during the commitment period, and thereafter based on the remaining invested capital of unrealized investments, or (ii) net asset value, gross assets, or as otherwise provided in the respective agreements. Management fees are recognized over time, during the period in which the related services are performed.
Incentive fees
Mount Logan provides investment management services to investment funds, CLOs, managed accounts and other vehicles in exchange for a management fee, as discussed above and, in some cases an incentive fee, a type of performance revenue. The incentive fee consists of two parts: (i) an income incentive fee which is based on pre-incentive fee net investment income in excess of a hurdle rate and (ii) a capital gains incentive fee which is based on cumulative realized capital gains and losses and unrealized capital depreciation. Incentive fees are considered a form of variable consideration as they are based on the fund achieving certain investment return hurdles. Accordingly, the recognition of such fee is deferred until it is probable that a significant reversal in the amount of cumulative revenue will not occur, which is generally upon liquidation of the investment fund.
The following table summarizes Mount Logan’s (i) management fees and (ii) incentive fees by fee generating vehicle:
| As of June 30, | As of June 30, | For the three months ended | For the three months ended | Quarter on Quarter change in Total Fees | ||||||||||||||||||||||||||||||||||||||||||||||||||||
| 2025 | 2024 | 2025 | 2024 | June 30, 2025 | June 30, 2024 | |||||||||||||||||||||||||||||||||||||||||||||||||||
Management Fees Receivable 7 | Incentive Fees Receivable 7 | Management Fees | Incentive Fees | Total Fees | Management Fees | Incentive Fees | Total Fees | $ Change | % Change | |||||||||||||||||||||||||||||||||||||||||||||||
| Fee Generating Vehicle | ||||||||||||||||||||||||||||||||||||||||||||||||||||||||
Ability (including consolidated VIEs) 1 | $ | 1,094 | $ | 522 | $ | — | $ | — | $ | 1,613 | $ | — | $ | 1,613 | $ | 1,529 | $ | — | $ | 1,529 | $ | 84 | 6 | % | ||||||||||||||||||||||||||||||||
BDCs 2 | 799 | 909 | — | — | 799 | — | 799 | 909 | — | 909 | (110) | -12 | % | |||||||||||||||||||||||||||||||||||||||||||
CLOs 3 | 989 | 818 | — | — | 714 | — | 714 | 818 | — | 818 | (104) | -13 | % | |||||||||||||||||||||||||||||||||||||||||||
Interval Funds 4 | 297 | 65 | 479 | 400 | 439 | 479 | 917 | 180 | 400 | 580 | 337 | 58 | % | |||||||||||||||||||||||||||||||||||||||||||
Ovation Funds 5 | 180 | 273 | — | 413 | 517 | — | 517 | 733 | 607 | 1,340 | (823) | -61 | % | |||||||||||||||||||||||||||||||||||||||||||
Other 6 | $ | 192 | $ | 67 | $ | — | $ | — | $ | 340 | $ | — | $ | 340 | $ | 186 | $ | — | $ | 186 | $ | 154 | 83 | % | ||||||||||||||||||||||||||||||||
| Total Fees | $ | 3,552 | $ | 2,653 | $ | 479 | $ | 814 | $ | 4,422 | $ | 479 | $ | 4,901 | $ | 4,354 | $ | 1,007 | $ | 5,361 | $ | (461) | -9 | % | ||||||||||||||||||||||||||||||||
| As of June 30, | As of June 30, | For the six months ended | For the six months ended | Year on Year change in Total Fees | ||||||||||||||||||||||||||||||||||||||||||||||||||||
| 2025 | 2024 | 2025 | 2024 | June 30, 2025 | June 30, 2024 | |||||||||||||||||||||||||||||||||||||||||||||||||||
Management Fees Receivable 7 | Incentive Fees Receivable 7 | Management Fees | Incentive Fees | Total Fees | Management Fees | Incentive Fees | Total Fees | $ Change | % Change | |||||||||||||||||||||||||||||||||||||||||||||||
| Fee Generating Vehicle | ||||||||||||||||||||||||||||||||||||||||||||||||||||||||
Ability (including consolidated VIEs) 1 | $ | 1,094 | $ | 522 | $ | — | $ | — | $ | 2,780 | $ | — | $ | 2,780 | $ | 2,958 | $ | — | $ | 2,958 | $ | (178) | -6 | % | ||||||||||||||||||||||||||||||||
BDCs 2 | 799 | 909 | — | — | 1,605 | — | 1,605 | 1,802 | — | 1,802 | (197) | -11 | % | |||||||||||||||||||||||||||||||||||||||||||
CLOs 3 | 989 | 818 | — | — | 1,463 | — | 1,463 | 1,490 | — | 1,490 | (26) | -2 | % | |||||||||||||||||||||||||||||||||||||||||||
Interval Funds 4 | 297 | 65 | 479 | 400 | 1,236 | 777 | 2,013 | 321 | 671 | 992 | 1,021 | 103 | % | |||||||||||||||||||||||||||||||||||||||||||
Ovation Funds 5 | 180 | 273 | — | 413 | 1,166 | — | 1,166 | 1,496 | 1,240 | 2,736 | (1,570) | -57 | % | |||||||||||||||||||||||||||||||||||||||||||
Other 6 | $ | 192 | $ | 67 | $ | — | $ | — | $ | 579 | $ | — | $ | 579 | $ | 307 | $ | — | $ | 307 | $ | 272 | 89 | % | ||||||||||||||||||||||||||||||||
| Total Fees | $ | 3,552 | $ | 2,653 | $ | 479 | $ | 814 | $ | 8,829 | $ | 777 | $ | 9,606 | $ | 8,374 | $ | 1,911 | $ | 10,284 | $ | (678) | -7 | % | ||||||||||||||||||||||||||||||||
(1)ML Management earns a base management fee of 1% on the average statutory book value of the portion of Ability’s investments it manages. Management fees earned by ML Management from Ability are eliminated on consolidation.
(2)ML Management earns a base management fee of 1.75% on the gross assets of Logan Ridge Finance Corporation. Management fees earned indirectly through ML Management’s 24.99% interest in SCIM, which is the manager of Portman, are excluded as management fee revenue, but are paid as cash distributions from SCIM.
(3)ML Management as the adviser to two CLOs, 2018-01 and 2019-01, earns senior and subordinated management fees on these vehicles, calculated on the outstanding collateral balance. CLO 2018-1 earns 0.25% senior and 0.35% subordinated fees, and 2019-1 earns 0.25% senior and 0.25% subordinated fees. These rates are fixed for the life of the transaction and are not subject to repricing.
(4)ML Management is the adviser to OCIF and earns management and incentive fees directly from this fund. Base management fees are earned at 1.25% of gross assets. Incentive fees are realized when the fund reaches a hurdle rate of return each quarter, based on the pre-incentive fee net investment income. When OCIF’s pre-incentive net investment income – i.e. interest income, dividend income and any other income accrued during the calendar quarter, less OCIF’s operating expenses for the quarter – exceeds the hurdle rate of return on OCIF’s adjusted capital of 1.5% (or 6% annualized), ML Management earns an incentive fee at 15% of the pre-incentive fee net investment income. All incentive fees recognized are considered realized as they are calculated and payable quarterly in arrears based on the pre-incentive fee net investment income for the immediately preceding calendar quarter. All recorded incentive fees have been subsequently received in cash. Separately, Mount Logan receives the economics of ACIF, which is an interval fund advised by SCIM, via a servicing agreement with SCIM over ACIF. The SCIM servicing fee over ACIF is excluded.
(5)Mount Logan as the general partner accrues base management fees, calculated monthly, due and payable either monthly or quarterly in arrears at 0.125% of the net assets in the Ovation funds. Incentive fees, calculated monthly, due and payable quarterly in arrears, are calculated as 10% of pre-incentive fee distributable income. If pre-incentive fee distributable income amounts do not exceed 0% in any fiscal quarter, such shortfall (a “High Watermark Shortfall”) will carry forward to subsequent quarters. No incentive fees are payable to the general partner in any fiscal quarter in which a High Watermark Shortfall exists.
(6)Consists of several small, closed end private funds which are sub-advised by ML Management at 1% of net assets, as well as management fees earned from a portfolio of Vista Life & Casualty Reinsurance Company’s (Vista) assets to which ML Management was appointed as the investment manager of, effective March 2025, at a rate of 1% on the average statutory book value of investments under management. Only fees which are crystallized and not subject to reversal are recognized and included.
(7)Management and incentive fees receivable are part of Other assets on the Consolidated Statement of Financial Position.
The fee rates described above are contractually fixed, however Mount Logan retains the right to voluntarily waive all or a portion of any management or incentive fee in circumstances where doing so would better align the economic interests of Mount Logan and the investors in a particular vehicle. Any such waiver would be approved by the applicable fund board.
Expenses
Compensation and Benefits
The most significant expense in Mount Logan’s Asset Management business is compensation and benefits expense. This consists of fixed salary, discretionary and non-discretionary bonuses, profit sharing expense associated with the performance fees earned and compensation expense associated with the vesting of non-cash equity-based awards. Mount Logan’s current compensation arrangements with certain of its employees include non-cash equity-based awards, which are considered to be ‘performance-based incentives.’ The non-cash equity-based awards are granted subject to management’s discretion and approval by the Board of Directors. There are no clawback provisions associated with the non-cash equity-based awards; however, they are subject to a time-based vesting requirement and continued employment. To date, Mount Logan has not paid any profit sharing associated with performance fees. Because of these performance-based incentives, as Mount Logan’s net revenues increase, Mount Logan’s compensation costs rise. Mount Logan’s compensation costs also reflect the increased investment in people as Mount Logan continues to grow its AUM both organically and inorganically.
Mount Logan grants equity awards to certain directors, officers, service providers and employees, consisting of Restricted Stock Units ("RSUs") that generally vest and become exercisable in annual installments depending on the award terms. See Note 19. Equity based compensation to Mount Logan’s condensed consolidated financial statements for further discussion of equity-based compensation.
Administration and servicing fees
On November 20, 2018, Mount Logan entered into a servicing agreement (the “Servicing Agreement”) with BCPA. Under the terms of the Servicing Agreement, BCPA as servicing agent (the "Servicing Agent") performs (or oversees, or arranges for, the performance of) the administrative services necessary for the operation of Mount Logan, including, without limitation, office facilities, equipment, bookkeeping and record keeping services and such other services the Servicing Agent, subject to review by the Board, shall from time to time deem necessary or useful to perform its obligations under this Servicing Agreement. The Servicing Agent is authorized to enter into sub-administration agreements as determined to be necessary in order to carry out the administrative services.
Unless earlier terminated as described below, the Servicing Agreement will remain in effect from year-to-year if approved annually by (i) the vote of the Board and (ii) the vote of a majority of Mount Logan’s independent directors. The Servicing Agreement may be terminated at any time, without the payment of any penalty, upon 60 days’ written notice by the vote of the Board or by the Servicing Agent.
Mount Logan reimburses BCPA for an allocable portion of compensation paid to Mount Logan’s Chief Financial Officer, associated management personnel (based on a percentage of time such individuals devote, on an estimated basis, to the business affairs of Mount Logan), and out-of-pocket expenses. While the Servicing Agent performs certain administrative functions for Mount Logan, the management functions of Mount Logan are wholly performed by Mount Logan’s management team.
Mount Logan provides administrative and reporting services to SCIM in respect of the management of ACIF in exchange for a servicing fee. The servicing fee is variable consideration as it is calculated quarterly based on the fees received by SCIM under its advisory agreement with ACIF, less a specified fee retained by SCIM, debt servicing expense, compensation and other certain expenses SCIM incurs in connection with investment advisory services it provides to ACIF. As Mount Logan determined it acts as the agent in this relationship, Mount Logan recognizes in income the amount it is entitled to receive or obligated to pay. In the Consolidated Statements of Financial Position, uncollected amounts are classified as Due from related parties when money is owed to Mount Logan and money owed by Mount Logan is presented as Due to related parties.
Financial Measures under U.S. GAAP - Insurance Solutions
The following discussion of financial measures under U.S. GAAP is based on Mount Logan’s Insurance Solutions business, which is operated by Ability, as of June 30, 2025.
Revenues
Net premiums
Net premiums for long-duration contracts, including products with fixed and guaranteed premiums and benefits, are recognized as revenue when due from policyholders. Insurance premiums are reported net of reinsurance ceded premiums.
Product charges
Product charges mainly include surrender charges on MYGA product which are earned when assessed against policyholder account balances during the period.
Net investment income
Net investment income is a significant component of Ability's total revenues. Ability recognizes investment income as it accrues or is legally due, net of investment management and custody fees. Investment income on fixed
maturity securities includes coupon interest, as well as the amortization of any premium and the accretion of any discount. Investment income on equity securities represents dividend income and preferred coupon interest.
Net gains (losses) from investment activities
Investment related gains (losses) primarily consist of (i) realized gains and losses on sales of investments, (ii) unrealized gains and losses on trading securities, (iii) unrealized gains and losses on equity securities, (iv) changes in the fair value of the embedded derivatives and derivatives not designated as a hedge, and (v) changes in the provision for credit losses.
Net revenues of consolidated variable interest entities
Changes in the fair value of the consolidated VIEs’ assets and liabilities and related interest, dividend and other income and expenses are presented within net revenues of consolidated variable interest entities.
Net investment income (loss) on funds withheld
Net gains (losses) on funds withheld consists of investment activity pertaining to funds withheld assets which includes any interest income, unrealized gains, and losses, and realized gains and losses from sales of these assets.
Ceded reinsurance – Funds withheld with Front Street Re
Mount Logan has a coinsurance with funds withheld arrangement with Front Street Re covering a significant portion of the LTC business (the “Medico” block of policies). Under the funds withheld arrangement, assets are retained by Mount Logan; however, all investment activity pertaining to those assets are passed through to Front Street Re. Investment activity includes any interest income, unrealized gains, and losses, and realized gains and losses from sales of these assets. The liability for this funds held arrangement is in the liability section of the Insurance section of the Consolidated Statements of Financial Position, and the income statement items related to this contract are in the line item net investment income (loss) on funds withheld in the Insurance section of the Consolidated Statement of Operations.
Ceded reinsurance – Modified coinsurance with Vista Life and Casualty Reinsurance Company
Mount Logan also has a modified coinsurance (“Modco”) agreement with Vista Life and Casualty Reinsurance Company (“Vista”). Pursuant to such agreement, Mount Logan retains assets in a designated custody account to support the quota share of the ceded Modco reserves. Similar to a funds withheld arrangement, all investment activity pertaining to those assets are passed through to Vista. Investment activity includes any interest income, unrealized gains, and losses, and realized gains and losses from sales on these assets. The liability for this funds held agreement is netted against the reinsurance recoverable of the Insurance section of the Consolidated Statements of Financial Position, and the income statement items related to this contract are in the line item net investment income (loss) on funds withheld in the Insurance Consolidated Statement of Operations.
Expenses
Interest sensitive contract benefits
Liabilities for the MYGA investment contracts equal the account value, that is, the amount that accrues to the benefit of the contract or policyholder including credited interest and assessments through the financial statement date. Changes in interest sensitive contract liabilities, excluding deposits and withdrawals, are recorded in interest sensitive contract benefits or product charges on the consolidated statements of operations.
Net policy benefit and claims
Net policy benefit and claims represent the present value of future benefits to be paid to or on behalf of policyholders and related expenses less the present value of future net premiums. The liability is measured for each group of contracts (i.e., cohorts) using current cash flow assumptions. Contracts are grouped into cohorts by line of business, product type and cash flow streams, based on the date the policy was acquired (which for the entire LTC portfolio is the date of the acquisition of Ability Insurance). Future policy benefit reserves are adjusted each period because of updating lifetime net premium ratios for differences between actual and expected experience with the retroactive effect of those
variances recognized in current period earnings. Mount Logan reviews at least annually in the third quarter, future policy benefit reserves cash flow assumptions, and if the review concludes that the assumptions need to be updated, future policy benefit reserves are adjusted retroactively based on the revised net premium ratio using actual historical experience, updated cash flow assumptions, and the locked-in discount rate with the effect of those changes recognized in current period earnings.
As Mount Logan’s LTC business is in run-off, the locked-in discount rate is used for the computation of interest accretion on future policy benefit reserves recognized in earnings. However, cash flows used to estimate future policy benefit reserves are also discounted using an upper-medium grade (i.e., low credit risk) fixed-income instrument yield reflecting the duration characteristics of the liabilities and is updated each reporting period with changes recorded in Accumulated Other Comprehensive Income (“AOCI”). As a result, changes in the current discount rate at each reporting period are recognized as an adjustment to AOCI and not earnings each period, whereas, changes relating to cash flow assumptions are recognized in the Insurance Statement of Earnings (Loss).
Amortization of deferred acquisition costs
Mount Logan incurs significant costs in connection with its renewals for its MYGA business. Costs that are related directly to the successful acquisition or renewal of MYGA contracts are capitalized as Deferred Acquisition Costs (“DAC”). Such costs for Mount Logan are comprised mostly of incremental direct costs of contract acquisitions, which for Mount Logan are primarily commissions. Deferred acquisition costs will be amortized to expense on a straight-line basis, at the individual level over the expected term of the related contract.
All other acquisition-related costs, as well as all indirect costs, are expensed as incurred.
Compensation and Benefits
This consists of fixed salary, discretionary and non-discretionary bonuses.
Interest expense
This includes interest expense on the debt obligations.
General, administrative and other
General, administrative and other expenses include normal operating expenses, integration, restructuring and other non-operating expenses.
Other Financial Measures under U.S. GAAP
Income Taxes
Mount Logan’s income tax expense declined in the second quarter of 2025 compared to the second quarter of 2024. In the three months ended June 30, 2025 Mount Logan received a small tax benefit of less than $0.1 million while in the three months ended June 30, 2024 Mount Logan incurred an income tax expense of $0.2 million. Mount Logan’s income tax expense also declined in the six months ended June 30, 2025 compared to the six months ended June 30, 2024. For the year to date June 30, 2025 Mount Logan incurred an income tax expense of less than $0.1 million while for the year to date June 30, 2024 Mount Logan incurred an income tax expense of $0.2 million. Income taxes were lower in 2025 primarily as a result of the increase in tax deductible expenses allocated to Mount Logan’s US corporate tax group.
Managing Business Performance - Key Segment and Non-U.S. GAAP Performance Measures
Mount Logan believes that the presentation of Segment Income supplements a reader’s understanding of the economic operating performance of each of Mount Logan’s segments.
Segment Income is the key performance measure used by management in evaluating the performance of the Asset Management and Insurance Solutions segments. See Note 22. Segments to the condensed consolidated financial statements for more details regarding the components of Segment Income and management’s consideration of Segment Income. Mount Logan believes that Segment Income is helpful for an understanding of Mount Logan’s business and that investors
should review the same supplemental financial measure that management uses to analyze Mount Logan’s segment performance. This measure supplements and should be considered in addition to and not in lieu of the results of operations discussed in “Overview of Results of Operations” that have been prepared in accordance with U.S. GAAP.
Fee Related Earnings and Spread Related Earnings
Fee Related Earnings (“FRE”) is a component of Segment Income that is used to assess the performance of the Asset Management segment. FRE is the sum of (i) management fees, (ii) performance fees received from certain managed funds (iii) equity investment earnings related to fee generating vehicles, and (iv) interest income attributable to investment management activity, less (a) fee-related compensation, excluding equity-based compensation, and (b) other associated operating expenses, which excludes amortization of acquisition-related intangible assets and interest and other credit facility expenses.
FRE excludes non-fee generating revenues and expenses, transaction-related charges, equity-based compensation costs, the amortization of intangible assets, the operating results of VIEs that are included in the consolidated financial statements, and any other non-recurring income and expenses. In addition, FRE excludes interest and other financing costs related to the Company not attributable to any specific segment, and corporate overhead expenses incurred to support the operations of the business rather than directly fee-related. Management considers these types of costs corporate in nature, and are included only for reconciliation purposes to income (loss) before income tax (provision) benefit.
Spread Related Earnings (“SRE”) is a component of Segment Income that is used to assess the performance of the Insurance Solutions segment, excluding certain market volatility, which consists of investment gains (losses), other income and certain general, administrative & other expenses. For the Insurance Solutions segment, SRE equals the sum of (i) the net investment earnings on Insurance Solutions segment’s net invested assets (excluding investment earnings on funds held under reinsurance contracts and modified coinsurance agreement), less (ii) cost of funds (as described below), (iii) compensation and benefits, (iv) interest expense and (v) operating expenses.
Cost of funds includes liability costs associated with the crediting cost on MYGA liabilities as well as other liability costs. Other liability costs include DAC amortization, the cost of liabilities associated with LTC, net of reinsurance, which includes change in reserves, premiums, actual claim experience including related expenses and certain product charges related to MYGA.
Mount Logan uses FRE and SRE as measures of operating performance, not as measures of liquidity. These measures should not be considered in isolation or as a substitute for net income or other income data prepared in accordance with U.S. GAAP. The use of these measures without consideration of their related U.S. GAAP measures is not adequate due to the adjustments described above.
Results of Operations
Below is a discussion of Mount Logan’s consolidated statements of operations for the three and six months ended June 30, 2025 and 2024. For additional analysis of the factors that affected Mount Logan’s results at the segment level, see “Segment Analysis” below:
| Three months ended June 30, | Six months ended June 30, | ||||||||||||||||||||||||||||||||||||||||||||||
| 2025 | 2024 | Change ($) | Change (%) | 2025 | 2024 | Change ($) | Change (%) | ||||||||||||||||||||||||||||||||||||||||
| ($ in thousands) | |||||||||||||||||||||||||||||||||||||||||||||||
| REVENUES | |||||||||||||||||||||||||||||||||||||||||||||||
| Asset Management | |||||||||||||||||||||||||||||||||||||||||||||||
| Management fees | 2,809 | 2,825 | (16) | -1 | % | 6,049 | 5,416 | 633 | 12 | % | |||||||||||||||||||||||||||||||||||||
| Incentive fees | 478 | 1,008 | (530) | -53 | % | 777 | 1,911 | (1,134) | -59 | % | |||||||||||||||||||||||||||||||||||||
| Equity investment earning | 42 | (57) | 99 | -174 | % | 324 | 167 | 157 | 94 | % | |||||||||||||||||||||||||||||||||||||
| 3,329 | 3,776 | (447) | -12 | % | 7,150 | 7,494 | (344) | -5 | % | ||||||||||||||||||||||||||||||||||||||
| Insurance Solutions | |||||||||||||||||||||||||||||||||||||||||||||||
| Net Premiums | (4,238) | (3,717) | (521) | 14 | % | (8,251) | (7,330) | (921) | 13 | % | |||||||||||||||||||||||||||||||||||||
| Product charges | 722 | 73 | 649 | NM | 1,582 | 107 | 1,475 | NM | |||||||||||||||||||||||||||||||||||||||
| Net investment income | 16,678 | 19,023 | (2,345) | -12 | % | 31,629 | 36,400 | (4,771) | -13 | % | |||||||||||||||||||||||||||||||||||||
| Net gains (losses) from investment activities | 3,838 | (1,293) | 5,131 | -397 | % | 5,310 | (2,067) | 7,377 | -357 | % | |||||||||||||||||||||||||||||||||||||
| Three months ended June 30, | Six months ended June 30, | ||||||||||||||||||||||||||||||||||||||||||||||
| 2025 | 2024 | Change ($) | Change (%) | 2025 | 2024 | Change ($) | Change (%) | ||||||||||||||||||||||||||||||||||||||||
| ($ in thousands) | |||||||||||||||||||||||||||||||||||||||||||||||
| Net revenues of consolidated variable interest entities | 3,549 | 3,964 | (415) | -10 | % | 7,182 | 8,643 | (1,461) | -17 | % | |||||||||||||||||||||||||||||||||||||
| Net investment income (loss) on funds withheld | (6,826) | (7,926) | 1,100 | -14 | % | (12,576) | (15,312) | 2,736 | -18 | % | |||||||||||||||||||||||||||||||||||||
| Other income | 78 | 76 | 2 | NM | 154 | 158 | (4) | NM | |||||||||||||||||||||||||||||||||||||||
| 13,801 | 10,200 | 3,601 | 35 | % | 25,030 | 20,599 | 4,431 | 22 | % | ||||||||||||||||||||||||||||||||||||||
| Total revenues | 17,130 | 13,976 | 3,154 | 23 | % | 32,180 | 28,093 | 4,087 | 15 | % | |||||||||||||||||||||||||||||||||||||
| EXPENSES | |||||||||||||||||||||||||||||||||||||||||||||||
| Asset Management | |||||||||||||||||||||||||||||||||||||||||||||||
| Administration and servicing fees | 1,812 | 1,952 | (140) | -7 | % | 3,049 | 3,375 | (326) | -10 | % | |||||||||||||||||||||||||||||||||||||
| Transaction costs | 2,753 | (198) | 2,951 | NM | 7,298 | 53 | 7,245 | NM | |||||||||||||||||||||||||||||||||||||||
| Compensation and benefits | 1,836 | 1,873 | (37) | -2 | % | 4,216 | 3,576 | 640 | 18 | % | |||||||||||||||||||||||||||||||||||||
| Amortization and impairment of intangible assets | 1,889 | 482 | 1,407 | 292 | % | 2,799 | 964 | 1,835 | 190 | % | |||||||||||||||||||||||||||||||||||||
| Interest and other credit facility expenses | 1,960 | 1,661 | 299 | 18 | % | 3,906 | 3,363 | 543 | 16 | % | |||||||||||||||||||||||||||||||||||||
| General, administrative and other | 1,258 | 1,042 | 216 | 21 | % | 2,981 | 3,274 | (293) | -9 | % | |||||||||||||||||||||||||||||||||||||
| 11,508 | 6,812 | 4,696 | 69 | % | 24,249 | 14,605 | 9,644 | 66 | % | ||||||||||||||||||||||||||||||||||||||
| Insurance Solutions | |||||||||||||||||||||||||||||||||||||||||||||||
| Net policy benefit and claims (remeasurement gain on policy liabilities of $2,945 and $3,025 and $1,881 and $7,306 for the three and six months ended June 30, 2025 and 2024, respectively) | (1,064) | (887) | (177) | 20 | % | 729 | (5,148) | 5,877 | -114 | % | |||||||||||||||||||||||||||||||||||||
| Interest sensitive contract benefits | 3,997 | 3,733 | 264 | 7 | % | 7,815 | 7,138 | 677 | 9 | % | |||||||||||||||||||||||||||||||||||||
| Amortization of deferred acquisition costs | 905 | 550 | 355 | 65 | % | 1,460 | 1,037 | 423 | 41 | % | |||||||||||||||||||||||||||||||||||||
| Compensation and benefits | 223 | 465 | (242) | -52 | % | 467 | 649 | (182) | -28 | % | |||||||||||||||||||||||||||||||||||||
| Interest expense | 407 | 328 | 79 | 24 | % | 735 | 656 | 79 | 12 | % | |||||||||||||||||||||||||||||||||||||
| General, administrative and other (including related party amounts of $1,753 and $3,485 and $1,802 and $3,569 for the three and six months ended June 30, 2025 and 2024, respectively) | 3,270 | 4,272 | (1,002) | -23 | % | 6,956 | 8,606 | (1,650) | -19 | % | |||||||||||||||||||||||||||||||||||||
| 7,738 | 8,461 | (723) | -9 | % | 18,162 | 12,938 | 5,224 | 40 | % | ||||||||||||||||||||||||||||||||||||||
| Total expenses | 19,246 | 15,273 | 3,973 | 26 | % | 42,411 | 27,543 | 14,868 | 54 | % | |||||||||||||||||||||||||||||||||||||
| Investment and other income (Loss) - Asset Management | |||||||||||||||||||||||||||||||||||||||||||||||
| Net gains (losses) from investment activities | 867 | (896) | 1,763 | -197 | % | 1,708 | (1,114) | 2,822 | -253 | % | |||||||||||||||||||||||||||||||||||||
| Dividend income | 29 | 113 | (84) | -74 | % | 67 | 225 | (158) | -70 | % | |||||||||||||||||||||||||||||||||||||
| Interest income | 271 | 272 | (1) | — | % | 539 | 543 | (4) | -1 | % | |||||||||||||||||||||||||||||||||||||
| Other income (loss), net | 6 | — | 6 | — | % | 305 | — | 305 | — | % | |||||||||||||||||||||||||||||||||||||
| Total investment and other income (loss) | 1,173 | (511) | 1,684 | -330 | % | 2,619 | (346) | 2,965 | -857 | % | |||||||||||||||||||||||||||||||||||||
| Income (loss) before taxes | (943) | (1,808) | 865 | -48 | % | (7,612) | 204 | (7,816) | -3831 | % | |||||||||||||||||||||||||||||||||||||
| Income tax (expense) benefit — Asset Management | 9 | (189) | 198 | -105 | % | (27) | (184) | 157 | -85 | % | |||||||||||||||||||||||||||||||||||||
| Net income (loss) | (934) | (1,997) | 1,063 | -53 | % | (7,639) | 20 | (7,659) | -38295 | % | |||||||||||||||||||||||||||||||||||||
Note: “NM” denotes not meaningful.
Three Months Ended June 30, 2025 Compared to Three Months Ended June 30, 2024
In this section, references to 2025 refer to the three months ended June 30, 2025 and references to 2024 refer to the three months ended June 30, 2024.
Asset Management Segment
Revenues
Revenues were $3.3 million in 2025, a decrease of $0.4 million from $3.8 million in 2024, driven by a decrease in incentive fees, offset by an increase in equity investment earnings.
The $0.5 million decrease in incentive fees was primarily driven by investment write-downs in the Ovation funds which resulted in $nil Ovation incentive fees being earned in 2025, compared to $0.6 million earned in 2024. Given the underlying Ovation fund is in wind down, no further incentive fees are anticipated to be earned going forward.
Equity investment earnings increased by $0.1 million due to better net income results in SCIM, which were primarily driven by the decrease in professional fee spend due to active management efforts to reduce costs.
Management fees remained relatively flat year on year, as the increase in AUM across OCIF, Vista and closed end private funds sub-advised by ML Management were offset by continued asset liquidations in the Ovation funds, decreased AUM in Logan Ridge, and asset repayments in the CLOs post-reinvestment period.
Expenses
Expenses were $11.5 million in 2025, an increase of $4.7 million from $6.8 million in 2024, driven by increases in transaction costs, amortization and impairment of intangibles, interest and credit facility expenses, and general, administrative and other expenses, partially offset by a decrease in administration and servicing fees.
Transaction costs increased $3.0 million in 2025 primarily due to deal costs related to Mount Logan’s merger with TURN.
Amortization and impairment of intangible assets increased $1.4 million in 2025 due to a decrease in the remaining useful life and change in amortization method on the IMA purchased in the Ovation GP acquisition, as the underlying fund is being wound down. The amortization method mirrors the percentage of net asset value decline in the fund.
Interest and other credit facility expenses increased $0.3 million in 2025 due to increased borrowings from upsizing our existing credit facility during the fourth quarter of 2024 and the amortization of deferred financing costs associated with the upsize, and growing paid in kind interest on the debenture units.
General, administrative and other expenses increased $0.2 million in 2025 primarily due to increased usage of shared costs paid by BC Partners for consulting services, software licenses and conference-related expenses.
The increase in expenses was offset by a $0.1 million decrease in administration and servicing fees primarily due to the decrease in net economic loss attributable to Mount Logan’s service agreement with SCIM, and the decrease in sub-investment management expenses. Mount Logan’s servicing agreement with SCIM is for ACIF, an interval fund, and is calculated as the gross management and incentive fees paid by ACIF net of expenses incurred under the servicing agreement. The decrease in economic loss attributable to the servicing agreement with SCIM was primarily driven by a decrease in expenses under the agreement due to compensation costs moving directly to Mount Logan, and non-recurring costs incurred in 2024 related to ACIF expense write-offs. Sub-investment management expenses decreased primarily due to fee waivers provided by one sub-investment manager. The decrease in administration and servicing fees was partially offset by an increase in administrative fees due to additional headcount.
Investment and Other Income (Loss)
Total investment and other income increased $1.7 million primarily driven by the increase in unrealized gain on equity investments and the seller note issued in relation to the Capitala acquisition (refer to note 11 of the condensed consolidated financial statements for further details regarding Mount Logan’s debt obligations) due to fair value movements. The increase in total investment and other income was partially offset by a decrease in dividend income as Mount Logan continues to redeem its OCIF shares.
Insurance Solutions Segment
Revenues
Revenues were $13.8 million in 2025, an increase of $3.6 million from $10.2 million in 2024. The increase was primarily driven by increases in net gains (losses) from investment activities, net investment income (loss) on funds withheld, and product charges. These increases were partially offset by decreases in net investment income, net revenue of consolidated VIEs, and net premiums.
Net gains (losses) from investment activities were gains of $3.8 million in 2025, an increase of $5.1 million from losses of ($1.3) million in 2024, primarily due to a favorable change in the fair value of investment assets. The favorable change in the fair value of investment assets was primarily driven by a decrease in bond yields in 2025 compared to 2024, which resulted in an increase in the fair value of existing bonds in 2025 compared to 2024. Consequently, there were higher unrealized gains on these bonds in 2025 compared to 2024.
Net investment income (loss) on funds withheld were a loss of ($6.8) million in 2025, which reflects an increase of $1.1 million from a loss of ($7.9) million in 2024. This increase was primarily driven by a decrease in net investment income on funds withheld assets.
Product charges were $0.7 million in 2025, which reflects an increase of $0.6 million from $0.1 million in 2024, primarily driven by an increase in surrenders of MYGA policies in 2025 compared to 2024 which resulted in higher surrender charges/product charges paid by policyholders in 2025.
Net investment income was $16.7 million in 2025, a decrease of $2.3 million from $19.0 million in 2024, primarily driven by the decrease in bond yields, interest expense related to interest rate swaps and the write-off of accrued income on a mortgage loan, which is in default.
Net revenues of consolidated VIEs were $3.6 million in 2025, a decrease of $0.4 million from $4.0 million in 2024, primarily driven by lower investments balance and lower bond yields in 2025 compared to 2024.
Net premiums were ($4.2) million in 2025, a decrease of $0.5 million from ($3.7) million in 2024. The negative net premium reflects ceded premiums exceeding direct and assumed premiums within the LTC business, primarily due to additional ceded premium paid to transfer a substantial portion of LTC related risk under a reinsurance arrangement. The decrease in net premiums was primarily driven by a decrease of $0.9 million in direct and assumed premium compared to 2024, partially offset by a decrease of $0.4 million in ceded premium related to the LTC business compared to 2024.
Expenses
Expenses were $7.7 million in 2025, a decrease of $0.7 million from $8.5 million in 2024. The decrease was driven by decreases in net policy benefit & claims, compensation & benefits, and general, administrative & other expenses. These decreases were partially offset by increases in interest sensitive contract benefits and DAC amortization.
Net policy benefits and claims were ($1.1) million in 2025, a decrease of $0.2 million from ($0.9) million in 2024, primarily driven by remeasurement gains, partially offset by an increase in claims related to Guardian block within LTC line of business due to adverse claim development.
Interest sensitive contract benefits were $4.0 million in 2025, an increase of $0.3 million from $3.7 million in 2024, primarily driven by interest accretion on additional MYGA block assumed from NSG in the second quarter of 2025.
DAC amortization was $0.9 million in 2025, an increase of $0.4 million from $0.5 million in 2024, primarily due to the additional MYGA block assumed from NSG in the second quarter of 2025, which resulted in higher DAC and its amortization in 2025 compared to 2024.
General, administrative & other expenses were $3.3 million in 2025, a decrease of $1.0 million from $4.3 million in 2024. Expenses were lower in 2025 primarily due to lower assumed expenses related to MYGA, as the volume of assumed MYGA was lower in 2025 compared to 2024. Additionally, cost-saving measures such as transitioning to lower-cost vendors contributed to the overall reduction in expenses.
Income Tax (Provision) Benefit
Mount Logan’s income tax benefit was less than $0.1 million in 2025, a change from the income tax expense of $0.2 million in 2024. Income taxes were lower in 2025 primarily as a result of the increase in tax deductible expenses allocated to Mount Logan’s US corporate tax group. The (provision) benefit for income taxes includes federal, state, local and foreign income taxes, resulting in an effective income tax rate of 0.95% and (10.45%) for 2025 and 2024, respectively. The most significant reconciling items between the U.S. federal statutory income tax rate and the effective income tax rate was due to the transaction costs which are treated as a permanent difference for tax purposes. See Note 17. Income taxes to the condensed consolidated financial statements for further details regarding Mount Logan’s income tax (provision) benefit.
Six Months Ended June 30, 2025 Compared to Six Months Ended June 30, 2024
In this section, references to 2025 refer to the six months ended June 30, 2025 and references to 2024 refer to the six months ended June 30, 2024.
Asset Management Segment
Revenues
Revenues were $7.2 million in 2025, a decrease of $0.3 million from $7.5 million in 2024, driven by a decrease in incentive fees, offset by an increase in management fees and equity investment earnings.
The $1.1 million decrease in incentive fees was primarily driven by investment write-downs in the Ovation funds which resulted in $nil Ovation incentive fees being earned in 2025, compared to $1.2 million earned in 2024. Given the underlying Ovation fund is in wind down, no further incentive fees are anticipated to be earned going forward
Management fees increased $0.6 million due to the increase in AUM across OCIF and a closed end private fund sub-advised by ML Management, and the new management fee stream from Vista. The increase in management fees were offset by continued asset liquidations in the Ovation funds, decreased AUM in Logan Ridge, and asset repayments in the CLOs post-reinvestment period.
Equity investment earnings increased by $0.2 million due to better net income results in SCIM, which were primarily driven by the decrease in professional fee spend due to active management efforts to reduce costs.
Expenses
Expenses were $24.2 million in 2025, an increase of $9.6 million from $14.6 million in 2024, driven by increases in transaction costs, amortization and impairment of intangibles, compensation and benefits, and interest and credit facility expenses, partially offset by the decrease in administration and servicing fees and general, administrative and other expenses.
Transaction costs increased $7.2 million in 2025 primarily due to deal costs related to Mount Logan’s merger with TURN.
Amortization and impairment of intangible assets increased $1.8 million in 2025 due to a decrease in the remaining useful life and change in amortization method on the IMA purchased in the Ovation GP acquisition, as the underlying fund is being wound down. The amortization method mirrors the percentage of net asset value decline in the fund.
Compensation and benefits increased $0.6 million in 2025 primarily due to increased headcount, RSUs granted and quarterly guaranteed bonus accruals.
Interest and other credit facility expenses increased $0.5 million in 2025 due to increased borrowings from upsizing our existing credit facility during the fourth quarter of 2024 and the amortization of deferred financing costs associated with the upsize, and growing paid in kind interest on the debenture units.
The increase in expense was was offset by a $0.3 million decrease in administration and servicing fees, and a $0.3 million decrease in general, administrative and other expenses.
The decrease in administration and servicing fees was primarily attributable to the decrease net economic loss attributable to Mount Logan’s service agreement with SCIM and the decrease in sub-investment management expenses. The decrease in economic loss attributable to the servicing agreement with SCIM was primarily driven by a decrease in expenses under the agreement due to compensation costs moving directly to Mount Logan, and non-recurring costs incurred in 2024 related to the underlying fund advised by SCIM - ACIF. Sub-investment management expenses decreased primarily due to fee waivers provided by one sub-investment manager. The decrease in administration and servicing fees was partially offset by an increase in administrative fees due to additional headcount.
The decrease in general, administrative and other expenses was primarily attributable to the expiration of transition services agreements on assets purchased and non-recurring costs incurred in 2024 related to one of the BDCs managed by ML Management.
Investment and Other Income (Loss)
Total investment and other income increased $3.0 million primarily driven by the increase in unrealized gain on equity investments and the seller note issued in relation to the Capitala acquisition (refer to Note 11. Debt obligations of the condensed consolidated financial statements for further details regarding Mount Logan’s debt obligations) due to fair value movements. Other income also contributed to the increase due to tax refunds received in relation to prior period tax returns. The increase in total investment and other income was partially offset by a decrease in dividend income from the partial redemption of OCIF shares.
Insurance Solutions Segment
Revenues
Revenues were $25.0 million in 2025, an increase of $4.4 million from $20.6 million in 2024. The increase was primarily driven by increases in net gains (losses) from investment activities, net investment income (loss) on funds withheld, and product charges. These increases were partially offset by decreases in net investment income, net revenue of consolidated VIEs, and net premiums.
Net gains (losses) from investment activities were gains of $5.3 million in 2025, an increase of $7.4 million from losses of ($2.1) million in 2024, primarily due to a favorable change in the fair value of investment assets. The favorable change in the fair value of investment assets was primarily driven by a decrease in bond yields in 2025 compared to 2024, which resulted in an increase in the fair value of existing bonds in 2025 compared to 2024. Consequently, there were higher unrealized gains on these bonds in 2025 compared to 2024.
Net investment income (loss) on funds withheld were a loss of ($12.6) million in 2025, which reflects an increase of $2.7 million from a loss of ($15.3) million in 2024. This increase was primarily driven by higher investment related expense on funds withheld assets under the Modco arrangement with Vista in the first quarter of 2025, as well as a decrease in net investment income on funds withheld assets.
Product charges were $1.6 million in 2025, which reflects an increase of $1.5 million from $0.1 million in 2024, primarily driven by an increase in surrenders of MYGA policies in 2025 compared to 2024 which resulted in higher surrender charges/product charges paid by policyholders in 2025.
Net investment income was $31.6 million in 2025, a decrease of $4.8 million from $36.4 million in 2024, primarily driven by the decrease in bond yields, interest expense related to interest rate swaps and the write-off of accrued income on a mortgage loan, which is in default.
Net revenues of consolidated VIEs were $7.2 million in 2025, a decrease of $1.4 million from $8.6 million in 2024, primarily driven by lower investments balance and lower bond yields in 2025 compared to 2024.
Net premiums were ($8.2) million in 2025, a decrease of $0.9 million from ($7.3) million in 2024. The negative net premium reflects ceded premiums exceeding direct and assumed premiums within the LTC business, primarily due to additional ceded premium paid to transfer a substantial portion of LTC related risk under a reinsurance arrangement. The
decrease in net premiums was primarily driven by a decrease of $1.2 million in direct/assumed premium compared to 2024, partially offset by a decrease of $0.2 million in ceded premium related to the LTC business compared to 2024.
Expenses
Expenses were $18.2 million in 2025, an increase of $5.2 million from $13.0 million in 2024. The increase was driven by increases in net policy benefit & claims, interest sensitive contract benefits, and DAC amortization. These increases were partially offset by a decrease in general, administrative & other expenses.
Net policy benefits and claims were $0.7 million in 2025, an increase of $5.9 million from ($5.2) million in 2024, primarily driven by remeasurement gains of $5.3 million due to the one-time benefit of an in-force update in the LTC business in the first quarter of 2024.
Interest sensitive contract benefits were $7.8 million in 2025, an increase of $0.7 million from $7.1 million in 2024, primarily driven by interest accretion on additional MYGA block assumed from NSG in the second quarter of 2025.
DAC amortization was $1.4 million in 2025, an increase of $0.4 million from $1.0 million in 2024, primarily due to the additional MYGA block from NSG assumed in the second quarter of 2025, which resulted in higher DAC and its amortization in 2025 compared to 2024.
General, administrative & other expenses were $7.0 million in 2025, a decrease of $1.6 million from $8.6 million in 2024. Expenses were lower in 2025 primarily due to lower assumed expenses related to MYGA, as the volume of assumed MYGA was lower in 2025 compared to 2024. Additionally, cost-saving measures such as transitioning to lower-cost vendors also contributed to the overall reduction in expenses.
Income Tax (Provision) Benefit
Mount Logan’s income tax expense was less than $0.1 million in 2025, a decrease from the income tax expense of $0.2 million in 2024. Income taxes were lower in 2025 primarily as a result of the increase in tax deductible expenses allocated to Mount Logan’s US corporate tax group. The (provision) benefit for income taxes includes federal, state, local and foreign income taxes, resulting in an effective income tax rate of (0.36%) and 90.08% for 2025 and 2024, respectively. The most significant reconciling items between the U.S. federal statutory income tax rate and the effective income tax rate was due to the transaction costs which are treated as a permanent difference for tax purposes. See Note 17. Income taxes to the condensed consolidated financial statements for further details regarding Mount Logan’s income tax (provision) benefit.
Segment Analysis
Discussed below are Mount Logan’s results of operations for each of Mount Logan’s reportable segments. They represent the segment information available and utilized by management to assess performance and to allocate resources. See Note 22. Segments to Mount Logan’s condensed consolidated financial statements for more information regarding Mount Logan’s segment reporting.
Asset Management
The following table presents FRE, the performance measure of Mount Logan’s Asset Management segment.
| Three months ended June 30, | Six months ended June 30, | |||||||||||||||||||||||||||||||||||||||||||||||||
| 2025 | 2024 | Change ($) | Change (%) | 2025 | 2024 | Change ($) | Change (%) | |||||||||||||||||||||||||||||||||||||||||||
| Asset Management | ||||||||||||||||||||||||||||||||||||||||||||||||||
| Management fees | $ | 4,422 | $ | 4,354 | $ | 68 | 1.6 | % | $ | 8,829 | $ | 8,374 | $ | 455 | 5.4 | % | ||||||||||||||||||||||||||||||||||
| Incentive fees | 478 | 1,008 | (530) | (52.6) | % | 777 | 1,911 | (1,134) | (59.3) | % | ||||||||||||||||||||||||||||||||||||||||
| Equity investment earnings | 42 | (57) | 99 | (173.7) | % | 324 | 167 | 157 | 94.0 | % | ||||||||||||||||||||||||||||||||||||||||
| Interest income¹ | 271 | 272 | (1) | (0.4) | % | 539 | 543 | (4) | (0.7) | % | ||||||||||||||||||||||||||||||||||||||||
| Fee-related compensation | (1,105) | (1,300) | 195 | (15.0) | % | (2,573) | (2,384) | (189) | 7.9 | % | ||||||||||||||||||||||||||||||||||||||||
| Other operating expenses: | ||||||||||||||||||||||||||||||||||||||||||||||||||
| Administration and servicing fees | (1,205) | (1,523) | 318 | (20.9) | % | (1,938) | (2,580) | 642 | (24.9) | % | ||||||||||||||||||||||||||||||||||||||||
| General, administrative and other | (666) | (593) | (73) | 12.3 | % | (1,438) | (1,668) | 230 | (13.8) | % | ||||||||||||||||||||||||||||||||||||||||
| Fee related earnings | 2,237 | 2,161 | 76 | 3.5 | % | 4,520 | 4,363 | 157 | 3.6 | % | ||||||||||||||||||||||||||||||||||||||||
(1)Represents interest income on a loan asset related to a fee generating vehicle
Three Months Ended June 30, 2025 Compared to Three Months Ended June 30, 2024
In this section, references to 2025 refer to the three months ended June 30, 2025, and references to 2024 refer to the three months ended June 30, 2024.
FRE was $2.2 million in 2025, a slight increase of $0.1 million compared to $2.2 million in 2024. FRE was relatively flat primarily because the decrease in administration and servicing fees and fee-related compensation were offset by the decrease in incentive fees.
Administration and servicing fees decreased primarily due to the decrease in net economic loss attributable to Mount Logan’s service agreement with SCIM and the decrease in sub-investment management expenses. Mount Logan’s servicing agreement with SCIM is for ACIF, an interval fund, and is calculated as the gross management and incentive fees paid by ACIF net of expenses incurred under the servicing agreement. The decrease in economic loss attributable to the servicing agreement with SCIM was primarily driven by a decrease in expenses under the agreement due to compensation costs moving directly to Mount Logan’s fee-related compensation line, and non-recurring costs incurred in 2024 related to ACIF expense write-offs. Sub-investment management expenses decreased primarily due to fee waivers provided by one sub-investment manager.
Fee-related compensation decreased due to annual bonus accrual adjustments in 2025 reflecting declining performance of the Ovation fund, which is currently in wind down.
Incentive fees decreased due to investment write-downs in the Ovation funds which resulted in $nil Ovation incentive fees being earned in 2025, compared to $0.6 million earned in 2024.
FRE slightly increased as the increase in equity investment earnings and management fees outweighed the increase in general, administrative and other expenses.
Equity investment earnings increased by $0.1 million due to better net income results in SCIM, which were primarily driven by the decrease in professional fee spend due to active management efforts to reduce costs.
Management fees remained relatively flat as the increase in AUM across Ability, OCIF, Vista and the closed end private funds sub-advised by ML Management were offset by continued asset liquidations in the Ovation funds, decreased AUM in Logan Ridge, and asset repayments in the CLOs post-reinvestment period.
General, administrative and other expenses increased due to increased usage of shared costs paid by BC Partners Advisors for consulting services, software licenses and conference-related expenses.
Six Months Ended June 30, 2025 Compared to Six Months Ended June 30, 2024
In this section, references to 2025 refer to the six months ended June 30, 2025, and references to 2024 refer to the six months ended June 30, 2024.
FRE was $4.5 million in 2025, an increase of $0.2 million compared to $4.4 million in 2024. FRE increased primarily due to the increase in management fees along with the decrease in other operating expenses, offset by the decrease in incentive fees.
Management fees increased due to the increase in AUM across OCIF and a closed end private fund sub-advised by ML Management, and the new management fee stream from Vista. The increase in these management fees were offset by fee decreases from one-time expenses reducing the Ability fees, continued asset liquidations in the Ovation funds, decreased AUM in Logan Ridge, and asset repayments in the CLOs post-reinvestment period.
The decrease in other operating expenses was primarily driven by the expiration of transition services agreements on assets purchased, the decrease in professional services fee spend due to active management efforts to reduce costs, lower sub-investment management expenses due to waivers received, and a decrease in servicing fees under the agreement with SCIM over ACIF.
Mount Logan’s servicing agreement with SCIM is for ACIF, an interval fund, and is calculated as the gross management and incentive fees paid by ACIF net of expenses incurred under the servicing agreement. During 2025, expenses decreased due to compensation costs moving directly to Mount Logan’s fee-related compensation line, and non-recurring costs incurred in 2024 related to ACIF expense write-offs.
Incentive fees decreased due to investment write-downs in the Ovation funds which resulted in $nil Ovation incentive fees being earned in 2025, compared to $1.2 million earned in 2024.
Asset Management Operating Metrics
Assets Under Management
The following presents Mount Logan’s total AUM by vehicle (in millions):
| Three months ended June 30, | |||||||||||||||||||||||||||||||||||||||||
| 2025 | |||||||||||||||||||||||||||||||||||||||||
| (in millions) | Ability (including consolidated VIEs) 1 | BDCs 2 | CLOs 3 | Interval Funds 4 | Ovation Funds | Other 5 | Total | ||||||||||||||||||||||||||||||||||
Change in Total AUM 6 | |||||||||||||||||||||||||||||||||||||||||
| Balance, Beginning of Period | $ | 797 | $ | 290 | $ | 527 | $ | 419 | $ | 206 | $ | 123 | $ | 2,363 | |||||||||||||||||||||||||||
| Inflows | 43 | 15 | — | 28 | — | — | 86 | ||||||||||||||||||||||||||||||||||
| Outflows | (17) | (9) | — | (22) | (84) | (14) | (146) | ||||||||||||||||||||||||||||||||||
| Net Flows | 26 | 6 | — | 6 | (84) | (14) | (60) | ||||||||||||||||||||||||||||||||||
| Realizations | — | (5) | (31) | (7) | (4) | (1) | (48) | ||||||||||||||||||||||||||||||||||
| Market activity and other | 4 | (1) | (6) | 12 | (4) | 3 | 8 | ||||||||||||||||||||||||||||||||||
Inter-vehicle eliminations 7 | — | — | — | (4) | — | — | (4) | ||||||||||||||||||||||||||||||||||
| Balance, End of Period | $ | 827 | $ | 291 | $ | 491 | $ | 425 | $ | 113 | $ | 111 | $ | 2,259 | |||||||||||||||||||||||||||
| Three months ended June 30, | |||||||||||||||||||||||||||||||||||||||||
| 2024 | |||||||||||||||||||||||||||||||||||||||||
| (in millions) | Ability (including consolidated VIEs) 1 | BDCs 2 | CLOs 3 | Interval Funds 4 | Ovation Funds | Other 5 | Total | ||||||||||||||||||||||||||||||||||
Change in Total AUM 6 | |||||||||||||||||||||||||||||||||||||||||
| Balance, Beginning of Period | $ | 716 | $ | 345 | $ | 606 | $ | 382 | $ | 258 | $ | 88 | $ | 2,397 | |||||||||||||||||||||||||||
| Inflows | 30 | 3 | — | 59 | 8.01 | 20 | 119 | ||||||||||||||||||||||||||||||||||
| Outflows | 7 | (11) | — | (31) | (4) | — | (39) | ||||||||||||||||||||||||||||||||||
| Net Flows | 37 | (8) | — | 28 | 4 | 20 | 80 | ||||||||||||||||||||||||||||||||||
| Realizations | — | (9) | (15) | (7) | (4) | — | (35) | ||||||||||||||||||||||||||||||||||
| Market activity and other | (2) | (2) | (2) | 5 | (2) | 4 | 2 | ||||||||||||||||||||||||||||||||||
Inter-vehicle eliminations 7 | — | — | — | (8) | — | — | (8) | ||||||||||||||||||||||||||||||||||
| Balance, End of Period | $ | 751 | $ | 326 | $ | 590 | $ | 400 | $ | 256 | $ | 112 | $ | 2,436 | |||||||||||||||||||||||||||
| Six months ended June 30, | |||||||||||||||||||||||||||||||||||||||||
| 2025 | |||||||||||||||||||||||||||||||||||||||||
| (in millions) | Ability (including consolidated VIEs) 1 | BDCs 2 | CLOs 3 | Interval Funds 4 | Ovation Funds | Other 5 | Total | ||||||||||||||||||||||||||||||||||
Change in Total AUM 6 | |||||||||||||||||||||||||||||||||||||||||
| Beginning of Period | $ | 746 | $ | 306 | $ | 564 | $ | 410 | $ | 212 | $ | 111 | $ | 2,349 | |||||||||||||||||||||||||||
| Inflows | 97 | 26 | — | 69 | — | 8 | 200 | ||||||||||||||||||||||||||||||||||
| Outflows | (21) | (40) | — | (52) | (102) | (14) | (229) | ||||||||||||||||||||||||||||||||||
| Net Flows | 76 | (14) | — | 17 | (102) | (6) | (29) | ||||||||||||||||||||||||||||||||||
| Realizations | — | (11) | (63) | (14) | (9) | (1) | (98) | ||||||||||||||||||||||||||||||||||
| Market activity and other | 5 | 9 | (10) | 17 | 13 | 7 | 41 | ||||||||||||||||||||||||||||||||||
Inter-vehicle eliminations 7 | — | — | — | (4) | — | — | (4) | ||||||||||||||||||||||||||||||||||
| End of Period | $ | 827 | $ | 291 | $ | 491 | $ | 425 | $ | 113 | $ | 111 | $ | 2,259 | |||||||||||||||||||||||||||
| Six months ended June 30, | |||||||||||||||||||||||||||||||||||||||||
| 2024 | |||||||||||||||||||||||||||||||||||||||||
| (in millions) | Ability (including consolidated VIEs) 1 | BDCs 2 | CLOs 3 | Interval Funds 4 | Ovation Funds | Other 5 | Total | ||||||||||||||||||||||||||||||||||
Change in Total AUM 6 | |||||||||||||||||||||||||||||||||||||||||
| Beginning of Period | $ | 695 | $ | 334 | $ | 634 | $ | 342 | $ | 255 | $ | 66 | $ | 2,328 | |||||||||||||||||||||||||||
| Inflows | 76 | 16 | — | 106 | 8.01 | 41 | 247 | ||||||||||||||||||||||||||||||||||
| Outflows | (17) | (46) | — | (42) | (5) | — | (110) | ||||||||||||||||||||||||||||||||||
| Net Flows | 59 | (30) | — | 64 | 3 | 41 | 137 | ||||||||||||||||||||||||||||||||||
| Realizations | — | (17) | (48) | (14) | (8) | — | (87) | ||||||||||||||||||||||||||||||||||
| Market activity and other | (2) | 39 | 3 | 16 | 6 | 5 | 67 | ||||||||||||||||||||||||||||||||||
Inter-vehicle eliminations 7 | — | — | — | (8) | — | — | (8) | ||||||||||||||||||||||||||||||||||
| End of Period | $ | 751 | $ | 326 | $ | 590 | $ | 400 | $ | 256 | $ | 112 | $ | 2,436 | |||||||||||||||||||||||||||
(1)Ability’s AUM excludes assets held under the funds withheld and modco agreements, and includes a portion of the Vista assets to which ML Management was appointed as the investment manager of, effective March 2025,
(2)ML Management manages Logan Ridge Finance Corporation and through another subsidiary, owns a 24.99% interest in SCIM, which is the manager of Portman.
(3)ML Management is the adviser to two CLOs 2018-01 and 2019-01.
(4)ML Management is the adviser to OCIF. Separately Mount Logan receives the economics of ACIF, which is an interval fund advised by SCIM, via a servicing agreement with SCIM over ACIF.
(5)Consists of several small closed end private funds and AUM which is sub-advised by ML Management.
(6)Inflows generally represent new capital which includes capital contributions, subscriptions, dividend reinvestments, draw downs on leverage facilities, and new MYGA flows and managed reinsurance assets added at Ability. Outflows include redemptions, pay downs on leverage facilities, and claims and benefits payments at Ability. Realizations represent distributions of realized income, repurchases of capital, and repayments on CLO notes. Market activity and other generally represents realized and unrealized gains (losses) on investments and other changes in AUM.
(7)Represents ACIF’s investment in OCIF.
(8)Several of the above funds are still subject to their reporting period audit reviews, thus the AUM quoted above represents management’s best estimate of AUM as of June 30, 2025, but may be subject to change.
Three months ended June 30, 2025
Total AUM was $2.3 billion at June 30, 2025, a $0.1 million decrease from $2.4 billion at March 31, 2025. The decrease is attributable to decreases in AUM across the CLOs, Ovation funds and a small closed end private fund. CLO assets will continue to decline given both are in post reinvestment period and continue to harvest their assets. Ovation funds’ AUM will also continue to decline pursuant to their wind down. The AUM of a small closed end private fund decreased due to a capital distribution after realizing its last investment. The total decrease in AUM was offset by increases in AUM attributable to, growth in Ability’s AUM from new MYGA business assumed and an increase in interval fund assets as OCIF continued to scale.
Six months ended June 30, 2025
Total AUM was $2.3 billion at June 30, 2025, a decrease from $2.3 billion at December 31, 2024. The decrease is attributable to decreases in AUM across the BDCs, CLOs and Ovation funds. BDC assets decreased due to the underlying decline in performance of assets in their portfolios. CLO assets will continue to decline given both are in post reinvestment period and continue to harvest their assets. Ovation funds’ AUM will also continue to decline pursuant to their wind down. The total decrease in AUM was offset by increases in AUM attributable to growth in Ability’s AUM from additional capital contribution, the addition of a portion of the Vista portfolio of assets to which Mount Logan has been appointed manager, and new MYGA business assumed. Mount Logan also saw an increase in interval fund assets as OCIF continued to scale.
Insurance Solutions
The following table presents Spread Related Earnings, the performance measure of Mount Logan’s Insurance Solutions segment:
| Three months ended June 30, | Six months ended June 30, | |||||||||||||||||||||||||||||||||||||||||||||||||
| 2025 | 2024 | Change ($) | Change (%) | 2025 | 2024 | Change ($) | Change (%) | |||||||||||||||||||||||||||||||||||||||||||
| Insurance Solutions | ||||||||||||||||||||||||||||||||||||||||||||||||||
| Net investment income and realized gain (loss), net | 10,993 | 13,851 | (2,858) | (20.6) | % | 24,005 | 26,886 | (2,881) | (10.7) | % | ||||||||||||||||||||||||||||||||||||||||
| Cost of funds | (7,354) | (7,039) | (315) | 4.5 | % | (16,673) | (10,249) | (6,424) | 62.7 | % | ||||||||||||||||||||||||||||||||||||||||
| Compensation and benefits | (223) | (465) | 242 | (52.0) | % | (467) | (649) | 182 | (28.0) | % | ||||||||||||||||||||||||||||||||||||||||
| Interest expense | (407) | (328) | (79) | 24.1 | % | (735) | (656) | (79) | 12.0 | % | ||||||||||||||||||||||||||||||||||||||||
| General, administrative and other | (3,100) | (4,032) | 932 | (23.1) | % | (6,184) | (7,920) | 1,736 | (21.9) | % | ||||||||||||||||||||||||||||||||||||||||
| Spread related earnings | (91) | 1,987 | (2,078) | (104.6) | % | (54) | 7,412 | (7,466) | (100.7) | % | ||||||||||||||||||||||||||||||||||||||||
Three Months Ended June 30, 2025 Compared to Three Months Ended June 30, 2024
In this section, references to 2025 refer to the three months ended June 30, 2025, and references to 2024 refer to the three months ended June 30, 2024.
Spread Related Earnings
SRE was ($0.1) million in 2025, a decrease of $2.1 million, or 99%, compared to $2.0 million in 2024. The decrease in SRE was primarily driven by lower investment income and realized gains (losses) net and higher cost of funds, partially offset by lower general, administrative & other expenses.
Net investment income and realized gains (losses) net decreased by $2.9 million, Net investment income decreased due to lower bond yields, interest expense related to interest rate swaps and write-off of accrued income on a mortgage loan, which is in default.
Cost of funds increased by $0.3 million, primarily due to increased DAC amortization from the assumption of the NSG MYGA block, as well as higher claims experience in the LTC business.
General, administrative & other expenses decreased by $0.9 million in 2025 primarily due to lower assumed expenses related to MYGA, as the volume of assumed MYGA was lower in 2025 compared to 2024.
Net Investment Spread
| Three months ended June 30, | |||||||||||
| 2025 | 2024 | Change | |||||||||
| Net investment income and realized gain or (loss), net | 1.44% | 1.93% | -49bps | ||||||||
| Cost of funds ¹ | (1.35)% | (1.24)% | -11bps | ||||||||
| Net Investment spread | 0.09% | 0.69% | -60bps | ||||||||
| Six months ended June 30, | |||||||||||
| 2025 | 2024 | Change | |||||||||
| Net investment income and realized gain or (loss), net | 3.17% | 3.75% | -58bps | ||||||||
| Cost of funds ¹ | (2.60)% | (2.45)% | -15bps | ||||||||
| Net Investment spread | 0.57% | 1.30% | -73bps | ||||||||
(1)Excludes changes in future policy benefits liabilities of LTC line of business, to calculate net investment spread, which result from changes in actuarial assumptions and future cash flow projections.
Net investment spread was 0.1% in 2025, a decrease of 60 basis points compared to 0.7% in 2024, primarily driven by lower net investment income and realized gain or (loss) and higher costs of funds in 2025 compared to 2024.
Net investment income and realized gain or (loss) percent represents a percent of net investment income and realized gain (loss) over average net invested assets. Net investment income and realized gain (loss) was 1.44% in 2025, a decrease of 49 basis points compared to 1.93% in 2024, primarily driven by higher average net invested assets. lower bond yields, interest expense related to interest rate swaps and write-off of accrued income on a defaulted mortgage loan.
Cost of funds percent represents the percent of cost of funds over average net invested assets. Cost of funds were higher in 2025 compared to 2024 primarily due to increased DAC amortization due to the assumption of the NSG MYGA block as well as unfavorable claims experience in the LTC business.
Net invested assets represent investments that directly back Insurance Solutions segment’s net reserve liabilities as well as surplus assets. Net invested assets for Insurance Solutions segment includes (a) total investments on the consolidated statements of financial position, with available-for-sale securities, trading securities and mortgage loans at cost or amortized cost, (b) cash and cash equivalents and restricted cash, (c) investments in related parties, (d) accrued investment income, (e) VIE assets, and (f) net investment payables and receivables. Net invested assets exclude the investment assets under funds withheld arrangement with FSR and assets under Modco agreement with Vista. Net invested assets also exclude mark-to-market adjustment (net unrealized gains (losses)) including provision for credit losses recognized in consolidated statement of operations during the year.
Six Months Ended June 30, 2025 Compared to Six Months Ended June 30, 2024
In this section, references to 2025 refer to the six months ended June 30, 2025, and references to 2024 refer to the six months ended June 30, 2024.
Spread Related Earnings
SRE was ($0.1) million in 2025, a decrease of $7.5 million, or 99%, compared to $7.4 million in 2024. The decrease in SRE was primarily driven by lower investment income and realized gains (losses) net and higher cost of funds, partially offset by lower general, administrative & other expenses.
Net investment income and realized gains (losses) net decreased by $2.9 million, Net investment income decreased due to lower bond yields, interest expense related to interest rate swaps and write-off of accrued income on a mortgage loan, which is in default.
Cost of funds increased by $6.4 million, primarily due to the one-time benefit of an in-force update in the LTC business in the first quarter of 2024, increased DAC amortization from the assumption of the NSG MYGA block in the second quarter of 2025, as well as higher claims experience in the LTC business in 2025.
General, administrative & other expenses decreased by $1.7 million in 2025 due to lower assumed expenses related to MYGA, as the volume of assumed MYGA was lower in 2025 compared to 2024.
Net Investment Spread
Net investment spread was 0.6% in 2025, a decrease of 73 basis points compared to 1.3% in 2024, primarily driven by lower net investment income and realized gain or (loss) and higher costs of funds in 2025 compared to 2024.
Net investment income and realized gain or (loss) percent represents a percent of net investment income and realized gain (loss) over average net invested assets. Net investment income and realized gain (loss) was 3.17% in 2025, a decrease of 58 basis points compared to 3.75% in 2024, primarily driven by higher average net invested assets as well as lower bond yields, interest expense related to interest rate swaps and write-off of accrued income on a mortgage loan, which is in default.
Cost of funds percent represents the percent of cost of funds over average net invested assets. Cost of funds were higher in 2025 compared to 2024 primarily due to increased DAC amortization due to the assumption of the NSG MYGA block as well as unfavorable claims experience in the LTC business.
Investment Portfolio and Net Investment Spread
Ability had total investments, including related parties and consolidated VIEs, of $1,055 million and $1,061 million as of June 30, 2025, and June 30, 2024, respectively. Total investments have decreased by 0.6% compared to 2024, which is primarily driven by the dispositions of investment assets. Ability’s investment strategy seeks to achieve sustainable risk-adjusted returns through the disciplined management of its investment portfolio against its duration of liabilities. The investment strategies focus primarily on a buy and hold asset allocation strategy that may be adjusted periodically in response to changing market conditions and the nature of Ability’s liability profile. Ability takes advantage of its generally persistent liability profile by identifying investment opportunities with an emphasis on earning incremental yield by taking measured liquidity and complexity risk rather than assuming incremental credit risk. Ability has selected a diverse array of primarily high-grade fixed income assets including corporate bonds, structured securities and commercial real estate loans, among others. Ability also maintains holdings in floating rate and less rate-sensitive instruments, including CLOs, non-agency RMBS and various types of structured products, both as an expression of its macroeconomic views as well as to capture incremental returns versus fixed rate instruments. Depending on its market outlook, Ability will use financial hedges to increase or reduce its exposure to various macroeconomic factors, including interest rate, foreign currency exchange rate, and / or performance of market indices. In addition to its fixed income portfolio, Ability opportunistically allocates to alternative investments where it primarily focuses on fixed income-like, cash flow-based investments.
Liquidity and Capital Resources
Overview
Mount Logan primarily derives revenues and cash flows from the assets it manages and the retirement savings products it issues and reinsures. Based on management’s experience, Mount Logan believes that its current liquidity position, together with the cash generated from revenues will be sufficient to meet Mount Logan’s anticipated expenses and other working capital needs for at least the next 12 months. For the longer-term liquidity needs of the Asset Management business, Mount Logan expects to continue to fund the Asset Management business’s operations through management fees and incentive fees received. The principal sources of liquidity for the Insurance Solutions segment, in the ordinary course of business, are operating cash flows and holdings of cash, cash equivalents and other readily marketable assets. At June 30, 2025, Mount Logan had $122.5 million of unrestricted cash and cash equivalents.
Primary Uses of Cash
Over the next 12 months, Mount Logan expects its primary liquidity needs will be to:
▪support the future growth of Mount Logan's businesses through strategic corporate investments;
▪pay Mount Logan’s operating expenses, including, compensation, general, administrative, and other expenses;
▪make payments to policyholders for surrenders, withdrawals and payout benefits;
▪make interest and principal payments on funding agreements;
▪pay taxes; and
▪pay cash dividends.
Over the long term, Mount Logan believes it will be able to (i) grow Mount Logan's Assets Under Management and generate positive investment performance in the funds Mount Logan manages, which it expects will allow us to grow its management fees and incentive fees and (ii) grow the investment portfolio of insurance solutions services, in each case in amounts sufficient to cover Mount Logan’s long-term liquidity requirements, which may include:
▪supporting the future growth of our businesses;
▪creating new or enhancing existing products and investment platforms;
▪making payments to policyholders;
▪pursuing new strategic corporate investment opportunities; and
▪paying interest and principal on Mount Logan’s financing arrangements.
Cash Flow Analysis
The section below discusses in more detail Mount Logan’s primary sources and uses of cash and the primary drivers of cash flows within Mount Logan’s consolidated statements of cash flows:
| Six months ended June 30, | |||||||||||
| (in thousands) | 2025 | 2024 | |||||||||
| Operating activities | $ | (6,993) | $ | (22,057) | |||||||
| Investing activities | $ | 17,045 | $ | (37,258) | |||||||
| Financing activities | $ | 22,016 | $ | 70,121 | |||||||
| Cash, cash equivalents and restricted cash, and cash and cash equivalents of consolidated VIEs, end of period | $ | 133,772 | $ | 101,026 | |||||||
Operating Activities
Mount Logan’s operating activities support its Asset Management and Insurance Solutions activities. The primary sources of cash within operating activities include: (a) management and performance fees, (b) insurance premiums, (c) reinsurance recoverable, (d) proceeds for sales of investments from Mount Logan’s consolidated VIEs and (e) cash interest received from investments. The primary uses of cash within operating activities include: (a) investment purchases from Mount Logan’s consolidated VIEs (b) compensation and non-compensation related expenses, (c) benefit payments, (d) cash interest paid on debt obligations and (e) other operating expenses. A significant use of cash within operating activities pertain to future policy benefits incurred in the LTC business. As the LTC business is in run-off, this activity is expected to have less of an impact to cash outflow over time.
▪During the six months ended June 30, 2025 and June 30, 2024, cash used in operating activities reflects Asset Management expense reimbursements to BCPA under the servicing agreement for third-party costs incurred, interest expense on borrowings, compensation and quarterly tax payments. Cash used in operating activities also reflects net cash benefit payments associated with the LTC business, purchases of investments by consolidated VIEs, policy acquisition costs, and other operating expenses within Insurance Solutions segment. These outflows were partially offset by inflows of management fees, realized incentive fees, distributions from SCIM, investment income, reinsurance recoverables related to the LTC business and proceeds from the sale of investments held by consolidated VIEs within Insurance Solutions.
Investing Activities
Mount Logan’s investing activities support the growth of its business. The primary sources of cash within investing activities include sales, maturities and repayments of investments. The primary uses of cash within investing activities include: (a) acquisition of consolidated business(es) and (b) purchases and acquisitions of new investments. The cash flow activities related to MYGA products is split across investing activities and financing activities. As the Company assumes new MYGA products, the receipt of cash is reported in financing activities and the corresponding purchase of securities is reported in investing activities. As a result, as the MYGA portfolio grows, these cash flow activities while related, will continue to present an inflow to financing activities and an outflow to investing activities.
▪During the six months ended June 30, 2025, cash provided by investing activities primarily reflects the sales, maturities and repayment of investments, partially offset by purchase of investments, mainly available-for-sale (“AFS”) and mortgage loans within Insurance Solutions.
▪During the six months ended June 30, 2024, cash used in investing activities primarily reflects the purchase of investments due to the deployment of significant cash inflows from the reinsurance of MYGA contracts within Insurance Solutions, partially offset by the sales, maturities and repayments of investments.
Financing Activities
Mount Logan’s financing activities reflect its capital market transactions and transactions with equity holders. The primary sources of cash within financing activities primarily include proceeds from debt issuances and proceeds from reinsurance of MYGA. The primary uses of cash within financing activities include dividends paid and repayments of debt.
▪During the six months ended June 30, 2025, cash provided by financing activities primarily reflects deposits from the assumption of the NSG MYGA block as well as increased borrowings in the Insurance Solutions segment. These inflows were partially offset by surrenders or benefit payments related to MYGA policies (classified as investment-type contracts) within the Insurance Solutions segment, and the repayment of debt within the Asset Management segment and the payment of dividends.
▪During the six months ended June 30, 2024, cash provided by financing activities primarily reflects proceeds from the issuance of debenture units under the Asset Management segment and net inflows associated with the reinsurance of new MYGA contracts within the Insurance Solutions segment. These inflows were partially offset by repayments on borrowings within Asset Management.
Contractual Obligations, Commitments and Contingencies
For a summary and a description of the nature of Mount Logan’s commitments, contingencies and contractual obligations, see Note 23. Commitments and contingencies to the condensed consolidated financial statements.
Consolidated VIEs
Mount Logan manages its liquidity needs by evaluating unconsolidated cash flows; however, Mount Logan’s financial statements reflect the financial position of Mount Logan as well as consolidated VIEs. The primary sources and uses of cash at Mount Logan's consolidated VIEs include: (a) proceeds from sales, maturities and repayments of investments and (b) purchase of investments.
Dividends and Distributions
For information regarding the quarterly dividends that were made to common stockholders and distribution equivalents on participating securities, see Note 18. Equity to the condensed consolidated financial statements. Although Mount Logan currently expects to pay dividends, Mount Logan may not pay dividends if, among other things, Mount Logan does not have the cash necessary to pay the dividends. To the extent it does not have sufficient cash on hand to pay dividends, Mount Logan may have to borrow funds to pay dividends, or it may determine not to pay dividends. The primary source of funds for dividends is distributions from Mount Logan’s operating subsidiaries, which are expected to be adequate to fund dividends and other cash flow requirements based on current estimates of future obligations. The ability of these operating subsidiaries to make distributions to Mount Logan will depend on satisfying applicable law with respect to such distributions, including surplus and minimum solvency requirements among others. On March 13, 2025 Mount Logan declared a cash dividend of C$0.02 per share of its common stock, which was paid on April 10, 2025, to holders of record at the close of business on April 3, 2025. On May 15, 2025 Mount Logan declared a cash dividend of C$0.02 per share of its common stock, which was paid on June 2, 2025, to holders of record at the close of business on May 27, 2025.
Asset Management Liquidity
Mount Logan’s Asset Management business requires limited capital resources to support the working capital or operating needs of the business. For the Asset Management business’s longer term liquidity needs, Mount Logan expects to continue to fund the Asset Management business’s operations through management fees and performance fees received. Liquidity needs are also met through proceeds from borrowings and equity issuances as described in Note 11. Debt obligations and Note 18. Equity to the condensed consolidated financial statements, respectively. From time to time, if Mount Logan determines that market conditions are favorable after taking into account Mount Logan’s liquidity requirements, we may seek to raise proceeds through the issuance of additional debt or equity instruments.
At June 30, 2025, the Asset Management business had $2.7 million of unrestricted cash and cash equivalents.
Future Debt Obligations
The Asset Management business had long-term debt outstanding of $75.1 million at June 30, 2025, which includes notes with maturities in 2025, 2027, 2031 and 2032. There are also scheduled incremental repayments of principal on the credit facility in 2025 and 2026. See Note 11. Debt obligations to the condensed consolidated financial statements for further information regarding the Asset Management business’s debt arrangements.
Future Cash Flows
Mount Logan’s ability to execute Mount Logan’s business strategy, particularly Mount Logan’s ability to increase Mount Logan’s AUM, depends on Mount Logan’s ability to establish new funds and to raise additional investor capital within such funds. Mount Logan’s liquidity will depend on a number of factors, such as Mount Logan’s ability to project our financial performance, which is highly dependent on the funds it manage and its ability to manage our projected costs, fund performance, access to credit facilities, compliance with the existing credit agreement, as well as industry and market trends. Also during economic downturns the funds Mount Logan manages might experience cash flow issues or liquidate entirely. In these situations, Mount Logan might be asked to reduce or eliminate the management fee and incentive fees it charges, which could adversely impact Mount Logan’s cash flow in the future. An increase in the fair value of the investments of the funds Mount Logan manages, by contrast, could favorably impact its liquidity through higher management fees where the management fees are calculated based on the net asset value, gross assets or adjusted assets.
Additionally, higher incentive fees not yet realized would generally result when investments appreciate over their cost basis which would not have an impact on the Asset Management business’s cash flow until realized.
Consideration of Financing Arrangements
As noted above, the Asset Management business has and may continue to issue debt to supplement its liquidity. The decision to enter into a particular financing arrangement is made after careful consideration of various factors, including the Asset Management business’s cash flows from operations, future cash needs, current sources of liquidity, demand for the Asset Management business’s debt or parent's equity, and prevailing interest rates.
Insurance Solutions Liquidity and funding risk
Liquidity risk is the risk that an entity will encounter difficulty in meeting obligations associated with its financial liabilities as they fall due or can only do so on terms that are materially disadvantageous. Prudent liquidity risk management includes maintaining sufficient cash on hand and the availability of funding through an adequate amount of committed credit facilities. Mount Logan also has the ability to raise additional liquidity through the issuance of debt, and through the sale of its portfolio investments. Periodic cash flow forecasts are performed to ensure Ability has sufficient cash to meet operational and financing costs.
Liquid assets
Liquid assets, including high-quality assets that are marketable, can be pledged as security for borrowings, and can be converted to cash in a time frame that meets liquidity and funding requirements.
| As at | June 30, 2025 | December 31, 2024 | |||||||||
Cash and cash equivalents 1 | $ | 119,766 | $ | 77,055 | |||||||
| Restricted cash | 11,258 | 15,716 | |||||||||
| Investments | 621,531 | 637,048 | |||||||||
| Receivable for investments sold | 283 | 17,045 | |||||||||
Accrued interest and dividend receivable 1 | 18,922 | 18,580 | |||||||||
| Total liquid assets | $ | 771,760 | $ | 765,444 | |||||||
(1)Cash and cash equivalents and accrued interest & dividend receivable includes cash and cash equivalent and accrued interest of consolidated VIEs, respectively.
The liquid assets held by Mount Logan's insurance company, Ability, are subject to restrictions which prevent Mount Logan from transferring these assets to other entities within the group without insurance regulatory approvals. These assets are not restricted for use within the insurance company.
Insurance Subsidiaries’ Operating Liquidity
The primary cash flow sources for Ability include retirement services product inflows, investment income, and principal repayments on its investments. Uses of cash include investment purchases, payments to policyholders for surrenders, withdrawals and payout benefits, interest and principal payments on funding agreements and outstanding debt, policy acquisition and general operating costs.
Ability’s policyholder obligations are generally long-term in nature. However, policyholders may elect to withdraw some, or all, of their account value in amounts that exceed Ability’s estimates and assumptions over the life of an annuity contract. Ability includes provisions within its annuity policies, such as surrender charges and market value adjustments, which are intended to protect it from early withdrawals. As of June 30, 2025, and June 30, 2024, approximately 77% and 76%, respectively, of Ability’s MYGA policies were subject to penalty upon surrender. In addition, as of June 30, 2025, and June 30, 2024, approximately 75% and 97%, respectively, of policies contained Market Value Adjustments (“MVAs”) that may also have the effect of limiting early withdrawals if interest rates increase but may encourage early withdrawals by effectively subsidizing a portion of surrender charges when interest rates decrease.
Dividends from Insurance Subsidiaries
The NAIC has established minimum capital requirements in the form of RBC that factors the type of business written by an insurance company, the quality of its assets and various other aspects of its business to develop a minimum level of capital known as “authorized control level risk-based capital” and compares this level to adjusted statutory capital that includes capital and surplus as reported under SAP, plus certain investment reserves. Should the ratio of adjusted statutory capital to control level RBC fall below 200%, a series of remedial actions by the affected company would be required. As of December 31, 2024, and 2023, the RBC ratio of Ability was 325% and 400%, respectively.
The ability to pay dividends is limited by applicable laws and regulations of the jurisdiction where Ability is domiciled, as well as agreement(s) entered into with regulators. These laws and regulations require, among other things, Ability to maintain minimum solvency requirements and limit the amount of dividends Ability can pay. Nebraska state insurance laws and regulations require that the statutory surplus following any dividend or distribution must be reasonable in relation to their outstanding liabilities and adequate for its financial needs.
Future Debt Obligations
Ability had long-term debt of $17.3 million as of June 30, 2025, which includes notes with maturities in 2028, 2032, and 2033. See Note 11. Debt obligations to the condensed consolidated financial statements for further information regarding Ability’s debt arrangements.
Capital
Ability believes it has a strong capital position and is well positioned to meet policyholder and other obligations. Ability measures capital sufficiency using various internal capital metrics which reflect management’s view on the various risks inherent to its business, the amount of capital required to support its core operating strategies and the amount of capital necessary to maintain its current ratings in a recessionary environment. The amount of capital required to support Ability’s core operating strategies is determined based upon internal modeling and analysis of economic risk, as well as inputs from rating agency capital models and consideration of NAIC risk-based capital (“RBC”) requirements. Capital in excess of this required amount is considered excess equity capital, which is available to deploy. As of December 31, 2024, and December 31, 2023, Ability’s RBC ratio was 325% and 400%, respectively. The formulas for determining the amount of RBC specify various weighting factors that are applied to financial balances or various levels of activity based on the perceived degree of risk.
Critical Accounting Estimates
This Management’s Discussion and Analysis of Financial Condition and Results of Operations is based upon the consolidated financial statements, which have been prepared in accordance with U.S. GAAP. The preparation of financial statements in accordance with U.S. GAAP requires the use of estimates and assumptions that could affect the reported amounts of assets and liabilities, the disclosure of contingent assets and liabilities and the reported amounts of revenues and expenses. Actual results could differ from these estimates. A summary of our significant accounting policies is presented in Note 2. Summary of significant accounting policies to our condensed consolidated financial statements. The following is a summary of our accounting policies that are affected most by judgments, estimates and assumptions.
Critical Accounting Estimates - Overall
Consolidation
Mount Logan assesses all entities in which Mount Logan has a variable interest for consolidation including management companies, insurance companies, investment companies, collateralized loan obligations (“CLOs”), and other entities. A variable interest is an investment or other interest that will absorb portions of an entity’s expected losses and/or receive expected residual returns. Fees earned by Mount Logan that (i) include terms, conditions, or amounts that are customarily present in arrangements for similar services negotiated at arm’s length, (ii) are commensurate with the level of effort required to provide those services, and (iii) where Mount Logan does not hold other economic interests in the entity that would absorb more than an insignificant amount of the expected losses or returns of the entity, would not be considered to be variable interests.
Pursuant to its consolidation policy, once Mount Logan determines it has a variable interest in an entity, Mount Logan considers whether the entity is a VIE. Entities that do not qualify as VIEs are assessed for consolidation as voting interest entities ("VOEs") under the voting interest model.
An entity is a VIE if one of the following conditions exist: (a) the equity at risk is not sufficient for the entity to finance its activities without additional subordinated financial support, (b) the holders of the equity at risk (as a group) lack the ability to make decisions about the activities that most significantly impact the entity’s economic performance, or (c) the voting rights of some investors are disproportionate to their obligation to absorb the expected losses of the legal entity, their rights to receive the expected residual returns of the legal entity, or both and substantially all of the legal entity's activities either involve or are conducted on behalf of an investor with disproportionately few voting rights. Limited partnerships and other similar entities where limited partners, not affiliated with the general partner, have not been granted (i) substantive participation rights or (ii) substantive rights to either dissolve the partnership or remove the general partner are VIEs.
Mount Logan consolidates VIEs in which it is the primary beneficiary. Mount Logan is the primary beneficiary if it holds a controlling financial interest which is defined as possessing both (a) the power to direct the activities of a VIE that most significantly impact the VIE's economic performance and (b) the obligation to absorb losses of the VIE or the right to receive benefits from the VIE that could potentially be significant to the VIE. Mount Logan determines whether it is the primary beneficiary of a VIE at the time it becomes involved with a VIE and reconsiders that conclusion on an ongoing basis if facts and circumstances change.
Entities determined not to be VIEs are VOEs and are evaluated under the voting interest model. Mount Logan typically consolidates VOEs when it has a majority voting interest.
Each entity is assessed for consolidation individually considering the specific facts and circumstances surrounding that entity. The consolidation assessment, including the determination whether an entity is a VIE or VOE, depends on the facts and circumstances for each entity, and therefore Mount Logan’s investment companies may qualify as VIEs or VOEs.
With respect to CLOs (which are generally VIEs), as collateral manager, Mount Logan generally has the power to direct the activities of the CLO that most significantly impact the CLO’s economic performance. In some, but not all cases, Mount Logan, through its ownership in the CLOs, may have variable interests that represent an obligation to absorb losses of, or a right to receive benefits from, the CLO that could potentially be significant to the CLO. In cases where Mount Logan has both the power to direct the activities of the CLO that most significantly impact the CLO’s economic performance and the obligation to absorb losses of the CLO or the right to receive benefits from the CLO that could potentially be significant to the CLO, Mount Logan is deemed to be the primary beneficiary and consolidates the CLO.
Assets and liabilities of the consolidated VIEs are primarily presented in separate sections within the Consolidated Statements of Financial Position. Changes in the fair value of the consolidated VIEs’ assets and liabilities and related interest, dividend and other income and expenses are primarily presented within revenues of consolidated variable interest entities and Income of consolidated variable interest entities, for the Asset Management and Insurance Solutions segments, respectively, in the Consolidated Statements of Operations.
Income Taxes
Significant judgment is required in determining tax expense and in evaluating certain and uncertain tax positions. Mount Logan recognizes the tax benefit of uncertain tax positions when the position is “more likely than not” to be sustained upon examination, including resolution of any related appeals or litigation processes, based on the technical merits of the position. The tax benefit is measured as the largest amount of benefit that has a greater than 50% likelihood of being realized upon ultimate settlement. If a tax position is not considered more likely than not to be sustained, then no benefits of the position are recognized. Mount Logan’s tax positions are reviewed and evaluated quarterly to determine whether Mount Logan has uncertain tax positions that require financial statement recognition.
Deferred tax assets and liabilities are recognized for the expected future tax consequences of differences between the carrying amount of assets and liabilities and their respective tax bases using currently enacted tax rates. The effect on deferred tax assets and liabilities of a change in tax rates is recognized in income in the period during which the change is enacted. Deferred tax assets are reduced by a valuation allowance when it is more likely than not that all or a portion of the deferred tax assets will not be realized.
Critical Accounting Estimates- Asset Management Segment
Investments, at Fair Value
On a quarterly basis, Mount Logan utilizes a valuation committee consisting of members from senior management, to review and approve the valuation results related to the investments of the funds ML Management manages. Mount Logan also retains external valuation firms to provide third-party valuation consulting services to Mount Logan, which consist of certain limited procedures that management identifies and requests them to perform. The limited procedures provided by the external valuation firms assist management with validating their valuation results or determining fair value. Mount Logan performs various back-testing procedures to validate their valuation approaches, including comparisons between expected and observed outcomes, forecast evaluations and variance analyses. However, because of the inherent uncertainty of valuation, the estimated values may differ significantly from the values that would have been used had a ready market for the investments existed, and the differences could be material. The fair values of the investments in the funds Mount Logan manages can be impacted by changes to the assumptions used in the underlying valuation models. There have been no material changes to the valuation approaches utilized during the periods that Mount Logan’s financial results are presented in this report.
Fair Value of Financial Instruments
Except for Mount Logan’s debt obligations (each as defined in Note 11. Debt obligations to Mount Logan’s condensed consolidated financial statements), Mount Logan's financial instruments are recorded at fair value or at amounts whose carrying values approximate fair value. See “Investments, at Fair Value” above. While Mount Logan's valuations of portfolio investments are based on assumptions that Mount Logan believes are reasonable under the circumstances, the actual realized gains or losses will depend on, among other factors, future operating results, the value of the assets and market conditions at the time of disposition, any related transaction costs and the timing and manner of sale, all of which may ultimately differ significantly from the assumptions on which the valuations were based. Financial instruments’ carrying values generally approximate fair value because of the short-term nature of those instruments or variable interest rates related to the borrowings.
Revenue Recognition
Management Fees
ML Management provides investment management services to investment funds, CLOs, and other vehicles in exchange for a management fee. Management fees are determined quarterly using an annual rate which are generally based upon (i) a percentage of the capital committed during the commitment period, and thereafter based on the remaining invested capital of unrealized investments, or (ii) net asset value, gross assets, or as otherwise provided in the respective agreements. Management fees are recognized over time, during the period in which the related services are performed.
Incentive Fees
ML Management provides investment management services to investment funds, CLOs, managed accounts and other vehicles in exchange for a management fee, as discussed above and, in some cases an incentive fee, a type of performance revenue. The incentive fee consists of two parts: (i) an income incentive fee which is based on pre-incentive fee net investment income in excess of a hurdle rate and (ii) a capital gains incentive fee which is based on cumulative realized capital gains and losses and unrealized capital depreciation. Incentive fees are considered a form of variable consideration as they are based the fund achieving certain investment return hurdles. Accordingly, the recognition of such fee is deferred until it is probable that a significant reversal in the amount of cumulative revenue will not occur, which is generally upon liquidation of the investment fund. Accordingly, the recognition of such fee is deferred until it is probable that a significant reversal in the amount of cumulative revenue will not occur, which is generally upon liquidation of the investment fund.
Critical Accounting Estimates - Insurance Solutions Segment
Investments
Mount Logan is responsible for the fair value measurement of investments presented in the consolidated financial statements. Mount Logan performs regular analysis and review of its valuation techniques, assumptions and inputs used in
determining fair value to evaluate if the valuation approaches are appropriate and consistently applied, and the various assumptions are reasonable. Mount Logan also performs quantitative and qualitative analysis and review of the information and prices received from commercial pricing services and broker-dealers, to verify it represents a reasonable estimate of the fair value of each investment. In addition, Mount Logan uses both internally-developed and commercially-available cash flow models to analyze the reasonableness of fair values using credit spreads and other market assumptions, where appropriate. For investment funds, Mount Logan typically recognizes its investment, including those for which it has elected the fair value option, based on net asset value information provided by the general partner or related asset manager. For a discussion of investment funds for which it has elected the fair value option, see Note 8. Fair value measurements to the condensed consolidated financial statements.
Valuation of Fixed Maturity Securities, Equity Securities and Mortgage Loans
The following tables presents the fair value of fixed maturity securities, equity securities and mortgage loans, including those with related parties and those held by consolidated VIEs, by fair value hierarchy. Investments classified as Equity Method for which the FVO has not been elected have been excluded from the table below:
| Fair Value Measurements | ||||||||||||||||||||||||||||||||
| June 30, 2025 | Level 1 | Level 2 | Level 3 | NAV | Total | |||||||||||||||||||||||||||
| Financial assets | ||||||||||||||||||||||||||||||||
| Asset Management | ||||||||||||||||||||||||||||||||
| Equity securities | $ | 1,042 | $ | — | $ | 5,849 | $ | — | $ | 6,891 | ||||||||||||||||||||||
| Total financial assets — Asset Management | 1,042 | — | 5,849 | — | 6,891 | |||||||||||||||||||||||||||
| Insurance Solutions | ||||||||||||||||||||||||||||||||
| Debt securities: | ||||||||||||||||||||||||||||||||
| U.S. government and agency | — | 6,135 | — | — | 6,135 | |||||||||||||||||||||||||||
| U.S. state, territories and municipalities | — | 5,334 | — | — | 5,334 | |||||||||||||||||||||||||||
| Other government and agency | — | 2,363 | — | — | 2,363 | |||||||||||||||||||||||||||
| Corporate | — | 216,281 | 5,066.5008 | — | 221,347 | |||||||||||||||||||||||||||
| Asset and mortgage-backed securities | — | 340,568 | 15,113 | — | 355,681 | |||||||||||||||||||||||||||
| Corporate loans | — | 27,975 | 134,741 | — | 162,716 | |||||||||||||||||||||||||||
| Equity securities | 237 | 2,612 | 3,000 | 1,927 | 7,776 | |||||||||||||||||||||||||||
| Other invested assets | — | 887.9472 | 3,163 | 302 | 4,353 | |||||||||||||||||||||||||||
| Total financial assets — Insurance Solutions | 237 | 602,155 | 161,083 | 2,229 | 765,704 | |||||||||||||||||||||||||||
| Corporate loans of consolidated VIEs | — | — | 128,806 | — | 128,806 | |||||||||||||||||||||||||||
| Equity of consolidated VIEs | — | — | 247 | — | 247 | |||||||||||||||||||||||||||
| Total financial assets including consolidated VIEs | 237 | 602,155 | 290,136 | 2,229 | 894,757 | |||||||||||||||||||||||||||
| Total financial assets | $ | 1,279 | $ | 602,155 | $ | 295,985 | $ | 2,229 | $ | 901,648 | ||||||||||||||||||||||
| Financial liabilities | ||||||||||||||||||||||||||||||||
| Asset Management | ||||||||||||||||||||||||||||||||
| Debt obligations | $ | — | $ | — | $ | 132 | $ | — | $ | 132 | ||||||||||||||||||||||
| Total financial liabilities — Asset Management | — | — | 132 | — | 132 | |||||||||||||||||||||||||||
| Insurance Solutions | ||||||||||||||||||||||||||||||||
| Ceded reinsurance - embedded derivative | — | 32,789 | — | — | 32,789 | |||||||||||||||||||||||||||
| Interest rate swaps | — | 457 | — | — | 457 | |||||||||||||||||||||||||||
| Total financial liabilities — Insurance Solutions | — | 33,245 | — | — | 33,245 | |||||||||||||||||||||||||||
| Total financial liabilities | $ | — | $ | 33,245 | $ | 132 | $ | — | $ | 33,377 | ||||||||||||||||||||||
| Fair Value Measurements | ||||||||||||||||||||||||||||||||
| December 31, 2024 | Level 1 | Level 2 | Level 3 | NAV | Total | |||||||||||||||||||||||||||
| Financial assets | ||||||||||||||||||||||||||||||||
| Asset Management | ||||||||||||||||||||||||||||||||
| Equity securities | $ | 1,777 | $ | — | $ | 499 | $ | — | $ | 2,276 | ||||||||||||||||||||||
| Total financial assets — Asset Management | 1,777 | — | 499 | — | 2,276 | |||||||||||||||||||||||||||
| Insurance Solutions | ||||||||||||||||||||||||||||||||
| Fair Value Measurements | ||||||||||||||||||||||||||||||||
| December 31, 2024 | Level 1 | Level 2 | Level 3 | NAV | Total | |||||||||||||||||||||||||||
| Debt securities: | ||||||||||||||||||||||||||||||||
| U.S. government and agency | — | 8,075 | — | — | 8,075 | |||||||||||||||||||||||||||
| U.S. state, territories and municipalities | — | 5,252 | — | — | 5,252 | |||||||||||||||||||||||||||
| Other government and agency | — | 2,369 | — | — | 2,369 | |||||||||||||||||||||||||||
| Corporate | — | 226,249 | — | — | 226,249 | |||||||||||||||||||||||||||
| Asset and mortgage-backed securities | — | 364,875 | 8,641 | — | 373,516 | |||||||||||||||||||||||||||
| Corporate loans | — | — | 114,734 | — | 114,734 | |||||||||||||||||||||||||||
| Equity securities | 310 | 11,134 | 2,918 | 2,042 | 16,404 | |||||||||||||||||||||||||||
| Other invested assets | — | — | 4,575 | — | 4,575 | |||||||||||||||||||||||||||
| Total financial assets — Insurance Solutions | 310 | 617,954 | 130,868 | 2,042 | 751,174 | |||||||||||||||||||||||||||
| Corporate loans of consolidated VIEs | — | — | 125,757 | — | 125,757 | |||||||||||||||||||||||||||
| Equity securities of consolidated VIEs | — | — | 141 | — | 141 | |||||||||||||||||||||||||||
| Total financial assets including consolidated VIEs | 310 | 617,954 | 256,766 | 2,042 | 877,072 | |||||||||||||||||||||||||||
| Total financial assets | $ | 2,087 | $ | 617,954 | $ | 257,265 | $ | 2,042 | $ | 879,348 | ||||||||||||||||||||||
| Financial liabilities | ||||||||||||||||||||||||||||||||
| Asset Management | ||||||||||||||||||||||||||||||||
| Debt obligations | $ | — | $ | — | $ | 1,471 | $ | — | $ | 1,471 | ||||||||||||||||||||||
| Total financial liabilities — Asset Management | — | — | 1,471 | — | 1,471 | |||||||||||||||||||||||||||
| Insurance Solutions | ||||||||||||||||||||||||||||||||
| Ceded reinsurance - embedded derivative | — | 34,770 | — | — | 34,770 | |||||||||||||||||||||||||||
| Interest rate swaps | — | 5,192 | — | — | 5,192 | |||||||||||||||||||||||||||
| Total financial liabilities — Insurance Solutions | — | 39,962 | — | — | 39,962 | |||||||||||||||||||||||||||
| Total financial liabilities | $ | — | $ | 39,962 | $ | 1,471 | $ | — | $ | 41,433 | ||||||||||||||||||||||
Goodwill
We review goodwill for impairment annually and whenever events or changes in the business environment may indicate the carrying amount of one of our reporting units may exceed its fair value. Our methodology for conducting this goodwill impairment testing contains both a qualitative and quantitative assessment. In evaluating the recoverability of goodwill, we perform a qualitative analysis at the reporting unit level to determine whether there are any events or circumstances that would indicate it is more likely than not that the fair value of a reporting unit is below its carrying value. Based on the results of this analysis, if we determine that it is more likely than not that the fair value of a reporting unit is less than its carrying amount, we then perform the impairment evaluation using a quantitative assessment based on an analysis of the discounted future cash flows generated by the underlying assets. The process of determining whether goodwill is impaired or recoverable relies on projections of future cash flows, operating results and market conditions. Future cash flow estimates are based partly on economic trends such as interest rates and market conditions, which are beyond our control and are likely to fluctuate.
Mount Logan has determined it has two reporting units: (1) LTC, its legacy run-off business, and (2) MYGA and & Other (“MYGA”). The fair value of reporting unit is determined from a projection of future cash flows and operating results derived from both the in-force business and new business expected in the future. This approach requires assumptions including premium growth rates, capital requirements, interest rates, mortality, morbidity, policyholder behavior, and discount rates. These assumptions are consistent with internal projections and operating plans. We believe these estimates and assumptions are reasonable and comparable to those that would be used by other marketplace participants. To calculate the fair value of the insurance business, Mount Logan discounted projected earnings from in-force contracts and valued new business growing at expected plan levels, consistent with the periods used for forecasting long term businesses, in addition to considering a terminal value for the value of new business beyond five years at Mount Logan’s long-term growth rate. In arriving at its projections, Mount Logan considered past experience, economic trends such as interest rates, capital requirements and market trends. Capital requirements were based on a risk based capital (RBC) ratio of 350.0%. Excess capital above this requirement was added to the fair value of the reporting units, consistent with market participant treatment. Mount Logan's key assumptions for the new MYGA business were the (i) discrete premium growth rate, (ii) interest rate, and (iii) capital requirements, which are discussed further below:
i.The discrete MYGA premium growth rate in the fair value calculations were based on maintaining management’s target RBC ratio of 350%. RBC of 350% is anticipated to be maintained based on the performance of the investment portfolio and additional capital contributions. We assumed a higher growth rate in initial years with declining growth in the later years as we continue to scale the business;
ii.Interest rate assumptions are based on prevailing market rates at the valuation date; and,
iii.Capital requirements assumed per management’s target RBC ratio of 350%.
Management has not adjusted its assumptions between the year ended December 31, 2023 and December 31, 2024, rather, the discount rate applied to the quantitative assessment has had the most significant impact. Discount rates assumed in determining the fair value for applicable reporting units was based on a cost of equity of 17.5% and 23.5% on an after-tax basis for LTC and MYGA, respectively for impairment testing for the year ended December 31, 2024. Capital Asset Pricing Model (“CAPM”) was used to estimate the cost of equity. The cost of equity was derived using the 20-year U.S. treasury bond yield and by adding an equity risk premium. The equity risk premium considers 100 basis point and 700 basis point execution risk to account for the risk of achieving the planned forecast for LTC and MYGA, respectively. This represents a change in approach from the year ended December 31, 2023 where discount rates were based on a weighted average cost of capital of 16.0% on an after-tax basis for both LTC and MYGA. Management believes the updated approach better represents the underlying economics of its business. Changes to the discount rate ultimately impact the fair value of each reporting unit, as discussed further below.
We apply significant judgement when determining the estimated fair value of our reporting units. While we believe that our estimates of future cash flows are reasonable, these estimates are not guarantees of future performance and are subject to risks and uncertainties that may cause actual results to differ from what is assumed in our impairment tests. Such analyses are particularly sensitive to changes in estimates of discount rates, future cash flows and other market conditions. A 50 basis point increase to the discount rate assumption, all other assumptions remaining constant, would result in the carrying value exceeding the fair value of the MYGA reporting unit but not the LTC reporting unit. While a 50 basis point decrease to future cash flows, all other assumptions remaining constant, would not result in the carrying value exceeding the fair value of the LTC and/or MYGA reporting units. Management notes that these assumptions are often interdependent and shouldn’t be assessed in isolation. Further changes to these estimates might result in material changes in fair value and determination of the recoverability of goodwill, which may result in charges against earnings and a reduction in the carrying value of our goodwill in the future.
We complete our annual goodwill impairment analyses in the fourth quarter of each period presented using an October 1 measurement date. For the years ended December 31, 2024 and December 31, 2023, we determined from a qualitative standpoint there were no events or circumstances that indicated that the carrying value exceeded the fair value. From a quantitative standpoint as of October 1, 2024, we performed our annual quantitative goodwill impairment test for our reporting units, LTC and MYGA, and as of such date, the fair value was in excess of the carrying value for each reporting unit, by 24.3% and 10.7%, respectively.
Derivatives
Freestanding derivatives are instruments that Ability has entered into as part of their overall risk management strategies. Such contracts include interest rate swaps to convert floating-rate interest receipts to fixed-rate interest receipts to reduce exposure to interest rate changes. All derivatives are recognized in Derivatives liability and are presented on a gross basis in the Consolidated Statements of Financial Position and measured at fair value. Changes in fair value are recorded in Accumulated Other Comprehensive Income as the swaps are in hedging relationships, with changes in fair value reclassified into Interest income in the same period as the hedged transactions affect earnings. Any interest accruals will flow through earnings as adjustments to Interest income. Ability’s derivative financial instruments contain credit risk to the extent that its counterparties may be unable to meet the terms of the agreements. Ability attempts to reduce this risk by limiting its counterparties to major financial institutions with strong credit ratings.
To qualify for hedge accounting, at the inception of the hedging relationship, Ability formally documents its risk management objective and strategy for undertaking the hedging transaction. This documentation identifies how the hedging instrument is expected to mitigate the designated risk related to the hedged item and the method that will be used to retrospectively and prospectively assess the hedge effectiveness. A derivative designated as a hedging instrument must be assessed as being highly effective in offsetting the designated risk of the hedged item. Hedge effectiveness is formally assessed at inception and periodically throughout the life of the hedge accounting relationship.
Ability issues and reinsures products or purchases investments that contain embedded derivatives. If it determines an embedded derivative has economic characteristics not clearly and closely related to the economic characteristics of the host contract, and a separate instrument with the same terms would qualify as a derivative instrument, the embedded derivative is bifurcated from the host contract and accounted for separately, unless the Fair Value Option (“FVO”) is elected on the host contract. Under the FVO, bifurcation of the embedded derivative is not necessary as the entire contract is carried at fair value with all related gains and losses recognized in Net gains (losses) from investment activities in the Consolidated Statements of Operations. Embedded derivatives are carried at fair value in the Consolidated Statements of Financial Position in the same line item as the host contract.
Additionally, reinsurance agreements written on a funds withheld or modco basis contain embedded derivatives. Ability has determined that the obligation to pay the total return on the assets supporting the funds withheld liability represents a total return swap with a floating rate leg. The fair value of embedded derivatives on funds withheld and modco agreements is computed as the unrealized gain (loss) on the underlying assets and is included within the funds withheld under reinsurance contracts in the Consolidated Statements of Financial Position.
The change in the fair value of the embedded derivatives is recorded in Net investment income (loss) on funds withheld in the Consolidated Statements of Operations. Ceded earnings from funds withheld liability and changes in the fair value of embedded derivatives are reported in operating activities in the Consolidated Statements of Cash Flows. Contributions to and withdrawals from funds withheld liability are reported in operating activities in the Consolidated Statements of Cash Flows.
Ability’s insurance operations include providing reinsurance related to LTC, as well as MYGA products. Insurance contracts are contracts with significant mortality and/or morbidity risks, while investment contracts are contracts without such risks. MYGA contracts were deemed to be investment contracts. Insurance revenue is comprised primarily of premiums and investment income. For traditional long-duration insurance contracts, Mount Logan reports premiums as revenue when due. Premiums received on MYGA products (a product without significant mortality risk) are not reported as revenue but rather as deposit liabilities. Mount Logan recognizes revenue for charges and assessments on these contracts, mostly relating to surrender charges. Interest credited to policyholder accounts is charged to expense.
Future policy benefit reserves represent the present value of future benefits to be paid to or on behalf of policyholders and related expenses less the present value of future net premiums. The liability is measured for each group of contracts (i.e., cohorts) using current cash flow assumptions. Contracts are grouped into cohorts by line of business, product type and cash flow streams, based on the date the policy was acquired (which for the entire LTC portfolio is the date of the acquisition of Ability Insurance). Future policy benefit reserves are adjusted each period because of updating lifetime net premium ratios for differences between actual and expected experience with the retroactive effect of those variances recognized in current period earnings. Ability reviews at least annually in the third quarter, future policy benefit reserves cash flow assumptions, and if the review concludes that the assumptions need to be updated, future policy benefit reserves are adjusted retroactively based on the revised net premium ratio using actual historical experience, updated cash flow assumptions, and the locked-in discount rate with the effect of those changes recognized in current period earnings.
As Ability’s LTC business is in run-off, the locked-in discount rate is used for the computation of interest accretion on future policy benefit reserves recognized in earnings. However, cash flows used to estimate future policy benefit reserves are also discounted using an upper-medium grade (i.e., low credit risk) fixed-income instrument yield reflecting the duration characteristics of the liabilities and is updated each reporting period with changes recorded in AOCI. As a result, changes in the current discount rate at each reporting period are recognized as an adjustment to AOCI and not earnings each period, whereas, changes relating to cash flow assumptions are recognized in the Insurance Solutions Statement of Earnings (Loss).
Liabilities for the MYGA investment contracts equal the account value, that is, the amount that accrues to the benefit of the contract or policyholder including credited interest and assessments through the financial statement date. See Note 14. Interest sensitive contract liabilities for further information.
Recent Accounting Pronouncements
A list of recent accounting pronouncements that are relevant to Mount Logan and its industries is included in Note 2. Summary of significant accounting policies to Mount Logan’s condensed consolidated financial statements.