S-1: General form for registration of securities under the Securities Act of 1933
Published on January 12, 2026
As filed with the Securities and Exchange Commission on January 12, 2026
Registration No. 333-
UNITED STATES
SECURITIES AND EXCHANGE COMMISSION
Washington, D.C. 20549
FORM S-1
REGISTRATION STATEMENT
UNDER
THE SECURITIES ACT OF 1933
(Exact name of Registrant as specified in its charter)
Delaware | 6282 | 33-2698952 | ||||||
(State or other jurisdiction of incorporation or organization) | (Primary Standard Industrial Classification Code Number) | (I.R.S. Employer Identification Number) | ||||||
650 Madison Avenue, 3rd Floor
New York, New York 10022
(212) 891-2880
(Address, including zip code, and telephone number, including area code, of Registrant’s principal executive offices)
Nikita Klassen | ||
Chief Financial Officer and Corporate Secretary | ||
Mount Logan Capital Inc. | ||
650 Madison Avenue, 3rd Floor | ||
New York, NY 10022 | ||
212-891-2880 | ||
(Name, address, including zip code, and telephone number, including area code, of agent for service)
with a copy to:
Kenneth E. Young, Esq. | ||
Stephen R. Pratt, Esq. | ||
Anna Tomczyk, Esq. | ||
Dechert LLP | ||
3 Bryant Park | ||
| 1095 Avenue of the Americas | ||
| New York, NY 10036 | ||
212-698-3500 | ||
Approximate date of commencement of proposed sale to the public: As soon as practicable after the effective date of this registration statement.
If any of the securities being registered on this Form are to be offered on a delayed or continuous basis pursuant to Rule 415 under the Securities Act of 1933, check the following box. ☐
If this Form is filed to register additional securities for an offering pursuant to Rule 462(b) under the Securities Act, check the following box and list the Securities Act registration statement number of the earlier effective registration statement for the same offering. ☐
If this Form is a post-effective amendment filed pursuant to Rule 462(c) under the Securities Act, check the following box and list the Securities Act registration statement number of the earlier effective registration statement for the same offering. ☐
If this Form is a post-effective amendment filed pursuant to Rule 462(d) under the Securities Act, check the following box and list the Securities Act registration statement number of the earlier effective registration statement for the same offering. ☐
Indicate by check mark whether the registrant is a large accelerated filer, an accelerated filer, a non-accelerated filer, a smaller reporting company, or an emerging growth company. See the definitions of “large accelerated filer,” “accelerated filer,” “smaller reporting company,” and “emerging growth company” in Rule 12b-2 of the Exchange Act.
| Large accelerated filer | ☐ | Accelerated filer | ☐ | ||||||||
| ☒ | Smaller reporting company | ||||||||||
| Emerging growth company | |||||||||||
If an emerging growth company, indicate by check mark if the registrant has elected not to use the extended transition period for complying with any new or revised financial accounting standards provided pursuant to Section 7(a)(2)(B) of the Securities Act. ☐
The registrant hereby amends this registration statement on such date or dates as may be necessary to delay its effective date until the registrant shall file a further amendment that specifically states that this registration statement shall thereafter become effective in accordance with Section 8(a) of the Securities Act or until the registration statement shall become effective on such date as the Securities and Exchange Commission, acting pursuant to said Section 8(a), may determine.
THE INFORMATION IN THIS PRELIMINARY PROSPECTUS IS NOT COMPLETE AND MAY BE CHANGED. WE MAY NOT SELL THESE SECURITIES UNTIL THE REGISTRATION STATEMENT FILED WITH THE SECURITIES AND EXCHANGE COMMISSION IS EFFECTIVE. THIS PRELIMINARY PROSPECTUS IS NOT AN OFFER TO SELL THESE SECURITIES AND IT IS NOT SOLICITING AN OFFER TO BUY THESE SECURITIES IN ANY STATE WHERE THE OFFER OR SALE IS NOT PERMITTED.
Subject to Completion, dated January 12, 2026
PRELIMINARY PROSPECTUS
Mount Logan Capital Inc.
$40,000,000
% Notes Due 2031
Mount Logan Capital Inc. (f/k/a Yukon New Parent, Inc.) (“Mount Logan”, “we” or “us”) (Nasdaq: MLCI) is a diversified alternative asset management and insurance solutions platform. Our mission is to provide our investors with access to a diversified and differentiated set of private market investment solutions to address their capital needs. We conduct our business primarily in the United States through our two business segments: Asset Management and Insurance Solutions. Mount Logan Management LLC (“ML Management”), our Securities and Exchange Commission-registered investment adviser, manages a significant portion of our assets under management (“AUM”) across its various managed funds supported by permanent and semi-permanent capital bases. We tailor our asset management platform to serve high-growth client segments within the institutional, retail, and insurance markets. ML Management also directly manages the capital of our wholly-owned insurance company, Ability Insurance Company (“Ability”), for the benefit of policyholders. Ability, a Nebraska domiciled insurer, specializes in reinsuring annuity products for the increasing number of individuals seeking to fund retirement needs and represents all of our insurance solutions operations.
We are offering $40,000,000 in aggregate principal amount of our % Notes due 2031 (the “Notes”). The Notes will mature on . We will pay interest on the Notes quarterly in arrears on and of each year, beginning , 2026. The purchase price of the Notes includes accrued interest on the Notes from , 2026 to, but not including, the date of delivery. We may redeem the Notes in whole or in part at any time or from time to time on or after at the redemption price of 100% of aggregate principal amount, plus any accrued and unpaid interest, as discussed under “The Offering — Optional Redemption” and “Description of Notes — Optional Redemption” in this prospectus. The Notes will be issued in minimum denominations of $25 and integral multiples of $25 in excess thereof.
The Notes will be our direct senior unsecured obligations and rank pari passu with all outstanding and future unsecured unsubordinated indebtedness issued by Mount Logan.
We intend to apply to list the Notes on The Nasdaq Global Market under the trading symbol “MLCIL,” and if the application is approved, we expect trading in the Notes on The Nasdaq Global Market to begin within 30 days of the original issue date. The Notes are expected to trade “flat,” which means that purchasers will not pay, and sellers will not receive, any accrued and unpaid interest on the Notes that is not included in the trading price. Currently, there is no public market for the Notes.
We are an “emerging growth company” and a “smaller reporting company” under applicable federal securities laws and will be subject to reduced public company reporting requirements. Investing in our securities involves a high degree of risk. See “Risk Factors” beginning on page 15 to read about factors you should consider, including the risk of leverage, before investing in our securities.
This prospectus contains important information you should know before investing in our securities. Please read it before you invest and keep it for future reference.
Neither the Securities and Exchange Commission nor any state securities commission has approved or disapproved of these securities or determined if this prospectus is truthful or complete. Any representation to the contrary is a criminal offense.
| Per Note | Total | ||||||||||
Public Offering Price(1) | $ | $ | |||||||||
Underwriting Discounts and Commissions | $ | $ | |||||||||
Proceeds to Mount Logan, before expenses(2) | $ | $ | |||||||||
_______________
(1)Plus accrued interest, if any, from , 2026, if settlement occurs after that date.
(2)Before deducting expenses payable by us related to the offering, estimated at $ . See “Underwriting (Conflicts of Interest)” in this prospectus.
The underwriters may also purchase up to an additional $6,000,000 aggregate principal amount of Notes offered hereby, to cover over-allotments, if any, within 30 days of the date of this prospectus. If the underwriters exercise this option in full, the total public offering price will be $ , the total underwriting discount and commissions paid by us will be $ , and total proceeds to us, before expenses, will be $ .
We may increase the aggregate principal amount of Notes offered in this offering (inclusive of any additional aggregate principal amount of Notes subject to the underwriters’ over-allotment option) by up to an additional $35.0 million, depending on market conditions and investor demand. Any such increase will be within the maximum aggregate offering price of securities registered under the registration statement of which this prospectus forms a part.
Delivery of the Notes in book-entry form only through The Depository Trust Company (“DTC”) and its participants, including Clearstream Banking, société anonyme (“Clearstream”) and Euroclear Bank SA/NV, as operator of the Euroclear system (“Euroclear”), will be made on or about , 2026.
Joint Book-Running Managers
Lucid Capital Markets | Piper Sandler | BC Partners Securities | ||||||
Co-Managers
Canaccord Genuity | William Blair | Wedbush Securities | ||||||
The date of this prospectus is , 2026
TABLE OF CONTENTS
Page | |||||
You should rely only on the information contained in this prospectus, any free writing prospectus prepared by us or information to which we have referred you. We have not authorized any agent, dealer, salesman or other person to give any information or to make any representation other than those contained in this prospectus. You must not rely upon any information or representation not contained in this prospectus. This prospectus does not constitute an offer to sell or a solicitation of any offer to buy any security other than the registered securities to which this relates, nor does it constitute an offer to sell or a solicitation of an offer to buy any securities in any jurisdiction to any person to whom it is unlawful to make such an offer or solicitation in such jurisdiction. The information contained in this prospectus is accurate as of the date on its cover. Our business, financial condition, results of operations and prospects may have changed since then.
i
CAUTIONARY NOTE REGARDING FORWARD-LOOKING STATEMENTS
Some of the statements in this prospectus constitute forward-looking statements which relate to future events or our future performance or financial condition. In some cases, you can identify these forward-looking statements by the use of words such as “outlook,” “believes,” “expects,” “potential,” “may,” “should,” “could,” “seeks,” “approximately,” “predicts,” “intends,” “plans,” “estimates,” “anticipates” or the negative version of these words or other comparable words. Such forward-looking statements are subject to various risks and uncertainties. Accordingly, there are or will be important factors that could cause actual outcomes or results to differ materially from those indicated.
See “Risk Factors” beginning on page 15 to read about factors you should consider, including the risk of leverage, before investing in our securities. Forward-looking statements speak as of the date on which they are made, and we undertake no obligation to publicly update or review any forward-looking statement, whether as a result of new information, future developments or otherwise, except as required by law. We have based the forward-looking statements included in this prospectus on information available to us on the date of this prospectus, and we assume no obligation to update any such forward-looking statements. Actual results could differ materially from those anticipated in our forward-looking statements, and future results could differ materially from historical performance.
You should understand that, under Sections 27A(b)(2)(B) of the Securities Act and Section 21E(b)(2)B of the Securities Exchange Act of 1934, as amended (the “Exchange Act”), the “safe harbor” provisions of the Private Securities Litigation Reform Act of 1995 do not apply to statements made in connection with any offering of securities pursuant to this prospectus or in any report that we file under the Exchange Act.
1
CERTAIN DEFINED TERMS
When used in this document, unless otherwise indicated in this document or the context otherwise requires:
•“180 Degree Capital” refers to 180 Degree Capital Corp., a corporation organized under the Laws of the State of New York;
•“1940 Act” refers to the Investment Company Act of 1940, as amended;
•“Advisers Act” refers to the Investment Advisers Act of 1940, as amended;
•“AUM” refers to assets under management;
•“BC Partners” refers to BC Partners LLP, an adviser of private equity and real estate funds affiliated with BCPA;
•“BC Partners PE/RE Affiliates” refers to affiliates of BC Partners involved in the private equity and real estate business, and for the avoidance of doubt, does not include BCPA or the BCPA Credit Affiliates;
•“BCPA” refers to BC Partners Advisors L.P., an adviser of credit funds affiliated with BC Partners;
•“BCPA Credit Affiliates” refers to affiliates of BCPA involved in the credit business, and for the avoidance of doubt, does not include BC Partners or the BC Partners PE/RE Affiliates;
•“Board” refers to the Board of Directors of Mount Logan;
•“Business Combination” refers to the combination of the businesses of 180 Degree Capital and Mount Logan and any other transactions contemplated by and pursuant to the terms of the Merger Agreement;
•“Credit Facility” or “Credit Agreement” refers to the Credit Agreement, dated as of August 20, 2021 (as amended from time to time), by and between MLC US Holdings LLC and a large US-based asset manager, as administrative agent and collateral agent for the lenders;
•“Legacy MLC” refers to Mount Logan Capital Inc., a corporation organized under the laws of the Province of Ontario;
•“Merger Agreement” refers to the agreement and plan of merger, dated January 16, 2025, as amended on July 6, 2025, by the Merger Agreement Amendment, among 180 Degree Capital, Mount Logan, Legacy MLC, Polar Merger Sub, Inc., and Moose Merger Sub, LLC, as it may from time to time be further amended, modified or supplemented;
•“MLC Merger Sub” refers to Moose Merger Sub, LLC, a limited liability company formed under the Laws of the State of Delaware;
•“Nasdaq” refers to The Nasdaq Capital Market;
•“Nasdaq Listing Rules” refers to the rules and listing standards of Nasdaq;
•“NAV” refers to net asset value;
•“SEC” refers to the U.S. Securities and Exchange Commission;
•“Securities Act” refers to the United States Securities Act of 1933, as amended;
•“Subsidiary,” when used with respect to any Person, refers to any corporation, partnership, limited liability company or other Person, whether incorporated or unincorporated, that is consolidated with such Person for financial reporting purposes under generally accepted accounting principles; and
2
•“TURN Merger Sub” refers to Polar Merger Sub, Inc., a corporation organized under the Laws of the State of New York.
3
AVAILABLE INFORMATION
This prospectus is part of a registration statement on Form S-1 we have filed with the SEC under the Securities Act to register the securities offered by this prospectus. The registration statement of which this prospectus is a part contains additional information about us and this offering.
We file annual, quarterly and current reports, and other information with the SEC. The SEC maintains an Internet site that contains reports, proxy and information statements and other information that we file electronically with the SEC at www.sec.gov, from which interested persons can electronically access our filings with the SEC, including the registration statement of which this prospectus is a part, including the exhibits and schedules thereto. The reports and other information we file with the SEC also are available through our website at https://ir.mountlogan.com. Information on our website is not incorporated into or a part of this prospectus, other than documents that we file with the SEC that are incorporated by reference in this prospectus.
You may also request a copy of any of our filings with the SEC orally or in writing, at no cost to the requester, directed to the following address: 650 Madison Avenue, 3rd Floor, New York, New York 10022.
No person is authorized by us to give any information or to make any representations other than those contained or incorporated by reference in this prospectus, and, if given or made, such information or representations must not be relied upon as having been authorized by us. Neither the delivery of this prospectus nor any distribution of securities made hereunder shall imply that there has been no change in the information set forth herein or in our affairs since the date hereof.
4
PROSPECTUS SUMMARY
This summary highlights some of the information in this prospectus. It is not complete and does not contain all of the information that you should consider before investing in the notes. You should carefully read the entire prospectus, including the section entitled “Risk Factors,” along with the financial data and related notes and other information included in this prospectus.
As used in this Prospectus, unless otherwise indicated or the context otherwise requires, references to “we,” “us,” “our,” the “Company,” and “Mount Logan” refer to the consolidated operations of Mount Logan Capital Inc. (fka Yukon New Parent, Inc.) and its wholly owned subsidiaries following the Business Combination. References to “Legacy MLC” refer to Mount Logan Capital Inc., a corporation organized under the laws of the Province of Ontario, prior to the consummation of the Business Combination and references to “180 Degree Capital” refer to 180 Degree Capital Corp., a corporation organized under the Laws of the State of New York, prior to the consummation of the Business Combination.
Overview of Mount Logan Capital Inc.
Formed in 2018, Mount Logan is a publicly traded, alternative asset management and insurance solutions platform. Our mission is to provide investors in our funds, accounts and other vehicles access to a diversified and differentiated set of private market investment solutions to address their capital needs and generate attractive risk-adjusted returns on their behalf. We conduct our business primarily in the United States through our two business segments: Asset Management and Insurance Solutions. ML Management, our wholly-owned, SEC-registered investment adviser, manages a significant portion of our AUM across its various managed funds supported by permanent and semi-permanent capital bases. We tailor our asset management platform to serve high-growth client segments within the institutional, retail, and insurance markets.
Ability is a Nebraska domiciled insurer and reinsurer, specializing in reinsuring annuity products for the increasing number of individuals seeking to fund retirement needs and represents all of our insurance solutions operations. Today Ability is the primary business that comprises our Insurance Solutions segment. ML Management manages a significant portion of Ability’s investment portfolio under guidelines designed to support policyholder obligations while generating durable Spread Related Earnings (“SRE”), a key financial metric that we define and report as a non-GAAP financial measure.
5
The diagram below depicts our current organizational structure:
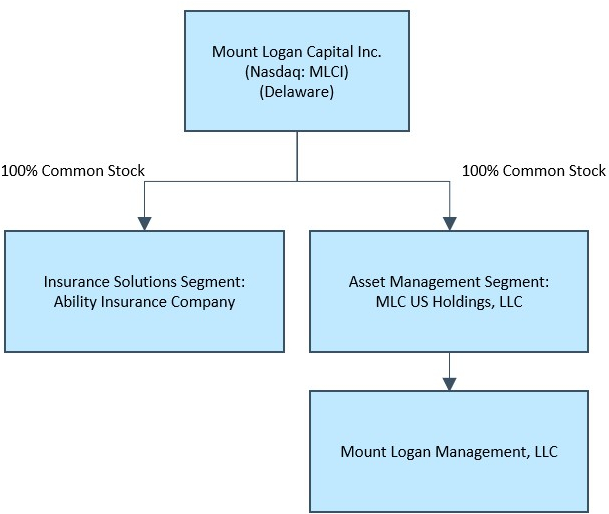
Note: The organizational structure chart above depicts a simplified version of the Mount Logan structure. It does not include all legal entities in the structure. The acquisition of 180 Degree Capital Corp. is reflected as part of the Asset Management segment.
Business Strategy
Asset Management
Our Asset Management segment focuses on private credit across senior secured lending, asset-based and specialty finance, structured and opportunistic credit, venture and growth lending, and select equity-linked solutions. We provide origination, underwriting, portfolio construction and risk management to a diversified client base, including insurance accounts, a BDC platform, our interval funds (SOFIX, ACIF), Separately Managed Accounts (“SMAs”) and other vehicles. We manage substantially all of the assets of Ability, our primary Insurance Solutions business, and maintain an active dialogue with the insurance solutions team.
For these services, we generate recurring fee streams across a diversified set of credit investing strategies. After stripping out the expenses required to generate our fee revenues, the remaining profit stream constitutes Fee Related Earnings (“FRE”), our primary performance measurement for this segment.
Our investment philosophy is centered around deploying capital into well-established middle-market businesses that operate across a wide range of industries, while limiting concentration in any one industry. We employ fundamental credit analysis, targeting investments in businesses with relatively low levels of cyclicality and operating risk. We seek to provide a full credit cycle investment offering, with the ability to opportunistically allocate capital to fill the white space created as other capital sources retrench. As part of our opportunistic allocation of capital, we are able to underwrite complex, less competitive niches, and deploy capital during periods of uncertainty with a consistent emphasis on downside protection and preservation of capital. Many of our mandates utilize multi-year, permanent or semi-permanent capital, allowing us to invest patiently across the capital structure,
6
scale AUM, and compound recurring FRE through cycles. As of September 30, 2025, we had total AUM in excess of $2.1 billion.
We have experience managing levered vehicles, both public and private, and seek to enhance returns through the prudent use of leverage with a conservative approach that prioritizes downside protection and capital preservation. We believe this strategy and approach offers attractive risk-adjusted returns with lower volatility given the potential for fewer defaults and greater resilience through market cycles.
Permanent or Semi-Permanent Capital
Included within our investing strategies above is $1.4 billion of permanent or semi-permanent capital, out of the over $2.1 billion of total AUM, as of September 30, 2025. As of September 30, 2025, permanent capital includes, without limitation, certain assets in our credit strategy, including assets relating to publicly traded and non-traded vehicles, and assets managed for certain of our Insurance Solutions clients, which have indefinite or long-term investment horizons, and in specific cases provide stable sources of funding while allowing for liquidity access for investors through redemption mechanisms. We do not include vehicles with definite term, finite investment periods, or funds that are in wind-down in our definition and aggregation of permanent or semi-permanent capital.
Insurance Solutions
Our retirement-style spread model centers on two core competencies: (i) sourcing long-duration, persistent liabilities via reinsurance treaties, and (ii) deploying those premiums into diversified investment grade and private credit portfolios, constructed and risk-managed by ML Management. We prioritize asset-liability management and capital stewardship, seeking incremental yield primarily by underwriting complexity and liquidity where we believe we are compensated at an attractive risk adjusted return rather than by assuming outsized credit risk. Post-Business Combination, we expect that our stronger balance sheet will enhance our capacity to scale reinsurance production, broaden product offerings over time, and support policyholder stability.
Our Insurance Solutions investment program is designed to earn incremental yield by taking measured liquidity and complexity risk commensurate with long-dated liabilities, while relying on ML Management’s origination and underwriting discipline. We measure performance using SRE, which captures net investment earnings after cost of funds and operating expenses.
Integrated Model and Financial Flexibility
Our Asset Management and Insurance Solutions businesses are strategically integrated: ML Management sources and allocates assets with asset-liability management discipline for Ability. Ability’s liabilities and spread income reinforce the durability of our fee and spread earnings. Following the combination with 180 Degree Capital, we expect increased access to capital and a strengthened balance sheet to accelerate both organic initiatives (such as new strategies, fund scaling, and reinsurance flow) and targeted inorganic growth, further supported by ongoing servicing and scale provided from BCPA. The strength of our platform is built on the experience of our leadership team, the capabilities of a world-class investment team, and strong operational support.
Growth Strategy
We are building a diversified alternative asset management and insurance solutions platform. With the completion of the 180 Degree Capital transaction and our Nasdaq listing, we believe we have improved access to the capital markets, improved financing flexibility and a stronger balance sheet to accelerate organic and inorganic growth initiatives. Our team’s priorities include (i) investing into Ability to support increased reinsurance flows to expand Ability’s liabilities and investment portfolio to generate positive SRE, primarily managed by our registered advisor, Mount Logan Management LLC; (ii) scaling our private credit AUM across existing and future vehicles to increase FRE; and (iii) selective acquisitions and partnerships that broaden origination, diversify products, and enhance operating leverage. These initiatives are intended to reinforce shareholder value by compounding FRE and SRE via a capital flywheel. As assets under management increase, FRE rises, generating additional cash flow at the parent company. We can reinvest this cash into Ability to support new reinsurance treaties, which expand liabilities and invested assets. These assets generate SRE while also increasing AUM managed by Mount Logan, which in turn
7
produces more FRE and cash flow to be re-deployed. We pursue this growth within a framework of disciplined underwriting, regulatory compliance, and capital management.
Asset Management
Our objective is to become a fully diversified private credit manager for institutional, retail and insurance clients. We are growing AUM in existing vehicles, new strategies, and through accretive acquisitions and partnerships that add capital and incremental origination channels. We intend to: (i) expand AUM in our existing vehicles; (ii) launch adjacent strategies that can scale through our distribution network; and (iii) pursue acquisitions or partnerships that add origination and recurring fees. These initiatives are supported by our permanent and semi-permanent capital base and our track record managing diverse investment vehicles. We are capitalizing on secular tailwinds as banks continue to re-trench and private credit fills the gap. We evaluate new vehicle launches, acquisitions and partnerships based on a number of factors including: (i) strategic fit (e.g. credit capability expansion, distribution); (ii) durability of capital (i.e. permanent or semi-permanent capital, what we refer to as "sticky AUM"); (iii) underwriting culture, risk controls, and unit economics (e.g., FRE uplift and margin accretion); and (iv) ease of integration into our operating model, as supported by our Staffing and Resource Agreement and Servicing Agreement (each as defined below) with BCPA.
Insurance Solutions
We are scaling a capital-efficient insurance platform pairing long-dated, predictable liabilities with our private credit origination and underwriting capabilities. A strengthened balance sheet following our combination with 180 Degree Capital positions us to grow our insurance capabilities. Our objectives include:
Expand Multi-Year Guaranteed Annuity (“MYGA”) Reinsurance Through Diversified Channels: Our insurance solutions segment, through Ability, is initially focused on MYGA reinsurance, a product with fixed tenors, high predictability, and strong growth in the fixed annuity market. We intend to increase our cadence of quota-share flow treaties and opportunistic blocks with a broader set of counterparties, building on previously executed agreements. Any new reinsurance treaties we enter into will be filed with and approved by appropriate state insurance regulatory authorities before being executed.
Increase our Risk Based Capital (“RBC”) Ratios via Direct Investments from Mount Logan, compounding SRE and Reinforcing the Asset Management “Flywheel”: Mount Logan as Parent can invest capital directly into Ability to support MYGA reinsurance and other insurance activities that we may pursue in the future. Through our asset management segment, we target attractive spread economics and active portfolio management to optimize Ability’s assets, while earning a management fee for performing these activities. The flywheel between asset management and insurance solutions is a key driver of the compounding growth of our business.
Broaden Product Set and Strengthen Distribution: Over time we plan to expand beyond MYGA into additional retirement and life protection solutions, including fixed indexed annuities and pre-need products, subject to market conditions and required regulatory approvals. We also plan to diversify distribution by adding new counterparties and pursuing block transactions. Over time, we may evaluate direct-writing opportunities to complement reinsurance channels. As scale increases across products and channels, we expect improved operating leverage, more durable SRE, and continued discipline around asset-liability management, RBC ratios, and regulatory capital.
Legacy MLC
Historically, our predecessor, Legacy MLC, focused on strategic acquisitions and partnerships to expand its asset management capabilities, including but not limited to (i) the 2020 transaction alongside Sierra Crest Investment Management (“SCIM”), whereby SCIM became the investment advisor to the Alternative Credit Income Fund (“ACIF”), (ii) the purchase of, and subsequent increase in, a minority stake in SCIM, which manages BCP Investment Corporation (“BCIC”), formerly Portman Ridge Finance Corp. (“Portman Ridge”), a closed-end, externally managed, non-diversified investment company that has elected to be treated as a business development company (“BDC”) under the Investment Company Act of 1940, (iii) the 2021 acquisition of certain assets from Capitala Investment Advisors, LLC, whereby ML Management became the manager of Logan Ridge Finance Corp.
8
(formerly Capitala Finance Corp.), also a BDC, which has since merged with and into Portman Ridge (see “— Recent Developments — The Portman-Logan Merger”), and (iv) the transaction with Ovation Partners, LP, for the management of its alternative income platform, which included the transfer of employees to ML Management to support its specialty finance and asset-backed finance efforts across commercial lending, real estate lending, consumer finance, and litigation finance.
The Asset Management segment also holds a minority equity interest in Runway Growth Capital, LLC (“Runway”), which is a private credit, SEC-registered investment adviser managing in excess of $1.1 billion AUM (as of September 30, 2025) with a specific orientation on providing growth capital to sponsored (i.e., venture-backed) and non-sponsored companies that are looking for an alternative to raising equity capital. The minority investment in Runway Growth Capital was acquired during the first quarter of 2025 by Legacy MLC, but for purposes of this filing is not considered a significant investment in accordance with Rule 3-09 of Regulation S-X.
Recent Developments
The Merger
On September 12, 2025, we completed the previously announced Business Combination through two simultaneous merger transactions pursuant to the Agreement and Plan of Merger. In the first merger, TURN Merger Sub merged with and into 180 Degree Capital, with 180 Degree Capital surviving as our wholly-owned subsidiary. In the second merger, MLC Merger Sub merged with and into Legacy MLC, with Legacy MLC surviving as our wholly-owned subsidiary.
Following the completion of these merger transactions, we changed our name from “Yukon New Parent, Inc.” to “Mount Logan Capital Inc.” and became a publicly traded corporation.
The Portman-Logan Merger
On January 30, 2025, the Company announced that it had completed its previously announced minority investment in Runway, alongside BCPA and its affiliates, which acquired the remaining outstanding ownership in Runway.
On January 30, 2025, Portman Ridge and Logan Ridge announced that they had entered into an agreement under which Logan Ridge would merge with and into Portman Ridge (the “Portman-Logan Merger”), subject to the receipt of certain shareholder approvals and the satisfaction of other closing conditions, including a payment by ML Management of approximately $1.25 million to the former shareholders of Logan Ridge in July 2025.
On July 15, 2025, Portman Ridge announced the closing of the Portman-Logan Merger. The Company, through ML Management, previously acquired an investment management agreement (“IMA”) through an asset purchase that resulted in ML Management becoming the investment advisor of Logan Ridge. The merging of Logan Ridge into Portman Ridge resulted in Logan Ridge’s existing IMA being terminated and, therefore, the Company's management fee stream from Logan Ridge ceasing. Portman Ridge was subsequently renamed to BCP Investment Corporation (“BCIC”). In connection with the closing of the Portman-Logan Merger, MLCSC Holdings LLC, our wholly-owned subsidiary (“MLCSC”), entered into a profit-sharing agreement with BCPSC Holdings LLC, pursuant to which MLCSC received economic interests in units worth 16.03% of BCPA’s distributions received under SCIM’s IMA with BCIC.
Tender Offer
On December 29, 2025, we issued a press release announcing that we are commencing a cash tender offer to purchase up to $15 million in value, or approximately 1,590,600 shares, of our Common Stock at a price of $9.43 per share.
Corporate Information
Mount Logan Capital Inc., the issuer of the Notes in this offering, was incorporated in Delaware on January 7, 2025. Our principal executive offices are located at 650 Madison Avenue, 3rd Floor New York, New York 10022.
9
Our telephone number is (212) 891-2880. Our corporate website is www.mountlogancap.com and ir.mountlogan.com. The information contained on or that can be accessed through our website is not incorporated by reference into this prospectus, and you should not consider information on our website to be part of this prospectus or in deciding whether to purchase the Notes.
Summary Risk Factors
Risks Relating to the Notes
•The Notes will be structurally subordinated to the indebtedness and other liabilities of our future subsidiaries, if any.
•Our amount of debt outstanding will increase as a result of this offering. Our future indebtedness could adversely affect our business, financial condition, results of operations, and ability to meet our payment obligations under the Notes and our other debt.
•We may choose to redeem the Notes when prevailing interest rates are relatively low.
•An increase in market interest rates could result in a decrease in the market value of the Notes.
•The Notes will be unsecured and therefore will be effectively subordinated to our existing secured indebtedness we may incur in the future.
•The indenture under which the Notes will be issued contains limited protection for holders of the Notes.
•Servicing our indebtedness will require a significant amount of cash. Our ability to generate sufficient cash depends on many factors, some of which are not within our control.
•We may not be able to repurchase all of the Notes upon a Change of Control (as defined below).
•There is currently no market for the Notes, and we cannot assure you that an active trading market for the Notes will develop. The Notes may trade at prices below the price you paid for them.
•If we default on our obligations to pay our other indebtedness, we may not be able to make payments on the Notes.
•A downgrade, suspension or withdrawal of the credit rating assigned by a rating agency to us or the Notes, if any, or change in the debt markets could cause the liquidity or market value of the Notes to decline significantly.
Risks Relating to Our Business - General
•A portion of our revenues, earnings and cash flow is highly variable, which may make it difficult for it to achieve steady earnings growth on a quarterly basis and may cause the price of shares of our Common Stock to be volatile.
•We operate in highly competitive industries, which could limit our ability to achieve its growth strategies.
•We rely on technology and information systems (including those of BCPA through our Servicing Agreement (as defined and described below) with BCPA), some of which are controlled by third-party vendors, to maintain the security of our information and technology networks and to conduct our businesses.
•Our business, financial condition, results of operations, liquidity and cash flows depend on the accuracy of our management’s assumptions and estimates.
•Some of the funds ML Management manages invest in illiquid assets, and some of the investments of our insurance business are relatively illiquid.
10
•We rely on the financing markets for the operation of our business.
•There can be no guarantee as to the timing or amount of dividends, and shareholders may not receive dividends.
•We rely on BCPA and Key BCPA Personnel.
•Our relationship with BCPA will result in significant actual and potential conflicts of interest that could impact New Mount Logan’s business.
•We, through ML Management, may only manage a limited number of funds and investments.
•Our insurance business is heavily regulated and changes in regulation could reduce our profitability.
•Ability operates in a highly competitive industry that includes a number of companies, many of which are larger and more well-known, which could limit Ability’s capacity to increase or maintain market share and/or margins.
•Ability faces risks associated with business it reinsures and business it cedes to reinsurers.
•Ability is subject to regulatory capital requirements in the United States.
Implications of Being an Emerging Growth Company and a Smaller Reporting Company
We are an “emerging growth company,” as defined in Section 2(a) of the Securities Act, as modified by the Jumpstart Our Business Startups Act of 2012 (the “JOBS Act”), and we may take advantage of certain exemptions from various reporting requirements that are applicable to other public companies that are not emerging growth companies, including, but not limited to, not being required to comply with the auditor attestation requirements of Section 404 of the Sarbanes-Oxley Act of 2002, as amended (the “Sarbanes-Oxley Act”), reduced disclosure obligations regarding executive compensation in our periodic reports and proxy statements, and exemptions from the requirements of holding a nonbinding advisory vote on executive compensation and stockholder approval of any golden parachute payments not previously approved. We will cease to be an emerging growth company upon the earliest of: (1) the end of the fiscal year following the fifth anniversary of an initial public offering of our common equity; (2) the first fiscal year after our annual gross revenues are $1.07 billion or more; (3) the date on which we have, during the previous three-year period, issued more than $1.0 billion in non-convertible debt securities; or (4) the end of any fiscal year in which the aggregate worldwide market value of the voting and non-voting common equity held by non-affiliates (or public float) exceeded $700 million as of the end of the second quarter of that fiscal year. We have taken advantage of reduced disclosure regarding executive compensation arrangements in this prospectus, and we may choose to take advantage of some but not all of these reduced disclosure obligations in future filings. If we do, the information that we provide investors may be different than the information you might get from other public companies.
The JOBS Act permits an emerging growth company such as us to take advantage of an extended transition period to comply with new or revised accounting standards applicable to public companies. We are choosing to “opt out” of this provision and, as a result, we will comply with new or revised accounting standards as required when they are adopted. This decision to opt out of the extended transition period under the JOBS Act is irrevocable.
We also qualify as a “smaller reporting company”, as defined in Rule 405 under the Securities Act. We will continue to be a smaller reporting company so long as either (i) the market value of our securities held by non-affiliates is less than $250 million as of the last business day of our most recently completed second fiscal quarter, or (ii) our annual revenue was less than $100 million during our most recently completed fiscal year and the market value of the shares of our Common Stock held by non-affiliates is less than $700 million as of the last business day of our most recently completed second fiscal quarter. If we continue to qualify as a smaller reporting company at the time we cease to be an emerging growth company, we may continue to rely on exemptions from certain disclosure requirements that are available to smaller reporting companies. In particular, for so long as we remain a smaller reporting company, we (i) may choose to present only the two most recent fiscal years of audited financial
11
statements in our Annual Report on Form 10-K, and (ii) have reduced disclosure obligations regarding executive compensation.
12
SUMMARY OF THE OFFERING
Issuer | Mount Logan Capital Inc. | |||||||
Notes Offered | $40,000,000 aggregate principal amount of % Notes due 2031 (the “Notes”). | |||||||
Option to Purchase Additional Notes | The underwriters may also purchase from us up to an additional $6,000,000 aggregate principal amount of Notes within 30 days of the date of this prospectus. | |||||||
Offering Price | % of the aggregate principal amount, or $ per Note. The purchase price of the Notes includes accrued interest on the Notes from , 2026 to, but not including, the date of delivery. | |||||||
Maturity Date | The Notes will mature on , 20 . | |||||||
Interest Rate and Payment Dates | Interest of % per annum on the principal amount of the Notes will be payable in arrears on and of each year, commencing on , 2026. Interest will accrue on the Notes from , 2026. | |||||||
Ranking | The Notes will be our senior unsecured obligations and will rank senior in right of payment to all of our obligations that are expressly subordinated in right of payment to the Notes and equally in right of payment with all of our existing and future senior unsecured indebtedness. In addition, the Notes will effectively rank junior in right of payment to any of our existing and future secured indebtedness to the extent of the value of the assets securing such indebtedness. As of September 30, 2025, we had $38.0 million of secured indebtedness that would have effectively ranked senior in right of payment to the Notes, $36.3 million of unsecured indebtedness that would have effectively ranked senior in right of payment with the Notes, no indebtedness that would have ranked equally in right of payment with the Notes, and no subordinated indebtedness that would have ranked junior in right of payment to the Notes. All of our indebtedness at such date was indebtedness of our subsidiaries and was scheduled to mature after the expected maturity date of the Notes. See “Description of Other Indebtedness” for a detailed description of our indebtedness. | |||||||
Covenants | The indenture (as defined below) contains various covenants by which the Company and its subsidiaries will be bound. See “Description of Notes— Covenants.” | |||||||
Optional Redemption | Except as described under “Description of Notes—Optional Redemption Upon Change of Control,” the Notes may not be redeemed by us, at our option, prior to (the “Par Call Date”). We may redeem the Notes, in whole or in part, at any time and from time to time on and after the Par Call Date at a redemption price equal to 100% of the principal amount of the Notes being redeemed plus accrued and unpaid interest thereon to, but excluding, the redemption date. See “Description of Notes—Optional Redemption.” | |||||||
Optional Redemption Upon Change of Control | If a Change of Control with respect to the Notes occurs, the Notes may be redeemed for cash in whole but not in part at our option at any time within 90 days of the occurrence of a Change of Control, at a repurchase price equal to 100% of the principal amount of the Notes to be repurchased, plus accrued and unpaid interest thereon to, but excluding, the date of redemption. See “Description of Notes—Optional Redemption Upon Change of Control.” | |||||||
13
Use of Proceeds | We estimate that the net proceeds from the sale of the Notes in this offering will be approximately $ (or approximately $ if the underwriters fully exercise their overallotment option), after deducting the underwriting discount and estimated offering expenses payable by us. We anticipate using the net proceeds from the sale of the Notes to repay outstanding indebtedness under the Credit Facility and any remainder for general corporate purposes. See “Use of Proceeds.” | |||||||
Further Issuances | We may issue additional Notes having the same terms, with certain exceptions, as the Notes offered hereby; provided that if the additional Notes are not fungible with the original Notes offered hereby for U.S. federal income tax purposes, the additional Notes will have a separate CUSIP number so that they are distinguishable from the Notes offered hereby. | |||||||
Absence of Public Market for the Notes | The Notes are a new issue of securities, and there is currently no established trading market for the Notes. We intend to apply to list the Notes on The Nasdaq Global Market under the symbol “MLCIL,” and if the application is approved, we expect trading in the Notes on The Nasdaq Global Market to begin within 30 days of the original issue date. The Notes are expected to trade “flat,” which means that purchasers will not pay, and sellers will not receive, any accrued and unpaid interest on the Notes that is not reflected in the trading price. | |||||||
Indenture | The Notes will be issued under an indenture, dated as of , 2026, among the Company and U.S. Bank National Association, as trustee, to be amended and supplemented by a supplemental indenture thereto establishing the terms of the Notes to be dated as of the issue date of the Notes (collectively, the “indenture”). | |||||||
Clearance and Settlement | The Notes will be issued in book-entry form through the facilities of DTC for the accounts of its participants, including Clearstream and Euroclear, and will trade in DTC’s same day funds settlement system. Beneficial interests in Notes held in book-entry form will not be entitled to receive physical delivery of certificated Notes, except in certain limited circumstances. | |||||||
Form and Denomination | The Notes will be issued only in fully registered form without interest coupons in denominations of $25 and integral multiples of $25 in excess thereof. | |||||||
Trustee and Paying Agent | U.S. Bank National Association | |||||||
Governing Law | The indenture and the Notes will be governed by the laws of the State of New York. | |||||||
Risk Factors | ||||||||
14
RISK FACTORS
Investing in the Notes involves a number of significant risks. Before you invest in the Notes, you should be aware of various risks, including those described below. You should carefully consider these risk factors, together with all of the other information included in this prospectus, before you decide whether to make an investment in the Notes. The risks set out below present the principal risk factors associated with an investment in the Notes as well as those factors generally associated with investment in a company with investment objectives, investment policies, capital structure or trading markets similar to ours. Additional risks and uncertainties not presently known to us or not presently deemed material by us may also impair our operations and performance. If any of the following events were to occur, our business, financial condition, results of operations and cash flows could be materially and adversely affected. In such case, our business, financial condition and results of operations could be materially and adversely affected, and you may lose all or part of your investment.
Risk Factors Relating to this Offering and the Notes
The Notes will be structurally subordinated to the indebtedness and other liabilities of our future subsidiaries, if any.
The Notes will be obligations exclusively of Mount Logan Capital Inc., and not of any current or future subsidiaries, if any. None of our future subsidiaries will be a guarantor of the Notes and the Notes will not be required to be guaranteed by any subsidiary we may acquire or create in the future. Any assets of our subsidiaries will not be directly available to satisfy the claims of our creditors, including holders of the Notes. Except to the extent we are a creditor with recognized claims against our subsidiaries, all claims of creditors of our subsidiaries will have priority over our equity interests in such entities (and therefore the claims of our creditors, including holders of the Notes) with respect to the assets of such entities. Even if we are recognized as a creditor of one or more of these entities, our claims would still be effectively subordinated to any security interests in the assets of any such entity and to any indebtedness or other liabilities of any such entity senior to our claims. Consequently, the Notes will be structurally subordinated to all indebtedness and other liabilities of any of our future subsidiaries, if any. In addition, our future subsidiaries, if any, may incur substantial indebtedness in the future, all of which would be structurally senior to the Notes. Structural subordination means that creditors of a parent entity are subordinate to creditors of a subsidiary entity with respect to the subsidiary’s assets. Additionally, future debt and security agreements entered into by our subsidiaries, if any, may contain various restrictions, including restrictions on payments by our subsidiaries to us and the transfer by our subsidiaries of assets pledged as collateral.
Our amount of debt outstanding will increase as a result of this offering. Our future indebtedness could adversely affect our business, financial condition, results of operations, and ability to meet our payment obligations under the Notes and our other debt.
The use of debt and our level of indebtedness could have significant consequences on our future operations, including:
•making it more difficult for us to satisfy our obligations, including those relating to the Notes and our other outstanding indebtedness;
•making it more difficult for us to obtain additional debt or equity financing in the future;
•resulting in an event of default if we fail to comply with the financial and other restrictive covenants contained in our financing arrangements, which event of default could result in substantially all of our debt becoming immediately due and payable;
•reducing the availability of our cash flow to fund investments, acquisitions and other general corporate purposes, and limiting our ability to obtain additional financing for these purposes;
•subjecting us to the risk of increased sensitivity to interest rate increases on our indebtedness with variable interest rates, including borrowings under our financing arrangements;
•limiting our ability to refinance all or a portion of our indebtedness on or before maturity; and
15
•limiting our flexibility in planning for, or reacting to, and increasing our vulnerability to, downturns and other changes in our business, the industry in which we operate and the general economy.
Any of the above-listed factors could have an adverse effect on our business, financial condition and results of operations and our ability to meet our payment obligations under the Notes and our other debt.
Our ability to meet our payment and other obligations under our financing arrangements depends on our ability to generate significant cash flow in the future. This, to some extent, is subject to general economic, financial, competitive, legislative and regulatory factors as well as other factors that are beyond our control. We cannot assure you that our business will generate cash flow from operations, or that future borrowings will be available to us, in an amount sufficient to enable us to meet our payment obligations under the Notes and our other future debt and to fund other liquidity needs. If we are not able to generate sufficient cash flow to service our debt obligations, we may need to refinance or restructure our debt, including the Notes, sell assets, reduce or delay capital investments, or seek to raise additional capital. If we are unable to implement one or more of these alternatives, we may not be able to meet our payment obligations under the Notes and our other debt.
We may choose to redeem the Notes when prevailing interest rates are relatively low.
On or after , 20 , we may choose to redeem the Notes from time to time, especially when prevailing interest rates are lower than the rate borne by the Notes. If prevailing rates are lower at the time of redemption, you would not be able to reinvest the redemption proceeds in a comparable security at an effective interest rate as high as the interest rate on the Notes being redeemed. Our redemption right also may adversely impact your ability to sell the Notes as the optional redemption date or period approaches.
An increase in market interest rates could result in a decrease in the market value of the Notes.
The condition of the financial markets and prevailing interest rates have fluctuated in the past and are likely to fluctuate in the future, which could have an adverse effect on the market prices of the Notes. In general, as market interest rates rise, debt securities bearing interest at fixed rates of interest decline in value. Consequently, if you purchase Notes bearing interest at fixed rates and market interest rates increase, the market values of those Notes may decline. We cannot predict the future level of market interest rates.
The Notes will be unsecured and therefore will be effectively subordinated to our existing secured indebtedness and any secured indebtedness we may incur in the future.
The Notes will not be secured by any of our assets or any of the assets of our subsidiaries. As a result, the Notes are effectively subordinated to the currently existing secured indebtedness we or our subsidiaries have, including indebtedness under the Credit Facility, and any secured indebtedness we may incur in the future (or any indebtedness that is initially unsecured to which we subsequently grant security) to the extent of the value of the assets securing such indebtedness. In any liquidation, dissolution, bankruptcy or other similar proceeding, the holders of any of our existing or future secured indebtedness and the secured indebtedness of our subsidiaries may assert rights against the assets pledged to secure that indebtedness in order to receive full payment of their indebtedness before the assets may be used to pay other creditors, including the holders of the Notes.
The indenture under which the Notes will be issued contains limited protection for holders of the Notes.
The indenture under which the Notes will be issued offers limited protection to holders of the Notes. The terms of the indenture and the Notes do not restrict our or any of our subsidiaries or future subsidiaries’ ability to engage in, or otherwise be a party to, a variety of corporate transactions, circumstances or events that could have a material adverse impact on your investment in the Notes. In particular, the terms of the indenture and the Notes will not place any restrictions on our or our future subsidiaries’ ability to:
•issue securities or otherwise incur additional indebtedness or other obligations, including (1) any indebtedness or other obligations that would be equal in right of payment to the Notes, (2) any indebtedness or other obligations that would be secured and therefore rank effectively senior in right of payment to the Notes to the extent of the values of the assets securing such debt, (3) indebtedness of ours that is guaranteed
16
by one or more of our subsidiaries and which therefore is structurally senior to the Notes and (4) securities, indebtedness or obligations issued or incurred by our subsidiaries or the portfolio companies with respect to which we hold an equity investment that would be senior to our equity interests in those entities and therefore rank structurally senior to the Notes with respect to the assets of these entities, in each case other than an incurrence of indebtedness or other obligation that would cause a violation of Section 18(a)(1)(A) as modified by such provisions of Section 61(a) of the 1940 Act as may be applicable to us from time to time or any successor provisions (whether or not we are subject thereto), but giving effect, in each case, to any exemptive relief granted to us by the SEC.
•pay dividends on, or purchase or redeem or make any payments in respect of, capital stock or other securities ranking junior in right of payment to the Notes, including subordinated indebtedness, in each case other than dividends, purchases, redemptions or payments that would cause our asset coverage to fall below the threshold specified in Section 18(a)(1)(B) as modified by such provisions of Section 61(a) of the 1940 Act as may be applicable to us from time to time or any successor provisions, giving effect to (i) any exemptive relief granted to us by the SEC and (ii) no-action relief granted by the SEC to another BDC (or to us if we determine to seek such similar no-action or other relief) permitting the BDC to declare any cash dividend or distribution notwithstanding the prohibition contained in Section 18(a)(1)(B) as modified by such provisions of Section 61(a) of the 1940 Act as may be applicable to us from time to time in order to maintain the BDC’s status as a RIC. These provisions generally prohibit us from declaring any cash dividend or distribution upon any class of our capital stock, or purchasing any such capital stock if our asset coverage, as defined in the 1940 Act, is below 150% at the time of the declaration of the dividend or distribution or the purchase and after deducting the amount of such dividend, distribution or purchase;
•sell assets (other than certain limited restrictions on our ability to consolidate, merge or sell all or substantially all of our assets);
•enter into transactions with affiliates;
•create liens (including liens on the shares of any future subsidiaries) or enter into sale and leaseback transactions;
•make investments; or
•create restrictions on the payment of dividends or other amounts to us from any of our future subsidiaries.
In addition, the indenture does not require us to offer to purchase the Notes in connection with a change of control or any other event.
Furthermore, the terms of the indenture and the Notes do not protect holders of the Notes in the event that we experience changes (including significant adverse changes) in our financial condition, results of operations or credit ratings, if any, as they do not require that we adhere to any financial tests or ratios or specified levels of net worth, revenues, income, cash flow, or liquidity.
Our ability to recapitalize, incur additional debt and take a number of other actions that are not limited by the terms of the Notes may have important consequences for you as a holder of the Notes, including making it more difficult for us to satisfy our obligations with respect to the Notes or negatively affecting the trading value of the Notes.
Other debt we issue or incur in the future could contain more protections for its holders than the indenture and the Notes, including additional covenants and events of default. For example, the indenture under which the Notes are issued does not contain cross-default provisions. The issuance or incurrence of any such debt with incremental protections could affect the market for and trading levels and prices of the Notes.
17
Servicing our indebtedness will require a significant amount of cash. Our ability to generate sufficient cash depends on many factors, some of which are not within our control.
Our ability to make payments on, or refinance our obligations under, our indebtedness (including the Notes) and to fund planned capital expenditures will depend on our ability to generate cash in the future. To a certain extent, this is subject to general economic, financial, competitive, legislative, regulatory and other factors that are beyond our control. If we are unable to generate sufficient cash flow to service our debt and meet our other commitments, we may need to restructure or refinance all or a portion of our debt, sell material assets or operations or raise additional debt or equity capital. We may not be able to effect any of these actions on a timely basis, on commercially reasonable terms or at all, and these actions may not be sufficient to meet our capital requirements. In addition, the terms of our existing or future debt arrangements may restrict us from effecting any of these alternatives.
We may not be able to repurchase all of the Notes upon a Change of Control.
As described under “Description of Notes—Optional Redemption Upon Change of Control,” unless we have otherwise redeemed the Notes, we will be required to offer to repurchase the Notes upon the occurrence of a Change of Control with respect to the Notes. We may not have sufficient funds to repurchase the Notes for cash at such time. In addition, our ability to repurchase the Notes for cash may be limited or prohibited by law or our credit, lease or operating agreements in existence at the time. To the extent we are unable to obtain relief from any such limitations or prohibitions, we may be unable to repurchase the Notes. Regardless of the cause, our failure to offer to repurchase the Notes could constitute an event of default under the indenture which could, in turn, constitute a default under other of our agreements relating to our indebtedness outstanding at the time.
There is currently no market for the Notes, and we cannot assure you that an active trading market for the Notes will develop. The Notes may trade at prices below the price you paid for them.
The Notes are a new issue of debt securities for which there currently is no trading market. We intend to apply to list the Notes on The Nasdaq Global Market, and if the application is approved, we expect trading in the Notes on The Nasdaq Global Market to begin within 30 days of the original issue date. There is no assurance that the listing of the Notes on The Nasdaq Global Market will be approved. Even if the listing of the Notes is approved, we cannot provide any assurances that we will successfully list the Notes or that an active trading market will develop for the Notes. Further, we cannot provide any assurances as to the liquidity of any trading market that may develop for the Notes, your ability to sell your Notes or the price at which you will be able to sell your Notes, and you may have difficulty selling your Notes or may not be able to sell your Notes.. Future trading prices of the Notes will depend on many factors, including prevailing interest rates, general economic conditions, our financial condition and results of operations, the then-current ratings assigned to the Notes and the market for similar securities. Any trading market that develops may be affected by many factors independent of and in addition to the foregoing, including:
•time remaining prior to the maturity of the Notes;
•the outstanding amount of the Notes;
•the terms related to optional redemption of the Notes; and
•level, direction and volatility of market interest rates generally.
Certain of the underwriters have advised us that they presently intend to make a market in the Notes. However, they are not obligated to do so, and any market making with respect to the Notes may be discontinued without notice, in the underwriters’ sole discretion. Accordingly, a liquid trading market may not develop for the Notes, you may not be able to sell your Notes at a particular time and the price you receive when you sell may not be favorable. To the extent an active trading market does not develop, the liquidity and trading price for the Notes may be harmed. Therefore, you may be required to bear the financial risk of an investment in the Notes until maturity of the Notes. In addition, there may be a limited number of buyers when you decide to sell your Notes. This may affect the price, if any, offered for your Notes or your ability to sell your Notes when desired or at all.
18
If we default on our obligations to pay our other indebtedness, we may not be able to make payments on the Notes.
Any default under the agreements governing our indebtedness, including other indebtedness to which we may be a party that is not waived by the required lenders, and the remedies sought by the holders of such indebtedness could make us unable to pay principal, premium, if any, and interest on the Notes and substantially decrease the market value of the Notes. If we are unable to generate sufficient cash flow and are otherwise unable to obtain funds necessary to meet required payments of principal, premium, if any, and interest on our indebtedness, or if we otherwise fail to comply with the various covenants, including financial and operating covenants, in the instruments governing our indebtedness, we could be in default under the terms of the agreements governing such indebtedness. In the event of such default, the holders of such indebtedness could elect to declare all the funds borrowed thereunder to be due and payable, together with accrued and unpaid interest, the lenders under any other debt we may incur in the future could elect to terminate their commitments, cease making further loans and institute foreclosure proceedings against our assets, and we could be forced into bankruptcy or liquidation. If our operating performance declines, we may in the future need to seek to obtain waivers from the required lenders under other debt that we may incur in the future to avoid being in default. If we breach our covenants under other debt and seek a waiver, we may not be able to obtain a waiver from the required lenders. If this occurs, we would be in default under other debt, the lenders could exercise their rights as described above, and we could be forced into bankruptcy or liquidation. If we are unable to repay debt, lenders having secured obligations could proceed against the collateral securing the debt. See “Description of Notes” in this prospectus.
A downgrade, suspension or withdrawal of the credit rating assigned by a rating agency to us or the Notes, if any, or change in the debt markets could cause the liquidity or market value of the Notes to decline significantly.
Any credit ratings assigned by a rating agency to us are an assessment by rating agencies of our ability to pay our debts when due. Consequently, real or anticipated changes in our credit ratings will generally affect the market value of the Notes. These credit ratings may not reflect risks related to us and our business, suitability of a security for a particular investor and the structure or marketing of the Notes. Credit ratings are not a recommendation to buy, sell or hold any security, and may be revised or withdrawn at any time by the issuing organization in its sole discretion. Neither we nor any agent undertakes any obligation to maintain any credit ratings assigned to us or the Notes or to advise holders of Notes of any changes in our credit ratings. The conditions of the financial markets and prevailing interest rates have fluctuated in the past and are likely to fluctuate in the future, which could have an adverse effect on the market prices of the Notes. There can be no assurance that our credit ratings will remain for any given period of time or that such credit ratings will not be lowered or withdrawn entirely by the rating agency if in their judgment future circumstances relating to the basis of the credit ratings, such as adverse changes in our company, so warrant.
We have broad discretion in the use of the net proceeds of this offering and may not use them effectively.
We intend to use the net proceeds from this offering to repay borrowings under the Credit Agreement and any remainder for general corporate purposes. Our management will have broad discretion in the application of such remainder of net proceeds from this offering and could spend the proceeds in ways that do not improve our results of operations. The failure by management to apply these funds effectively could result in financial losses that could have a material adverse effect on our business and cause the price of the Notes to decline.
We may issue additional Notes.
The indenture governing the Notes will provide that we may from time to time, without notice to or the consent of the holders of the Notes, create and issue additional Notes which will be equal in rank to the Notes. We may issue such additional Notes, even if such issuance would not constitute a “qualified reopening” for U.S. federal income tax purposes.
19
Risks Related to Our Business – General
A portion of our revenues, earnings and cash flow is highly variable, which may make it difficult for it to achieve steady earnings growth on a quarterly basis and may cause the price of shares of our Common Stock to be volatile.
A portion of our revenues, earnings and cash flow is highly variable, primarily due to the nature of the insurance business of our subsidiary, Ability and the fact that fees from our asset management business vary significantly from quarter to quarter and year to year. We may also experience fluctuations in our results from quarter to quarter and year to year due to a number of other factors, including changes in our operating expenses, policyholder behavior, the degree to which we encounter competition and general economic and market conditions. Our future results will also be dependent on the success of the vehicles ML Management manages, changes in the value of which may result in fluctuations in our results. Such variability may lead to volatility in the trading price of shares of our common stock and cause our results for a particular period not to be indicative of our performance in a future period. It may be difficult for us to achieve steady growth in earnings and cash flow on a quarterly basis, which could in turn lead to adverse movements in the price of shares of our common stock or increased volatility in the price of shares of our common stock in general.
We operate in highly competitive industries, which could limit our ability to achieve our growth strategies and could materially and adversely affect our businesses, financial condition, results of operations, cash flows and prospects.
We operate in highly competitive markets and compete with a large number of investment management firms, private credit fund sponsors, U.S. and non-U.S. insurance and reinsurance companies and other financial institutions. In particular, our asset management business faces competition in the pursuit of clients, and our insurance business faces competition with respect to both the products we offer and insurance transactions we pursue. These competitive pressures may have a material and adverse effect on our growth, business, financial condition, results of operations, cash flows and prospects.
We rely on technology and information systems (including those of BCPA through our Servicing Agreement with BCPA), some of which are controlled by third-party vendors, to maintain the security of our information and technology networks and to conduct our business, and any failures or interruptions of these systems could adversely affect our business and results of operations.
We are subject to various risks and costs associated with the collection, handling, storage and transmission of proprietary or confidential information. In the ordinary course of business, we collect and store a range of data, including our proprietary business information and intellectual property, which may include personally identifiable information relating to our insurance business or of our employees, our investors, and other third parties, in data centers and on our or BCPA’s networks, and we rely on technology and information systems in our business activities. We rely on a host of information systems and hardware systems, including those of BCPA and BCPA’s third party vendors, for the secure processing, maintenance and transmission of this information, and the unavailability of these systems or the failure of these systems to perform as anticipated for any reason could disrupt our businesses and could result in decreased performance and increased operating costs, causing our businesses and results of operations to suffer.
There can be no assurance that the various procedures and controls we utilize to mitigate the threat of cyberattacks or other similar incidents will be sufficient to prevent disruptions to our systems, especially because the cyberattack techniques used change frequently and are not recognized until launched, the full scope of a cyberattack may not be realized until an investigation has been performed and cyberattacks can originate from a wide variety of sources. Although we and BCPA take protective measures to prevent and address potential cyberattacks, there can be no assurance that any of these measures will prove effective. The rapid evolution and increasing prevalence of artificial intelligence technologies may also increase our cybersecurity risks.
We rely on BCPA and third-party service providers for certain aspects of our businesses, including for certain information systems and technology. We cannot guarantee that BCPA, third party vendors, service providers and lenders have not been compromised or that they do not contain exploitable defects or bugs that could result in a
20
breach of or disruption to our information technology systems or the BCPA or third-party information technology systems that support our business. Our ability to monitor these third parties’ information security practices is limited, and they may not have adequate information security measures in place. In addition, if BCPA or one of our third-party counterparties suffers a security breach, Our response may be limited or more difficult because it may not have direct access to their systems. A disaster, disruption or compromise in technology or infrastructure that supports our businesses, including a disruption involving electronic communications or other services used by us, may have an adverse impact on our ability to continue to operate our businesses without interruption, which could have a material adverse effect on us. These risks could increase due to the increasing use of cloud-based software services. In addition, costs related to data security threats or disruptions may not be fully insured or indemnified by other means.
As new technologies, including tools that harness generative artificial intelligence and other machine learning techniques, rapidly develop and become even more accessible, the use of such new technologies by us, our affiliates and our third party service providers and other vendors will present additional known and unknown risks, including, among others, the risk that confidential information may be stolen, misappropriated or disclosed and the risk that we and/or our third party service providers or other vendors may rely on incorrect, unclear or biased outputs generated by such technologies, any of which could have an adverse impact on us and our business.
A significant actual or potential theft, loss, corruption, exposure, fraudulent, unauthorized or accidental use or misuse of personally identifiable or proprietary business data could result in significant remediation and other costs, fines, litigation and regulatory actions against us, in addition to significant reputational harm.
Our business, financial condition, results of operations, liquidity and cash flows will depend on the accuracy of our management’s assumptions and estimates, and we could experience significant gains or losses if these assumptions and estimates differ significantly from actual results.
We make and rely on certain assumptions and estimates regarding many matters related to our businesses, including interest rates, expenses and operating costs, tax assets and liabilities, tax rates, business mix, and contingent liabilities. We also use these assumptions and estimates to make decisions crucial to our business operations. The factors influencing these various assumptions and estimates cannot be calculated or predicted with certainty, and if our assumptions and estimates differ significantly from actual outcomes and results, our business, financial condition, results of operations, liquidity and cash flows may be materially and adversely affected.
Some of the funds ML Management manages invest in illiquid assets, and some of the investments of our insurance business are relatively illiquid. Funds holding such assets and we, as applicable, may fail to realize profits from these assets for a considerable period of time, or lose some or all of the amount that is invested in these assets if such assets are required to be sold at inopportune times or in response to changes in applicable rules and regulations.
Some of the funds ML Management manages invest in securities or other financial instruments that are not publicly traded or are otherwise viewed as “illiquid.” In such cases, there may be limitations by contract or by applicable securities laws on the sale of such securities or financial instruments, such that they can only be sold after a period of time and then only at such times when we will not possess material nonpublic information. In addition, the ability to dispose of private credit investments prior to maturity is generally heavily dependent upon the secondary trading market for such instruments. Such markets may not be available. Accordingly, the funds ML Management manages may be forced, under certain conditions, to sell securities at a loss.
In addition, some investments by Ability, our insurance business, are in securities that are not publicly traded or that otherwise lack liquidity. These relatively illiquid types of investments are recorded at fair value. If a material liquidity demand is triggered and our insurance business is unable to satisfy the demand with the sources of liquidity available to it, our insurance business could be forced to sell certain of its assets and there can be no assurance that it would be able to sell them for the values at which such assets are recorded and it might be forced to sell them at significantly lower prices. In some cases, our insurance business may also be prohibited by contract or applicable securities laws from selling such securities for a period of time. Thus, it may be impossible or costly to liquidate positions rapidly in order to meet unexpected obligations. This potential mismatch between the liquidity of
21
assets and liabilities could have a material and adverse effect on our business, financial condition, results of operations and cash flows.
Further, governmental and regulatory authorities periodically review legislative and regulatory initiatives, and may promulgate new or revised, or adopt changes in the interpretation and enforcement of existing, rules and regulations at any time that may impact our investments. Such changes in regulatory requirements could disrupt market liquidity, make it more difficult for us to operate our business, and cause securities that are not publicly traded to lose value, any of which could have a material and adverse effect on our business, financial condition or results of operations.
We rely on the financing markets for the operation of our business.
We rely on the debt and equity financing markets for the operation of our business. To the extent that debt and equity markets render financing difficult to obtain, refinance or extend, or more expensive, this may have a material and adverse effect on our business, financial condition, results of operations, liquidity and cash flows.
In particular, our insurance business relies on access to lending and debt markets to provide capital and liquidity. Changes in debt financing markets may impact our insurance business’s access to capital and liquidity. Calculations of required insurance capital may move with market movements and result in greater capital needs during economic downturns. Our insurance business may also need additional liquidity to pay insurance liabilities in excess of its assumptions.
The absence of available sources of debt financing for extended periods of time could materially and adversely affect us. In the event that we are unable to obtain debt financing, or can only obtain debt at an increased interest rate or otherwise on unfavorable terms, we may be forced to find alternative sources of financing (including equity), may have difficulty executing our business objectives or may generate profits that are lower than would otherwise be the case, any of which could lead to a decrease in the income earned by us. If we use leverage in the future, shareholders should be aware that investments in leveraged entities are inherently more sensitive to declines in revenues, increases in expenses and interest rates and adverse economic, market and industry developments. As a result, the risk of loss associated with a leveraged entity is generally greater than for companies with comparatively less debt.
We, and particularly our insurance business, may acquire various financial instruments for purposes of “hedging” or reducing its risks, which may be costly and ineffective and could reduce its cash available for distribution to its shareholders.
We, and particularly our insurance business, may seek to hedge against certain risks by using financial instruments such as futures, options, swaps and forward contracts. These financial instruments may be purchased on exchanges or may be individually negotiated and traded in over-the-counter markets. Use of such financial instruments for hedging purposes may present significant risks, including the risk of loss of the amounts invested. Defaults by the other party to a hedging transaction can result in losses in the hedging transaction. Hedging activities also involve the risk of an imperfect correlation between the hedging instrument and the asset being hedged, which could result in losses both on the hedging transaction and on the instrument being hedged. Use of hedging activities may not prevent significant losses and could increase our losses. Further, hedging transactions may reduce cash available to pay distributions to our shareholders.
Difficult political, market or economic conditions may adversely affect our businesses in many ways, which could materially reduce our revenue, net income and cash flow and adversely affect our financial prospects and condition.
Our businesses could be materially affected by conditions in the political environment and financial markets and economic conditions throughout the world, such as changes in interest rates, availability of credit, inflation rates (including persistent inflation), economic uncertainty, changes in laws, changes in governmental policy and regulatory reform, the ongoing Russia-Ukraine conflict, the conflicts in the Middle East, commodity prices, wars, other national and international political circumstances (including terrorist acts or security operations), natural disasters, climate change, pandemics or other severe public health crises and other events outside of our
22
control. Market uncertainty and volatility could also be magnified as a result of the new U.S. administration and resulting uncertainties regarding actual and potential shifts in the U.S. and foreign, trade, economic and other policies, such as tariffs on imports from various countries.
Both domestic and international markets continued to experience significant inflationary pressures in fiscal year 2024 and inflation rates in the United States could continue at elevated levels for the near term. Although the Federal Reserve in the United States and central banks in various other countries have started to cut interest rates as the rate of inflation slowly weakened, they may again raise interest rates in response to concerns about inflation in the future, which, coupled with reduced government spending and volatility in financial markets, may have the effect of further increasing economic uncertainty and heightening these risks. Interest rate increases or other government actions taken to reduce inflation could also result in recessionary pressures in many parts of the world. A recession could have a material and adverse effect on our business, financial condition, results of operations, liquidity and cash flows.
The ongoing conflict between Russia and Ukraine and the conflict in the Middle East have increased global economic and political uncertainty. Furthermore, governments in the United States, U.K., and EU have each imposed export controls on certain products and financial and economic sanctions on certain industry sectors and parties in Russia, and additional controls and sanctions could be enacted in the future. We cannot predict the impact these conflicts may have on the global economy or our business, financial condition and operations in the future. These conflicts may also heighten the impact of other risks described herein.
Volatility caused by political, market or economic conditions can materially hinder business growth and may adversely impact our operating results. Any such volatility may also increase the risk that cash flows generated from operations may differ from expectations in timing or amount. There is also a risk of both sector-specific and broad-based corrections and/or downturns in the equity and/or credit markets. Our profitability may also be adversely affected by our fixed costs and the possibility that we would be unable to scale back other costs, within a time frame sufficient to match any further decreases in net income or increases in net losses relating to changes in market and economic conditions.
Moreover, Ability, our insurance business, is materially affected by conditions in the capital markets and the U.S. economy generally, as well as by the global economy. Actual or perceived stressed conditions, volatility and disruptions in financial asset classes or various capital and credit markets may have an adverse effect on our insurance business, both because such conditions may decrease the returns on, and value of, our investment portfolio and because our liabilities are sensitive to changing market factors.
Changes in laws or regulations governing our operations may adversely affect our business or cause us to alter our business strategy.
We, and particularly our insurance business, are and will be subject to regulation at the municipal, local, state, and federal level, including, in some cases, in both the United States and Canada. New legislation may be enacted, or new interpretations, rulings or regulations could be adopted, including those governing the types of reinsurance products in which Ability deals, any of which could harm us and our shareholders, potentially with retroactive effect.
Additionally, any changes to the laws and regulations governing us or our business activities may cause us to alter our strategy to avail ourselves of new or different opportunities. Such changes could result in material differences to strategies and plans as set forth in this prospectus and may result in our business focus shifting to other types of activities in which our management may have less expertise or little or no experience. Thus, any such changes, if they occur, could have a material adverse effect on our financial condition and results of operations.
Any changes in tax regulations or tax reform may have an adverse impact on investors and policyholders.
Tax changes in the United States or Canada could result in adverse effects on our financial results and share price. We cannot predict how changes in tax legislation will affect us or our business (including Ability), but these provisions may in certain circumstances negatively affect our financial condition, results of operations, liquidity and cash flows.
23
There can be no guarantee as to the timing or amount of dividends, and shareholders may not receive dividends.
Holders of our Common Stock will not have a right to dividends on such shares unless declared by the Board. The declaration of dividends will be at the discretion of the Board, even if we have sufficient distributable cash to pay such dividends. The declaration of any dividend will depend on our financial results, cash requirements, future prospects and other factors deemed relevant by the Board.
Dividends are not guaranteed, and the amount of any dividend may fluctuate or be reduced or eliminated. There can be no assurance as to the levels of dividends to be paid by us, if any. The market value of our Common Stock may deteriorate if we are unable to pay dividends and such deterioration may be material.
Holders of our Common Stock will be entitled to receive only such dividends as the Board may declare out of funds legally available for such payments. We are incorporated in Delaware and governed by the Delaware General Corporation Law. Delaware law allows a corporation to pay dividends only out of surplus, as determined under Delaware law or, if there is no surplus, out of net profits for the fiscal year in which the dividend was declared and/or for the preceding fiscal year. Under Delaware law, however, we will not be able to pay dividends out of net profits if, after we pay the dividend, our capital would be less than the capital represented by the outstanding stock of all classes, if any, having a preference upon the distribution of assets. Our ability to pay dividends will be subject to our future earnings, capital requirements and financial condition, as well as our compliance with covenants related to any indebtedness of Mount Logan or its subsidiaries and would only be declared in the discretion of our Board. Additionally, subject to certain limited exceptions, income received by Ability may only be used for the benefit of policyholders, so such proceeds will not be available for the payment of dividends to holders of our Common Stock.
We will be subject to changes in accounting policies or accounting standards.
From time to time, the Financial Accounting Standards Board (the “FASB”) and the SEC can be expected to change their guidance governing the form and content of our external financial statements. In addition, accounting standard setters and those who interpret accounting principles generally accepted in the United States of America (“U.S. GAAP”), such as the FASB, the SEC and our outside auditors, may change or even reverse their previous interpretations or positions on how these standards should be applied. Such changes are expected to continue. Changes in U.S. GAAP and changes in current interpretations are beyond our control, can be hard to predict and could materially impact how it reports financial results and condition. In certain cases, we could be required to apply a new or revised guidance retroactively or apply existing guidance differently, which may result in restating prior period financial statements for material amounts. Additionally, significant changes to U.S. GAAP may require costly technology changes, additional training and personnel and other expenses that would negatively impact results of operations.
We have and will continue to incur increased costs as a result of operating as a U.S. public company.
As a new U.S. public company, we have and will continue to incur significant legal, accounting, insurance and other expenses. Among other costs, we incur costs associated with our compliance with the reporting requirements of the Exchange Act, the Sarbanes-Oxley Act of 2002 (the “Sarbanes-Oxley Act”) and related rules implemented by the SEC, and the listing standards of Nasdaq. The expenses incurred by U.S. public companies generally for reporting and corporate governance purposes have been increasing. We expect these laws and regulations to increase our legal and financial compliance costs and to make some activities more time-consuming and costly, although we are currently unable to estimate these costs with any degree of certainty. These laws and regulations could also make it more difficult or costly for us to obtain certain types of insurance, including director and officer liability insurance, and we may be forced to accept reduced policy limits and coverage or incur substantially higher costs to obtain the same or similar coverage. These laws and regulations could also make it more difficult for us to attract and retain qualified persons to serve on our Board, our Board committees or as our executive officers. Furthermore, if we are unable to satisfy our obligations as a U.S. public company, it could be subject to delisting of our Common Stock, fines, sanctions and other regulatory action and potentially civil litigation.
24
If we fail to maintain an effective system of disclosure controls and internal control over financial reporting, our ability to produce timely and accurate financial statements or comply with applicable regulations could be impaired.
The Sarbanes-Oxley Act requires, among other things, that we maintain effective disclosure controls and procedures and internal control over financial reporting. In addition, pursuant to Section 404 of the Sarbanes Oxley-Act, we are required to perform system and process evaluation and testing of our internal control over financial reporting to allow our management to furnish a report on, among other things, the effectiveness of our internal control over financial reporting.
In order to maintain and improve the effectiveness of our disclosure controls and procedures and internal control over financial reporting, we will expend significant resources, including accounting-related costs and significant management oversight. If any of these new or improved controls and systems do not perform as expected, we may experience deficiencies in our controls.
During the evaluation and testing process of our internal controls, if we identify one or more material weaknesses in our internal control over financial reporting, we will be unable to certify that our internal control over financial reporting is effective. We cannot assure you that there will not be material weaknesses in our internal control over financial reporting in the future, and our testing, or the subsequent testing by our independent public accounting firm, may reveal deficiencies in our internal control over financial reporting that are deemed to be material weaknesses.
Our current controls and any new controls that it develops may become inadequate because of changes in conditions in our business. Further, weaknesses in our disclosure controls and internal control over financial reporting may be discovered in the future. Any failure to develop or maintain effective controls or any difficulties encountered in their implementation or improvement could harm our results of operations or cause us to fail to meet our reporting obligations and may result in a restatement of our financial statements for prior periods. Any failure to implement and maintain effective internal control over financial reporting also could adversely affect the results of periodic management evaluations and annual independent registered public accounting firm attestation reports regarding the effectiveness of our internal control over financial reporting that we are required to include in our periodic reports that will be filed with the SEC. Ineffective disclosure controls and procedures and internal control over financial reporting could also cause investors to lose confidence in our reported financial and other information, which would likely have a negative effect on the trading price of our Common Stock. In addition, if we are unable to continue to meet these requirements, we may not be able to remain listed on Nasdaq.
If we are unable to assert that our internal control over financial reporting is effective, or if our independent registered public accounting firm is unable to express an opinion on the effectiveness of our internal control over financial reporting at any time when it is required to do so, investors could lose confidence in the reliability of our financial statements, the market price of our Common Stock could decline and we could be subject to sanctions or investigations by Nasdaq, the SEC or other regulatory authorities. Any failure to maintain effective disclosure controls and internal control over financial reporting could have an adverse effect on our business, results of operations and financial condition and could cause a decline in the market price of our Common Stock.
Any misconduct by Legacy MLC’s or 180 Degree Capital’s former, and our current and future, employees, directors, advisers, third-party service providers or others affiliated with us could harm us by impairing our ability to attract and retain investors and by subjecting us to significant legal liability, regulatory scrutiny and reputational harm.
There is a risk that our current (and Legacy MLC’s and 180 Degree Capital’s former) employees, directors, advisers, third-party service providers or others affiliated with us could engage, including deliberately or recklessly, in misconduct or fraud that creates legal exposure for us and adversely affects our businesses. For example, in October 2025, we discovered that a former employee of ML Management, our SEC-registered investment adviser subsidiary, engaged in misconduct while overseeing two operationally related portfolio companies of a non-core private fund advised by ML Management that has been and is winding down. ML Management ended its relationship with this employee and promptly engaged independent counsel to conduct a thorough investigation,
25
which is ongoing. As of the date of this prospectus, we have repaid one portfolio company approximately $690,000, inclusive of interest, that the former employee misappropriated from it through illegitimate vendor payments and expense reimbursements. We continue to investigate additional potentially misappropriated expenses with respect to that portfolio company of up to $180,000. Following completion of the forensic review, we expect to evaluate compensating the fund for certain fees received by ML Management related to the portfolio companies; as of the date of this prospectus, we believe these to be at most $1.35 million. We also continue to investigate the former employee’s unauthorized actions regarding the second portfolio company, which impacted assets owned by that portfolio company. We sold the second portfolio company earlier this year and expect to reimburse any excess consideration received. ML Management has also taken actions to preserve the value of the potentially impacted assets and implemented short-term remedial measures, is planning long-term process remediations, and self-reported this matter to the SEC. We continue to assess the potential impact of this matter on our financial condition and results of operations.
If anyone associated or affiliated with us were to engage, or be accused of engaging, in illegal or suspicious activities, harassment, impermissible discrimination, improper use or disclosure of confidential information, fraud, payment or solicitation of bribes, or any other type of similar misconduct or violation of other laws and regulations, we could suffer serious harm to our brand, reputation, be subject to penalties or sanctions, face difficulties in raising funds, suffer serious harm to our financial position and current and future business relationships, as well as face potentially significant litigation or investigations.
Litigation filed against 180 Degree Capital, Legacy MLC and/or Mount Logan in connection with the Business Combination could result in substantial costs.
From time to time, Mount Logan may be subject to legal actions, including securities class action lawsuits and derivative lawsuits, as well as various regulatory, governmental and law enforcement inquiries, investigations and subpoenas in connection with the Business Combination (including any such actions, inquiries, investigations or subpoenas directed to 180 Degree Capital and/or Legacy MLC). These or any similar securities class action lawsuits and derivative lawsuits, regardless of their merits, may result in substantial costs and divert management time and resources. An adverse judgment in such cases could have a negative impact on the liquidity and financial condition of Mount Logan.
Climate change-related risks and regulatory and other efforts to address climate change could adversely affect our business.
We will face a number of risks associated with climate change, including risks related to the impact of U.S. and foreign climate-related legislation and regulation, as well as risks arising from climate-related business trends. Climate change-related regulations or interpretations of existing laws have resulted, and may continue to result, in enhanced disclosure obligations that could negatively affect us and also materially increase our regulatory burden. We may also face business trend-related climate risks. Certain asset management clients are increasingly taking climate-related risks into account in their investment decisions.
We will be subject to risks associated with pandemics, epidemics, disease outbreaks and other public health crises, which could impact our business, financial condition and results of operations in the future.
We are subject to risks associated with pandemics, epidemics, disease outbreaks and other public health crises. Such public health crises could adversely affect our business in a number of ways, including by increasing volatility in the financial markets; preventing us from capitalizing on certain market opportunities; causing prolonged asset price inflation; hurting economic activity; straining our liquidity, which may impact our credit ratings and limit the availability of future financing; and reducing our ability to understand and foresee trends and changes in the markets in which we operate.
26
The amended and restated certificate of incorporation of Mount Logan could prevent us from benefiting from corporate opportunities that might otherwise have been available to us.
The amended and restated certificate of incorporation of Mount Logan provides that, to the fullest extent permitted by the law of the State of Delaware, our officers, directors and stockholders have no obligation to refrain from:
•engaging in the same or similar business activities or lines of business as us or our subsidiaries; or
•competing, directly or indirectly, with us or any of our subsidiaries.
Additionally, our amended and restated certificate of incorporation includes a “corporate opportunity” waiver provision pursuant to which, to the fullest extent permitted by law, our officers, directors and stockholders will not be liable to us for breach of any fiduciary duty by reason of the fact that any such person (i) pursues or acquires any corporate opportunity or (ii) does not communicate information regarding such corporate opportunity to us unless the potential transaction or corporate opportunity is expressly offered to a Mount Logan director or officer in his or her capacity as a director or officer of Mount Logan. This corporate opportunity waiver provision may exacerbate conflicts of interest between us and our directors, officers or stockholders because the provision may permit one of our officers, directors or stockholders to choose to direct a corporate opportunity to that other entity instead of us.
Risks related to the Business – Our Relationship with BCPA
We rely on BCPA and Key BCPA Personnel.
The success of Mount Logan, which has a limited number of employees, depends, in large part, upon the skill, expertise and network of relationships of key BCPA personnel to develop and implement strategies that achieve our business objectives, and upon BCPA providing certain administrative and other services to us. Our senior management is comprised of substantially the same personnel as the senior management team of BCPA, and these individuals have significant influence with respect to our business plans and policies. There can be no assurance that any such senior management individuals will continue to be associated with BCPA. The loss or reduction of the services of one or more such persons, including as a result of the death, disability or departure of one or more such persons, or to the extent any such persons do not dedicate sufficient time to us, could have a material and adverse impact on our business or performance. In addition, such BCPA personnel have other responsibilities, including to BCPA, its clients and to other entities and organizations and, therefore, conflicts can be expected to arise in the allocation of investment opportunities and personnel and the management of time, services or functions. The fulfillment of such other responsibilities may not be in our best interests or in the best interest of our stockholders. In addition, BCPA and the BCPA Credit Affiliates are presently, and plan in the future to continue to be, involved with activities that are unrelated to or in direct conflict with ours. As a result of these activities, BCPA, its officers and employees and the BCPA Credit Affiliates will have conflicts of interest in allocating their time between us and other activities in which they are or may become involved, including the management of funds advised by BCPA. The ability of BCPA and such personnel to access other resources for the benefit of Mount Logan may be limited under certain circumstances. In addition, our success will depend to a significant extent on BCPA continuing to provide staffing, services and support to us pursuant to the arrangements described above. BCPA personnel, including our senior management that is shared with BCPA, will devote as much time to us as such individuals deem appropriate but that will not be the entirety of their time dedicated to business activities.
Our relationship with BCPA has and will continue to result in significant actual and potential conflicts of interest that could impact our business.
Our relationship with BCPA has and will continue to result in significant actual and potential conflicts of interests. Addressing conflicts of interests (i) is complex, (ii) may result in us dedicating additional resources, incurring additional costs and implementing more administratively burdensome policies and procedures to address conflicts-related matters and (iii) may require our Board to spend considerable time analyzing and assessing conflicts-related matters. Such actions, together with the use of a special committee of disinterested directors or a board otherwise authorizing the disinterested directors to approve a transaction where actual or potential conflicts
27
are present, may not result in terms that could otherwise be negotiated on an arm’s length basis between unrelated parties. New and different types of conflicts should be expected to arise in the future. BCPA and the BCPA Credit Affiliates engage in a broad range of business activities and have interests directly and indirectly in a wide range of enterprises. Such interests will conflict with and may adversely affect the performance and operations of our business. None of BCPA or the BCPA Credit Affiliates is generally restricted, relative to us, from engaging in any types of activities and accordingly, such activities are expected to compete with us. Moreover, in circumstances where we or a client of one of our subsidiaries is invested alongside any of the foregoing (including BCPA clients), conflicts will arise with respect to such holdings, which may create circumstances where different actions or decisions are made or taken with respect to us or such client of our subsidiary relative to BCPA or the BCPA Credit Affiliates, as the case may be. See “Certain Relationships and Related Person Transactions” for additional information.
BCPA is able to terminate the Staffing and Resource Agreement and Servicing Agreement upon 60 days’ written notice, and we, who have a limited number of employees, may not be able to find a suitable replacement for such services provided under those agreements within that time, resulting in a disruption in our operations, which could adversely affect our financial condition, business or results of operations.
We expect that BCPA will continue to provide us with staffing, administrative and other services that it has historically provided to Legacy MLC pursuant to the arrangements that are described in more detail in the section titled “Certain Relationships and Related Person Transactions.” Pursuant to the terms of the Staffing and Resource Agreement and the Servicing Agreement, BCPA has the right to terminate either agreement upon 60 days’ written notice. If BCPA terminates either agreement, it may be difficult to find replacement arrangements providing for similar expertise and the ability to provide the same or equivalent services on acceptable terms within 60 days, or at all. If replacement arrangements are not quickly identified, our business, results of operations and financial condition, together with our ability to pay distributions, are likely to be adversely affected and the value of our Common Stock may decline. In addition, the coordination of our management and administrative functions are likely to suffer if we are unable to identify and reach an agreement with a single institution having the expertise possessed by BCPA. Even if a comparable service provider or individuals performing such services are retained, their integration into our business and lack of familiarity with our business strategy may result in additional costs and time delays that may materially adversely affect our business, results of operations or financial condition.
The Staffing and Resource Agreement or Servicing Agreement with BCPA may be amended or otherwise modified from time to time, or other similar or alternative arrangements may be entered into with BCPA from time to time, and such amendments, modifications or other arrangements may create different incentives for BCPA than exist today or may otherwise create additional conflicts of interest.
In the future, we and our subsidiaries may, from time to time, (i) agree to amend, modify, supplement or otherwise change the Staffing and Resource Agreement, Servicing Agreement or aspects of such agreements, and (ii) may otherwise agree to enter into additional, alternative or similar arrangements with BCPA. Such amendments are expected to be agreed to and implemented in the near future. Such amendments, modifications, supplements or other changes to the Staffing and Resource Agreement or Servicing Agreement, or any such additional, alternative or similar arrangements with BCPA may create different incentives for BCPA than exist today or may otherwise create additional conflicts of interest. For example, if we agree to compensate BCPA on metrics tied to our assets or performance, BCPA and its personnel may be influenced by such arrangements and may be incentivized to undertake activities on behalf of us that are riskier or more speculative than would be the case in the absence of such compensation arrangements, which may materially adversely affect our business, results of operations or financial condition.
BCPA’s liability is limited under the Servicing Agreement and Staffing and Resource Agreement, and we are required to indemnify BCPA against certain liabilities, which may lead BCPA to act in a riskier manner on our behalf than it would when acting for our own account.
Under the terms of the Staffing Agreement and the Servicing and Resource Agreement, BCPA will not assume any responsibility to us other than to render the services described in such agreements. Pursuant to the terms of such agreements, BCPA and its officers, managers, partners, agents, employees, controlling persons, members
28
and any other person or entity affiliated with BCPA will not be liable to us for their acts under such agreements, absent criminal conduct, willful misfeasance, bad faith or gross negligence in the performance of their duties or by reason of the reckless disregard of their duties and obligations. We have agreed to indemnify, defend and protect BCPA and its officers, managers, partners, agents, employees, controlling persons, members and any other person or entity affiliated with BCPA with respect to all damages, liabilities, costs and expenses arising out of or otherwise based upon the performance of any of BCPA’s duties or obligations under such agreements, and not arising out of criminal conduct, willful misfeasance, bad faith or gross negligence in the performance of their duties or by reason of the reckless disregard of their duties and obligations under such agreements. These protections may lead BCPA to act in a riskier manner when acting on our behalf than it would when acting for its own account.
Our financial condition and results of operations depend in large part on BCPA’s ability to effectively support our business.
Our ability to succeed in the future will depend on BCPA’s ability to effectively support our business, which depends, in turn, on BCPA’s ability to dedicate sufficient time and resources to us. Accomplishing execution of our business objectives on a cost-effective basis will depend in large part on BCPA’s ability to provide competent, attentive and efficient services and access to business opportunities through BCPA’s relationships. Even if we are able to grow, any failure to manage that growth effectively could have a material and adverse effect on our business, financial condition, results of operations and prospects. The results of our operations depend on many factors, including the availability of business opportunities, readily accessible funding alternatives in the financial markets and economic conditions. A number of entities compete with BCPA for business opportunities and some of those competitors are substantially larger and have considerably greater resources. In addition, we compete with other entities that are managed by BCPA or the BCPA Credit Affiliates or in which BCPA or the BCPA Credit Affiliates have an interest. These competitive pressures could have a material and adverse effect on Mount Logan’s business, financial condition or prospects. As a result of this competition, Mount Logan can provide no assurance that it will be able to take advantage of attractive business opportunities that may arise from time to time.
Because our business model depends upon relationships with various counterparties, the inability of BCPA to maintain or develop these relationships, or the failure of these relationships to generate business opportunities, could adversely affect our business.
If BCPA fails to maintain its existing relationships, or develop new relationships, on which we rely, to generate business opportunities, we may not be able to grow and its business could be materially and adversely impacted. In addition, entities and individuals with whom BCPA has relationships generally are not obligated to provide BCPA with business opportunities and, therefore, there is no assurance that such relationships will generate business opportunities for us.
Risks Related to the Business – Asset Management
The asset management business is competitive.
The asset management business is competitive, with competition based on a variety of factors, including investment performance, business relationships, quality of service provided to clients, client liquidity and willingness to invest, fund terms (including fees), brand recognition and business reputation. We, through ML Management, compete for prospective clients with a number of other asset managers, public and private funds, business development companies, interval funds and others. Numerous factors increase ML Management’s competitive risks, including:
•a number of ML Management competitors have greater financial, technical, marketing and other resources and more personnel than ML Management does;
•several of ML Management’s competitors have raised significant amounts of capital, and many of them have similar investment objectives to those of ML Management, which may create additional competition for prospective clients and investment opportunities;
29
•some of ML Management’s competitors may have a lower cost of capital and access to funding sources that are not expected to be available to ML Management, which may create competitive disadvantages for ML Management;
•some of ML Management’s competitors may be subject to less regulation and, accordingly, may have more flexibility to undertake and execute certain business or investments than ML Management does and/or bear less compliance expense than ML Management does;
•some of ML Management’s competitors may have better expertise or be regarded by prospective clients as having better expertise in a specific asset class or geographic region than ML Management does; and
•other industry participants may, from time to time, seek to recruit its investment professionals and other employees away from ML Management.
In addition, current or prospective clients of ML Management may negotiate for lower fees or more limited reimbursement requirements relating to expenses. Such economic terms may be less favorable, reducing ML Management’s financial opportunity from any such asset management activities.
These and other competitive pressures could adversely affect ML Management, which in turn may adversely impact our business, results of operations and financial condition.
Additionally, BCPA or the BCPA Credit Affiliates may establish one or more other asset management businesses, which may be competitive with ML Management and would lead to additional conflicts of interest. For example, individuals providing services to ML Management would likely be expected to provide similar services for any such new asset management business as well, and would face conflicts of interest in allocating time to the activities of ML Management and any such new asset management business. See the section “Certain Relationships and Related Person Transactions” for additional information.
We may experience a decline in revenue associated with our asset management business for a variety of reasons.
Our asset management business derives revenues from fees generated from advisory and other services such business provides.
Certain fees that ML Management may earn, such as origination, arranger, structuring and other similar fees, are driven in part by the pace at which ML Management sources investment opportunities. Any decline in such pace would reduce ML Management’s fee income from such sources. Likewise, any increase in the pace at which the clients ML Management manages exit investments would reduce origination, arranger, structuring and other similar fees to the extent additional investment opportunities are not available to re-deploy all or a portion of the proceeds. Mount Logan’s ability to maintain or grow these services, and the related fees ML Management earns therefrom, will depend on a number of factors, some of which are outside Mount Logan’s control, including conditions in the debt, equity or merger markets.
In addition, with respect to any clients that are funds regulated under the 1940 Act, each such fund’s investment management agreement must generally be re-approved annually by such fund’s board of directors or by the vote of a majority of the stockholders and the majority of the independent members of such fund’s board of directors. Moreover, as required by the 1940 Act, these contracts are terminable without penalty upon 60 days’ written notice. Because we, through ML Management, receive management fees and other revenue from investment advisory agreements that are subject to the foregoing requirements, there can be no assurance that such agreements will remain in place, which could result in a loss of revenue.
If a client of ML Management performs poorly, ML Management may receive little or no performance fees, if applicable. In addition, poor performance may result in lower assets under management and a corresponding reduction in fee-related revenue. With respect to any private fund clients, if as a result of poor performance of later investments in a such a fund’s life, that fund does not achieve investment returns that exceed a specified return threshold for the life of the fund, ML Management could be obligated to repay the amount by which performance
30
fees that were previously distributed to ML Management exceed amounts to which ML Management is ultimately entitled.
We, through ML Management, receive collateral management fees pursuant to collateral management agreements for acting as the collateral manager of certain collateralized loan obligations (“CLOs”). If all the notes issued by one of the CLOs are redeemed, or if the collateral management agreement is otherwise terminated, ML Management will no longer receive collateral management fees from that CLO. In general, a collateral management agreement may be terminated both with and without cause at the direction of holders of a specified supermajority in principal amount of the notes issued by the CLO. Furthermore, such fees are based on the total amount of assets held by the CLO. If the assets held by the CLO are prepaid or go into default, ML Management will receive lower collateral management fees than expected or the collateral management fees may be eliminated. In addition, collateral management agreements typically provide that if certain over-collateralization tests are failed, the collateral management agreement may be terminated by a vote of the security holders, which would result in ML Management’s loss of management fees from these CLOs.
In each instance, a decrease in the fees received by ML Management from its asset management activities will lead to a decrease in revenues and may have a materially adverse impact on our business and results of operations. The historical performance of Legacy MLC’s asset management business should not be considered indicative of our future performance, which may vary considerably from historical performance.
We may be subject to focus by certain current or prospective clients or other stakeholders on environmental, social and governance matters.
Certain current or prospective clients, regulators and other stakeholders are increasingly focused on sustainability matters, such as climate change and environmental stewardship, human rights, support for local communities, corporate governance and transparency, or other environmental- or social-related areas. Certain stakeholder groups have increased their activism and scrutiny of asset managers’ approaches to considering sustainability matters as part of their investment management decision making. Moreover, a growing number of states having enacted or proposed policies or legislation or have engaged in related litigation regarding sustainability matters. Increased focus and activism related to sustainability matters may constrain our asset management-related business opportunities or otherwise negatively impact our prospects or results of operations.
Growing interest on the part of various stakeholders, including regulators, in sustainability factors and increased demand for, and scrutiny of, asset managers’ sustainability-related disclosure, have also increased the risk that asset managers could be perceived as, or accused of, making inaccurate or misleading statements regarding these matters. The occurrence of any of the foregoing could have a material and adverse impact on our business and could lead to inquiries, investigations, or lawsuits.
Additionally, our business could be adversely affected if it fails to comply with applicable sustainability regulations. If regulators enact new rules, it may materially and adversely affect us in various ways, including the incurrence of significant compliance costs and an increase in the risk of litigation and regulatory action.
Valuations for illiquid assets under management entail significant complications.
The value of any illiquid investments held by entities ML Management manages will generally be based on estimates of fair value as of the date of determination based on third-party valuations or models, or, in some cases, models developed by us. Because these valuations are inherently uncertain, they may fluctuate greatly from period to period. Also, they may vary greatly from the prices that would be obtained if the assets were to be liquidated on the date of the valuation. In addition, if any such illiquid investments are in industries or sectors that are unstable, in distress, or undergoing some uncertainty, such investments will be subject to rapid changes in value caused by sudden company-specific or industry-wide developments.
If realized values are significantly lower than the estimated value, there could be a decline in ML Management’s management fees (particularly expected performance fees, if any). If actual asset values turn out to be materially different compared to those determined by the valuations described above, clients could lose
31
confidence in ML Management which could, in turn, negatively impact our business, operations and financial results.
We, through ML Management, may only manage a limited number of funds and investments.
We, through ML Management, may only manage a limited number of funds or products, and each fund or product may participate in a limited number of investments. Such investments may be concentrated within relatively few industries, sectors, countries or regions. Such investments may be exposed to one or more common or systemic risks as result. The performance of our asset management business may be negatively affected by the unfavorable performance of a limited subset of funds or products or a small group or type of investments. Any such unfavorable performance may have a material adverse effect on our business, operations and financial results.
Risks Related to the Business – Insurance
Our insurance business is heavily regulated and changes in regulation could reduce our profitability.
Our insurance and reinsurance subsidiary is Ability, which is highly regulated by insurance regulators in the United States and changes in regulations affecting the Ability’s insurance business may reduce our profitability and limit our growth. Ability operates in 42 U.S. states and the District of Columbia. The insurance and reinsurance industry are generally heavily regulated and Ability’s operations in each of these jurisdictions are subject to varying degrees of regulation and supervision. The laws and regulations of the jurisdictions in which Ability operates may require Ability to, among other things, maintain minimum levels of statutory capital, surplus and liquidity, meet solvency standards, submit to periodic examinations of its financial condition, and restrict payments of dividends and distributions of capital. Ability is also subject to laws and regulations that may restrict its ability to write insurance and reinsurance policies, make certain types of investments and distribute funds. With respect to investments, Ability must comply with applicable regulations regarding the type and concentration of investments it may make. These restrictions are set forth in investment guidelines that ML Management must comply with when providing investment management to Ability. These restrictions may limit Ability’s capacity to invest and ML Management’s ability to earn fees on those investments. In addition, Ability is subject to laws and regulations governing affiliate transactions. The investment management agreement between ML Management and Ability was approved by applicable insurance regulators, and any changes of such agreement, including with respect to fees, must receive applicable approval.
In connection with the conduct of Ability’s insurance and reinsurance business, it is crucial that Ability establish and maintain good working relationships with the various regulatory authorities having jurisdiction over its business. If those relationships and that reputation were to deteriorate, Ability’s business could be materially adversely affected. For example, Ability requires various consents and approvals from its regulators, both with respect to transactions Ability enters into and in the ordinary course of the conduct of its business. If Ability fails to maintain good working relationships with its regulators, it may become more difficult or impossible for Ability to obtain those consents and approvals, either on a timely basis or at all.
Regulations applicable to Ability and interpretations and enforcement of such regulations may change. Insurance regulators have increased their scrutiny of the insurance regulatory framework in the United States. Ability is unable to predict whether, when or in what form legislators will enact legislative and regulatory changes, and Ability cannot provide any assurances that more stringent restrictions will not be adopted from time to time in jurisdictions in which Ability conducts business.
The cost of compliance with existing laws and regulations is high and the cost of compliance with any new regulatory requirements could have a significant and negative effect on Ability’s business. Ability may not be able to comply fully with, or obtain desired exemptions from, any such new laws and regulations that govern the conduct of Ability’s business. Failure to comply with, or to obtain desired authorizations and/or exemptions under, any applicable laws could result in restrictions on Ability’s capacity to do business or undertake activities that are regulated in one or more of the jurisdictions in which Ability operates, could impact Ability’s potential growth and could subject Ability to fines and other sanctions. In addition, changes in the laws or regulations to which Ability is subject, or in the interpretations thereof by enforcement or regulatory agencies, could have a material adverse effect on Ability’s business, results of operations and financial condition.
32
Ability operates in a highly competitive industry that includes a number of companies, many of which are larger and more well-known, which could limit Ability’s capacity to increase or maintain market share and/or margins.
Ability operates in highly competitive markets and competes with large and small industry participants. Ability faces intense competition, based upon price, terms and conditions, relationships with distribution partners and other clients, quality of service, capital and perceived financial strength (including independent rating agencies’ ratings), technology, innovation, ease of use, capacity, product breadth, reputation and experience, brand recognition and claims processing.
Ability’s competitors include other insurers, reinsurers and other financial institutions that offer investment products. Many of Ability’s competitors are large and well-established, and some have greater market share or breadth of distribution, assume a greater level of risk while maintaining financial strength ratings, or have higher financial strength, claims-paying or credit ratings than Ability does or benefit, by offering various lines of insurance, from diversification of risks and possible positive impacts on capital requirements.
Ability’s competitors may also have lower operating costs than Ability, which may allow them to price insurance products, reinsurance solutions or acquisitions more competitively. Furthermore, Ability may face greater operational complexity when compared to competitors who offer a more limited range of products due to the breadth of Ability’s product offering.
The reinsurance industry is highly competitive, and Ability encounters significant competition in all lines of business from other reinsurance companies, as well as competition from other providers of financial services. Ability’s competitors vary by geographic market, and many of Ability’s competitors have greater financial resources than Ability does. Ability’s capacity to compete depends on, among other things, pricing and other terms and conditions of reinsurance agreements, Ability’s capacity to maintain strong financial strength ratings, and Ability’s service and experience in the types of business that Ability underwrites.
The insurance and reinsurance industries are subject to ongoing changes from market pressures brought about by customer demands, changes in law, changes in economic conditions such as interest rates and investment performance, technological innovation, marketing practices and new providers of insurance and reinsurance solutions. Failure to anticipate market trends or to differentiate Ability’s products and services may affect Ability’s capacity to grow or maintain its current position in the industry. A failure by the insurance industry to meet evolving consumer demands, including demands to address disparate impacts that may exist against certain groups in insurers’ underwriting and sales models, could adversely affect the insurance industry and Ability’s operating results. Similarly, Ability’s failure to meet the changing demands of its insurance company clients through innovative product development, effective distribution channels and investments in technology could negatively impact its financial performance over the long-term. Additionally, Ability’s failure to adjust its strategies in response to changing economic conditions could impact its competitive position and have a material adverse effect on its business, financial condition and results of operations.
Because of the highly competitive nature of the insurance industry, there can be no assurance that Ability will maintain or grow its market share, continue to identify attractive opportunities in either the individual or institutional markets, or that competitive pressure will not have a material adverse effect on Ability’s business, results of operations and financial condition.
Additionally, BCPA and certain of the BCPA Credit Affiliates have established a separate Cayman-domiciled reinsurance business, which competes with Ability and will lead to additional conflicts of interest. For example, individuals providing services to Ability will provide similar services for such new reinsurance business as well, and will face conflicts of interest in allocating time to the activities of Ability and such new reinsurance business. In addition, there may be times when Ability cedes certain insurance products to, or otherwise engages in transactions with, such new reinsurance business, which may result in, among other things, a reduction in Ability’s assets and a related reduction in fee income earned by ML Management and a corresponding increase in such new reinsurance business’ assets and a related increase in fee income earned by BCPA. See the section “Certain Relationships and Related Person Transactions” for additional information.
33
Differences between Ability’s policyholder behavior estimates, reserve assumptions and actual claims experience, in particular with respect to the timing and magnitude of claims and surrenders, may adversely affect Ability’s results of operations or financial condition.
Ability holds reserves to pay future policy benefits and claims. Ability’s reserves are estimated based on data and models that include many assumptions and projections, which are inherently uncertain and involve significant judgment, including assumptions as to the levels and/or timing of receipt or payment of premiums, benefits, claims, expenses, interest credits, investment results (including equity and other market returns), mortality, morbidity, longevity and persistency.
While Ability periodically reviews the adequacy of its reserves and the assumptions underlying those reserves, Ability cannot determine with precision the amounts that Ability will pay for, or the timing of payment of, actual benefits, claims and expenses or whether the assets supporting policy liabilities, together with future premiums, will grow to the level assumed prior to the payment of benefits or claims. For Ability’s reinsurance of fixed-rate annuities, reserves are equal to policyholder account balances before applicable surrender charges, and lapse, surrender rates and persistency assumptions are important assumptions used in calculating these reserves and drivers of profitability with respect to these products. Advances in technology, including predictive medical technology that enables consumers to select products better matched to their individual longevity or mortality risk profile and other medical breakthroughs that extend lives, could cause Ability’s future experience to deviate significantly from actuarial assumptions, which could significantly impact the level of reserves and profitability. The resulting acceleration of expense amortization, reduced spread or increased payments could have a material adverse effect on Ability’s business, financial condition and results of operations.
If actual experience differs significantly from assumptions or estimates, certain balances included in Ability’s balance sheet may not be adequate, particularly deferred acquisition costs, policy reserves and other actuarial balances. If Ability concludes that its reserves, together with future premiums, are insufficient to cover future policy benefits and claims, Ability would be required to increase its reserves and incur income statement charges for the period in which it makes the determination, which could have a material adverse effect on Ability’s business, financial condition and results of operations. An increase in the statutory reserves of Ability may negatively affect liquidity and capitalization.
Estimates used in the preparation of financial statements and models for insurance products may differ materially from actual experience.
U.S. GAAP requires the application of accounting guidance and policies that often involve a significant degree of judgment when accounting for insurance products. These estimates include, but are not limited to, premium persistency, future policy benefits and related expenses, valuation of embedded derivatives, valuation and impairment of investments and amortization of deferred revenues and expenses, and the valuation and impairment of goodwill recognized in accordance with the acquisition of Ability. These accounting estimates require the use of assumptions, some of which are highly uncertain at the time of estimation. These estimates are based on judgment, current facts and circumstances and, when applicable, internally developed models. Therefore, actual results could differ from these estimates, possibly in the near term. Inaccuracies could result in, among other things, an increase in policyholder benefit reserves or acceleration of the amortization of deferred revenues and expenses, which would result in a charge to earnings, a restatement of Ability’s historical financial statements or other material adjustments. Additionally, the potential for unforeseen developments, including changes in laws, regulations or accounting standards, may result in losses and loss expenses materially different from the reserves initially established.
In addition, Ability employs models to price products, calculate reserves and value assets, as well as evaluate risk and determine capital requirements, among other uses. These models rely on estimates and projections that are inherently uncertain, may use incomplete, outdated or incorrect data or assumptions and may not operate properly. As Ability’s business continues to expand and evolve, the number and complexity of models it employs has grown, increasing exposure to error in the design, implementation or use of models, including the associated data input, controls and assumptions, and the controls in place to mitigate their risk may not be effective in all cases.
34
Ability’s historical growth rates may not be indicative of its future growth, and Ability may not be able to identify attractive insurance markets, reinsurance opportunities or investments with returns that are as favorable as Ability’s historical returns and grow new business volumes at historical levels.
Ability’s historical growth rates may not reflect its future growth rates. While Ability anticipates that it will continue to grow by deepening existing and adding new distribution relationships in Ability’s individual market, pursuing attractive reinsurance opportunities and expanding its funding agreement business in the institutional market, taking advantage of investment opportunities to support Ability’s growth, developing new products and entering new markets, Ability may not be able to identify opportunities to do so. With future growth, there can be no guarantee that Ability’s net underwriting return will be as favorable as its historic returns. Weaker margins may challenge Ability’s capacity to grow profitably or at the returns targeted. Further, in order to maintain or increase investment returns, it may be necessary to expand the scope of Ability’s investing activities to asset classes in which Ability historically has not invested, which may increase the risk of Ability’s investment portfolio. If Ability is unable to find profitable growth opportunities, it will be more difficult for Ability to continue to grow, and could negatively affect its results of operations and financial condition.
Interest rate fluctuations could negatively affect the income Ability derives from the difference between the interest rates it earns on its investments and interest it pays under its reinsurance contracts.
Significant changes in interest rates expose reinsurance companies to the risk of reduced investment income or actual losses based on the difference between the interest rates earned on investments and the credited interest rates paid on outstanding reinsurance contracts. Both rising and declining interest rates can negatively affect the income Ability derives from these interest rate spreads. During periods of rising interest rates, Ability may be contractually obligated to reimburse its clients for the greater amounts they credit on certain interest-sensitive products. However, Ability may not have the ability to immediately acquire investments with interest rates sufficient to offset the increased crediting rates on its reinsurance contracts. During periods of falling interest rates, Ability’s investment earnings will be lower because new investments in fixed maturity securities will likely bear lower interest rates. Ability may not be able to fully offset the decline in investment earnings with lower crediting rates on underlying annuity products related to certain of its reinsurance contracts. Ability’s asset/liability management programs and procedures may not reduce the volatility of its income when interest rates are rising or falling, and thus Ability cannot assure you that changes in interest rates will not affect its interest rate spreads. Changes in interest rates may also affect Ability’s business in other ways. Higher interest rates may result in increased surrenders on interest-based products of Ability’s clients, which may affect its fees and earnings on those products. Lower interest rates may result in lower sales of certain insurance and investment products of Ability’s clients, which would reduce the demand for its reinsurance of these products. If interest rates remain low for an extended period, it may adversely affect Ability’s cash flows, financial condition and results of operations.
Ability faces risks associated with business it reinsures and business it cedes to reinsurers and which could cause a material adverse effect on Ability’s business, results of operations and financial condition.
As part of Ability’s overall risk management strategy, it cedes business to other insurance companies through reinsurance. Ability’s inability to collect from its reinsurers (including reinsurance clients in transactions where Ability reinsures business net of ceded reinsurance) on its reinsurance claims could have a material adverse effect on Ability’s business, results of operations and financial condition. Although reinsurers are liable to Ability to the extent of the reinsurance coverage it acquires, Ability remains primarily liable as the direct insurer on all risks that it writes; therefore, Ability’s reinsurance agreements do not eliminate its obligation to pay claims. As a result, Ability is subject to the risk that it may not recover amounts due from reinsurers. The risk could arise primarily in two situations: (i) Ability’s reinsurers may dispute some of its reinsurance claims based on contract terms, and, as a result, Ability may receive partial or no payment; or (ii) Ability’s reinsurers may default on their obligations. While Ability may manage these risks through transaction-related diligence, contract terms, collateral requirements, hedging, and other oversight mechanisms, Ability’s efforts may not be successful. A reinsurer’s insolvency, or its inability or unwillingness to make payments due to Ability under the terms of the relevant reinsurance agreements, could have a material adverse effect on Ability’s business, results of operations and financial condition.
35
Ability also bears the risk that the companies that reinsure its mortality risk on a yearly renewable term, where the reinsurer may reset the premium and other terms each year, increase the premiums they charge to levels Ability deems unacceptable. If that occurs, Ability will either need to pay such increased premiums, which will affect margins and financial results, or alternatively, Ability will need to limit or potentially terminate reinsurance, which will increase the risks that Ability retains.
Conversely, Ability assumes liabilities from other insurance companies. Changes in the ratings, creditworthiness or market perception of such ceding companies or in the administration of policies reinsured to Ability could cause policyholders of contracts reinsured to Ability to surrender or lapse their policies in unexpected amounts. In addition, to the extent such ceding companies do not perform their obligations under the relevant reinsurance agreements, Ability may not achieve the results intended and could suffer unexpected losses. In either case, Ability has exposure to reinsurance clients, which could materially and adversely affect Ability’s business, financial condition, results of operations and cash flows.
The determination of the amount of impairments and allowances for credit losses recognized on Ability’s investments is highly subjective and could materially affect its results of operations or financial condition.
The determination of the amount of impairments and allowances for credit losses is based upon Ability’s periodic evaluation and assessment of known and inherent risks associated with the respective asset class and the specific investment being reviewed. Such evaluations and assessments are revised as conditions change and new information becomes available. Management updates its evaluations regularly and reflects changes in allowances and impairments in its financial results as such evaluations are revised. Impairments result in a non-cash charge to earnings during the period in which the impairment charge is taken. Changes in allowances for credit losses can result in either a charge or credit to earnings.
For example, an allowance is recognized on Ability’s fixed maturity securities when the fair value of the security is less than its amortized cost basis and credit related losses are deemed to have occurred. The determination of the allowance requires assessment of the security’s expected future cash flows, which depend on a variety of macroeconomic factors and security-specific considerations. Similarly, the determination of the allowance on Ability’s mortgage and other loan receivables requires an assessment of expected credit losses that considers current, historical and forecasted macroeconomic data and loan-specific factors. As expectations change based on macroeconomic data and individual investment considerations, the associated allowance for credit losses can be adjusted, up or down.
There can be no assurance that management has accurately determined the amount of impairments and allowances for credit losses recognized in our financial statements and their potential impact on regulatory capital. Furthermore, additional impairments and allowance provisions may be taken in the future.
Ability’s liabilities for insurance products may prove to be inadequate, requiring Ability to increase liabilities which results in reduced net income and shareholders’ equity.
Liabilities for insurance products are calculated based on numerous assumptions including, but not limited to, investment yields, mortality, morbidity, withdrawals, lapses, cash flow assumptions and discount rates. Such assumptions are based on Ability’s experience, and in cases of limited experience, industry experience. Such assumptions also consider future expectations in policyholder behavior that may vary from past experience.
Many factors can affect these reserves and liabilities, such as economic and social conditions, inflation, hospital and pharmaceutical costs, changes in life expectancy, regulatory actions, changes in doctrines of legal liability and extra-contractual damage awards. Therefore, the reserves and liabilities Ability establishes are necessarily based on estimates, assumptions, industry data and prior years’ statistics. Ability’s financial performance depends significantly upon the extent to which Ability’s actual claims experience and future expenses are consistent with the assumptions Ability used in setting its reserves. If Ability’s future claims are higher than its assumptions, and Ability’s reserves prove to be insufficient to cover Ability’s actual losses and expenses, Ability would be required to increase Ability’s liabilities, and this could have a material adverse effect on Ability’s results of operations and financial condition.
36
Ability is subject to regulatory capital requirements in the United States.
Ability’s business is subject to external capital requirements in the United States, as required by Nebraska statute. Regulatory capital requirements for Ability are determined in accordance with guidelines issued by the National Association of Insurance Commissioners (“NAIC”). The risk-based capital ratio (“RBC”) requirement is a statutory minimum level of capital that is based on two factors: an insurance company’s size, and the inherent riskiness of its financial assets and operations. That is, Ability must hold capital in proportion to its risk. Under those requirements, the amount of statutory capital and surplus maintained by an insurance company is to be determined based on the various risk factors related to it. The minimum RBC ratio for Ability is 200% and Ability must have a ratio in excess of 300% to be able to write new business. Ability’s RBC ratio is tested annually at the end of Ability’s financial year and was in excess of the minimum requirement as of December 31, 2024. From time to time during a particular financial year, Ability may take steps to increase its RBC ratio to ensure it remains above the minimum requirement or exceeds the ratio required to write new business, which steps may include, among other things, securing additional funding. Failure to meet or exceed the regulatory capital requirements issued by NAIC could significantly limit Ability’s ability to write new business.
Ability faces risks associated with credit.
The assets and other debt securities in which Ability invests, including mortgage loans, are subject to credit and liquidity risk. Any loan investment may become a defaulted obligation for a variety of reasons, including non-payment of principal or interest, as well as covenant violations by the borrower in respect of the underlying loan documents. A defaulted loan may become subject to either substantial workout negotiations or restructuring, which may entail, among other things, a substantial reduction in the interest rate, a substantial write-down of principal, and a substantial change in the terms, conditions and covenants with respect to such defaulted loan. In addition, such negotiations or restructuring may be extensive and protracted over time, and therefore may result in substantial uncertainty with respect to the ultimate recovery on such defaulted loan. In addition, substantial costs in such situations may be imposed on Ability, further affecting the value of the investment. The liquidity in defaulted loans may also be limited, and to the extent that defaulted loans are sold, it is highly unlikely that the proceeds from such sale will be equal to the amount of unpaid principal and interest thereon, which would adversely affect our financial condition and consequently, the market value of shares of our Common Stock.
Ability faces due diligence risks.
The due diligence process undertaken by Ability in connection with investments that it expects to make or wishes to make may not reveal all relevant facts in connection with an investment. Before making investments, Ability conducts due diligence investigations that it deems reasonable and appropriate based on the facts and circumstances applicable to each investment. When conducting due diligence investigations, Ability may be required to evaluate important and complex business, financial, tax, accounting, environmental and legal issues. Outside consultants, legal advisors, accountants and investment banks may be involved in the due diligence process in varying degrees depending on the type of investment. Nevertheless, when conducting due diligence investigations and making an assessment regarding an investment, Ability relies on resources available, including information provided by the target of the investment and, in some circumstances, third party investigations. The due diligence investigations that are carried out with respect to any investment opportunity may not reveal or highlight all relevant facts that may be necessary.
Ability faces risks from borrower clients.
Each borrower client is also subject to risks which affect its financial condition. As Ability is not privy to all aspects of its clients’ businesses, it is impossible to predict exactly what risks borrowers will face. Nonetheless, typical risks include the following: (i) the success of Ability’s borrowers may depend on the management talents and efforts of certain key persons or a small group of persons. The death, disability or resignation of one or more of these persons could have a material adverse effect on a borrower; (ii) borrowers may require additional working capital to carry out their business activities and to expand their businesses. If such working capital is not available, or is not available on beneficial terms, the financial performance and development of the businesses of the borrowers may be adversely affected; (iii) damage to the reputation of the borrowers’ brands could negatively impact consumer
37
opinion of those businesses or their related products and services, which could have an adverse effect on their business; (iv) borrowers may face competition, including competition from companies with greater financial or other resources, more extensive development, manufacturing, marketing, and other capabilities. There can be no assurance that Ability’s borrower clients will be able to successfully compete against their competitors or that such competition will not have a material adverse effect on their businesses; (v) borrowers may experience reduced revenues from the loss of one or more customers representing a high percentage of their revenues; (vi) borrowers may experience reduced revenues due to an inability to meet regulatory requirements, or may experience losses of revenues due to unforeseeable changes in regulations imposed by various levels of government; (vii) borrowers may rely on government or other subsidy programs for revenue or profit generation, and changes to or elimination of such programs may have an adverse effect on the borrower; and (viii) borrowers may derive some of their revenues from foreign sources and may experience negative financial results based on foreign exchange losses, hedging costs or foreign investment restrictions.
Ability faces risks from prepayments by borrower clients.
Certain of Ability’s investments may be prepayable by the borrowers, subject to prepayment penalties. Ability is unable to predict if or when a borrower will make a prepayment. Typically, a borrower’s decision to prepay depends on its continued positive economic performance and the existence of favorable financing market conditions that permit the borrower to replace its existing financing with less expensive capital. As market conditions change frequently, it is difficult to predict if or when a borrower may deem market and business conditions to be favorable for prepayment. Prepayment by a borrower may have the effect of reducing the achievable yield of the loan to a level below that which was anticipated by Ability. Such a reduction may occur when Ability is unable to invest the funds prepaid by the borrower in other transactions with an expected yield greater than or equal to the yield Ability expected to receive from the prepaying borrower.
Ability faces risk of default by and bankruptcy of a borrower client.
A borrower’s failure to satisfy its borrowing obligations, including any covenants imposed by Ability, could lead to defaults and the termination of the borrower’s loans and enforcement against its assets. In order to protect and recover its investments, Ability may be required to bear significant expenses (including legal, accounting, valuation and transaction expenses) to the extent necessary to seek recovery upon default or to negotiate new terms with a defaulting borrower. In certain circumstances, a borrower’s default under one loan could also trigger cross-defaults under other agreements and jeopardize that borrower’s ability to meet its obligations under a loan agreement it may have with Ability.
Second priority liens on collateral securing debt investments that Ability makes may be subject to control by senior creditors with first priority liens. If there is a default, the value of the collateral may not be sufficient to repay in full both the first priority creditors and Ability.
Certain debt investments that Ability makes may be secured on a second priority basis by the same collateral securing first priority debt of such companies. The first priority liens on the collateral will secure the portfolio corporation’s obligations under any outstanding senior debt and may secure certain other future debt that may be permitted to be incurred by Ability under the agreements governing the loans. The holders of obligations secured by the first priority liens on the collateral will generally control the liquidation of and be entitled to receive proceeds from any realization of the collateral to repay their obligations in full before Ability. In addition, the value of the collateral in the event of liquidation will depend on market and economic conditions, the availability of buyers and other factors. There can be no assurance that the proceeds, if any, from the sale or sales of all of the collateral would be sufficient to satisfy the debt obligations secured by the second priority liens after payment in full of all obligations secured by the first priority liens on the collateral. If such proceeds are not sufficient to repay amounts outstanding under the debt obligations secured by the second priority liens, then Ability, to the extent not repaid from the proceeds of the sale of the collateral, will only have an unsecured claim against the portfolio company’s remaining assets, if any.
The rights Ability may have with respect to the collateral securing the debt investments it makes with senior debt outstanding may also be limited pursuant to the terms of one or more intercreditor agreements that
38
Ability enters into with the holders of senior debt. Under such an intercreditor agreement, at any time that obligations that have the benefit of the first priority liens are outstanding, any of the following actions that may be taken in respect of the collateral will be at the direction of the holders of the obligations secured by the first priority liens: the ability to cause the commencement of enforcement proceedings against the collateral; the ability to control the conduct of such proceedings; the approval of amendments to collateral documents; releases of liens on the collateral; and waivers of past defaults under collateral documents. Ability may not have the ability to control or direct such actions, even if its rights are adversely affected.
Ability is subject to additional risks associated with investments in the form of loan participation interests.
Ability invests in loan participation interests in which another lender or lenders share with it the rights, obligations and benefits of a loan made by an originating lender to a borrower. Accordingly, Ability will not be in privity of contract with a borrower because the other lender or participant is the record holder of the loan and, therefore, Ability will not have any direct right to any underlying collateral for the loan. These loan participations may be senior, pari passu or junior to the interests of the other lender or lenders in respect of distributions from the loan. Furthermore, Ability may not be able to control the pursuit of any rights or remedies under the loan, including enforcement proceedings in the event of default thereunder. In certain cases, the original lender or another participant may be able to take actions in respect of the loan that are not in Ability’s best interests. In addition, in the event that (1) the owner of the loan participation interest does not have the benefit of a perfected security interest in the lender’s rights to payments from the borrower under the loan or (2) there are substantial differences between the terms of the loan and those of the applicable loan participation interest, such loan participation interest could be recharacterized as an unsecured loan to a lender that is the record holder of the loan in such lender’s bankruptcy, and the assets of such lender may not be sufficient to satisfy the terms of such loan participation interest. Accordingly, Ability may face greater risks from loan participation interests than if it had made loans directly to the borrowers.
Ability faces risk on the collateral securing Ability’s loans.
Where the loans provided by Ability are secured by a lien on specified collateral of the borrower (particularly inventory, receivables and tangible fixed assets), there is no assurance that Ability will have obtained or properly perfected its liens, or that the value of the collateral securing any particular loan will protect Ability from suffering a partial or complete loss if the loan becomes non-performing and Ability moves to enforce against the collateral. In such event, we could suffer losses that could have a material adverse effect. In addition, during its underwriting process, Ability will make an estimate of the value of the collateral. A decrease in the market value of collateral assets at a rate greater than the rate projected by Ability may adversely affect the current realization values of such collateral. The degree of realization risk varies by the business of the borrower and the nature of the security.
Ability may not be able to exercise control over borrower clients.
Ability will not always be in a position to exercise control over its borrower clients or prevent decisions by the management or shareholders of a borrower that may affect the fair value of an Ability loan, or otherwise affect the ability of the borrower to repay its obligations to Ability. Furthermore, Ability does not intend to take significant equity positions in its borrower clients. The lack of liquidity of debt positions that Ability will typically hold in its borrower clients results in the risk that Ability may not be able to dispose of its exposure to the borrower in the instance where a borrower is underperforming. This could have a material adverse effect on us.
Ability faces risks related to securities of borrower clients.
Ability anticipates lending to both public and private companies, which may include bonus features granting Ability securities of the client. The securities issued by private companies will be subject to legal and other restrictions on resale or will be otherwise less liquid than publicly traded securities. To the extent Ability receives any form of securities issued by private companies, it may be difficult for Ability to dispose of such holdings if the need arises. Furthermore, if Ability is required to liquidate all or a portion of the securities it holds in an illiquid company, it may realize significantly less than the value at which it had previously recorded its holdings. In addition, Ability may face restrictions imposed by U.S. securities laws on its ability to liquidate or otherwise trade in securities of a borrower client, including, where Ability obtains material non- public information regarding such borrower.
39
Use of leverage and changes in interest rates may affect Ability’s cost of capital and net investment income.
Since Ability may from time to time use debt to finance a portion of its investments, its net investment income will depend, in part, upon the difference between the rate at which it borrows funds and the rate at which it invests those funds. As a result, we can offer no assurance that a significant change in market interest rates will not have a material adverse effect on Ability’s net investment income. In periods of rising interest rates when Ability has debt outstanding, Ability’s cost of funds will increase, which could reduce its net investment income. Ability expects that its long-term fixed-rate investments will be financed primarily with equity and long-term debt. Ability may use interest rate risk management techniques in an effort to limit its exposure to interest rate fluctuations. These activities may limit Ability’s capacity to participate in the benefits of lower interest rates with respect to the hedged portfolio. Adverse developments resulting from changes in interest rates or hedging transactions could have a material adverse effect on our business, financial condition and results of operations.
The ability of Ability to service any future outstanding debt depends largely on its financial performance and is subject to prevailing economic conditions and competitive pressures. The amount of leverage that Ability will employ at any particular time will depend on its assessments of market and other factors at the time of any proposed borrowing. As a result of Ability’s use of leverage: (i) shares of our Common Stock may be exposed to incremental risk of loss and a decrease in the value of Ability’s loan portfolio would have a greater negative impact on the value of shares of our Common Stock if Ability did not use leverage; (ii) adverse changes in interest rates could reduce or eliminate the incremental income we receive from the proceeds of any leverage; (iii) Ability and, indirectly, our shareholders, will bear the entire cost of paying interest and repaying any borrowed funds; (iv) our ability to pay dividends on its common shares may be restricted by covenants or other restrictions imposed by Ability’s lenders; (v) Ability’s ability to amend its organizational documents or other agreements may be restricted if such amendments would result in a material adverse effect on its lenders; and (vi) Ability may, under some circumstances, be required to dispose of its assets under unfavorable market conditions in order to maintain its leverage, thus causing us to recognize a loss that might not otherwise have occurred. The extent to which the gains and losses associated with leveraged investing are increased will generally depend on the degree of leverage employed.
40
USE OF PROCEEDS
We estimate that the net proceeds from the sale of the Notes in this offering will be approximately $ (or approximately $ if the underwriters fully exercise their overallotment option), after deducting the underwriting discount and estimated offering expenses payable by us. If the aggregate principal amount of Notes offered is increased, the net proceeds to us will increase proportionally. We intend to use the net proceeds to repay borrowings under the Credit Facility and any remainder for general corporate purposes, and we do not expect that an increase in the size of this offering would materially change our intended use of proceeds.
Amounts drawn under the Credit Facility initially bore interest at London Interbank Offer Rate (“LIBOR”) plus a spread of 7.50%. The benchmark, LIBOR, was replaced by the secured overnight financing rate (“SOFR”) upon the transition from LIBOR on May 2, 2023. Upon the most recent amendment, the Credit Facility bears interest based on a pricing step-down mechanism, starting from SOFR plus a spread of 7.50%, as the business continues to perform. The remaining principal amount outstanding and any accrued but unpaid interest will be payable on August 20, 2027. As of September 30, 2025, $38.0 million of borrowings were outstanding under the Credit Facility. For a description of borrowings under the Credit Facility, see “Description of Other Indebtedness.”
41
CAPITALIZATION
Following the consummation of the Business Combination, Legacy MLC was considered the accounting acquirer for financial reporting purposes, and we are accounting for the Merger as a reverse acquisition using the acquisition method of accounting. For more information, see “Unaudited Pro Forma Condensed Combined Financial Information” included elsewhere in this prospectus.
The following table sets forth Mount Logan’s cash and cash equivalents and capitalization as of September 30, 2025 (i) on an actual basis and (ii) as adjusted for the issuance of the Notes offered hereby (assuming no increase in the aggregate principal amount of Notes offered hereunder and no exercise of the underwriters’ option to purchase additional Notes and the application of the net proceeds therefrom as described in “Use of Proceeds.”). This table should be read together with the information contained in this prospectus, including “Use of Proceeds,” “Management’s Discussion and Analysis of Financial Condition and Results of Operations” and the historical financial statements and notes thereto included elsewhere in this prospectus.
As of September 30, 2025 (Unaudited) | ||||||||||||||
| Actual | As Adjusted for this Offering | |||||||||||||
Cash and cash equivalents | $ | 22,283 | $ | 19,909 | ||||||||||
Debt | ||||||||||||||
Credit facilities payable | $ | 73,354 | $ | 35,354 | ||||||||||
Notes offered hereby | — | 40,000 | ||||||||||||
Total Debt | $ | 73,354 | $ | 75,354 | ||||||||||
Equity | ||||||||||||||
Common stock, par value $0.001 per share; as of September 30, 2025, 150,000,000 shares authorized, 12,786,792 shares issued and outstanding,actual and as adjusted | $ | 13 | $ | 13 | ||||||||||
Warrants | 1,426 | 1,426 | ||||||||||||
Additional Paid-in Capital | 177,099 | 177,099 | ||||||||||||
Retained Earnings | (80,590) | (80,590) | ||||||||||||
Accumulated Other Comprehensive Income (Loss) | 33,295 | 33,295 | ||||||||||||
Total Equity | $ | 131,243 | $ | 131,243 | ||||||||||
Total Capitalization | $ | 226,880 | $ | 226,506 | ||||||||||
42
UNAUDITED PRO FORMA CONDENSED COMBINED FINANCIAL STATEMENTS
The following unaudited pro forma condensed consolidated financial information has been derived from and should be read in conjunction with the historical consolidated financial statements and the related notes of Mount Logan, Legacy MLC and 180 Degree Capital, which are included elsewhere in this Prospectus. See “Index to Financial Statements.”
180 Degree Capital and Legacy MLC performed an analysis of the various reorganization steps to effectuate the Business Combination between 180 Degree Capital and Legacy MLC including creation of Mount Logan. At the consummation of the Business Combination on September 12, 2025:
•180 Degree Capital became a wholly-owned subsidiary of Mount Logan through its merger with Polar Merger Sub, Inc., (“TURN Merger Sub”), in which 180 Degree Capital was the surviving business;
•Legacy MLC became a wholly-owned subsidiary of Mount Logan through its merger with Moose Merger Sub LLC (“MLC Merger Sub”), in which Legacy MLC was the surviving business; and
•180 Degree Capital and Legacy MLC become wholly-owned legal subsidiaries of Mount Logan.
While Mount Logan is the legal acquirer of Legacy MLC, for accounting purposes, the transaction was accounted for as a reverse acquisition with Legacy Mount Logan, a legal acquiree, as the accounting acquirer. This determination was based on the relative voting rights, board composition, and management of the combined company, as well as other relevant factors. Specifically, this determination was primarily based on the fact that, subsequent to the consummation of the transaction, former Legacy MLC equity holders had a majority of the voting rights of the combined company, former Legacy MLC equity holders have the ability to nominate a majority of the members of the board of directors of Mount Logan, and Legacy MLC senior management comprises the senior management roles of Mount Logan, including the roles of Chief Executive Officer, President and Chief Financial Officer, and are responsible for the day-to-day operations of Mount Logan. As such, Mount Logan, including 180 Degree Capital as a wholly-owned subsidiary of Mount Logan, is treated as the “acquired” company for accounting purposes.
Accordingly, for financial reporting purposes, the assets and liabilities of Legacy MLC are stated at historical carrying values and its consolidated financial statements are presented as the predecessor to the combined company in the historical financial statements. The assets and liabilities of 180 Degree Capital were recorded at their fair values measured as of the acquisition date. The results of 180 Degree Capital are presented within the consolidated results of Mount Logan from the date of acquisition going forward and include incurrence of $40.0 million of new senior notes due 2031.
The following unaudited pro forma consolidated financial statements give effect to the Business Combination and debt offering as follows:
•The historical audited consolidated statement of operations of 180 Degree Capital for the twelve months ended December 31, 2024, and historical unaudited interim consolidated statement of operations through the acquisition date have been, adjusted to conform to that of the historical consolidated statement of operations presentation of Legacy MLC on a pro forma basis assuming the business combination and related transactions had been consummated on January 1, 2024 (i.e., the beginning of the earliest period presented). Mount Logan did not have operations during the audit period of January 7, 2025 (inception) to February 7, 2025 or the unaudited interim period of January 7, 2025 (inception) to September 12, 2025.
•The unaudited pro forma condensed statement of financial position as of September 30, 2025 has been derived from the historical unaudited statement of financial position of Legacy MLC, which was determined to be the accounting acquirer and whose financial information was used through September 12, 2025. Per the terms of the reverse acquisition, Legacy MLC was the accounting acquirer. Accordingly, its assets and liabilities were stated at historical carrying values. 180 Degree Capital’s assets and liabilities were recorded at their fair values, as determined on the acquisition date, and are included in the financial results of the combined entity, ‘Mount Logan’ from September 12, 2025 through September 30, 2025.
43
The following unaudited pro forma condensed combined financial statements have been prepared using the audited financial statements of 180 Degree Capital for the year ended December 31, 2024, the audited financial statements of Legacy MLC for the year ended December 31, 2024, the audited financial statements of Mount Logan for the period from inception (January 7, 2025) to June 30, 2025, the unaudited interim condensed consolidated financial statements of Legacy MLC for the nine-month period ending September 30, 2025, and the unaudited financial statements and results of operations for 180 Degree Capital for the period from January 1, 2025 through September 12, 2025 have been derived from the accounting records maintained by 180 Degree Capital and prepared in accordance with U.S. GAAP.
The following unaudited pro forma condensed financial information has been prepared in accordance with Article 11 of Regulation S-X.
The following unaudited pro forma condensed consolidated financial information is presented for illustrative purposes only and does not necessarily indicate the results of operations or the combined financial position that would have resulted had the Business Combination and debt offering been completed at the beginning of the applicable period presented, nor the impact of expense efficiencies, asset dispositions, dividends and other factors. The unaudited financial information was prepared using accounting policies consistent with those applied by Mount Logan to the extent practicable. Certain reclassifications have been made to confirm 180 Degree Capital’s historical presentation to that of Mount Logan for purposes of the pro forma presentation.
44
UNAUDITED PRO FORMA CONDENSED COMBINED BALANCE SHEET
AS OF SEPTEMBER 30, 2025
(in thousands, except per share data)
| Mount Logan | Adjustments | Note 3 | Mount Logan | |||||||||||||||||||||||
| Assets | ||||||||||||||||||||||||||
| Asset Management: | ||||||||||||||||||||||||||
| Cash and cash equivalents | $ | 22,283 | (2,374) | (A), (C) | 19,909 | |||||||||||||||||||||
| Investments | 39,022 | 39,022 | ||||||||||||||||||||||||
| Intangible assets | 14,869 | 14,869 | ||||||||||||||||||||||||
| Other assets | 9,060 | 9,060 | ||||||||||||||||||||||||
| $ | 85,234 | $ | (2,374) | $ | 82,860 | |||||||||||||||||||||
| Insurance Solutions: | ||||||||||||||||||||||||||
| Cash and cash equivalents | 108,242 | 108,242 | ||||||||||||||||||||||||
| Restricted Cash | 9,967 | 9,967 | ||||||||||||||||||||||||
| Investments | 923,981 | 923,981 | ||||||||||||||||||||||||
Derivatives | 45 | 45 | ||||||||||||||||||||||||
| Assets of consolidated variable interest entities | — | |||||||||||||||||||||||||
| Cash and cash equivalents | 21,323 | 21,323 | ||||||||||||||||||||||||
| Investments | 130,061 | 130,061 | ||||||||||||||||||||||||
| Other assets | 529 | 529 | ||||||||||||||||||||||||
| Reinsurance recoverable | 272,181 | 272,181 | ||||||||||||||||||||||||
| Intangible assets | 2,444 | 2,444 | ||||||||||||||||||||||||
| Deferred acquisition costs | 7,528 | 7,528 | ||||||||||||||||||||||||
| Goodwill | 55,697 | 55,697 | ||||||||||||||||||||||||
| Other assets | 23,954 | 23,954 | ||||||||||||||||||||||||
| $ | 1,555,952 | $ | 1,555,952 | |||||||||||||||||||||||
Total assets | $ | 1,641,186 | $ | (2,374) | $ | 1,638,812 | ||||||||||||||||||||
| Liabilities | ||||||||||||||||||||||||||
| Asset Management: | — | |||||||||||||||||||||||||
| Due to related parties | 8,289 | 8,289 | ||||||||||||||||||||||||
| Debt obligations | 73,354 | — | (A) | 73,354 | ||||||||||||||||||||||
| Accrued expenses and other liabilities | 6,453 | (2,374) | (C) | 4,079 | ||||||||||||||||||||||
| Post retirement plan liabilities | ||||||||||||||||||||||||||
| $ | 88,096 | $ | (2,374) | $ | 85,722 | |||||||||||||||||||||
| Insurance: | ||||||||||||||||||||||||||
| Future policy benefits | 786,839 | 786,839 | ||||||||||||||||||||||||
| Interest sensitive contract liabilities | 363,250 | 363,250 | ||||||||||||||||||||||||
| Funds held under reinsurance contracts | 243,616 | 243,616 | ||||||||||||||||||||||||
| Debt obligations | 17,250 | 17,250 | ||||||||||||||||||||||||
| Derivatives | — | — | ||||||||||||||||||||||||
| Accrued expenses and other liabilities | 10,892 | 10,892 | ||||||||||||||||||||||||
| 1,421,847 | 1,421,847 | |||||||||||||||||||||||||
Total liabilities | $ | 1,509,943 | $ | (2,374) | $ | 1,507,569 | ||||||||||||||||||||
| Shareholders' Equity | ||||||||||||||||||||||||||
| Common Shares / Stock | 13 | 13 | ||||||||||||||||||||||||
| Warrants | 1,426 | 1,426 | ||||||||||||||||||||||||
| Additional Paid-In Capital | 177,099 | 177,099 | ||||||||||||||||||||||||
| Retained Earnings | (80,590) | (80,590) | ||||||||||||||||||||||||
| Total distributable earnings (loss) | — | — | ||||||||||||||||||||||||
| Accumulated Other Comprehensive Income (Loss) ("AOCI") | 33,295 | 33,295 | ||||||||||||||||||||||||
| Total equity | $ | 131,243 | $ | — | $ | 131,243 | ||||||||||||||||||||
| Total liabilities and equity | 1,641,186 | $ | (2,374) | $ | 1,638,812 | |||||||||||||||||||||
45
UNAUDITED PRO FORMA CONDENSED COMBINED STATEMENT OF OPERATIONS
FOR THE NINE MONTHS ENDED SEPTEMBER 30, 2025
(in thousands, except per share data)
| Historical | Pro Forma | |||||||||||||||||||||||||||||||||||||||||||
Legacy MLC | 180 Degree Capital | Reclassification Adjustments | Note 2 | Adjustments | Note 3 | Mount Logan | ||||||||||||||||||||||||||||||||||||||
| Asset Management: | ||||||||||||||||||||||||||||||||||||||||||||
| Management Fee | $ | 7,900 | $ | — | $ | 7,900 | ||||||||||||||||||||||||||||||||||||||
| Incentive fees | 1,208 | — | 1,208 | |||||||||||||||||||||||||||||||||||||||||
| Equity investment earning | 805 | — | 805 | |||||||||||||||||||||||||||||||||||||||||
| Other Revenue | 142 | (a) | 142 | |||||||||||||||||||||||||||||||||||||||||
| $ | 9,913 | $ | 142 | $ | — | $ | 10,055 | |||||||||||||||||||||||||||||||||||||
| Insurance Solutions: | ||||||||||||||||||||||||||||||||||||||||||||
| Net Premiums | (12,743) | — | (12,743) | |||||||||||||||||||||||||||||||||||||||||
| Insurance revenue | 1,766 | — | 1,766 | |||||||||||||||||||||||||||||||||||||||||
| Net investment income | 48,621 | — | 48,621 | |||||||||||||||||||||||||||||||||||||||||
| Net gains (losses) from investment activities | 9,085 | — | 9,085 | |||||||||||||||||||||||||||||||||||||||||
| Net revenues of consolidated variable interest entities | 9,979 | — | 9,979 | |||||||||||||||||||||||||||||||||||||||||
| Net gains (losses) on funds withheld | (23,232) | — | (23,232) | |||||||||||||||||||||||||||||||||||||||||
| Other income | 230 | — | 230 | |||||||||||||||||||||||||||||||||||||||||
| 33,706 | — | — | 33,706 | |||||||||||||||||||||||||||||||||||||||||
Total Revenue | 43,619 | 142 | — | $ | 43,761 | |||||||||||||||||||||||||||||||||||||||
| Investment Company Reporting Income | ||||||||||||||||||||||||||||||||||||||||||||
| Board Fees-Cash | $ | 49 | $ | (49) | (a) | $ | — | $ | — | |||||||||||||||||||||||||||||||||||
| Board Fees-Stock Grant | 93 | (93) | (a) | — | — | |||||||||||||||||||||||||||||||||||||||
| Dividend Income | 110 | (110) | (b) | — | — | |||||||||||||||||||||||||||||||||||||||
| Interest-Unaffiliated money market fund securities | 280 | (280) | (c) | — | — | |||||||||||||||||||||||||||||||||||||||
Total Investment Company Reporting Income | 532 | (532) | (a) (b) (c) | — | ||||||||||||||||||||||||||||||||||||||||
| Expenses | ||||||||||||||||||||||||||||||||||||||||||||
| Asset Management: | ||||||||||||||||||||||||||||||||||||||||||||
| Administration and servicing fees | 4,613 | — | — | — | 4,613 | |||||||||||||||||||||||||||||||||||||||
| Transaction costs | 10,483 | — | — | (10,234) | (C) | 249 | ||||||||||||||||||||||||||||||||||||||
| Amortization and impairment of intangible assets | 8,377 | — | — | — | 8,377 | |||||||||||||||||||||||||||||||||||||||
| Interest and other credit facility expenses | 11,071 | — | — | (975) | (B) | 10,096 | ||||||||||||||||||||||||||||||||||||||
| General, administrative and other | 5,876 | — | 6,160 | (d) | $ | (5,014) | (C) | 7,022 | ||||||||||||||||||||||||||||||||||||
| Compensation and Benefits | 5,961 | 1,507 | 7,468 | |||||||||||||||||||||||||||||||||||||||||
| Administration and operations | — | 235 | (235) | (d) | — | — | ||||||||||||||||||||||||||||||||||||||
| Professional fees | — | 5,196 | (5,196) | (d) | — | — | ||||||||||||||||||||||||||||||||||||||
| Rent | — | 30 | (30) | (d) | — | — | ||||||||||||||||||||||||||||||||||||||
| Insurance expense | — | 346 | (346) | (d) | — | — | ||||||||||||||||||||||||||||||||||||||
| Directors' fees and expenses | — | 184 | (184) | (d) | — | — | ||||||||||||||||||||||||||||||||||||||
| Custody fees | — | 14 | (14) | (d) | — | — | ||||||||||||||||||||||||||||||||||||||
| Software | — | 152 | (152) | (d) | — | — | ||||||||||||||||||||||||||||||||||||||
| Other | — | 4 | (4) | (d) | — | — | ||||||||||||||||||||||||||||||||||||||
| $ | 46,381 | $ | 7,668 | $ | — | $ | (16,223) | $ | 54,049 | |||||||||||||||||||||||||||||||||||
| Insurance: | — | |||||||||||||||||||||||||||||||||||||||||||
| Net policy benefits and claims | (1,389) | — | — | $ | (1,389) | |||||||||||||||||||||||||||||||||||||||
| Interest sensitive contract benefits | 11,969 | — | — | 11,969 | ||||||||||||||||||||||||||||||||||||||||
| Amortization of deferred acquisition costs | 2,389 | — | — | 2,389 | ||||||||||||||||||||||||||||||||||||||||
| Compensation and benefits | 540 | — | — | 540 | ||||||||||||||||||||||||||||||||||||||||
| Interest expense | 1,143 | — | — | 1,143 | ||||||||||||||||||||||||||||||||||||||||
| General, administrative and other | 10,294 | — | — | 10,294 | ||||||||||||||||||||||||||||||||||||||||
| 24,946 | 24,946 | |||||||||||||||||||||||||||||||||||||||||||
Total Expenses | $ | 71,327 | $ | 7,668 | $ | — | $ | (16,223) | $ | 78,995 | ||||||||||||||||||||||||||||||||||
46
UNAUDITED PRO FORMA CONDENSED COMBINED STATEMENT OF OPERATIONS
FOR THE NINE MONTHS ENDED SEPTEMBER 30, 2025
(in thousands, except per share data)
| Historical | Pro Forma | |||||||||||||||||||||||||||||||||||||||||||
Legacy MLC | 180 Degree Capital | Reclassification Adjustments | Note 2 | Adjustments | Note 3 | Mount Logan | ||||||||||||||||||||||||||||||||||||||
| Net gains (losses) from investment activities | 3,050 | — | 11,554 | (f)(g) | — | 14,604 | ||||||||||||||||||||||||||||||||||||||
| Dividend income | 89 | — | 110 | (b) | — | 199 | ||||||||||||||||||||||||||||||||||||||
| Interest income | 814 | — | 280 | (c) | — | 1,094 | ||||||||||||||||||||||||||||||||||||||
| Other income (loss), net | 556 | — | — | 556 | ||||||||||||||||||||||||||||||||||||||||
Gain on acquisition | $ | 4,457 | — | — | (4,457) | (D) | $ | — | ||||||||||||||||||||||||||||||||||||
Total Investment Income (Loss) | $ | 8,966 | $ | — | $ | 11,944 | (g) | $ | (4,457) | $ | 16,453 | |||||||||||||||||||||||||||||||||
Income (Loss) Before Taxes | $ | (18,742) | $ | (7,136) | $ | 11,554 | (g) | $ | 11,766 | $ | (2,558) | |||||||||||||||||||||||||||||||||
Income Tax (expense) benefit | (2,333) | — | — | — | (2,333) | |||||||||||||||||||||||||||||||||||||||
Net income (loss) | $ | (21,075) | $ | (7,136) | $ | 11,554 | (g) | $ | 11,766 | $ | (4,891) | |||||||||||||||||||||||||||||||||
| Earnings Per Share | ||||||||||||||||||||||||||||||||||||||||||||
| Basic | $ | (2.93) | $ | — | (E) | $ | (0.38) | |||||||||||||||||||||||||||||||||||||
| Diluted | (2.93) | — | (E) | (0.38) | ||||||||||||||||||||||||||||||||||||||||
| Weighted Average Shares of Common Shares Outstanding | ||||||||||||||||||||||||||||||||||||||||||||
| Basic | 7,185,669 | — | 5,814,331 | (E) | 13,000,000 | |||||||||||||||||||||||||||||||||||||||
| Diluted | 7,185,669 | — | 5,814,331 | (E) | 13,000,000 | |||||||||||||||||||||||||||||||||||||||
| Other comprehensive income (loss): | ||||||||||||||||||||||||||||||||||||||||||||
| Other comprehensive income (loss), before tax: | — | |||||||||||||||||||||||||||||||||||||||||||
| Unrealized investment gains (losses) on available-for-sale securities | 6,184 | — | — | 6,184 | ||||||||||||||||||||||||||||||||||||||||
| Unrealized gains (losses) on hedging instruments | 5,237 | — | — | 5,237 | ||||||||||||||||||||||||||||||||||||||||
| Remeasurement gains (losses) on future policy benefits related to discount rate | (15,167) | — | — | (15,167) | ||||||||||||||||||||||||||||||||||||||||
Other comprehensive income (loss), before tax | $ | (3,746) | $ | — | $ | — | $ | (3,746) | ||||||||||||||||||||||||||||||||||||
Income tax expense (benefit) related to other comprehensive income (loss) | $ | — | $ | — | $ | — | $ | — | ||||||||||||||||||||||||||||||||||||
Other comprehensive income (loss) | $ | (3,746) | $ | — | $ | — | $ | (3,746) | ||||||||||||||||||||||||||||||||||||
Comprehensive income (loss) | $ | (24,821) | $ | — | $ | — | $ | (24,821) | ||||||||||||||||||||||||||||||||||||
| Net realized (loss) gain from investments: | ||||||||||||||||||||||||||||||||||||||||||||
| Unaffiliated privately held companies | $ | 100 | $ | (100) | (e) | $ | — | $ | — | |||||||||||||||||||||||||||||||||||
| Unaffiliated publicly traded securities | 11,741 | (11,741) | (e) | — | — | |||||||||||||||||||||||||||||||||||||||
| Non-controlled affiliated privately held securities | (4,397) | 4,397 | (e) | — | — | |||||||||||||||||||||||||||||||||||||||
| Unaffiliated rights | $ | — | $ | — | (e) | $ | — | $ | — | |||||||||||||||||||||||||||||||||||
Net realized loss from investments | 7,444 | (7,444) | — | |||||||||||||||||||||||||||||||||||||||||
| Change in unrealized appreciation (depreciation) on investments: | ||||||||||||||||||||||||||||||||||||||||||||
| Unaffiliated privately held companies | $ | (100) | $ | 100 | (f) | $ | — | $ | — | |||||||||||||||||||||||||||||||||||
| Unaffiliated publicly traded securities | 2,739 | (2,739) | (f) | — | — | |||||||||||||||||||||||||||||||||||||||
| Non-controlled affiliated publicly traded securities | (3,227) | 3,227 | (f) | — | — | |||||||||||||||||||||||||||||||||||||||
| Unaffiliated rights to payments | 2 | (2) | (f) | — | — | |||||||||||||||||||||||||||||||||||||||
Net change in unrealized appreciation on investments | $ | 4,110 | $ | (4,110) | $ | — | $ | — | ||||||||||||||||||||||||||||||||||||
Net realized loss and change in unrealized appreciation on investments | $ | 11,554 | $ | (11,554) | $ | — | $ | — | ||||||||||||||||||||||||||||||||||||
Net decrease in net assets resulting from operations | $ | — | $ | 4,420 | $ | (4,420) | (h) | $ | — | $ | — | |||||||||||||||||||||||||||||||||
47
| UNAUDITED PRO FORMA CONDENSED COMBINED STATEMENT OF OPERATIONS FOR THE TWELVE MONTHS ENDED DECEMBER 31, 2024 (in thousands, except per share data) | ||||||||||||||||||||||||||||||||||||||||||||||||||
| Historical | Pro Forma | |||||||||||||||||||||||||||||||||||||||||||||||||
Mount Logan | Legacy Mount Logan | 180 Degree Capital | Reclassification Adjustments | Note 2 | Adjustments | Note 3 | Mount Logan | |||||||||||||||||||||||||||||||||||||||||||
| Revenue | ||||||||||||||||||||||||||||||||||||||||||||||||||
| Asset Management: | ||||||||||||||||||||||||||||||||||||||||||||||||||
| Management Fee | $ | — | $ | 11,131 | $ | — | $ | — | $ | 11,131 | ||||||||||||||||||||||||||||||||||||||||
| Incentive fees | — | 3,198 | — | — | 3,198 | |||||||||||||||||||||||||||||||||||||||||||||
| Equity investment earning | — | 680 | — | — | 680 | |||||||||||||||||||||||||||||||||||||||||||||
| Other Revenue | — | — | 142 | (a) | 142 | |||||||||||||||||||||||||||||||||||||||||||||
| — | 15,009 | — | 142 | — | 15,151 | |||||||||||||||||||||||||||||||||||||||||||||
| Insurance Solutions: | ||||||||||||||||||||||||||||||||||||||||||||||||||
| Net Premiums | $ | — | (15,479) | $ | — | $ | — | $ | (15,479) | |||||||||||||||||||||||||||||||||||||||||
| Insurance revenue | $ | — | 266 | $ | — | $ | — | 266 | ||||||||||||||||||||||||||||||||||||||||||
| Net investment income | — | 74,638 | — | — | 74,638 | |||||||||||||||||||||||||||||||||||||||||||||
| Net gains (losses) from investment activities | — | (8,211) | — | — | (8,211) | |||||||||||||||||||||||||||||||||||||||||||||
| Net revenues of consolidated variable interest entities | — | 15,082 | — | — | 15,082 | |||||||||||||||||||||||||||||||||||||||||||||
| Net gains (losses) on funds withheld | — | (32,056) | — | — | (32,056) | |||||||||||||||||||||||||||||||||||||||||||||
| Other income | — | 541 | — | — | 541 | |||||||||||||||||||||||||||||||||||||||||||||
| — | 34,781 | — | — | — | 34,781 | |||||||||||||||||||||||||||||||||||||||||||||
| Total Revenue | $ | — | 49,790 | $ | — | $ | 142 | $ | — | $ | 49,932 | |||||||||||||||||||||||||||||||||||||||
| Investment Company Reporting Income | ||||||||||||||||||||||||||||||||||||||||||||||||||
| Board Fees-Cash | $ | — | — | $ | 65 | $ | (65) | (a) | $ | — | ||||||||||||||||||||||||||||||||||||||||
| Board Fees-Stock Grant | — | — | 77 | (77) | (a) | — | ||||||||||||||||||||||||||||||||||||||||||||
| Interest-Unaffiliated money market fund securities | — | — | 53 | (53) | (c) | — | ||||||||||||||||||||||||||||||||||||||||||||
| Total Investment Company Reporting Income | $ | — | $ | — | $ | 195 | $ | (195) | (a) (c) | $ | — | $ | — | |||||||||||||||||||||||||||||||||||||
| Expenses | ||||||||||||||||||||||||||||||||||||||||||||||||||
| Asset Management: | ||||||||||||||||||||||||||||||||||||||||||||||||||
| Administration and servicing fees | $ | — | $ | 5,895 | $ | — | $ | — | $ | 5,895 | ||||||||||||||||||||||||||||||||||||||||
| Transaction costs | — | 2,174 | — | — | (1,024) | (C) | 1,150 | |||||||||||||||||||||||||||||||||||||||||||
| Amortization and impairment of intangible assets | — | 3,582 | — | — | 3,582 | |||||||||||||||||||||||||||||||||||||||||||||
| Interest and other credit facility expenses | — | 7,001 | — | — | (401) | (B) | 6,600 | |||||||||||||||||||||||||||||||||||||||||||
| General, administrative and other | — | 6,480 | — | 2,280 | (d) | (738) | (C) | 8,022 | ||||||||||||||||||||||||||||||||||||||||||
| Compensation and Benefits | — | 8,412 | 1,933 | 10,345 | ||||||||||||||||||||||||||||||||||||||||||||||
| Administration and operations | — | — | 274 | (274) | (d) | — | ||||||||||||||||||||||||||||||||||||||||||||
| Professional fees | — | — | 1,345 | (1,345) | (d) | — | ||||||||||||||||||||||||||||||||||||||||||||
| Rent | — | — | 39 | (39) | (d) | — | ||||||||||||||||||||||||||||||||||||||||||||
| Insurance expense | — | — | 201 | (201) | (d) | — | ||||||||||||||||||||||||||||||||||||||||||||
| Directors' fees and expenses | — | — | 232 | (232) | (d) | — | ||||||||||||||||||||||||||||||||||||||||||||
| Custody fees | — | — | 29 | (29) | (d) | — | ||||||||||||||||||||||||||||||||||||||||||||
| Software | — | — | 155 | (155) | (d) | — | ||||||||||||||||||||||||||||||||||||||||||||
| Other | — | — | 6 | (6) | (d) | — | ||||||||||||||||||||||||||||||||||||||||||||
| — | 33,544 | 4,214 | — | (2,163) | 35,595 | |||||||||||||||||||||||||||||||||||||||||||||
| Insurance: | ||||||||||||||||||||||||||||||||||||||||||||||||||
48
| UNAUDITED PRO FORMA CONDENSED COMBINED STATEMENT OF OPERATIONS FOR THE TWELVE MONTHS ENDED DECEMBER 31, 2024 (in thousands, except per share data) | ||||||||||||||||||||||||||||||||||||||||||||||||||
| Historical | Pro Forma | |||||||||||||||||||||||||||||||||||||||||||||||||
Mount Logan | Legacy Mount Logan | 180 Degree Capital | Reclassification Adjustments | Note 2 | Adjustments | Note 3 | Mount Logan | |||||||||||||||||||||||||||||||||||||||||||
| Net policy benefits and claims | $ | — | $ | (10,091) | $ | — | $ | — | $ | (10,091) | ||||||||||||||||||||||||||||||||||||||||
| Interest sensitive contract benefits | — | 14,972 | — | — | 14,972 | |||||||||||||||||||||||||||||||||||||||||||||
| Amortization of deferred acquisition costs | — | 2,175 | — | — | 2,175 | |||||||||||||||||||||||||||||||||||||||||||||
| Compensation and benefits | 1,367 | — | — | 1,367 | ||||||||||||||||||||||||||||||||||||||||||||||
| Interest expense | 1,313 | — | — | 1,313 | ||||||||||||||||||||||||||||||||||||||||||||||
| General, administrative and other | — | 16,276 | — | — | 16,276 | |||||||||||||||||||||||||||||||||||||||||||||
| — | 26,012 | 26,012 | ||||||||||||||||||||||||||||||||||||||||||||||||
| Total Expenses | $ | — | $ | 59,556 | $ | 4,214 | $ | — | $ | (2,163) | $ | 61,607 | ||||||||||||||||||||||||||||||||||||||
| Net gains (losses) from investment activities | — | (1,531) | — | 154 | (e)(f) | (1,377) | ||||||||||||||||||||||||||||||||||||||||||||
| Dividend income | — | 356 | — | — | 356 | |||||||||||||||||||||||||||||||||||||||||||||
| Interest income | — | 1,091 | — | 53 | (c) | 1,144 | ||||||||||||||||||||||||||||||||||||||||||||
| Other income (loss), net | $ | — | $ | 69 | $ | — | $ | — | (c) | $ | 69 | |||||||||||||||||||||||||||||||||||||||
| Total Investment Income (Loss) | $ | — | $ | (15) | $ | — | $ | 207 | (g) | $ | — | $ | 192 | |||||||||||||||||||||||||||||||||||||
| Income (Loss) / Net investment (Loss) for Investment Company Reporting Before Taxes | $ | — | $ | (9,781) | $ | (4,019) | $ | 154 | (g) | $ | 2,163 | $ | (11,483) | |||||||||||||||||||||||||||||||||||||
| Income Tax (expense) benefit | $ | — | $ | (606) | $ | — | $ | — | $ | — | $ | (606) | ||||||||||||||||||||||||||||||||||||||
| Net income (loss) / Net investment (Loss) for Investment Company Reporting | $ | — | $ | (10,387) | $ | (4,019) | $ | 154 | (g) | 2,163 | $ | (12,089) | ||||||||||||||||||||||||||||||||||||||
| Earnings Per Share | ||||||||||||||||||||||||||||||||||||||||||||||||||
| Basic | — | (0.40) | — | (E) | (0.93) | |||||||||||||||||||||||||||||||||||||||||||||
| Diluted | — | (0.40) | — | (E) | (0.93) | |||||||||||||||||||||||||||||||||||||||||||||
| Weighted Average Shares of Common Shares Outstanding | — | — | ||||||||||||||||||||||||||||||||||||||||||||||||
| Basic | — | 25,809,370 | — | (12,809,370) | (E) | 13,000,000 | ||||||||||||||||||||||||||||||||||||||||||||
| Diluted | — | 25,809,370 | — | (12,809,370) | (E) | 13,000,000 | ||||||||||||||||||||||||||||||||||||||||||||
| Other comprehensive income (loss): | ||||||||||||||||||||||||||||||||||||||||||||||||||
| Other comprehensive income (loss), before tax: | $ | — | $ | — | ||||||||||||||||||||||||||||||||||||||||||||||
| Unrealized investment gains (losses) on available-for-sale securities | — | 8 | — | — | 8 | |||||||||||||||||||||||||||||||||||||||||||||
| Unrealized gains (losses) on hedging instruments | (5) | — | — | (5) | ||||||||||||||||||||||||||||||||||||||||||||||
| Remeasurement gains (losses) on future policy benefits related to discount rate | 8 | — | — | 8 | ||||||||||||||||||||||||||||||||||||||||||||||
| Other comprehensive income (loss), before tax | — | 10 | — | — | 10 | |||||||||||||||||||||||||||||||||||||||||||||
| Income tax expense (benefit) related to other comprehensive income (loss) | $ | — | $ | — | $ | — | $ | — | $ | — | ||||||||||||||||||||||||||||||||||||||||
49
| UNAUDITED PRO FORMA CONDENSED COMBINED STATEMENT OF OPERATIONS FOR THE TWELVE MONTHS ENDED DECEMBER 31, 2024 (in thousands, except per share data) | ||||||||||||||||||||||||||||||||||||||||||||||||||
| Historical | Pro Forma | |||||||||||||||||||||||||||||||||||||||||||||||||
Mount Logan | Legacy Mount Logan | 180 Degree Capital | Reclassification Adjustments | Note 2 | Adjustments | Note 3 | Mount Logan | |||||||||||||||||||||||||||||||||||||||||||
| Other comprehensive income (loss) | $ | — | $ | 10 | $ | — | $ | — | $ | 10 | ||||||||||||||||||||||||||||||||||||||||
| Comprehensive income (loss) | $ | — | $ | (432) | $ | — | $ | — | $ | (432) | ||||||||||||||||||||||||||||||||||||||||
| Net realized (loss) gain from investments: | ||||||||||||||||||||||||||||||||||||||||||||||||||
| Unaffiliated privately held companies | $ | — | $ | — | $ | (809) | $ | 809 | (e) | $ | — | |||||||||||||||||||||||||||||||||||||||
| Unaffiliated publicly traded securities | — | — | (3,002) | 3,002 | (e) | — | ||||||||||||||||||||||||||||||||||||||||||||
| Non-controlled affiliated publicly traded securities | — | — | (22) | 22 | (e) | — | ||||||||||||||||||||||||||||||||||||||||||||
| Unaffiliated rights | — | — | 162 | (162) | (e) | — | ||||||||||||||||||||||||||||||||||||||||||||
| Net realized loss from investments | $ | — | $ | — | $ | (3,671) | $ | 3,671 | $ | — | ||||||||||||||||||||||||||||||||||||||||
| Change in unrealized appreciation (depreciation) on investments: | ||||||||||||||||||||||||||||||||||||||||||||||||||
| Unaffiliated privately held companies | $ | — | $ | — | $ | 749 | $ | (749) | (f) | $ | — | |||||||||||||||||||||||||||||||||||||||
| Unaffiliated publicly traded securities | — | — | 4,723 | (4,723) | (f) | — | ||||||||||||||||||||||||||||||||||||||||||||
| Non-controlled affiliated privately held companies | — | — | (126) | 126 | (f) | — | ||||||||||||||||||||||||||||||||||||||||||||
| Non-controlled affiliated publicly traded securities | — | — | (1,386) | 1,386 | (f) | — | ||||||||||||||||||||||||||||||||||||||||||||
| Unaffiliated rights to payments | — | — | (136) | 136 | (f) | — | ||||||||||||||||||||||||||||||||||||||||||||
| Net change in unrealized appreciation on investments | $ | — | $ | — | $ | 3,824 | $ | (3,824) | $ | — | ||||||||||||||||||||||||||||||||||||||||
| Net realized loss and change in unrealized appreciation on investments | $ | — | $ | — | $ | 153 | $ | (153) | $ | — | ||||||||||||||||||||||||||||||||||||||||
| Net decrease in net assets resulting from operations | $ | — | $ | — | $ | (3,866) | $ | 3,866 | (h) | $ | — | |||||||||||||||||||||||||||||||||||||||
50
NOTES TO UNAUDITED PRO FORMA CONDENSED COMBINED FINANCIAL INFORMATION
(all amounts are in thousands)
Note 1 - Basis of Pro Forma Presentation
The accompanying unaudited pro forma condensed combined financial information (the “Pro Forma Financial Statements”) has been prepared in accordance with Article 11 of Regulation S-X. The Pro Forma Financial Statements present the historical consolidated financial statements of Mount Logan, Legacy MLC and 180 Degree Capital as adjusted to give effect to:
•The completed Business Combination, which was completed on September 12, 2025; and
•The proposed offering of $40.0 million aggregate principal amount of Notes (the “Notes Offering”) and the application of the net proceeds therefrom.
If the aggregate principal amount of Notes offered is increased, our total indebtedness and debt service obligations will increase proportionally. We do not believe that any such increase would materially affect our financial condition or ability to service our debt.
The unaudited pro forma condensed combined balance sheet as of September 30, 2025 have been derived from the historical consolidated financial statements of Mount Logan, giving effect to the Notes Offering as if it had occurred on that date, The unaudited pro forma combined statements of operations for the year ended December 31, 2024 and the interim period ended September 30, 2025 give effect to the Business Combination and the Notes Offering as if each had occurred on January 1, 2024, and January 1, 2025 respectively.
The pro forma adjustments are based on currently available information and certain assumptions that management believes are reasonable under the circumstances. The pro forma adjustments are directly attributable to the transactions, factually supportable, and, with respect to the statements of operations, expected to have a continuing impact on the combined results.
The Pro Forma Financial Statements do not reflect any anticipated synergies, operating efficiencies, cost savings, or integration costs that may result from the Business Combination. Additionally, the Pro Forma Financial Statements do not purport to project the future operating results or financial position of the combined company and are not necessarily indicative of the results of operations or financial position that would have been achieved had the Business Combination and the Notes Offering been consummated on the dates indicated, nor are they necessarily indicative of Mount Logan’s future results of operations or financial position.
The purchase price allocation set forth in the September 30, 2025 Mount Logan Statement of Financial Position is preliminary and subject to change as additional information becomes available concerning the fair value of the assets acquired and liabilities assumed. Under U.S. GAAP, Mount Logan has up to one year from the closing of the Business Combination (the “measurement period”) to finalize the purchase price allocation. During this period, adjustments to the provisional amounts may be recorded, and such adjustments may be material.
The preliminary purchase price allocation is subject to change due to several factors, including, but not limited to:
•changes in the estimated fair value of 180 Degree Capital’s assets acquired and liabilities assumed as of the Closing, which could result from changes in the fair values of its investment holdings and its post-retirement plan liabilities, and others; and
Note 2 - Reclassification Adjustments
The following reclassification adjustments have been made to conform 180 Degree Capital’s historical financial information to Legacy MLC’s financial statement presentation.
51
Unaudited Pro Forma Condensed Combined Statement of Operations for the periods ended December 31, 2024 and September 30, 2025.
(a)Represents the reclassification of fees received from the service of an employee of 180 Degree Capital on the board of directors of a portfolio company of 180 Degree Capital to Mount Logan’s Other revenue.
(b)Reflects the reclassification of 180 Degree Capital’s dividend income earned from investments to Mount Logan’s Investment income (Loss) - Asset Management.
(c)Reflects the reclassification of 180 Degree Capital’s interest income earned from securities of money market funds to Mount Logan’s Investment income (Loss) - Asset Management.
(d)Reflects the reclassification of 180 Degree Capital’s operating expenses that are reported in separate line items to Mount Logan’s General, administrative and other.
(e)Reflects the reclassification of 180 Degree Capital’s net realized (loss) gain from investments separated into categories based on type of investment and voting ownership to Mount Logan’s Net gains (losses) from investment activities.
(f)Reflects the reclassification of 180 Degree Capital’s reporting of Unrealized appreciation (depreciation) on investments separated into categories based on type of investment and voting ownership to Mount Logan’s Net gains (losses) from investment activities.
(g)Reflects the reclassification of 180 Degree Capital’s reporting of Total investment income (loss) before and after taxes to Mount Logan’s Net income before and after taxes.
(h)As a Closed-Ended Fund (“CEF”), 180 Degree Capital reports net decrease in net assets resulting from operations on its consolidated statement of operations. Mount Logan is not a CEF, and therefore this line item will not be part of its consolidated statement of operations.
Note 3 - Pro Forma Adjustments
The pro forma adjustments and reclassifications included in the unaudited pro forma condensed combined financial statement information are as follows
Unaudited Pro Forma Condensed Combined Statement of Financial Position as at September 30, 2025.
A.Reflects the issuance of $40.0 million of Notes by Mount Logan. The adjustment records the gross proceeds from the issuance, net of estimated debt issuance costs of approximately $2.0 million, as if the transaction had occurred on September 30, 2025. The proceeds are assumed to have been used to (i) repay certain existing indebtedness of Mount Logan totaling $38.0 million and (ii) remain on balance sheet for general corporate purposes.
Unaudited Pro Forma Condensed Combined Statement of Operations for the periods ended December 31, 2024 and September 30, 2025.
B.Reflects Interest expense adjustments for the year ended December 31, 2024 and the nine months ended September 30, 2025 calculated based on an assumed annual interest rate of 7.75% applied to $40.0 million of new debt, including amortization of $0.4 million of deferred issuance costs for the twelve months ended December 31, 2024 and $0.3 million for the nine months ended September 30, 2025, as if such debt had been outstanding for the respective periods and historical debt had been repaid upon issuance. Debt issuance costs have been amortized over the expected term of the Notes using the effective interest method.
C.Reflects the removal of transaction costs accrued and incurred that are directly attributable to the acquisition of 180 Degree Capital and the related formation of Mount Logan. These costs consist primarily of legal, accounting and due diligence costs that are non-recurring in nature.
52
D.Reflects the removal of the gain on acquisition of 180 Degree Capital, as this gain is one-time in nature and non-recurring.
E.Earnings per share has been recast assuming the total amount of shares outstanding equal the amount of shares issued as part of the Business Combination. This adjustment reflects the net change in number of shares outstanding for the calculation of earnings per share (basic and diluted) for the nine month period ending September 30, 2025 and the year ended December 31, 2024.
53
DESCRIPTION OF BUSINESS
Overview
Formed in 2018, we are a publicly traded, alternative asset management and insurance solutions company that is focused on public and private debt securities in the North American market and the reinsurance of annuity products, primarily through our wholly-owned subsidiaries ML Management and Ability, respectively. We also actively source, evaluate, underwrite, manage, monitor and primarily invest in loans, debt securities, and other credit-oriented instruments that present attractive risk-adjusted returns and present low risk of principal impairment through the credit cycle. Our principal executive offices are located at 650 Madison Avenue, 3rd Floor, New York, NY 10022, and our telephone number is 212-891-2880.
On September 12, 2025, we completed the previously announced Business Combination through two simultaneous merger transactions pursuant to the Agreement and Plan of Merger. In the first merger, TURN Merger Sub merged with and into 180 Degree Capital, with 180 Degree Capital surviving as our wholly-owned subsidiary. In the second merger, MLC Merger Sub merged with and into Legacy MLC, with Legacy MLC surviving as our wholly-owned subsidiary. Following the completion of these merger transactions, we changed our name from “Yukon New Parent, Inc.” to “Mount Logan Capital Inc.” and became a publicly traded corporation.
Our Businesses
Asset Management
Our asset management segment focuses on private credit across senior secured lending, asset-based and specialty finance, structured and opportunistic credit, venture and growth lending, and select equity-linked solutions. We provide origination, underwriting, portfolio construction and risk management to a diversified client base, including insurance accounts, a BDC platform, our interval funds (SOFIX, ACIF), SMAs and other vehicles.
For these services, we generate recurring fee streams across a diversified set of credit investing strategies. After expenses, this fee stream constitutes Fee Related Earnings (“FRE”), our primary performance measure for the segment. We operate the platform integrated with our insurance solutions business, enabling collaboration on sourcing and asset allocation aligned to similarly-dated liabilities.
Our investment philosophy historically has been focused around well-established middle-market businesses that operate across a wide range of industries, while limiting concentration in any one industry. We employ fundamental credit analysis, targeting investments in businesses with relatively low levels of cyclicality and operating risk. We seek to provide a full credit cycle investment offering, with the ability to opportunistically allocate capital to fill the white space created as other capital sources retrench. As part of our opportunistic allocation of capital, we are able to underwrite complex, less competitive niches, and deploy capital during periods of uncertainty with a consistent emphasis on downside protection and preservation of capital. Many of our mandates utilize multi-year, permanent or semi-permanent capital, allowing us to invest patiently across the capital structure, scale AUM, and compound recurring FRE through cycles. As of September 30, 2025, we had total AUM of $2.1 billion.
We have experience managing levered vehicles, both public and private, and seek to enhance returns through the prudent use of leverage with a conservative approach that prioritizes downside protection and capital preservation. We believe this strategy and approach offers attractive risk-adjusted returns with lower volatility given the potential for fewer defaults and greater resilience through market cycles.
Permanent or Semi-Permanent Capital
Included within our investing strategies above is $1.4 billion of permanent or semi-permanent capital, out of the $2.1 billion of total AUM, as of September 30, 2025. As of September 30, 2025, permanent capital includes, without limitation, certain assets in our credit strategy, including assets relating to publicly traded and non-traded vehicles, and assets managed for certain of our Insurance Solutions clients, which have indefinite or long-term investment horizons, and in specific cases provide stable sources of funding while allowing for liquidity access for
54
investors through redemption mechanisms. We do not include non-closed ended funds, funds actively raising new capital, and funds in wind-down in our calculation of permanent or semi-permanent capital.
The amount of fees charged for managing these assets depends on the underlying investment strategy, vehicle being managed, liquidity profile, and, ultimately, our ability to generate returns for our clients. After expenses associated with generating fee-related revenues, we measure the resulting earnings stream’s “Fee Related Earnings” or “FRE”, which represents the primary performance measure for the Asset Management segment. FRE is the sum of all recurring fees underpinned by asset management activities including but not limited to: (i) management and servicing fees, (ii) interest income attributable to investment management activity, (iii) equity investment earnings related to fee generating vehicles, and (iv) fee-related performance fees from certain managed funds with indefinite terms, measured and received on a recurring basis and not dependent on realization events of the underlying investments, less (x) fee related compensation expense, excluding equity-based compensation, and (y) other associated operating expenses, which excludes growth investments into the retail distribution platform, amortization of acquisition-related intangible assets, interest and other credit facility expenses, foreign exchange-related gains and losses, and other non-recurring, nonmaterial items that are not required for the management of the underlying assets and investments.
Historically, we focused on strategic acquisitions and partnerships to expand our asset management capabilities, including but not limited to (i) the 2020 transaction alongside SCIM, whereby SCIM became the investment advisor to the Alternative Credit Income Fund (“ACIF”), (ii) the purchase of, and subsequent increase in, a minority stake in SCIM, which manages Portman Ridge Finance Corp. (“PTMN”), a closed-end, externally managed, non-diversified investment company that has elected to be treated as a Business Development Company (“BDC”) under the Investment Company Act of 1940, (iii) the 2021 acquisition of certain assets from Capitala Investment Advisors, LLC, whereby ML Management became the manager of Logan Ridge Finance Corp. (formerly Capitala Finance Corp.), also a BDC, and (iv) the transaction with Ovation Partners, LP, for the management of its alternative income platform, which included the transfer of employees to ML Management to support its specialty finance and asset-backed finance efforts across commercial lending, real estate lending, consumer finance, and litigation finance.
The Asset Management segment also holds minority equity interests in (i) Runway Growth Capital, LLC (“Runway”), which is a private credit, SEC-registered investment adviser managing $1.2 billion AUM with a specific orientation on providing growth capital to sponsored (i.e., venture-backed) and non-sponsored companies, and (ii) two Canadian alternative asset managers focused on investment grade, high yield, private credit, and asset-backed investment strategies. The minority investment in Runway Growth Capital was acquired during the first quarter of 2025 by Legacy MLC, but for purposes of this filing is not considered a significant investment in accordance with Rule 3-09 of Regulation S-X.
We are differentiated by the scale, depth, diversity, and investment performance of our funds and investment solutions. The diversity of our credit products and private market solutions demonstrates our focus on expanding and enhancing our capabilities, in support of investment performance on behalf of our investment clients. We believe the achievement of attractive risk-adjusted returns will continue to support growth in AUM and the recurring fee streams it earns across the vehicles it manages.
Insurance Solutions
We acquired Ability in the fourth quarter of 2021. Today, Ability is a Nebraska domiciled reinsurer of annuity products. Upon closing of the acquisition of Ability, ML Management entered into an investment management agreement with Ability (the “Ability IMA”) to manage certain of Ability’s assets that are within the scope of ML Management’s expertise in providing investment management advisory services (the assets of Ability managed by ML Management are referred to herein as the “Managed Ability Portfolio”). Ability then shifted the focus of our insurance business away from legacy insurance products, and reoriented around retirement solutions products, including multi-year guaranteed annuities (“MYGA”). Ability’s long-term goal is to build a platform that can both insure and reinsure a diverse set of competitive annuity and life insurance products.
55
Our acquisition of Ability combined two products that we believe are, and will continue to be, in high demand – insurance solutions and alternative asset management. We, through our acquisition of Ability, brought the insurance business additional capital to support growth, a stronger investment portfolio through ML Management’s repositioning of the portfolio, stability and continuity of liability management, and new growth opportunities that we believe will provide increased security to policyholders. The acquisition positioned us for a new stage of growth, as the stronger capital base and alignment allows us to scale asset and liability origination for the benefit of Ability’s policyholders as well as us and our shareholders.
We are focused on generating spread income, or Spread Related Earnings (“SRE”), within our Insurance Solutions segment for the benefit of policyholders, through (i) sourcing long-term liabilities and (ii) using the origination and investment capabilities of our Asset Management business to source or originate assets that fit Ability’s targeted risk and return characteristics. SRE represents the difference between actual earnings generated on the assets and investments made and the interest or crediting rate guaranteed to policyholders or participants. We view SRE as a critical measurement for assessing the profitability of the Insurance Solutions segment, as it excludes the impact of certain market volatility and other one-time, non-core components of income or loss. Rather than increasing allocations to higher risk securities to increase yields, or returns, on the assets invested, Ability and ML Management focus on proprietary origination of high-quality, predominantly senior secured loans and assets, which we believe reduces downside risk.
Our asset management expertise supports the sourcing and underwriting of assets for Ability’s portfolio. Ability is invested in a diverse array of high-grade fixed income assets including corporate bonds, structured securities and commercial real estate loans, as well as senior secured loans. Ability manages its interest rate risk through hedging activity to lower its overall net floating rate position. Ability also maintains holdings in less interest rate-sensitive investments, including CLOs, non-agency residential mortgage-backed securities (“RMBS”), and various types of structured products, consistent with its strategy of pursuing incremental yield by assuming liquidity and complexity risk, rather than assuming incremental credit risk.
Ability’s Products
Ability currently reinsures annuity products, consisting of MYGA, and is licensed in 42 states and the District of Columbia. we acquired Ability in the fourth quarter of 2021. As part of the transaction, we invested $10 million of capital into Ability to strengthen its balance sheet and launch a platform for the reinsurance of annuities. The reinsurance of annuity products commenced in the second quarter of 2022. Subsequently, we have contributed an incremental $21.6 million of capital and investments into Ability.
Annuities are a contract with an insurer where individuals agree to pay a certain amount of money, either in a lump sum or through installments, which entitles them to receive a series of payments at a future date. MYGA products are single premium deferred individual annuity contracts, providing consumers with an attractive, low-risk, predictable, and tax deferred investment option.
Effective April 1, 2022, we, through Ability, closed a reinsurance agreement with Atlantic Coast Life Insurance Company (“ACL”) pursuant to which Ability assumed a 20% quota share coinsurance of up to $150.0 million of premium of MYGA policies beginning January 1, 2021. Effective July 1, 2022, Ability closed on an additional reinsurance agreement with Sentinel Security Life Insurance Company (“SSL”) to assume a 20% quota share coinsurance of up to $100.0 million of premium of MYGA policies. These quota share coinsurance agreements were met as of July 10, 2023. On January 10, 2024, we, through Ability, amended the reinsurance agreements with ACL and with SSL, pursuant to which Ability would assume a 20% quota share coinsurance of premium of MYGA policies issued and approved on or after October 1, 2023. Ability elected to terminate the amended reinsurance agreements, effective June 30, 2024, to diversify and grow liability origination away from the initial counterparties, ACL and SSL. On March 31, 2025, Ability entered a new reinsurance treaty for additional MYGA with National Security Group (“NSG”), further diversifying its reinsurance partners.
To support growth in the insurance solutions segment, as of March 31, 2025, we have invested $31.6 million directly into Ability to provide the capital support required to enter into the previously mentioned
56
reinsurance agreements, as well as provide additional capital to evaluate new reinsurance opportunities as they are presented to Ability.
Ability has a runoff book of long-term care (“LTC”) business, which we classify as Ability’s legacy business. Ability has several reinsurance agreements to reinsure the long-term care portfolio's morbidity risk. Ability is no longer insuring new long-term care risk. The last LTC policy Ability wrote was in the early 2000’s, and thus, LTC has not been a core focus of the insurance business for multiple decades.
Reinsurance Channels
Ability is focused on reinsurance through quota-share agreements in the form or flow or block trades, as well as acquisitions, which supports Ability’s liability origination efforts across market environments. As Ability continues to grow, it remains disciplined in its evaluation of liabilities that are core to its strategy.
Capital
Ability believes it has a strong capital position and is well positioned to meet policyholder and other obligations, which it determines through various internal capital metrics tracked by management. The amount of capital required to support Ability’s core operating strategies is determined based on internal modeling and analysis of economic risk, as well as inputs from rating agency capital models and consideration of National Association of Insurance Commissioners (“NAIC”) risk-based capital (“RBC”) requirements. Capital in excess of this required amount is considered excess equity capital, which is available to deploy.
Ability’s Market Opportunity
Ability participates in a large U.S. market that it expects to grow in part due to several demographic trends. As measured by annual premiums written, annuities are the largest product line in the life and annuity sector. Annuities play an important role in retirement planning by providing individuals with stable, tax-efficient sources of income. In 2024, annuity premiums totaled $434.1 billion, up 13% year over year, accordingly to LIMRA’s U.S. Individual Annuity Sales survey, which represents 92% of the U.S. annuity market. The most common annuities are fixed and variable and may be written on an individual or group basis. The current products Ability reinsures are fixed annuities written on an individual basis.
There is an increasing demand for retirement solutions as a growing portion of the U.S. population is of retirement age and the retirement income needs of retirees are expected to increase. The number of people of retirement age has increased significantly since 2010, driven by the aging of the “Baby Boomer” generation. The U.S. population over 65 years old is forecast to grow from 57.8 million in 2022 to an estimated 78.3 million in the next 20 years, according to the U.S. Census Bureau, Population Estimates and Projections. This study also forecasted that the U.S. population aged over 65 years old is expected to grow by 44% from 2020 to 2040, while the total U.S. population is expected to grow by only 12%. Currently, 17.3% of the U.S. population is 65 or older, which is projected to rise to 22% by 2040, according to the ACL. The UN’s Population Statistics group has also forecasted that the global population aged 65 and over is expected to double from 0.8 billion to 1.6 billion, increasing from 10% to 17% of the total population, by mid-century. This demographics-driven demand has been further supported by a higher interest rate environment, which has enabled annuity providers to enhance their product offerings with more attractive crediting rates, strengthening the overall value proposition for consumers.
Annuities play an increasingly vital role in retirement planning, offering retirees stable, tax-efficient, and guaranteed income streams. In 2023, total fixed-rate deferred annuity sales reached $164.9 billion, representing a 46% increase over the previous record set in 2022. MYGA sales rose to $53 billion in 2023, up 48% year-over-year, according to LIMRA. The solid growth in MYGA demand has been a key driver of the overall expansion in the fixed annuity market. Ability’s current product focus is centered on individual MYGA offerings, where Ability sees continued opportunity for growth.
57
Growth Strategy
We are building a diversified alternative asset management and insurance solutions platform. With the completion of the Business Combination and our Nasdaq listing, we believe we have improved access to the capital markets, improved financing flexibility and stronger balance sheet to accelerate organic and inorganic growth initiatives. Our team’s priorities include (i) investing into Ability to support increased reinsurance flows to expand Ability’s liabilities and investment portfolio to generate positive SRE, primarily managed by our registered advisor, ML Management; (ii) scaling our private credit AUM across existing and future vehicles to increase FRE; and (iii) selective acquisitions and partnerships that broaden origination, diversify products, and enhance operating leverage. These initiatives are intended to reinforce shareholder value by compounding FRE and SRE via a capital flywheel. As assets under management increase, FRE rises, generating additional cash flow at the parent company. We can reinvest this cash into Ability to support new reinsurance treaties, which expand liabilities and invested assets. These assets generate SRE while also increasing AUM managed by Mount Logan, which in turn produces more FRE and cash flow to be re-deployed. We pursue this growth within a framework of disciplined underwriting, regulatory compliance, and capital management.
Asset Management
Our objective is to become a fully diversified private credit manager for institutional, retail and insurance clients. We are growing AUM in existing vehicles, new strategies, and through accretive acquisitions and partnerships that add capital and incremental origination channels. We intend to: (i) expand AUM in our existing vehicles; (ii) launch adjacent strategies that can scale through our distribution network; and (iii) pursue acquisitions or partnerships that add origination and recurring fees. These initiatives are supported by our permanent and semi-permanent capital base and our track record managing diverse investment vehicles. We are capitalizing on secular tailwinds as banks continue to re-trench and private credit fills the gap. We evaluate new vehicle launches, acquisitions and partnerships based on a number of factors including: (i) strategic fit (e.g. credit capability expansion, distribution); (ii) durability of capital (i.e. permanent or semi-permanent capital, what we refer to as "sticky AUM"); (iii) underwriting culture, risk controls, and unit economics (e.g., FRE uplift and margin accretion); and (iv) ease of integration into our operating model, as supported by our Staffing and Resource Agreement and Servicing Agreement with BCPA.
Insurance Solutions
We are scaling a capital-efficient insurance platform pairing long-dated, predictable liabilities with our private credit origination and underwriting capabilities. A strengthened balance sheet following our combination with 180 Degree Capital positions us to grow our insurance capabilities. Our objectives include:
Expand Multi-Year Guaranteed Annuity (“MYGA”) Reinsurance Through Diversified Channels: Our insurance solutions segment, through Ability, is initially focused on MYGA reinsurance, a product with fixed tenors, high predictability, and strong growth in the fixed annuity market. We intend to increase our cadence of quota-share flow treaties and opportunistic blocks with a broader set of counterparties, building on previously executed agreements. Any new reinsurance treaties we enter into will be filed with and approved by appropriate state insurance regulatory authorities before being executed.
Increase our Risk Based Capital (“RBC”) Ratios via Direct Investments from Mount Logan, Compounding SRE and Reinforcing the Asset Management “Flywheel”: Mount Logan as Parent can invest capital directly into Ability to support MYGA reinsurance and other insurance activities that we may pursue in the future. Through our asset management segment, we target attractive spread economics and active portfolio management to optimize Ability’s assets, while earning a management fee for performing these activities. The flywheel between asset management and insurance solutions is a key driver of the compounding growth of our business.
Broaden Product Set and Strengthen Distribution: Over time we plan to expand beyond MYGA into additional retirement and life protection solutions, including fixed indexed annuities and pre-need products, subject to market conditions and required regulatory approvals. We also plan to diversify distribution by adding new counterparties and pursuing block transactions. Over time, we may evaluate direct-writing opportunities to complement reinsurance channels. As scale increases across products and channels, we expect improved operating
58
leverage, more durable SRE, and continued discipline around asset-liability management, RBC ratios, and regulatory capital.
Competition
Asset Management
Competition is high in the asset management industry, and more specifically the alternative asset management space in which we primarily operates. We face competition from a large number of asset managers that focus on the management of public and private funds, as well as commercial and investment banks, merchant banks, commercial financing companies, institutional investors, insurance companies and, to the extent they provide an alternative form of financing, private equity funds.
With respect to our investment strategies and the deployment of capital, we primarily compete with other private markets solutions providers within North America and Europe that specialize in private credit. We endeavor to maintain strong relationships with general partners and other alternative asset managers who manage investment funds, as well as the general investment community that can include investment banks, commercial banks, advisors, brokers, legal firms, and accountants. Our non-sponsored, or non-private equity-backed, deals are sourced through a proprietary and robust network of industry contacts and other channels including existing relationships with owners or management teams of middle market companies, family-owned businesses, and niche industry players. We view the non-sponsored channel as less competitive given the wide dispersion of opportunities across North America and Europe, which are harder to source, evaluate, and underwrite. However, because of the increasing demand for private credit investments and growth across the industry, there can be no assurance that we will be able to invest all of the capital it raises in investments that meet our risk-adjusted return thresholds, or that the size of investment opportunities available to us will meet our investment sizing targets.
To grow our business, we must compete for investor capital, both within our existing investor base and the broader investor universe that is actively seeking to deploy capital into the private markets, and specifically funds managed by alternative asset managers like ML Management. Historically, our ability to raise additional capital, and thus grow AUM, is based on a variety of factors, including but not limited to:
•Investment performance across our managed and sub-advised investment strategies;
•Ability to originate and execute private credit investment opportunities;
•Nature and duration of investor relationships;
•Quality of service;
•Fund terms, including fees;
•Brand recognition of the platforms through which we operate as well as the brand recognition of the firms which we partner with, including BCPA and Runway;
•Ability to customize product offerings to fit our institutional, retail, and insurance client specifications; and
•Ability to provide cost effective and comprehensive range of services and products.
Competition is also high to attract and retain highly qualified investment professionals and support functions personnel. Our ability to continue to compete effectively within our industry will depend upon our ability to attract new employees and to motivate and retain our existing employees.
Insurance Solutions
We operate in a highly competitive industry through our Insurance Solutions operating subsidiary, Ability. Ability reinsures annuity products, which compete with fixed rate, fixed index, and variable annuities sold by other insurance companies and also with mutual fund products, traditional bank products, and other investment and retirement funding alternatives offered by other asset managers, banks, and broker/dealers.
59
The products Ability reinsures may compete with products of other insurance companies, financial intermediaries and other institutions based on several features, including crediting rates, index options, policy terms and conditions, ratings, reputation, and distributor compensation.
Many of Ability’s competitors are well-established, and have greater market share, broader networks, and maintain financial strength ratings from A.M. Best, which Ability does not have today. Larger competitors can have lower operating costs, enabling them to participate in transactions at more competitive pricing levels for insurance products, reinsurance solutions, and acquisitions. This pricing pressure could affect our Insurance Solutions platform’s ability to maintain or increase profitable growth. Ability has primarily grown through MYGA block reinsurance transactions and flow reinsurance, and increased competition within these insurance products could impact transaction pricing, potentially challenging future growth.
Regulatory and Compliance Matters
Our businesses, as well as the financial services and insurance industries generally, are subject to extensive regulation in the United States and around the world. Virtually all aspects of our business are subject to various laws and regulations, some of which are summarized below. Under these laws and regulations, agencies that regulate investment advisers, investment funds, insurance businesses, and other individuals and entities have broad administrative powers, including the power to limit, restrict, or prohibit the regulated entity or person from carrying on business if it fails to comply with such laws and regulations. Failure to comply with applicable regulatory and compliance requirements may result in a variety of consequences, including fines; administrative measures; suspension of voting rights; suspension of individual employees; limitations on engaging in certain lines of business for specified periods of time or mandatory disposal of interests in any affected regulated entity; revocation of investment adviser, insurance, and other registrations; licenses, or charters; censures; and other regulatory sanctions. The legal and regulatory requirements applicable to our business are ever evolving and may become more restrictive, which may make compliance with applicable requirements more difficult or expensive, or otherwise restrict our ability to conduct our business activities in the manner in which they are now conducted. our businesses have operated for many years within a legal framework that requires being able to monitor and comply with a broad range of legal and regulatory developments that affect our activities. However, additional legislation, changes in rules promulgated by self-regulatory organizations, or changes in the interpretation or enforcement of existing laws and rules, either in the United States or elsewhere, may directly affect our mode of operation and profitability. The complex regulatory frameworks governing financial institutions, insurance companies, and insurance distributors and their respective holding companies and subsidiaries, as well as those with investments in them, are very detailed and technical. Accordingly, the discussion below is general in nature, does not purport to be complete and is current only as of the date of this Prospectus.
Regulation under the Advisers Act
We conduct our advisory business primarily through ML Management and SCIM, each of which is registered as an investment adviser with the SEC under the Advisers Act. ML Management and SCIM are subject to, among other Advisers Act provisions, the anti-fraud provisions of the Advisers Act and to fiduciary duties derived from these provisions, which apply to the RIA’s relationships with their advisory clients globally, including funds that the RIAs manage. These provisions and duties impose restrictions and obligations on the RIA with respect to their dealings with their fund investors and their investments, including for example restrictions on agency cross and principal transactions. ML Management and SCIM are subject to periodic SEC examinations and other requirements under the Advisers Act and related regulations primarily intended to benefit advisory clients. These additional requirements relate, among other things, to maintaining an effective and comprehensive compliance program, record-keeping and reporting requirements and disclosure requirements. The Advisers Act generally grants the SEC broad administrative powers, including the power to limit or restrict an investment adviser from conducting advisory activities in the event it fails to comply with federal securities laws. Additional sanctions that may be imposed for failure to comply with applicable requirements include the prohibition of individuals from associating with an investment adviser, the revocation of registrations, and other censures and fines.
60
Insurance Regulation
Ability is subject to extensive regulation and supervision by the states in which it is domiciled, particularly with respect to their financial condition. Ability is domiciled in Nebraska, where it is regulated and supervised by the Nebraska Department of Insurance (“NEDOI”). Ability is also subject to regulation by all states in which the company transacts business; oversight that, in practice, often focuses on review of Ability’s market conduct. Ability is licensed to conduct insurance business, and is therefore subject to regulation and supervision by insurance regulators, in 42 states and the District of Columbia.
The extent and scope of insurance regulation varies between jurisdictions, but most jurisdictions have laws and regulations governing the financial security of insurers, including admittance of assets for purposes of calculating statutory surplus, standards of solvency, reserves, reinsurance, capital adequacy, and the business conduct of insurers.
In addition, statutes and regulations require the licensing of insurers and their agents, the approval of policy forms and related materials, and the approval of rates. State statutes and regulations also prescribe the permitted types and concentrations of investments by insurers. The primary purpose of this insurance industry regulation is to protect policyholders. Life insurance companies are required to file detailed quarterly and annual financial statements with insurance regulatory authorities in each of the jurisdictions in which they are licensed to do business, and their operations are subject to periodic examination by such authorities. Regulators have discretionary authority, in connection with the continued licensing of insurance companies, to limit or prohibit the insurance company’s ability to continue to do business if, in their judgment, the regulators determine that an insurer is not maintaining necessary statutory surplus or capital or if the further transaction of business will be detrimental to its policyholders.
The amount of dividends that Ability may pay in any twelve-month period, without prior approval by its domestic insurance regulator, is restricted under the laws of Nebraska.
We, an insurance holding company, together with our insurance subsidiary, Ability, are subject to the insurance holding company system laws of Nebraska. These laws generally require insurers that are members of such insurance holding company’s system to register with the jurisdiction’s insurance regulatory authorities, to file reports disclosing certain information, including the insurance holding company’s capital structure, ownership, management, financial condition, enterprise risk, and own risk and solvency assessment.
These laws also require disclosure of certain qualifying transactions between Ability and any of our other subsidiaries or affiliates. Such transactions could include loans, investments, sales, service agreements, and reinsurance agreements among other similar inter-affiliate transactions. These laws also require that intercompany transactions be fair and reasonable and not adversely affect the interests of policyholders. In certain circumstances, the insurance company must give prior notice of the transaction to the insurance department in its state of domicile, and the insurance department must either approve or disapprove the subject intercompany transaction within defined periods. Further, these laws require that an insurer’s surplus following any dividends or distributions to shareholder affiliates is reasonable in relation to the insurer’s outstanding liabilities and its financial needs.
The insurance holding company laws in some states, including Nebraska, require regulatory approval of a direct or indirect change of control of an insurer or an insurer’s parent company. Generally, to obtain approval from the insurance commissioner for any acquisition of control of an insurance company or its parent company, the proposed acquirer must file with the applicable commissioner an application containing information regarding:
(i)the identity and background of the acquirer and its affiliates;
(ii)the nature, source and amount of funds to be used to carry out the acquisition;
(iii)the financial statements of the acquirer and its affiliates;
(iv)any potential plans for disposition of the securities or business of the insurer;
(v)the number and type of securities to be acquired;
61
(vi)any contracts with respect to the securities to be acquired;
(vii)any agreements with broker-dealers; and
(viii)other relevant matters.
Different jurisdictions may have similar or additional requirements for prior approval of any acquisition of control of an insurance or reinsurance company licensed or authorized to transact business in those jurisdictions. Additional requirements may include re-licensing or subsequent approval for renewal of existing licenses upon an acquisition of control.
Statutory Examinations
Ability is required to file detailed quarterly and annual financial statements, prepared in accordance with statutory accounting practices (“SAP”), with regulatory officials in each of the jurisdictions in which they conduct business. As part of their routine regulatory oversight process, the NEDOI conducts periodic detailed examinations, generally once every three to five years, of the books, records, accounts and operations of Ability. The NEDOI began its regularly-scheduled triennial examination of Ability for the period of 2020-2022 in August 2023, completing its examination and issuing its final report on October 25, 2024.
Financial Tests
The NAIC has developed a set of financial relationships or “tests,” known as the Insurance Regulatory Information System, or IRIS, which is designed for early identification of companies that may require special attention or action by insurance regulatory authorities. Insurance companies submit data annually to the NAIC, which in turn analyzes the data by utilizing ratios. State insurance regulators review this statistical report, which is available to the public, together with an analytical report, prepared by and available only to state insurance regulators, to identify insurance companies that appear to require immediate regulatory attention. A “usual range” of results for each ratio is used as a benchmark.
Risk-Based Capital Requirements
In order to enhance the regulation of insurers’ solvency, the NAIC has adopted a model law to implement RBC requirements for life insurers. All states have adopted the NAIC’s model law or a substantively similar law. The NAIC Risk-Based Capital Model Act requires insurance companies to submit an annual RBC Report, which compares an insurer’s total adjusted capital with its authorized control level RBC. A company’s RBC is calculated by using a specified formula that applies factors to various specified assets, premium, claim, expense, and reserve items. The factors are higher for those items with greater underlying risk and lower for items with less underlying risk.
The RBC Report is used by insurance regulators to set in motion appropriate regulatory actions relating to insurers that show indications of weak or deteriorating conditions. RBC is an additional standard for minimum capital requirements that insurers must meet to avoid being placed in receivership by regulators. The annual RBC Report, and the information contained therein, is not intended by the NAIC as a means to rank insurers.
RBC is a method of measuring the minimum amount of capital appropriate for an insurance company to support its overall business operations in light of its size and risk profile. It provides a means of setting the capital requirement in which the degree of risk taken by the insurer is the primary determinant. The value of an insurer’s Total Adjusted Capital, which is the sum of its year-end statutory capital and surplus, in relation to its RBC, together with its trend in its Total Adjusted Capital, is used as a basis for determining regulatory action that a state insurance regulator may be authorized or required to take with respect to an insurer.
Ability is subject to risk based capital (“RBC”) standards and other minimum capital and surplus requirements imposed by state laws. Regulatory capital requirements for Ability are determined in accordance with statutory requirements of the Nebraska Department of Insurance. The minimum RBC ratio for Ability is 200% and Ability must have a ratio in excess of 300% to be able to reinsure new business. Regulatory action is triggered beginning at 200% RBC and below. The regulatory action varies with Risk based capital level as follows: (i) if a
62
company's total adjusted capital is less than 200% but greater than or equal to 150% of its authorized control level RBC, the company shall submit a risk-based capital plan to the regulatory authority highlighting conditions which contributed to lower adjusted capital and proposing corrective actions aimed at improving its capital position; (ii) if a company's total adjusted capital is less than 150% but greater than or equal to 70% of its authorized control level RBC, the regulatory authority will perform such examination and analysis of the assets, liabilities, and operations including a review of its risk-based capital plan of the company as deemed necessary and issue an order specifying the corrective actions that must be taken; (iii) if a company's total adjusted capital is less than 70%, the regulatory authority may take any action it deems necessary, including placing the company under regulatory control. Ability’s RBC ratio is tested annually at the end of Ability’s financial year and estimated on a quarterly basis.
Market Conduct Exams
Ability is subject to periodic market conduct exams (“MCE”) in any jurisdiction where it does business. An MCE typically entails review of business activities, such as operations and management, complaint handling, marketing and sales, producer licensing, policyholder service, underwriting, and claims handling. Regulators may impose fines and penalties upon finding violations of regulations governing such business activities.
Form Approvals
Ability is subject to state laws and regulations regarding form approvals. In most states, insurance policies are subject to prior regulatory approval in the state in which the policy is sold.
Unfair Claims Practices
Insurance companies are prohibited by state statutes from engaging in unfair claims practice. Unfair claims practices include, but are not limited to, misrepresenting pertinent facts or insurance policy provisions; failing to acknowledge and act reasonably promptly upon communications with respect to claims arising under insurance policies; and attempting to settle a claim for less than the amount to which a reasonable person would have believed such person was entitled.
Regulation of Investments
Ability is subject to state laws that restrict the kinds of investments it may make. These laws require diversification of investment portfolios and limit the amounts of investments in certain asset categories, such as below-investment grade fixed income securities, equity real estate, other equity investments, and derivatives. Failure to comply with these requirements and limitations could cause affected investments to be treated as non-admitted assets for purposes of measuring statutory surplus and, in some instances, could require the divestiture of such non-qualifying investments. Ability’s investment guidelines, including its Derivative Use Plan, have been filed with the NEDOI.
Statutory Accounting Practices
SAP are a basis of accounting developed to assist insurance regulators in monitoring and regulating the solvency of insurance companies. SAP is primarily concerned with measuring an insurer’s solvency. Statutory accounting focuses on valuing assets and liabilities of insurers at financial reporting dates in accordance with appropriate insurance law and regulatory provisions applicable in each insurer’s domiciliary state.
U.S. GAAP is concerned with a company’s solvency, but is also concerned with other financial measurements, principally income and cash flows. Accordingly, U.S. GAAP gives more consideration to appropriately matching revenue and expenses and accounting for management’s stewardship of assets than does SAP. As a result, different assets and liabilities and different amounts of assets and liabilities will be reflected in financial statements prepared in accordance with U.S. GAAP as compared to SAP.
Enterprise Risk and other Developments
The NAIC, as part of its solvency modernization initiative, has engaged in a concerted effort to strengthen the ability of U.S. state insurance regulators to monitor U.S. insurance holding company groups. The holding
63
company reform efforts at the NAIC culminated in December 2010 in the adoption of significant amendments to the NAIC’s Insurance Holding Company System Regulatory Act (the “Model Holding Company Act”) and its Insurance Holding Company System Model Regulation (the “Model Holding Company Regulation”). Among other things, the revised Model Holding Company Act and Model Holding Company Regulation explicitly address “enterprise” risk — the risk that an activity, circumstance, event, or series of events involving one or more affiliates of an insurer will, if not remedied promptly, be likely to have a material adverse effect upon the financial condition or liquidity of the insurer or its insurance holding company system as a whole — and require annual reporting of potential enterprise risk as well as access to information to allow the state insurance regulator to assess such risk. In addition, the Model Holding Company Act amendments include a requirement to the effect that any person divesting control over an insurer must provide 30 days’ notice to the regulator and the insurer (with an exception for cases where a Form A is being filed). The amendments direct the domestic state insurance regulator to determine those instances in which a divesting person will be required to file for and obtain approval of the transaction. Some form of the 2010 amendments to the Model Holding Company Act and the Model Holding Company Act Regulation has been adopted in all states.
Consumer Protection Laws and Privacy and Data Security Regulation
Federal and state consumer protection laws affect our operations. As part of the Dodd-Frank Act, Congress established the Consumer Financial Protection Bureau to supervise and regulate institutions that provide certain financial products and services to consumers. In addition, the Gramm-Leach-Bliley Act of 1999 implemented fundamental changes in the regulation of the financial services industry in the United States and includes privacy and security requirements for financial institutions, including obligations to protect and safeguard consumers’ nonpublic personal information and records, limitations on the re-disclosure and re-use of such information, and requirements to notify customers and other individuals about their policies and practices relating to their collection and disclosure of such information and their practices relating to protecting the security and confidentiality of that information.
In addition to federal and other financial institution-specific privacy laws and regulations, an increasing number of states are considering and passing comprehensive privacy legislation. The issues surrounding data security and the safeguarding of consumers’ protected information are under increasing regulatory scrutiny by state and federal regulators.
Employees
As of October 1, 2025, we had no employees. As described in “Certain Relationships and Related Person Transactions,” we rely on the Servicing Agent or personnel provided by the Servicing Agent to conduct our day to day operations.
Properties
Our principal executive and administrative offices are located at 650 Madison Avenue, 3rd Floor, New York, NY 10022. This space is leased by BCPA and we reimburse BCPA for a portion of the lease expense pursuant to the Servicing Agreement. This space is used by both segments of Mount Logan.
Mount Logan does not currently have any investments or interests in any real estate on its own behalf, nor does it have for its own benefit any investments or interest in any real estate mortgages or securities of persons engaged in real estate activities, though Ability does from time to time make such investments and hold such interests for the benefit of policyholders.
LEGAL PROCEEDINGS
From time to time, we are involved in various legal proceedings, lawsuits and claims incidental to the conduct of our business. Our business are also subject to extensive regulation, which may result in regulatory proceedings against us. We are not currently party to any material legal proceedings.
64
Corporate Information
Mount Logan, the issuer of the Notes in this offering, was incorporated in Delaware on January 7, 2025.
On September 12, 2025, we completed the previously announced Business Combination through two simultaneous merger transactions pursuant to the Agreement and Plan of Merger. In the first merger, Polar Merger Sub, Inc. merged with and into 180 Degree Capital, with 180 Degree Capital surviving as our wholly-owned subsidiary. In the second merger, Moose Merger Sub, LLC merged with and into Legacy MLC, with Legacy MLC surviving as our wholly-owned subsidiary.
Following the completion of these merger transactions, we changed our name from “Yukon New Parent, Inc.” to “Mount Logan Capital Inc.” and became a publicly traded corporation.
We file annual reports on Form 10-K, Quarterly Reports on Form 10-Q, Current Reports on Form 8-K, proxy statements and other information with the SEC. Our filings with the SEC are available on the SEC’s website at www.sec.gov. We also maintain a website at www.ir.mountlogan.com. The information found on our website is not part of this or any other report we file with, or furnish to, the SEC.
65
MANAGEMENTS’S DISCUSSION AND ANALYSIS OF FINANCIAL CONDITION AND RESULTS OF OPERATIONS - NINE MONTHS ENDED SEPTEMBER 30, 2025
The following discussion and analysis of our financial condition and results of operations of our financial condition and results of operations should be read in conjunction with Mount Logan's condensed consolidated financial statements and the related notes within this registration statement. As described in the section entitled “Cautionary Note Regarding Forward-Looking Statements,” this discussion contains forward-looking statements that are subject to known and unknown risks and uncertainties. Actual results and the timing of events may differ significantly from those expressed or implied in such forward-looking statements due to a number of factors, including those included in the section of this registration statement entitled “Risk Factors.” The highlights listed below have had significant effects on many items within our condensed consolidated financial statements and affect the comparison of the current period’s activity with those of prior periods. Our historical results are not necessarily indicative of the results that may be expected for any period in the future, and our interim results are not necessarily indicative of the results we expect for the full fiscal year or any other period.
Nature of Business
General
Mount Logan’s Business
Mount Logan, together with its consolidated subsidiaries is an alternative asset management and insurance solutions company. Mount Logan manages its business through two business segments: Asset Management and Insurance Solutions. Its Asset Management segment is focused on investing in and actively managing credit investment opportunities in North America through its wholly-owned subsidiary Mount Logan Management LLC (“ML Management”). The Insurance Solutions segment is conducted by Ability Insurance Company (“Ability”), a Nebraska domiciled insurer, that specializes in reinsuring annuity products for the increasing number of individuals seeking to fund retirement needs. Ability also holds a run-off book of long-term care policies. As of September 30, 2025, Mount Logan had a team of 21 full time employees.
Asset Management
Mount Logan’s Asset Management segment focuses on generating recurring asset management fee streams across a variety of credit investing strategies. Mount Logan raises, invests and manages funds, accounts and other vehicles with an emphasis on private credit. As of September 30, 2025, Mount Logan had a total AUM of $2.1 billion.
As an alternative asset manager, through Mount Logan’s wholly and partially owned SEC-registered investment advisers (“RIAs”), Mount Logan earns management and incentive fees for providing investment advisory and management services to multiple diversified investment vehicles, which include Mount Logan’s Insurance Solutions segment. The majority of these vehicles are permanent or semi-permanent capital, generating recurring management and fee-related performance fees from indefinite term vehicles, that are measured and received on a recurring basis, primarily focused on North American and European direct and indirect private loan origination in the middle-market across the capital structure, as well as corporate credit, specialty finance, and other mandates across managed accounts and CLOs. Mount Logan benefits from its investment in and expansion into high-growth areas of private credit and private solutions investing, including asset-backed finance, opportunistic credit, and venture and growth lending. Beyond participation in the traditional primary and secondary credit markets, through Mount Logan’s origination and corporate solutions capabilities, Mount Logan seeks to originate assets with attractive risk-adjusted returns, in the funds Mount Logan manages, through the employment of rigorous and deep diligence on the opportunities Mount Logan assesses.
Through Mount Logan’s RIAs, Mount Logan seeks to invest in well-established middle market businesses that operate across a wide range of industries (i.e., no concentration in any one industry). Mount Logan employs fundamental credit analysis, targeting investments in businesses with relatively low levels of cyclicality and operating risk. Mount Logan has experience managing levered vehicles, both public and private, and seek to enhance returns through the prudent use of leverage with a conservative approach that prioritizes downside
66
protection and capital preservation. Mount Logan believes this strategy and approach offers attractive risk-adjusted returns with lower volatility featuring the potential for fewer defaults and greater resilience through market cycles.
The amount of fees charged for managing these assets depends on the underlying investment strategy, vehicle being managed, liquidity profile, and, ultimately, Mount Logan’s ability to generate returns for Mount Logan’s clients. After expenses associated with generating fee-related revenues, Mount Logan measures the resulting earnings stream “Fee Related Earnings” or “FRE”, which represents the primary performance measure for the Asset Management segment. FRE is the sum of (i) management fees, (ii) performance fees received from certain managed funds (iii) equity investment earnings related to fee generating vehicles, and (iv) interest income attributable to investment management activity, less (a) fee-related compensation, excluding equity-based compensation, and (b) other associated operating expenses, which excludes amortization of acquisition-related intangible assets and interest and other credit facility expenses. FRE excludes non-fee generating revenues and expenses, transaction-related charges, equity-based compensation costs, the amortization of intangible assets, the operating results of variable interest entities ("VIEs") that are included in the consolidated financial statements, and any other non-recurring income and expenses. In addition, FRE excludes interest and other financing costs related to Mount Logan not attributable to any specific segment, and corporate overhead expenses incurred to support the operations of the business rather than directly fee-related. Management considers these types of costs corporate in nature, and are included only for reconciliation purposes to income (loss) before income tax (provision) benefit.
The Asset Management segment also holds a minority interest in Sierra Crest Investment Management ("SCIM"), which manages BCP Investment Corporation (“BCIC”), formerly known as Portman Ridge Finance Corp. ("Portman" or “Portman Ridge”), a United States business development company, and Alternative Credit Income Fund ("ACIF"), a closed-end interval fund that invests in a portfolio of public and private credit investments. SCIM is majority owned by BCPA.
Insurance Solutions
Mount Logan’s Insurance Solutions segment is operated by Ability, a Nebraska domiciled insurer and reinsurer of long-term care ("LTC") policies and retirement savings products, licensed in 42 states and the District of Columbia. Upon closing of the acquisition of Ability in late 2021, ML Management entered into an investment management agreement with Ability (the "Ability IMA") to manage certain of Ability’s assets that are within the scope of ML Management’s expertise in providing investment management advisory services (the assets of Ability managed by ML Management referred to herein as the "Managed Ability Portfolio"). In the second quarter of 2022, management began to implement its plan to expand and diversify the Insurance Solutions business, including ceasing to insure new long-term care risk and, instead, reinsuring multi-year guaranteed annuity ("MYGA") policies. The Insurance Solutions segment also includes the economic benefits of the three Cornhusker CLOs (collectively, the "Cornhusker CLOs"), which represent consolidated VIEs. Annuity policies are contracts with insurers where individuals agree to pay a certain amount of money, either in a lump sum or through installments, which entitles them to receive a series of payments at a future date.
Long-term care insurance policies reimburse policyholders a daily amount, upon meeting certain requirements, for services to assist with daily living as they age. Ability's long-term care portfolio's morbidity risk has been largely reinsured to third-parties.
A reinsurance contract is a type of insurance contract that is issued by an entity (the reinsurer) to compensate another entity (the cedant) for claims arising from insurance contract(s) issued by the cedant.
Consistent with the overall business strategy, Ability assumes certain policy risks written by other insurance companies and cedes insurance risks to reinsurers. Reinsurance accounting is applied for reinsurance transactions when risk transfer provisions have been met. Ability reviews all contractual features, particularly those that may limit the amount of insurance risk to which the reinsurer is subject or features that delay the timely reimbursement of claims. Ability does not have any assumed or ceded reinsurance contracts for the LTC line of business that do not meet risk transfer requirements. The MYGA line of business does not meet the risk requirements to qualify as an insurance contract and is therefore considered an investment contract.
67
Ability uses ceded reinsurance contracts in the normal course of business to manage its risk exposure. For each of its reinsurance agreements, cessions under reinsurance agreements do not discharge Ability’s obligations as the primary insurer. Reinsurance assets represent the benefit derived from reinsurance agreements in force at the reporting date, considering the financial condition of the reinsurer. Amounts recoverable from reinsurers are estimated in accordance with the terms of the relevant reinsurance contract and historical reinsurance recovery information. Amounts recoverable from reinsurers are based on what Ability believes are reasonable estimates and the balance is reported as an asset in the Insurance section of the Consolidated Statements of Financial Position. However, the ultimate amount of the reinsurance recoverable is not known until all claims are settled.
Mount Logan provides a full suite of services for Ability's investment portfolio, including direct investment management, asset allocation, mergers and acquisitions asset diligence and certain operational support services, including investment compliance, tax, legal and risk management support. Mount Logan’s Insurance Solutions business focuses on generating spread income by combining the two core competencies of (1) sourcing long-term, persistent liabilities through reinsurance treaties and (2) using the scale and reach of Mount Logan’s Asset Management business to actively source or originate assets with Ability's preferred risk and return characteristics. Ability's investment philosophy is to invest a portion of its assets in securities that earn an incremental yield by taking measured liquidity and complexity risk and capitalize on its long-dated, persistent liability profile to prudently achieve higher net investment earned rates, rather than assuming incremental credit risk. Because Ability maintains discipline in reinsuring attractively priced liabilities, it has the ability to invest in a broad range of high-quality assets to generate attractive earnings.
Mount Logan uses Spread Related Earnings (“SRE”) to assess the performance of the Insurance Solutions segment. SRE is a component of Segment Income that is used to assess the performance of the Insurance Solutions segment, excluding certain market volatility, which consists of investment gains (losses), other income and certain general, administrative & other expenses. For the Insurance Solutions segment, SRE equals the sum of (i) the net investment earnings on Insurance Solutions segment’s net invested assets (excluding investment earnings on funds held under reinsurance contracts and modified coinsurance (“Modco”) agreement), less (ii) cost of funds (as described below), (iii) compensation and benefits, (iv) interest expense and (v) operating expenses. SRE represents the difference between actual earnings generated on the assets and investments made and the interest or crediting rate guaranteed to policyholders or participants. Rather than increasing allocations to higher risk securities to increase yields, or returns, on the assets invested, Ability and ML Management focus on proprietary origination of high-quality, predominantly senior secured loans and assets, which Mount Logan believes reduce downside risk.
68
The diagram below depicts Mount Logan’s current organizational structure:
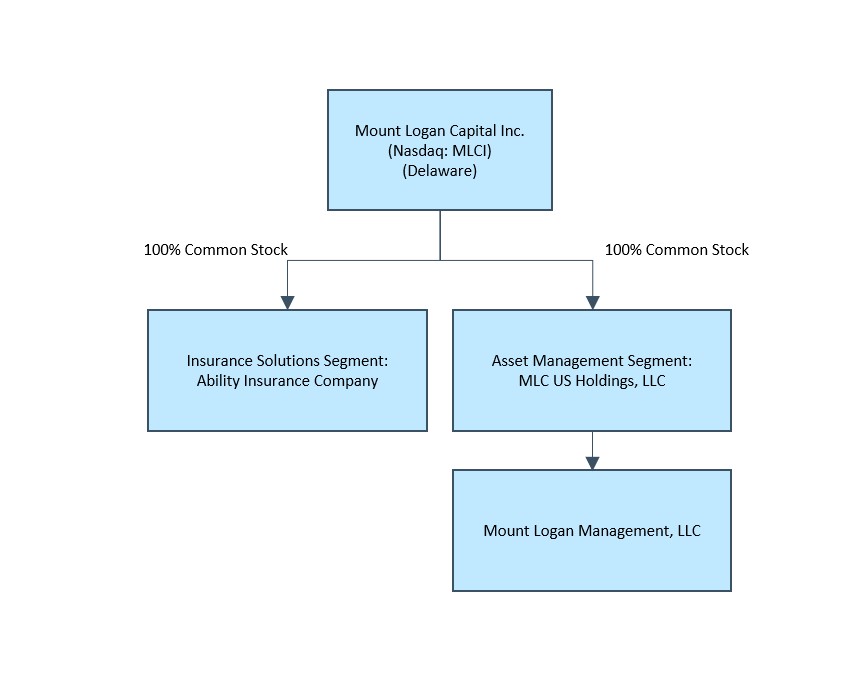
Note: The organizational structure chart above depicts a simplified version of the Mount Logan structure. It does not include all legal entities in the structure. The acquisition of 180 Degree Capital Corp. is reflected as part of the Asset Management segment.
Business Environment
Industry Trends and Market Conditions
Mount Logan’s asset management and insurance solutions businesses are affected by the conditions in the political environment and financial markets and economic conditions of the United States, such as changes in interest rates, availability of credit, and inflation rates (including persistent inflation). These conditions can significantly impact the performance of Mount Logan’s business, including, but not limited to, the valuation of investments, including those of the vehicles Mount Logan manages, and related income that Mount Logan may recognize.
Mount Logan carefully monitors economic and market conditions that could potentially give rise to market volatility and affect its business operations, which include inflation and benchmark interest rates. According to the U.S. Bureau of Labor Statistics, the annual U.S. inflation rate increased slightly from 2.7% as of June 30, 2025 to 3.0% as of September 30, 2025. This heightening of inflation was part of a broader trend of increasing inflationary pressures. The Federal Reserve finished the third quarter of 2025 with a benchmark interest rate target range of 4.0% to 4.25%, a 25 basis point decrease from its December 2024 meeting. At its October 2025 meeting, the Federal Reserve again lowered the target range to 3.75% to 4.0%. While the Federal Reserve in the United States and central banks in other countries have begun to cut interest rates as inflation rates have gradually weakened, they may raise rates again in the future due to ongoing inflation concerns. This potential increase, combined with reduced government spending and financial market volatility, could further elevate economic uncertainty and associated risks. Additionally, interest rate hikes or other government measures aimed at curbing inflation might lead to
69
recessionary pressures globally. Such a recession could significantly and adversely impact Mount Logan’s business, financial condition, operational results, liquidity, and cash flows.
Moreover, Ability is materially affected by conditions in the capital markets and the U.S. economy generally. Actual or perceived stressed conditions, volatility and disruptions in financial asset classes or various capital and credit markets may have an adverse effect on Mount Logan’s insurance business because such conditions may decrease the returns on, and value of, its investment portfolio.
Interest Rate Environment
Both medium-term and long-term rates generally declined between the second and third quarter of 2025, with the U.S. 10-year Treasury yield at 4.15% as of September 30, 2025 compared to 4.23% as of June 30, 2025. Short term rates similarly declined in the third quarter of 2025, with the 3-month secured overnight financing rate at 3.98% as of September 30, 2025 compared to 4.29% as of June 30, 2025 respectively.
With respect to the Insurance Solutions segment, Ability's investment portfolio consists predominantly of fixed maturity investments. Both rising and declining interest rates can negatively affect the income Ability derives from these interest rate spreads. During periods of rising interest rates, Ability may be contractually obligated to reimburse its clients for the greater amounts they credit on certain interest-sensitive products. However, Ability may not have the ability to immediately acquire investments with interest rates sufficient to offset the increased crediting rates on its reinsurance contracts. During periods of falling interest rates, Ability’s investment earnings will be lower because new investments in fixed maturity securities will likely bear lower interest rates. Ability may not be able to fully offset the decline in investment earnings with lower crediting rates on underlying annuity products related to certain of its reinsurance contracts. Higher interest rates may result in increased surrenders on interest-based products of Ability’s clients, which may affect its fees and earnings on those products. Lower interest rates may result in lower sales of certain insurance and investment products of Ability’s clients, which would reduce the demand for its reinsurance of these products. If interest rates remain low for an extended period, it may adversely affect Ability’s cash flows, financial condition and results of operations. Ability addresses interest rate risk through managing the duration of the liabilities it sources with assets it acquires through asset/liability management (“ALM”) programs. As part of its investment strategy, Ability purchases floating rate investments, which are expected to perform well in a rising interest rate environment and are expected to underperform in a declining rate environment. Ability manages its floating interest rate risk in a declining rate environment through hedging activity.
As of September 30, 2025, Ability's net invested asset portfolio included $340 million of floating rate investments, or 45% of its net invested assets. In periods of prolonged low interest rates, the net investment spread may be negatively impacted by reduced investment income to the extent that Ability is unable to adequately reduce policyholder crediting rates due to policyholder guarantees in the form of minimum crediting rates or otherwise due to market conditions. A significant majority of the MYGA policies Ability reinsures have crediting rates that reset upon renewal. While Ability has the contractual right to not accept the renewals, its willingness to do so may be limited by competitive pressures.
Significant interest rate risk may arise from mismatches in the timing of cash flows from Ability’s assets and liabilities. Management of interest rate risk at the Company-wide level, and at the various operating company levels, is one of the main risk management activities in which MLC senior management engages.
Interest Rate Sensitivity
The following table summarizes the potential impact on net income of hypothetical base rate changes in interest rates on Mount Logan’s debt investments assuming a parallel shift in the yield curve, with all other variables
70
remaining constant for the Insurance Solutions segment. The impact of interest rates sensitivity on the Asset Management segment is immaterial.
| As at | September 30, 2025 | December 31, 2024 | ||||||||||||
50 basis point increase 1 | $ | 766 | $ | 1,911 | ||||||||||
50 basis point decrease 1 | (766) | (1,911) | ||||||||||||
_______________
(1)Losses are presented in brackets and gains are presented as positive numbers
Actual results may differ significantly from these sensitivity analyses. As such, the sensitivities should only be viewed as directional estimates of the underlying sensitivities for the respective factors based on the assumptions outlined above.
During the first quarter of 2024, Mount Logan entered into interest rate swaps to economically hedge fair value interest rate risk on floating rate debt investments. Mount Logan does not designate derivatives (interest rate swaps) as hedging instruments under a fair value hedge accounting model. Derivatives are initially measured at fair value with subsequent changes therein recognized in the Consolidated Statements of Comprehensive Income (Loss). Mount Logan's derivative instruments are disclosed below:
| As at September 30, 2025 | Notional | Derivative assets | Derivative liabilities | |||||||||||||||||
| Interest rate swaps | $ | 187,000 | $ | 45,000 | $ | — | ||||||||||||||
Total | 187,000 | 45,000 | — | |||||||||||||||||
| As at December 31, 2024 | Notional | Derivative assets | Derivative liabilities | |||||||||||||||||
| Interest rate swaps | $ | 187,000 | $ | — | $ | 5,192 | ||||||||||||||
Total | 187,000 | — | 5,192 | |||||||||||||||||
The interest rate swaps are recorded in the Consolidated Statement of Financial Position as "Derivatives" within the Insurance Solutions segment with the mark-to-market changes in fair value being recorded as part of "Unrealized gains (losses) on hedging instruments" within the Insurance Solutions segment on the Consolidated Statement of Comprehensive Income (Loss).
Restricted cash posted as collateral consists of cash deposited at a bank that is pledged as collateral in connection with the interest rate swaps. The table below represents the cash posted as collateral associated with open derivative positions:
| As at | September 30, 2025 | December 31, 2024 | ||||||||||||
| Restricted cash posted as collateral | $ | 9,967 | $ | 15,716 | ||||||||||
| Total | $ | 9,967 | $ | 15,716 | ||||||||||
Overview of Results of Operations
Financial Measures under U.S. GAAP - Asset Management
The following discussion of financial measures under U.S. GAAP is based on Mount Logan's Asset Management business as of September 30, 2025.
71
Revenues
Management Fees
Mount Logan provides investment management services to investment funds, CLOs, managed accounts and other vehicles in exchange for a management fee. The significant growth of assets Mount Logan manages has had a positive effect on Mount Logan’s revenues. Management fees are determined quarterly using an annual rate which are generally based upon (i) a percentage of the capital committed during the commitment period, and thereafter based on the remaining invested capital of unrealized investments, or (ii) net asset value, gross assets, or as otherwise provided in the respective agreements. Management fees are recognized over time, during the period in which the related services are performed.
Incentive Fees
Mount Logan provides investment management services to investment funds, CLOs, managed accounts and other vehicles in exchange for a management fee, as discussed above and, in some cases an incentive fee, a type of performance revenue. The incentive fee consists of two parts: (i) an income incentive fee which is based on pre-incentive fee net investment income in excess of a hurdle rate and (ii) a capital gains incentive fee which is based on cumulative realized capital gains and losses and unrealized capital depreciation. Incentive fees are considered a form of variable consideration as they are based on the fund achieving certain investment return hurdles. Accordingly, the recognition of such fee is deferred until it is probable that a significant reversal in the amount of cumulative revenue will not occur, which is generally upon liquidation of the investment fund.
The following table summarizes Mount Logan’s (i) management fees and (ii) incentive fees by fee generating vehicle:
| As of September 30, | As of September 30, | For the three months ended | For the three months ended | Quarter on Quarter change in Total Fees | ||||||||||||||||||||||||||||||||||||||||||||||||||||||||||||||||||||||
| 2025 | 2024 | 2025 | 2024 | September 30, 2025 | September 30, 2024 | |||||||||||||||||||||||||||||||||||||||||||||||||||||||||||||||||||||
Management Fees Receivable 7 | Incentive Fees Receivable 7 | Management Fees | Incentive Fees | Total Fees | Management Fees | Incentive Fees | Total Fees | $ Change | % Change | |||||||||||||||||||||||||||||||||||||||||||||||||||||||||||||||||
| Fee Generating Vehicle | ||||||||||||||||||||||||||||||||||||||||||||||||||||||||||||||||||||||||||
Ability (including consolidated VIEs) 1 | $ | 537 | $ | 512 | $ | — | $ | — | $ | 1,620 | $ | — | $ | 1,620 | $ | 1,501 | $ | — | $ | 1,501 | $ | 119 | 8 | % | ||||||||||||||||||||||||||||||||||||||||||||||||||
BDCs 2 | — | 860 | — | — | 125 | — | 125 | 850 | — | 850 | (725) | -85 | % | |||||||||||||||||||||||||||||||||||||||||||||||||||||||||||||
CLOs 3 | 1,185 | 791 | — | — | 661 | — | 661 | 791 | — | 791 | (130) | -16 | % | |||||||||||||||||||||||||||||||||||||||||||||||||||||||||||||
Interval Funds 4 | 109 | 48 | 430 | 492 | 364 | 430 | 794 | 184 | 492 | 676 | 118 | 17 | % | |||||||||||||||||||||||||||||||||||||||||||||||||||||||||||||
Ovation Funds 5 | 139 | 275 | — | — | 383 | — | 383 | 723 | 251 | 974 | (591) | -61 | % | |||||||||||||||||||||||||||||||||||||||||||||||||||||||||||||
Other 6 | $ | 100 | $ | 71 | $ | — | $ | — | $ | 320 | $ | — | $ | 320 | $ | 215 | $ | — | $ | 215 | $ | 105 | 49 | % | ||||||||||||||||||||||||||||||||||||||||||||||||||
| Total Fees | $ | 2,070 | $ | 2,557 | $ | 430 | $ | 492 | $ | 3,473 | $ | 430 | $ | 3,903 | $ | 4,264 | $ | 743 | $ | 5,007 | $ | (1,104) | -22 | % | ||||||||||||||||||||||||||||||||||||||||||||||||||
| As of September 30, | As of September 30, | For the nine months ended | For the nine months ended | Year on Year change in Total Fees | ||||||||||||||||||||||||||||||||||||||||||||||||||||||||||||||||||||||
| 2025 | 2024 | 2025 | 2024 | September 30, 2025 | September 30, 2024 | |||||||||||||||||||||||||||||||||||||||||||||||||||||||||||||||||||||
Management Fees Receivable 7 | Incentive Fees Receivable 7 | Management Fees | Incentive Fees | Total Fees | Management Fees | Incentive Fees | Total Fees | $ Change | % Change | |||||||||||||||||||||||||||||||||||||||||||||||||||||||||||||||||
| Fee Generating Vehicle | ||||||||||||||||||||||||||||||||||||||||||||||||||||||||||||||||||||||||||
Ability (including consolidated VIEs) 1 | $ | 537 | $ | 512 | $ | — | $ | — | $ | 4,400 | $ | — | $ | 4,400 | $ | 4,459 | $ | — | $ | 4,459 | $ | (59) | -1 | % | ||||||||||||||||||||||||||||||||||||||||||||||||||
BDCs 2 | — | 860 | — | — | 1,729 | — | 1,729 | 2,652 | — | 2,652 | (923) | -35 | % | |||||||||||||||||||||||||||||||||||||||||||||||||||||||||||||
CLOs 3 | 1,185 | 791 | — | — | 2,124 | — | 2,124 | 2,281 | — | 2,281 | (157) | -7 | % | |||||||||||||||||||||||||||||||||||||||||||||||||||||||||||||
Interval Funds 4 | 109 | 48 | 430 | 492 | 1,600 | 1,208 | 2,808 | 505 | 1,162 | 1,667 | 1,141 | 68 | % | |||||||||||||||||||||||||||||||||||||||||||||||||||||||||||||
Ovation Funds 5 | 139 | 275 | — | — | 1,549 | — | 1,549 | 2,219 | 1,491 | 3,710 | (2,161) | -58 | % | |||||||||||||||||||||||||||||||||||||||||||||||||||||||||||||
Other 6 | $ | 100 | $ | 71 | $ | — | $ | — | $ | 899 | $ | — | $ | 899 | $ | 522 | $ | — | $ | 522 | $ | 377 | 72 | % | ||||||||||||||||||||||||||||||||||||||||||||||||||
| Total Fees | $ | 2,070 | $ | 2,557 | $ | 430 | $ | 492 | $ | 12,301 | $ | 1,208 | $ | 13,509 | $ | 12,638 | $ | 2,653 | $ | 15,291 | $ | (1,782) | -12 | % | ||||||||||||||||||||||||||||||||||||||||||||||||||
______________
(1)ML Management earns a base management fee of 1% on the average statutory book value of the portion of Ability’s investments it manages. Management fees earned by ML Management from Ability are eliminated on consolidation.
72
(2)ML Management earned a base management fee of 1.75% on the gross assets of Logan Ridge Finance Corporation (“Logan Ridge”) until July 15, 2025 at which time Logan Ridge merged into Portman and became the newly merged entity - BCIC, and ML Management’s investment management agreement with Logan Ridge was terminated. Management fees earned indirectly through ML Management’s 24.99% interest in SCIM, which is the manager of BCIC (previously Portman), are excluded as management fee revenue, but are paid as cash distributions from SCIM. Upon the merger of Logan Ridge and Portman, on July 15, 2025, the Company through MLCSC Holdings LLC, a wholly owned subsidiary, entered into a profit sharing agreement with BCPSC Holdings LLC, a wholly owned subsidiary of BCPA (the “Profit-Sharing Agreement”). MLCSC is entitled to 16.03% of BCPA’s distributions from SCIM. Incremental management fees from BCIC are indirectly earned through the Profit-Sharing Agreement, and are excluded as management fee revenue, but recognized in other income.
(3)ML Management as the adviser to two CLOs, 2018-01 and 2019-01, earns senior and subordinated management fees on these vehicles, calculated on the outstanding collateral balance. CLO 2018-1 earns 0.25% senior and 0.35% subordinated fees, and 2019-1 earns 0.25% senior and 0.25% subordinated fees. These rates are fixed for the life of the transaction and are not subject to repricing.
(4)ML Management is the adviser to OCIF and earns management and incentive fees directly from this fund. Base management fees are earned at 1.25% of gross assets. Incentive fees are realized when the fund reaches a hurdle rate of return each quarter, based on the pre-incentive fee net investment income. When OCIF’s pre-incentive net investment income – i.e. interest income, dividend income and any other income accrued during the calendar quarter, less OCIF’s operating expenses for the quarter – exceeds the hurdle rate of return on OCIF’s adjusted capital of 1.5% (or 6% annualized), ML Management earns an incentive fee at 15% of the pre-incentive fee net investment income. All incentive fees recognized are considered realized as they are calculated and payable quarterly in arrears based on the pre-incentive fee net investment income for the immediately preceding calendar quarter. All recorded incentive fees have been subsequently received in cash. Separately, Mount Logan receives the economics of ACIF, which is an interval fund advised by SCIM, via a servicing agreement with SCIM over ACIF. The SCIM servicing fee over ACIF is excluded.
(5)Mount Logan as the general partner accrues base management fees, calculated monthly, due and payable either monthly or quarterly in arrears at 0.125% of the net assets in the Ovation funds. Incentive fees, calculated monthly, due and payable quarterly in arrears, are calculated as 10% of pre-incentive fee distributable income. If pre-incentive fee distributable income amounts do not exceed 0% in any fiscal quarter, such shortfall (a “High Watermark Shortfall”) will carry forward to subsequent quarters. No incentive fees are payable to the general partner in any fiscal quarter in which a High Watermark Shortfall exists.
(6)Consists of several small, closed end private funds which are sub-advised by ML Management at 1% of net assets, as well as management fees earned from a portfolio of Vista Life & Casualty Reinsurance Company’s (Vista) assets to which ML Management was appointed as the investment manager of, effective March 2025, at a rate of 1% on the average statutory book value of investments under management. Only fees which are crystallized and not subject to reversal are recognized and included.
(7)Management and incentive fees receivable are part of Other assets on the Consolidated Statement of Financial Position.
The fee rates described above are contractually fixed, however Mount Logan retains the right to voluntarily waive all or a portion of any management or incentive fee in circumstances where doing so would better align the economic interests of Mount Logan and the investors in a particular vehicle. Any such waiver would be approved by the applicable fund board.
Expenses
Compensation and Benefits
The most significant expense in Mount Logan’s Asset Management business is compensation and benefits expense. This consists of fixed salary, discretionary and non-discretionary bonuses, profit sharing expense associated with the performance fees earned and compensation expense associated with the vesting of non-cash equity-based awards. Mount Logan’s current compensation arrangements with certain of its employees include non-cash equity-based awards, which are considered to be ‘performance-based incentives.’ The non-cash equity-based awards are granted subject to management’s discretion and approval by the Board of Directors. There are no clawback provisions associated with the non-cash equity-based awards; however, they are subject to a time-based vesting requirement and continued employment. To date, Mount Logan has not paid any profit sharing associated with performance fees. Because of these performance-based incentives, as Mount Logan’s net revenues increase, Mount Logan’s compensation costs rise. Mount Logan’s compensation costs also reflect the increased investment in people as Mount Logan continues to grow its AUM both organically and inorganically.
Mount Logan grants equity awards to certain directors, officers, service providers and employees, consisting of Restricted Stock Units ("RSUs") that generally vest and become exercisable in annual installments depending on the award terms. See Note 20. Equity based compensation to Mount Logan’s condensed consolidated financial statements for further discussion of equity-based compensation.
Administration and Servicing Fees
On November 20, 2018, Mount Logan entered into a servicing agreement (the “Servicing Agreement”) with BCPA. Under the terms of the Servicing Agreement, BCPA as servicing agent (the "Servicing Agent")
73
performs (or oversees, or arranges for, the performance of) the administrative services necessary for the operation of Mount Logan, including, without limitation, office facilities, equipment, bookkeeping and record keeping services and such other services the Servicing Agent, subject to review by the Board, shall from time to time deem necessary or useful to perform its obligations under this Servicing Agreement. The Servicing Agent is authorized to enter into sub-administration agreements as determined to be necessary in order to carry out the administrative services.
Unless earlier terminated as described below, the Servicing Agreement will remain in effect from year-to-year if approved annually by (i) the vote of the Board and (ii) the vote of a majority of Mount Logan’s independent directors. The Servicing Agreement may be terminated at any time, without the payment of any penalty, upon 60 days’ written notice by the vote of the Board or by the Servicing Agent.
Mount Logan reimburses BCPA for an allocable portion of compensation paid to Mount Logan’s Chief Financial Officer, associated management personnel (based on a percentage of time such individuals devote, on an estimated basis, to the business affairs of Mount Logan), and out-of-pocket expenses. While the Servicing Agent performs certain administrative functions for Mount Logan, the management functions of Mount Logan are wholly performed by Mount Logan’s management team.
Mount Logan provides administrative and reporting services to SCIM in respect of the management of ACIF in exchange for a servicing fee. The servicing fee is variable consideration as it is calculated quarterly based on the fees received by SCIM under its advisory agreement with ACIF, less a specified fee retained by SCIM, debt servicing expense, compensation and other certain expenses SCIM incurs in connection with investment advisory services it provides to ACIF. As Mount Logan determined it acts as the agent in this relationship, Mount Logan recognizes in income the amount it is entitled to receive or obligated to pay. In the Consolidated Statements of Financial Position, uncollected amounts are classified as Due from related parties when money is owed to Mount Logan and money owed by Mount Logan is presented as Due to related parties.
Financial Measures under U.S. GAAP - Insurance Solutions
The following discussion of financial measures under U.S. GAAP is based on Mount Logan’s Insurance Solutions business, which is operated by Ability, as of September 30, 2025.
Revenues
Net Premiums
Net premiums for long-duration contracts, including products with fixed and guaranteed premiums and benefits, are recognized as revenue when due from policyholders. Insurance premiums are reported net of reinsurance ceded premiums.
Product Charges
Product charges mainly include surrender charges on MYGA product which are earned when assessed against policyholder account balances during the period.
Net Investment Income
Net investment income is a significant component of Ability's total revenues. Ability recognizes investment income as it accrues or is legally due, net of investment management and custody fees. Investment income on fixed maturity securities includes coupon interest, as well as the amortization of any premium and the accretion of any discount. Investment income on equity securities represents dividend income and preferred coupon interest.
Net gains (losses) from investment activities
Investment related gains (losses) primarily consist of (i) realized gains and losses on sales of investments, (ii) unrealized gains and losses on trading securities, (iii) unrealized gains and losses on equity securities, (iv) changes in the fair value of the embedded derivatives and derivatives not designated as a hedge, and (v) changes in the provision for credit losses.
74
Net revenues of consolidated variable interest entities
Changes in the fair value of the consolidated VIEs’ assets and liabilities and related interest, dividend and other income and expenses are presented within net revenues of consolidated variable interest entities.
Net investment income (loss) on funds withheld
Net gains (losses) on funds withheld consists of investment activity pertaining to funds withheld assets which includes any interest income, unrealized gains, and losses, and realized gains and losses from sales of these assets.
Ceded reinsurance – Funds withheld with Front Street Re
Mount Logan has a coinsurance with funds withheld arrangement with Front Street Re covering a significant portion of the LTC business (the “Medico” block of policies). Under the funds withheld arrangement, assets are retained by Mount Logan; however, all investment activity pertaining to those assets are passed through to Front Street Re. Investment activity includes any interest income, unrealized gains, and losses, and realized gains and losses from sales of these assets. The liability for this funds held arrangement is in the liability section of the Insurance section of the Consolidated Statements of Financial Position, and the income statement items related to this contract are in the line item net investment income (loss) on funds withheld in the Insurance section of the Consolidated Statement of Operations.
Ceded reinsurance – Modified coinsurance with Vista Life and Casualty Reinsurance Company
Mount Logan also has a modified coinsurance (“Modco”) agreement with Vista Life and Casualty Reinsurance Company (“Vista”). Pursuant to such agreement, Mount Logan retains assets in a designated custody account to support the quota share of the ceded Modco reserves. Similar to a funds withheld arrangement, all investment activity pertaining to those assets are passed through to Vista. Investment activity includes any interest income, unrealized gains, and losses, and realized gains and losses from sales on these assets. The liability for this funds held agreement is netted against the reinsurance recoverable of the Insurance section of the Consolidated Statements of Financial Position, and the income statement items related to this contract are in the line item net investment income (loss) on funds withheld in the Insurance Consolidated Statement of Operations.
Expenses
Interest sensitive contract benefits
Liabilities for the MYGA investment contracts equal the account value, that is, the amount that accrues to the benefit of the contract or policyholder including credited interest and assessments through the financial statement date. Changes in interest sensitive contract liabilities, excluding deposits and withdrawals, are recorded in interest sensitive contract benefits or product charges on the consolidated statements of operations.
Net policy benefit and claims
Net policy benefit and claims represent the present value of future benefits to be paid to or on behalf of policyholders and related expenses less the present value of future net premiums. The liability is measured for each group of contracts (i.e., cohorts) using current cash flow assumptions. Contracts are grouped into cohorts by line of business, product type and cash flow streams, based on the date the policy was acquired (which for the entire LTC portfolio is the date of the acquisition of Ability). Future policy benefit reserves are adjusted each period because of updating lifetime net premium ratios for differences between actual and expected experience with the retroactive effect of those variances recognized in current period earnings. Mount Logan reviews at least annually in the third quarter, future policy benefit reserves cash flow assumptions, and if the review concludes that the assumptions need to be updated, future policy benefit reserves are adjusted retroactively based on the revised net premium ratio using actual historical experience, updated cash flow assumptions, and the locked-in discount rate with the effect of those changes recognized in current period earnings.
75
As Mount Logan’s LTC business is in run-off, the locked-in discount rate is used for the computation of interest accretion on future policy benefit reserves recognized in earnings. However, cash flows used to estimate future policy benefit reserves are also discounted using an upper-medium grade (i.e., low credit risk) fixed-income instrument yield reflecting the duration characteristics of the liabilities and is updated each reporting period with changes recorded in Accumulated Other Comprehensive Income (“AOCI”). As a result, changes in the current discount rate at each reporting period are recognized as an adjustment to AOCI and not earnings each period, whereas, changes relating to cash flow assumptions are recognized in the Insurance Statement of Earnings (Loss).
Amortization of deferred acquisition costs
Mount Logan incurs significant costs in connection with its renewals for its MYGA business. Costs that are related directly to the successful acquisition or renewal of MYGA contracts are capitalized as Deferred Acquisition Costs (“DAC”). Such costs for Mount Logan are comprised mostly of incremental direct costs of contract acquisitions, which for Mount Logan are primarily commissions. Deferred acquisition costs will be amortized to expense on a straight-line basis, at the individual level over the expected term of the related contract.
All other acquisition-related costs, as well as all indirect costs, are expensed as incurred.
Compensation and Benefits
This consists of fixed salary, discretionary and non-discretionary bonuses.
Interest expense
This includes interest expense on the debt obligations.
General, administrative and other
General, administrative and other expenses include normal operating expenses, integration, restructuring and other non-operating expenses.
Other Financial Measures under U.S. GAAP
Income Taxes
Mount Logan’s income tax expense increased in the third quarter of 2025 compared to the third quarter of 2024. In the three months ended September 30, 2025 Mount Logan incurred an income tax expense of $2.3 million while in the three months ended September 30, 2024 Mount Logan incurred an income tax expense of $0.3 million. Mount Logan’s income tax expense also increased in the nine months ended September 30, 2025 compared to the nine months ended September 30, 2024. For the year to date September 30, 2025 Mount Logan incurred an income tax expense of $2.3 million while for the year to date September 30, 2024 Mount Logan incurred an income tax expense of $0.5 million. Income taxes were higher in 2025 due to a valuation allowance that has been established to offset certain deferred tax assets as management determined that it is more likely than not that such deferred tax assets will not be realized, driving up the deferred tax expense for the 2025 period.
Managing Business Performance - Key Segment and Non-U.S. GAAP Performance Measures
Mount Logan believes that the presentation of Segment Income supplements a reader’s understanding of the economic operating performance of each of Mount Logan’s segments.
Segment Income is the key performance measure used by management in evaluating the performance of the Asset Management and Insurance Solutions segments. See Note 23. Segments to the condensed consolidated financial statements for more details regarding the components of Segment Income and management’s consideration of Segment Income. Mount Logan believes that Segment Income is helpful for a reader’s understanding of Mount Logan’s business and that investors should review the same supplemental financial measure that management uses to analyze Mount Logan’s segment performance. This measure supplements and should be considered in addition to
76
and not in lieu of the results of operations discussed in “Overview of Results of Operations” that have been prepared in accordance with U.S. GAAP.
Fee Related Earnings and Spread Related Earnings
Fee Related Earnings (“FRE”) is a component of Segment Income that is used to assess the performance of the Asset Management segment. FRE is the sum of (i) management fees, (ii) performance fees received from certain managed funds (iii) equity investment earnings related to fee generating vehicles, and (iv) interest income attributable to investment management activity, less (a) fee-related compensation, excluding equity-based compensation, and (b) other associated operating expenses, which excludes amortization of acquisition-related intangible assets and interest and other credit facility expenses.
FRE excludes non-fee generating revenues and expenses, transaction-related charges, equity-based compensation costs, the amortization and/or impairment of intangible assets, the operating results of VIEs that are included in the consolidated financial statements, and any other non-recurring income and expenses. In addition, FRE excludes interest and other financing costs related to the Company not attributable to any specific segment, and corporate overhead expenses incurred to support the operations of the business rather than directly fee-related. Management considers these types of costs corporate in nature, and are included only for reconciliation purposes to income (loss) before income tax (provision) benefit.
Spread Related Earnings (“SRE”) is a component of Segment Income that is used to assess the performance of the Insurance Solutions segment, excluding certain market volatility, which consists of investment gains (losses), other income and certain general, administrative & other expenses. For the Insurance Solutions segment, SRE equals the sum of (i) the net investment earnings on Insurance Solutions segment’s net invested assets (excluding investment earnings on funds held under reinsurance contracts and Modco agreement), less (ii) cost of funds (as described below), (iii) compensation and benefits, (iv) interest expense and (v) operating expenses.
Cost of funds includes liability costs associated with the crediting cost on MYGA liabilities as well as other liability costs. Other liability costs include DAC amortization, the cost of liabilities associated with LTC, net of reinsurance, which includes change in reserves, premiums, actual claim experience including related expenses and certain product charges related to MYGA.
Mount Logan uses FRE and SRE as measures of operating performance, not as measures of liquidity. These measures should not be considered in isolation or as a substitute for net income or other income data prepared in accordance with U.S. GAAP. The use of these measures without consideration of their related U.S. GAAP measures is not adequate due to the adjustments described above.
Results of Operations
Below is a discussion of Mount Logan’s condensed consolidated statements of operations for the three and nine months ended September 30, 2025 and 2024. For additional analysis of the factors that affected Mount Logan’s results at the segment level, see “Segment Analysis” below:
| Three Months Ended September 30, | Nine Months Ended September 30, | |||||||||||||||||||||||||||||||||||||||||||||||||
| 2025 | 2024 | Change ($) | Change (%) | 2025 | 2024 | Change ($) | Change (%) | |||||||||||||||||||||||||||||||||||||||||||
| ($ in thousands) | ||||||||||||||||||||||||||||||||||||||||||||||||||
| REVENUES | ||||||||||||||||||||||||||||||||||||||||||||||||||
| Asset Management | ||||||||||||||||||||||||||||||||||||||||||||||||||
| Management fees | 1,851 | 2,763 | (912) | -33 | % | 7,900 | 8,179 | (279) | -3 | % | ||||||||||||||||||||||||||||||||||||||||
| Incentive fees | 431 | 742 | (311) | -42 | % | 1,208 | 2,653 | (1,445) | -54 | % | ||||||||||||||||||||||||||||||||||||||||
77
| Three Months Ended September 30, | Nine Months Ended September 30, | |||||||||||||||||||||||||||||||||||||||||||||||||
| 2025 | 2024 | Change ($) | Change (%) | 2025 | 2024 | Change ($) | Change (%) | |||||||||||||||||||||||||||||||||||||||||||
| ($ in thousands) | ||||||||||||||||||||||||||||||||||||||||||||||||||
| Equity investment earning | 481 | 74 | 407 | 550 | % | 805 | 241 | 564 | 234 | % | ||||||||||||||||||||||||||||||||||||||||
| 2,763 | 3,579 | (816) | -23 | % | 9,913 | 11,073 | (1,160) | -10 | % | |||||||||||||||||||||||||||||||||||||||||
| Insurance Solutions | ||||||||||||||||||||||||||||||||||||||||||||||||||
| Net Premiums | (4,492) | (4,084) | (408) | 10 | % | (12,743) | (11,414) | (1,329) | 12 | % | ||||||||||||||||||||||||||||||||||||||||
| Product charges | 184 | 89 | 95 | NM | 1,766 | 196 | 1,570 | NM | ||||||||||||||||||||||||||||||||||||||||||
| Net investment income | 16,992 | 19,413 | (2,421) | -12 | % | 48,621 | 55,813 | (7,192) | -13 | % | ||||||||||||||||||||||||||||||||||||||||
| Net gains (losses) from investment activities | 3,775 | 5,239 | (1,464) | -28 | % | 9,085 | 3,172 | 5,913 | 186 | % | ||||||||||||||||||||||||||||||||||||||||
| Net revenues of consolidated variable interest entities | 2,797 | 3,757 | (960) | -26 | % | 9,979 | 12,400 | (2,421) | -20 | % | ||||||||||||||||||||||||||||||||||||||||
| Net investment income (loss) on funds withheld | (10,656) | (15,373) | 4,717 | -31 | % | (23,232) | (30,685) | 7,453 | -24 | % | ||||||||||||||||||||||||||||||||||||||||
| Other income | 76 | 86 | (10) | NM | 230 | 244 | (14) | NM | ||||||||||||||||||||||||||||||||||||||||||
| 8,676 | 9,127 | (451) | -5 | % | 33,706 | 29,726 | 3,980 | 13 | % | |||||||||||||||||||||||||||||||||||||||||
| Total revenues | 11,439 | 12,706 | (1,267) | -10 | % | 43,619 | 40,799 | 2,820 | 7 | % | ||||||||||||||||||||||||||||||||||||||||
| EXPENSES | ||||||||||||||||||||||||||||||||||||||||||||||||||
| Asset Management | ||||||||||||||||||||||||||||||||||||||||||||||||||
| Administration and servicing fees | 1,564 | 1,372 | 192 | 14 | % | 4,613 | 4,747 | (134) | -3 | % | ||||||||||||||||||||||||||||||||||||||||
| Transaction costs | 3,185 | 200 | 2,985 | NM | 10,483 | 253 | 10,230 | NM | ||||||||||||||||||||||||||||||||||||||||||
| Compensation and benefits | 4,161 | 1,967 | 2,194 | 112 | % | 8,377 | 5,543 | 2,834 | 51 | % | ||||||||||||||||||||||||||||||||||||||||
| Amortization and impairment of intangible assets | 8,272 | 482 | 7,790 | 1616 | % | 11,071 | 1,446 | 9,625 | 666 | % | ||||||||||||||||||||||||||||||||||||||||
| Interest and other credit facility expenses | 1,970 | 1,664 | 306 | 18 | % | 5,876 | 5,027 | 849 | 17 | % | ||||||||||||||||||||||||||||||||||||||||
| General, administrative and other | 2,980 | 1,530 | 1,450 | 95 | % | 5,961 | 4,804 | 1,157 | 24 | % | ||||||||||||||||||||||||||||||||||||||||
| 22,132 | 7,215 | 14,917 | 207 | % | 46,381 | 21,820 | 24,561 | 113 | % | |||||||||||||||||||||||||||||||||||||||||
| Insurance Solutions | ||||||||||||||||||||||||||||||||||||||||||||||||||
Net policy benefit and claims (remeasurement gain on policy liabilities of $ | (2,118) | (1,392) | (726) | 52 | % | (1,389) | (6,540) | 5,151 | -79 | % | ||||||||||||||||||||||||||||||||||||||||
| Interest sensitive contract benefits | 4,154 | 3,932 | 222 | 6 | % | 11,969 | 11,070 | 899 | 8 | % | ||||||||||||||||||||||||||||||||||||||||
| Amortization of deferred acquisition costs | 929 | 563 | 366 | 65 | % | 2,389 | 1,600 | 789 | 49 | % | ||||||||||||||||||||||||||||||||||||||||
| Compensation and benefits | 73 | 471 | (398) | -85 | % | 540 | 1,120 | (580) | -52 | % | ||||||||||||||||||||||||||||||||||||||||
| Interest expense | 408 | 328 | 80 | 24 | % | 1,143 | 984 | 159 | 16 | % | ||||||||||||||||||||||||||||||||||||||||
78
| Three Months Ended September 30, | Nine Months Ended September 30, | |||||||||||||||||||||||||||||||||||||||||||||||||
| 2025 | 2024 | Change ($) | Change (%) | 2025 | 2024 | Change ($) | Change (%) | |||||||||||||||||||||||||||||||||||||||||||
| ($ in thousands) | ||||||||||||||||||||||||||||||||||||||||||||||||||
General, administrative and other (including related party amounts of $ | 3,338 | 4,153 | (815) | -20 | % | 10,294 | 12,759 | (2,465) | -19 | % | ||||||||||||||||||||||||||||||||||||||||
| 6,784 | 8,055 | (1,271) | -16 | % | 24,946 | 20,993 | 3,953 | 19 | % | |||||||||||||||||||||||||||||||||||||||||
| Total expenses | 28,916 | 15,270 | 13,646 | 89 | % | 71,327 | 42,813 | 28,514 | 67 | % | ||||||||||||||||||||||||||||||||||||||||
| Investment and other income (Loss) - Asset Management | ||||||||||||||||||||||||||||||||||||||||||||||||||
| Net gains (losses) from investment activities | 1,342 | 28 | 1,314 | NM | 3,050 | (1,086) | 4,136 | -381 | % | |||||||||||||||||||||||||||||||||||||||||
| Dividend income | 22 | 71 | (49) | -69 | % | 89 | 296 | (207) | -70 | % | ||||||||||||||||||||||||||||||||||||||||
| Interest income | 275 | 274 | 1 | — | % | 814 | 817 | (3) | — | % | ||||||||||||||||||||||||||||||||||||||||
| Other income (loss), net | 251 | 69 | 182 | 264 | % | 556 | 69 | 487 | 706 | % | ||||||||||||||||||||||||||||||||||||||||
| Gain on acquisition | 4,457 | — | 4,457 | NM | 4,457 | — | 4,457 | NM | ||||||||||||||||||||||||||||||||||||||||||
| Total investment and other income (loss) | 6,347 | 442 | 5,905 | 1336 | % | 8,966 | 96 | 8,870 | 9240 | % | ||||||||||||||||||||||||||||||||||||||||
| Income (loss) before taxes | (11,130) | (2,122) | (9,008) | 425 | % | (18,742) | (1,918) | (16,824) | 877 | % | ||||||||||||||||||||||||||||||||||||||||
| Income tax (expense) benefit — Asset Management | (2,306) | (309) | (1,997) | 646 | % | (2,333) | (493) | (1,840) | 373 | % | ||||||||||||||||||||||||||||||||||||||||
| Net income (loss) | (13,436) | (2,431) | (11,005) | 453 | % | (21,075) | (2,411) | (18,664) | 774 | % | ||||||||||||||||||||||||||||||||||||||||
______________
Note: “NM” denotes not meaningful.
Three Months Ended September 30, 2025 Compared to Three Months Ended September 30, 2024
In this section, references to 2025 refer to the three months ended September 30, 2025 and references to 2024 refer to the three months ended September 30, 2024.
Asset Management Segment
Revenues
Revenues were $2.8 million in 2025, a decrease of $0.8 million from $3.6 million in 2024, driven by a decrease in management and incentive fees, offset by an increase in equity investment earnings.
The $0.9 million decrease in management fees was primarily driven by the merging of Logan Ridge into Portman Ridge on July 15, 2025 and the wind down of the Ovation funds. The existing Logan Ridge investment management agreement (“IMA”) was terminated and therefore, the Company's management fee stream from Logan Ridge ceased. For additional information on the changes to results of operations as a result of this transaction, refer to the Equity investment earnings discussion and Investment and Other Income (loss) discussion below. The Ovation fee stream decreased as the fund continues to wind down. The decrease in fees was partially offset by the Vista investment management agreement, which commenced during the first quarter of 2025, and the increase in OCIF management fees due to the increase in AUM in 2025 compared to 2024.
The $0.3 million decrease in incentive fees was primarily driven by investment write-downs in the Ovation funds which resulted in $nil Ovation incentive fees being earned in 2025, compared to $0.3 million earned in 2024.
79
Given the underlying Ovation fund is in wind down, no further incentive fees are anticipated to be earned going forward.
Equity investment earnings increased by $0.4 million due to better net income results in SCIM, which were primarily driven by the decrease in professional fee spend due to active management efforts to reduce costs and elimination of the legacy cost reimbursement program at SCIM upon the Logan Ridge and Portman merger. SCIM was the adviser of Portman and effective July 15, 2025, upon closing of the merger of Logan Ridge and Portman, became the advisor to the combined company, renamed BCP Investment Corporation (“BCIC”).
Expenses
Expenses were $22.1 million in 2025, an increase of $14.9 million from $7.2 million in 2024, driven by increases in transaction costs, amortization and impairment of intangibles, compensation and benefits costs, general, administrative and other expenses, interest and credit facility expenses and administration and servicing fees.
Transaction costs increased $3.0 million in 2025 primarily due to deal costs related to Mount Logan’s merger with TURN. Refer to Note 3. Business combinations of the Company’s Condensed Consolidated Financial Statements for further detail.
Amortization and impairment of intangible assets increased by $7.8 million in 2025 primarily due to the impairment of the Logan Ridge IMA as the entity merged with Portman Ridge, as discussed above. The impairment charge of $19.2 million was offset by a gain recorded upon recognition of a new profit sharing agreement between the Company and the parent entity of SCIM whereby the Company is entitled to receive 16.03% of the distributions received by the parent entity. Given SCIM is the manager of BCIC, the Company’s profit sharing interest under the agreement is driven by BCIC management and performance fees. The value of the profit sharing agreement was determined to be $11.2 million and is considered an indefinite lived intangible asset. Income earned as a result of the profit sharing agreement is recorded as “Other income (loss), net” on the condensed consolidated statement of operations.
Compensation and benefits costs increased by $2.2 million in 2025 primarily due to the acceleration of the RSUs vesting upon change in control related to Mount Logan’s merger with TURN and severance costs for several individuals.
General, administrative and other expenses increased $1.5 million in 2025 primarily due to an agreement the Company through ML Management entered into with Logan Ridge in connection with the Logan-Portman merger, whereby upon the closing of the merger, as Logan Ridge's investment adviser, Mount Logan Management financed a pre-closing cash dividend to Logan Ridge shareholders.
Interest and other credit facility expenses increased $0.3 million in 2025 due to increased borrowings from upsizing our existing credit facility during the fourth quarter of 2024 and the amortization of deferred financing costs associated with the upsize, and growing paid in kind interest on the debenture units.
Administration and servicing fees increased by $0.2 million due to increased administration fees of $1.0 million due to increased reliance on BC Partners for services provided under the administration agreement. The increase in administration fees was partially offset by the decrease in administrative expenses related to a closed end private fund sub-advised by ML Management and the decrease in sub-investment management expenses. Administrative expenses related to the fund ML Management sub-advises decreased due to active management efforts to reduce costs, while sub-investment management expenses decreased primarily due to fee waivers provided by one sub-investment manager.
Investment and Other Income (Loss)
Total investment and other income increased $5.9 million primarily driven by a $4.5 million gain realized upon the reverse acquisition of TURN on September 12, 2025 (refer to Note 3. Business combinations of the condensed consolidated financial statements for further details regarding this transaction), and unrealized gains on investments including on the portfolio acquired with the TURN merger. The remaining increase was driven by new
80
income earned as a result of the Profit-Sharing Agreement (refer to Note 22. Related parties of the condensed consolidated financial statements for further details regarding this agreement).
Insurance Solutions Segment
Revenues
Revenues were $8.7 million in 2025, a decrease of $0.5 million from $9.1 million in 2024. The decrease was primarily driven by decreases in net investment income, net gains (losses) from investment activities, net revenue of consolidated VIEs, and net premiums. These decreases in revenue were partially offset by increase in net investment income (loss) on funds withheld and product charges.
Net investment income was $17.0 million in 2025, a decrease of $2.4 million from $19.4 million in 2024, primarily due to decline in SOFR compared to prior quarter in 2025, whereas it was relatively flat quarter over quarter in 2024. SOFR fell from approximately 4.52% in the second quarter of 2025 to approximately 4.33% in the third quarter of 2025, a decline of 19 basis points, while SOFR was relatively flat between the second and third quarter of 2024.
Net gains (losses) from investment activities were gains of $3.8 million in 2025, a decrease of $1.5 million from gains of $5.2 million in 2024, primarily due to higher realized losses and lower unrealized gains on downgraded assets.
Net revenues of consolidated VIEs were $2.8 million in 2025, a decrease of $1.0 million from $3.8 million in 2024, primarily driven by higher unrealized losses and lower interest income and realized gains in 2025 compared to 2024.
Net premiums were ($4.5) million in 2025, a decrease of $0.4 million from ($4.1) million in 2024. The negative net premium reflects ceded premiums exceeding direct and assumed premiums within the LTC business, primarily due to additional ceded premium paid to transfer a substantial portion of LTC related risk under a reinsurance arrangement. The decrease in net premiums was primarily driven by a decrease of $0.8 million in direct and assumed premium compared to 2024, partially offset by a decrease of $0.4 million in ceded premium related to the LTC business compared to 2024.
Net investment income (loss) on funds withheld were a loss of ($10.7) million in 2025, which reflects an increase of $4.7 million from a loss of ($15.4) million in 2024. This increase was primarily driven by decline in income attributable to funds withheld assets due to lower interest income and unrealized gain in 2025 compared to 2024.
Product charges were $0.2 million in 2025, which reflects an increase of $0.1 million from $0.1 million in 2024, primarily driven by an increase in surrenders of MYGA policies in 2025 compared to 2024 which resulted in higher surrender charges/product charges paid by policyholders in 2025.
Expenses
Expenses were $6.8 million in 2025, a decrease of $1.3 million from $8.1 million in 2024. The decrease was driven by decreases in net policy benefit & claims, and general, administrative & other expenses. These decreases were partially offset by increases in interest sensitive contract benefits and DAC amortization.
Net policy benefit and claims were ($2.1) million in 2025, a decrease of $0.7 million from ($1.4) million in 2024, primarily driven by lower claims and decline in the provision for credit losses on reinsurance recoverable.
Interest sensitive contract benefits were $4.2 million in 2025, an increase of $0.2 million from $3.9 million in 2024, primarily driven by interest accretion on the additional MYGA block assumed from NSG in the second quarter of 2025.
81
DAC amortization was $0.9 million in 2025, an increase of $0.4 million from $0.6 million in 2024, primarily due to the acquisition cost related to additional MYGA block assumed from NSG in the second quarter of 2025, as well as due to increased surrenders of existing MYGA policies.
General, administrative & other expenses were $3.3 million in 2025, a decrease of $0.8 million from $4.2 million in 2024. Expenses were lower in 2025 primarily due to the absence of new MYGA business, which reduced MYGA related costs in 2025 compared to 2024. Additionally, consulting and legal expenses declined in 2025 compared to 2024. Valuation costs also decreased in 2025 following the transition to a new valuation service provider in the fourth quarter of 2024.
Income Tax (Provision) Benefit
Mount Logan’s income tax expense was $2.3 million in 2025, a change from the income tax expense of $0.3 million in 2024. Income taxes were higher in 2025 due to the valuation allowance established to offset certain deferred tax assets as management determined that it is more likely than not that such deferred tax assets will not be realized, driving up the deferred tax expense for the 2025 period. The (provision) benefit for income taxes includes federal, state, local and foreign income taxes, resulting in an effective income tax rate of (20.72%) and (14.56%) for 2025 and 2024, respectively. The most significant reconciling items between the U.S. federal statutory income tax rate and the effective income tax rate was due to the transaction costs which are treated as a permanent difference for tax purposes. See Note 18. Income taxes to the condensed consolidated financial statements for further details regarding Mount Logan’s income tax (provision) benefit.
Nine Months Ended September 30, 2025 Compared to Nine Months Ended September 30, 2024
In this section, references to 2025 refer to the nine months ended September 30, 2025 and references to 2024 refer to the nine months ended September 30, 2024.
Asset Management Segment
Revenues
Revenues were $9.9 million in 2025, a decrease of $1.2 million from $11.1 million in 2024, driven by a decrease in incentive fees and management fees, partially offset by an increase in equity investment earnings.
The $1.4 million decrease in incentive fees was primarily driven by investment write-downs in the Ovation funds which resulted in $nil Ovation incentive fees being earned in 2025, compared to $1.5 million fees earned in 2024. Given the underlying Ovation fund is in wind down, no further incentive fees are anticipated to be earned going forward.
Management fees decreased $0.3 million primarily due to the merging of Logan Ridge into Portman on July 15, 2025, and the wind down of the Ovation funds. The existing Logan Ridge IMA was terminated and therefore, the Company's management fee stream from Logan Ridge ceased. For additional information on the changes to results of operations as as a result of this transaction, refer to the Equity investment earnings discussion and Investment and Other Income (loss) discussion below. The Ovation fee stream decreased as the fund continues to wind down. The decrease in fees was partially offset by the Vista investment management agreement, which commenced during the first quarter of 2025 and the increase in AUM across OCIF and a closed end private fund sub-advised by ML Management.
Equity investment earnings increased by $0.6 million due to better net income results in SCIM, which were primarily driven by the decrease in professional fee spend due to active management efforts to reduce costs and elimination of the legacy cost reimbursement program at SCIM upon the Logan Ridge and Portman Ridge merger. SCIM was the adviser of Portman Ridge and effective July 15, 2025, upon closing of the merger of Logan Ridge and Portman Ridge, became the advisor to the combined company, renamed BCP Investment Corporation (“BCIC”).
82
Expenses
Expenses were $46.4 million in 2025, an increase of $24.6 million from $21.8 million in 2024, driven by increases in transaction costs, amortization and impairment of intangibles, compensation and benefits, general, administrative and other expenses and interest and credit facility expenses, partially offset by the decrease in administration and servicing fees.
Transaction costs increased $10.2 million in 2025 primarily due to deal costs related to Mount Logan’s merger with TURN.
Amortization and impairment of intangible assets increased $9.6 million in 2025 due to the impairment of the Logan Ridge Investment Management Agreement as the entity merged with Portman Ridge, as discussed above. The impairment charge of $19.2 million was offset by a gain recorded upon recognition of a new profit sharing agreement between the Company and the parent entity of SCIM whereby the Company is entitled to receive 16.03% of the distributions received by the parent entity. Given SCIM is the manager of BCIC, the Company’s profit sharing interest under the agreement is driven by BCIC management and performance fees. The value of the profit sharing agreement was determined to be $11.2 million and is considered an indefinite lived intangible asset. Income earned as a result of the profit sharing agreement is recorded as “Other income (loss), net” on the condensed consolidated statement of operations. Further, the decrease in the remaining useful life and change in amortization method on the IMA purchased in the Ovation GP acquisition, as the underlying fund is being wound down, resulted in higher amortization expense in 2025 compared to 2024.
Compensation and benefits increased $2.8 million in 2025 primarily due to the acceleration of the RSUs vesting upon change in control related to Mount Logan’s merger with TURN and severance costs for several individuals.
General, administrative and other expenses increased $1.2 million in 2025 primarily due to an agreement the Company through ML Management entered into with Logan Ridge in connection with the Logan-Portman merger, whereby upon the closing of the merger, as Logan Ridge's investment adviser, Mount Logan Management financed a pre-closing cash dividend to Logan Ridge shareholders.
Interest and other credit facility expenses increased $0.8 million in 2025 due to increased borrowings from upsizing our existing credit facility during the fourth quarter of 2024 and the amortization of deferred financing costs associated with the upsize, and growing paid in kind interest on the debenture units.
Administration and servicing fees were relatively flat in 2025 compared to 2024 as the increase in administrative fees were offset by decreases in servicing fees and sub-investment management expenses. Administrative fees paid to BC Partners increased by $0.7 million due to increased reliance on BC Partners for services provided under the administration agreement. The decrease in servicing fees due to the decrease in net economic loss attributable to Mount Logan’s service agreement with SCIM by $0.4 million and the decrease in sub-investment management expenses. Mount Logan’s servicing agreement with SCIM is for ACIF, an interval fund, and is calculated as the gross management and incentive fees paid by ACIF net of expenses incurred under the servicing agreement. The decrease in economic loss attributable to the servicing agreement with SCIM was primarily driven by a decrease in expenses under the agreement due to compensation costs moving directly to Mount Logan, and non-recurring costs incurred in 2024 related to ACIF expense write-offs. Sub-investment management expenses decreased by $0.3 million primarily due to fee waivers provided by one sub-investment manager. Administrative expenses related to a closed end private fund sub-advised by ML Management also decreased due to active management efforts to reduce costs
Investment and Other Income (Loss)
Total investment and other income increased $8.9 million primarily driven by a $4.5 million gain realized upon the reverse acquisition of TURN on September 12, 2025 (refer to Note 3. Business combinations of the condensed consolidated financial statements for further details regarding this transaction), unrealized gains on investments including on the portfolio acquired with the TURN merger, and unrealized gains on the seller note issued in relation to the Capitala acquisition (refer to Note 12. Debt obligations of the condensed consolidated
83
financial statements for further details regarding Mount Logan’s debt obligations). The remaining increase was driven by new income earned as a result of the Profit-Sharing Agreement.
The increase in total investment and other income was partially offset by a decrease in dividend income from the partial redemption of OCIF shares.
Insurance Solutions Segment
Revenues
Revenues were $33.7 million in 2025, an increase of $4.0 million from $29.7 million in 2024. The increase was primarily driven by increases in net gains (losses) from investment activities, net investment income (loss) on funds withheld and product charges. These increases were partially offset by decreases in net investment income, net revenue of consolidated VIEs, and net premiums.
Net gains (losses) from investment activities were gains of $9.1 million in 2025, an increase of $5.9 million from gains of $3.2 million in 2024, primarily due to higher unrealized gains, partially offset by higher realized losses. The higher unrealized gain was primarily driven from favorable change in the fair value of investment assets due to a decrease in yields in 2025 compared to 2024.
Net investment income (loss) on funds withheld were a loss of ($23.2) million in 2025, which reflects an increase of $7.5 million from a loss of ($30.7) million in 2024. This increase was primarily driven by decline in income attributable to funds withheld assets due to lower interest income and higher realized losses and investment management expenses in 2025 compared to 2024.
Product charges were $1.8 million in 2025, which reflects an increase of $1.6 million from $0.2 million in 2024, primarily driven by an increase in surrenders of MYGA policies in 2025 compared to 2024 which resulted in higher surrender charges/product charges paid by policyholders in 2025.
Net investment income was $48.6 million in 2025, a decrease of $7.2 million from $55.8 million in 2024, primarily due to significant drop in SOFR compared to prior year period. SOFR fell from approximately 5.27% in the third quarter of 2024 to approximately 4.33% in the third quarter of 2025, a decline of about 94 basis points, which resulted in lower income on floating rate assets.
Net revenues of consolidated VIEs were $10.0 million in 2025, a decrease of $2.4 million from $12.4 million in 2024, primarily driven by higher unrealized losses and lower interest income and realized gains in 2025 compared to 2024.
Net premiums were ($12.7) million in 2025, a decrease of $1.3 million from ($11.4) million in 2024. The negative net premium reflects ceded premiums exceeding direct and assumed premiums within the LTC business, primarily due to additional ceded premium paid to transfer a substantial portion of LTC related risk under a reinsurance arrangement. The decrease in net premiums was primarily driven by a decrease of $2.0 million in direct/assumed premium compared to 2024, partially offset by a decrease of $0.7 million in ceded premium related to the LTC business compared to 2024.
Expenses
Expenses were $24.9 million in 2025, an increase of $4.0 million from $21.0 million in 2024. The increase was driven by increases in net policy benefit & claims, interest sensitive contract benefits, and DAC amortization. These increases were partially offset by a decrease in general, administrative & other expenses.
Net policy benefits and claims were $(1.4) million in 2025, an increase of $5.2 million from ($6.5) million in 2024, primarily driven by increased claims and a higher provision for credit losses on reinsurance. Additionally, reserve change on the Guardian block within Long term care business had a favorable impact in 2024, whereas the same block experienced an adverse impact in first nine months of 2025 due to updated cash flow projections.
84
Interest sensitive contract benefits were $12.0 million in 2025, an increase of $0.9 million from $11.1 million in 2024, primarily driven by interest accretion on additional MYGA block assumed from NSG in the second quarter of 2025.
DAC amortization was $2.4 million in 2025, an increase of $0.8 million from $1.6 million in 2024, primarily due to the acquisition cost related to additional MYGA block assumed from NSG in the second quarter of 2025, as well as due to increased surrenders of existing MYGA policies in 2025 compared to 2024.
General, administrative & other expenses were $10.3 million in 2025, a decrease of $2.5 million from $12.8 million in 2024. Expenses were lower in 2025 primarily due to a reduction in new MYGA business in 2025 compared to 2024, which decreased MYGA related costs. Additionally, consulting and legal expenses also declined and valuation costs were reduced in 2025 following the transition to a new valuation service provider in the fourth quarter of 2024.
Income Tax (Provision) Benefit
Mount Logan’s income tax expense was $2.3 million in 2025, an increase from the income tax expense of $0.5 million in 2024. Income taxes were higher in 2025 due to the valuation allowance established to offset certain deferred tax assets as management determined that it is more likely than not that such deferred tax assets will not be realized, driving up the deferred tax expense for the 2025 period. The (provision) benefit for income taxes includes federal, state, local and foreign income taxes, resulting in an effective income tax rate of (12.45%) and (25.72%) for 2025 and 2024, respectively. The most significant reconciling items between the U.S. federal statutory income tax rate and the effective income tax rate was due to the transaction costs which are treated as a permanent difference for tax purposes. See Note 18. Income taxes to the condensed consolidated financial statements for further details regarding Mount Logan’s income tax (provision) benefit.
Segment Analysis
Discussed below are Mount Logan’s results of operations for each of Mount Logan’s reportable segments. They represent the segment information available and utilized by management to assess performance and to allocate resources. See Note 23. Segments to Mount Logan’s condensed consolidated financial statements for more information regarding Mount Logan’s segment reporting.
Asset Management
The following table presents FRE, the performance measure of Mount Logan’s Asset Management segment.
| Three Months Ended September 30, | Nine Months Ended September 30, | |||||||||||||||||||||||||||||||||||||||||||||||||
| 2025 | 2024 | Change ($) | Change (%) | 2025 | 2024 | Change ($) | Change (%) | |||||||||||||||||||||||||||||||||||||||||||
| Asset Management | ||||||||||||||||||||||||||||||||||||||||||||||||||
| Management fees | $ | 3,471 | $ | 4,264 | $ | (793) | (18.6) | % | $ | 12,300 | $ | 12,638 | $ | (338) | (2.7) | % | ||||||||||||||||||||||||||||||||||
| Incentive fees | 431 | 742 | (311) | (41.9) | % | 1,208 | 2,653 | (1,445) | (54.5) | % | ||||||||||||||||||||||||||||||||||||||||
| Equity investment earnings | 481 | 74 | 407 | 550.0 | % | 805 | 241 | 564 | 234.0 | % | ||||||||||||||||||||||||||||||||||||||||
Interest income¹ | 275 | 274 | 1 | 0.4 | % | 814 | 817 | (3) | (0.4) | % | ||||||||||||||||||||||||||||||||||||||||
| Other fee-related income | 262 | — | 262 | NM | 262 | — | 262 | NM | ||||||||||||||||||||||||||||||||||||||||||
| Fee-related compensation | (1,175) | (1,204) | 29 | (2.4) | % | (3,777) | (3,588) | (189) | 5.3 | % | ||||||||||||||||||||||||||||||||||||||||
| Other operating expenses: | ||||||||||||||||||||||||||||||||||||||||||||||||||
| Administration and servicing fees | (896) | (921) | 25 | (2.7) | % | (2,834) | (3,501) | 667 | (19.1) | % | ||||||||||||||||||||||||||||||||||||||||
| General, administrative and other | (326) | (665) | 339 | (51.0) | % | (1,764) | (2,333) | 569 | (24.4) | % | ||||||||||||||||||||||||||||||||||||||||
| Fee related earnings | 2,523 | 2,564 | (41) | (1.6) | % | 7,014 | 6,927 | 87 | 1.3 | % | ||||||||||||||||||||||||||||||||||||||||
______________
Note: “NM” denotes not meaningful.
(1)Represents interest income on a loan asset related to a fee generating vehicle
85
Three Months Ended September 30, 2025 Compared to Three Months Ended September 30, 2024
In this section, references to 2025 refer to the three months ended September 30, 2025, and references to 2024 refer to the three months ended September 30, 2024.
FRE was $2.5 million in 2025, remaining relatively flat compared to $2.6 million in 2024. FRE was relatively flat primarily because the decrease in management and incentive fees was offset by the increase in equity investment earnings and other fee-related income, and the decrease in general, administrative and other expenses.
Management fees decreased by $0.8 million primarily driven by the merging of Logan Ridge into Portman Ridge on July 15, 2025 and the wind down of the Ovation funds. The existing Logan Ridge IMA agreement was terminated and therefore, the Company's management fee stream from Logan Ridge ceased. The Ovation fee stream decreased as the fund continues to wind down. This decrease in fees was slightly offset by increased management fees from Ability and OCIF as fee earning AUM increased, and the new fee stream from the IMA signed with Vista in 2025.
Incentive fees decreased by $0.3 million primarily driven by investment write-downs in the Ovation funds which resulted in $nil Ovation incentive fees being earned in 2025, compared to $0.3 million earned in 2024. Given the underlying Ovation fund is in wind down, no further incentive fees are anticipated to be earned going forward.
Equity investment earnings increased by $0.4 million due to better net income results in SCIM, which were driven by the decrease in professional fee spend due to active management efforts to reduce costs, and elimination of the legacy cost reimbursement program at SCIM upon the Logan Ridge and Portman Ridge merger. SCIM was the adviser of Portman Ridge and effective July 15, 2025, upon closing of the merger of Logan Ridge and Portman Ridge, became the advisor to the combined company, renamed BCP Investment Corporation (“BCIC”).
Other fee-related income represents the income earned from the new profit sharing agreement entered into in July 2025 between Mount Logan and the owner of SCIM. This fee represents 16.03% of the distributions received by the parent entity of SCIM via the profit sharing agreement.
General, administrative and other expenses decreased by $0.3 million due to lower professional fees incurred by the Asset Management segment.
Fee-related compensation remained relatively flat as lower bonus payments in 2025, reflecting declining performance of the Ovation fund, which is currently in wind down, were partially offset by severance costs to reduce headcount.
Nine Months Ended September 30, 2025 Compared to Nine Months Ended September 30, 2024
In this section, references to 2025 refer to the nine months ended September 30, 2025, and references to 2024 refer to the nine months ended September 30, 2024.
FRE remained relatively flat at $7.0 million in 2025 and 2024 as the decrease in management and incentive fees, plus increase in fee-related compensation, were offset by the increase in equity investment earnings and other fee-related income, and the decrease in administration and servicing fees as well as lower general, administrative, and other expenses.
Management fees decreased by $0.3 million primarily due to the merging of Logan Ridge into Portman Ridge on July 15, 2025, and the wind down of the Ovation funds. The existing Logan Ridge IMA was terminated and therefore, the Company's management fee stream from Logan Ridge ceased. The Ovation fee stream decreased as the fund continues to wind down. The decrease in fees was partially offset by the Vista investment management agreement, which commenced during the first quarter of 2025 and the increase in AUM across OCIF and a closed end private fund sub-advised by ML Management.
Incentive fees decreased by $1.4 million primarily driven by investment write-downs in the Ovation funds which resulted in $nil Ovation incentive fees being earned in 2025, compared to $1.5 million earned in 2024. Given
86
the underlying Ovation fund is in wind down, no further incentive fees are anticipated to be earned going forward. The decrease was partially offset by the slight increase in OCIF incentive fees between 2024 and 2025.
Equity investment earnings increased by $0.6 million due to better net income results in SCIM, which were primarily driven by the decrease in professional fee spend due to active management efforts to reduce costs and elimination of the legacy cost reimbursement program at SCIM upon the Logan Ridge and Portman Ridge merger.
Other fee-related income represents the income earned from the new profit sharing agreement entered into in July 2025 between Mount Logan and the owner of SCIM. This fee represents 16.03% of the distributions received by the parent entity of SCIM via the profit sharing agreement.
Fee-related compensation increased due to the transfer of compensation costs in Q4 2024 from the SCIM servicing agreement in relation to ACIF, to ML Management directly.
Administration and servicing fees decreased by $0.7 million due to lower servicing fees under the SCIM agreement regarding ACIF, lower sub-investment management expenses and lower administrative expenses in relation to a closed-end private fund that ML Management sub-advises. Servicing fees under the SCIM agreement decreased by $0.4 million due to compensation costs moving directly to Mount Logan’s fee-related compensation line and non-recurring costs incurred in 2024 related to ACIF expense write-offs. Sub-investment management expenses declined by $0.3 million due to fee waivers provided by one sub-investment manager, and administrative expenses related to a closed end private fund sub-advised by ML Management decreased due to active management efforts to reduce costs.
General, administrative and other expenses decreased by $0.6 million primarily driven by the expiration of transition services agreements on assets purchased, and the decrease in professional services fee spend due to active management efforts to reduce costs.
Asset Management Operating Metrics
Assets Under Management
The following presents Mount Logan’s total AUM by vehicle (in millions):
| Three months ended September 30, | ||||||||||||||||||||||||||||||||||||||||||||
| 2025 | ||||||||||||||||||||||||||||||||||||||||||||
| (in millions) | Ability (including consolidated VIEs) 1 | BDCs 2 | CLOs 3 | Interval Funds 4 | Ovation Funds | Other 5 | Total | |||||||||||||||||||||||||||||||||||||
Change in Total AUM6 | ||||||||||||||||||||||||||||||||||||||||||||
| Balance, Beginning of Period | $ | 827 | $ | 294 | $ | 491 | $ | 430 | $ | 113 | $ | 111 | $ | 2,266 | ||||||||||||||||||||||||||||||
| Inflows | — | 5 | — | 24 | — | — | 29 | |||||||||||||||||||||||||||||||||||||
| Outflows | — | (20) | — | (47) | (5) | (29) | (101) | |||||||||||||||||||||||||||||||||||||
| Net Flows | — | (15) | — | (23) | (5) | (29) | (72) | |||||||||||||||||||||||||||||||||||||
| Realizations | — | (4) | (16) | (7) | (1) | — | (28) | |||||||||||||||||||||||||||||||||||||
| Market activity and other | 9 | (66) | (1) | — | 2 | 2 | (54) | |||||||||||||||||||||||||||||||||||||
Inter-vehicle eliminations7 | — | — | — | (4) | — | — | (4) | |||||||||||||||||||||||||||||||||||||
| Balance, End of Period | $ | 836 | $ | 209 | $ | 474 | $ | 396 | $ | 109 | $ | 84 | $ | 2,108 | ||||||||||||||||||||||||||||||
87
| Three months ended September 30, | ||||||||||||||||||||||||||||||||||||||||||||
| 2024 | ||||||||||||||||||||||||||||||||||||||||||||
| (in millions) | Ability (including consolidated VIEs) 1 | BDCs 2 | CLOs 3 | Interval Funds 4 | Ovation Funds | Other 5 | Total | |||||||||||||||||||||||||||||||||||||
Change in Total AUM6 | ||||||||||||||||||||||||||||||||||||||||||||
| Balance, Beginning of Period | $ | 751 | $ | 326 | $ | 590 | $ | 408 | $ | 256 | $ | 112 | $ | 2,443 | ||||||||||||||||||||||||||||||
| Inflows | — | 21 | — | 36 | — | 3 | 60 | |||||||||||||||||||||||||||||||||||||
| Outflows | (2) | (42) | — | (29) | (5) | — | (78) | |||||||||||||||||||||||||||||||||||||
| Net Flows | (2) | (21) | — | 7 | (5) | 3 | (18) | |||||||||||||||||||||||||||||||||||||
| Realizations | — | (3) | (12) | (7) | (5) | — | (27) | |||||||||||||||||||||||||||||||||||||
| Market activity and other | 18 | — | 2 | (23) | (1) | (3) | (7) | |||||||||||||||||||||||||||||||||||||
Inter-vehicle eliminations7 | — | — | — | (6) | — | — | (6) | |||||||||||||||||||||||||||||||||||||
| Balance, End of Period | $ | 767 | $ | 302 | $ | 580 | $ | 379 | $ | 245 | $ | 112 | $ | 2,385 | ||||||||||||||||||||||||||||||
| Nine months ended September 30, | ||||||||||||||||||||||||||||||||||||||||||||
| 2025 | ||||||||||||||||||||||||||||||||||||||||||||
| (in millions) | Ability (including consolidated VIEs) 1 | BDCs 2 | CLOs 3 | Interval Funds 4 | Ovation Funds | Other 5 | Total | |||||||||||||||||||||||||||||||||||||
Change in Total AUM6 | ||||||||||||||||||||||||||||||||||||||||||||
| Beginning of Period | $ | 746 | $ | 306 | $ | 564 | $ | 410 | $ | 212 | $ | 111 | $ | 2,349 | ||||||||||||||||||||||||||||||
| Inflows | 97 | 5 | — | 90 | — | 8 | 200 | |||||||||||||||||||||||||||||||||||||
| Outflows | (26) | (23) | — | (99) | (107) | (46) | (301) | |||||||||||||||||||||||||||||||||||||
| Net Flows | 71 | (18) | — | (9) | (107) | (38) | (101) | |||||||||||||||||||||||||||||||||||||
| Realizations | — | (6) | (79) | (21) | (10) | (1) | (117) | |||||||||||||||||||||||||||||||||||||
| Market activity and other | 19 | (73) | (11) | 20 | 14 | 12 | (19) | |||||||||||||||||||||||||||||||||||||
Inter-vehicle eliminations7 | — | — | — | (4) | — | — | (4) | |||||||||||||||||||||||||||||||||||||
| End of Period | $ | 836 | $ | 209 | $ | 474 | $ | 396 | $ | 109 | $ | 84 | $ | 2,108 | ||||||||||||||||||||||||||||||
| Nine months ended September 30, | ||||||||||||||||||||||||||||||||||||||||||||
| 2024 | ||||||||||||||||||||||||||||||||||||||||||||
| (in millions) | Ability (including consolidated VIEs) 1 | BDCs 2 | CLOs 3 | Interval Funds 4 | Ovation Funds | Other 5 | Total | |||||||||||||||||||||||||||||||||||||
Change in Total AUM6 | ||||||||||||||||||||||||||||||||||||||||||||
| Beginning of Period | $ | 695 | $ | 334 | $ | 634 | $ | 343 | $ | 255 | $ | 66 | $ | 2,327 | ||||||||||||||||||||||||||||||
| Inflows | 76 | 37 | — | 142 | 8.00 | 44 | 307 | |||||||||||||||||||||||||||||||||||||
| Outflows | (22) | (57) | — | (71) | (10) | — | (160) | |||||||||||||||||||||||||||||||||||||
| Net Flows | 54 | (20) | — | 71 | (2) | 44 | 147 | |||||||||||||||||||||||||||||||||||||
| Realizations | — | (9) | (59) | (21) | (13) | — | (102) | |||||||||||||||||||||||||||||||||||||
| Market activity and other | 18 | (3) | 5 | (8) | 5 | 2 | 19 | |||||||||||||||||||||||||||||||||||||
Inter-vehicle eliminations7 | — | — | — | (6) | — | — | (6) | |||||||||||||||||||||||||||||||||||||
| End of Period | $ | 767 | $ | 302 | $ | 580 | $ | 379 | $ | 245 | $ | 112 | $ | 2,385 | ||||||||||||||||||||||||||||||
_______________
(1)Ability’s AUM excludes assets held under the funds withheld and Modco agreements, and includes a portion of the Vista assets to which ML Management was appointed as the investment manager of, effective March 2025,
(2)ML Management owns a 24.99% interest in SCIM, which is the manager of BCP Investment Corporation (“BCIC”). BCIC is the new merged entity of Portman Ridge and Logan Ridge, which closed on July 15, 2025. Prior to Logan Ridge merging into Portman, ML Management was the manager of Logan Ridge.
(3)ML Management is the adviser to two CLOs 2018-01 and 2019-01.
88
(4)ML Management is the adviser to OCIF. Separately Mount Logan receives the economics of ACIF, which is an interval fund advised by SCIM, via a servicing agreement with SCIM over ACIF.
(5)Consists of several small closed end private funds and AUM which is sub-advised by ML Management
(6)Inflows generally represent new capital which includes capital contributions, subscriptions, dividend reinvestments, draw downs on leverage facilities, and new MYGA flows and managed reinsurance assets added at Ability. Outflows include redemptions, pay downs on leverage facilities, and claims and benefits payments at Ability. Realizations represent distributions of realized income, repurchases of capital, and repayments on CLO notes. Market activity and other generally represents realized and unrealized gains (losses) on investments and other changes in AUM.
(7)Represents ACIF’s investment in OCIF.
(8)Several of the above funds are still subject to their reporting period audit reviews, thus the AUM quoted above represents management’s best estimate of AUM as of September 30, 2025, but may be subject to change.
Three months ended September 30, 2025
Total AUM was $2.1 billion at September 30, 2025, a $0.2 million decrease from $2.3 billion at June 30, 2025. The decrease is attributable to decreases in AUM across the BDCs, CLOs, Interval funds, Ovation funds and a fund sub-advised by ML Management. BDC AUM decreased given Logan Ridge merged into Portman Ridge and became the combined entity BCIC on July 15, 2025. ML Management through its 24.99% ownership of BCIC’s manager SCIM, is only exposed to 24.99% of BCIC’s AUM, compared to 100% of Logan’s AUM previously. CLO assets will continue to decline given both are in post reinvestment period and continue to harvest their assets. The decrease in the Interval funds’ AUM was driven by the decline in AUM in OCIF due to redemptions outweighing fundraising. Ovation funds’ AUM will continue to decline pursuant to their wind down. The AUM ML Management sub-advises decreased due to distributions and redemptions.
Nine months ended September 30, 2025
Total AUM was $2.1 billion at September 30, 2025, a $0.2 million decrease from $2.3 billion at December 31, 2024. The decrease is attributable to decreases in AUM across the BDCs, CLOs, Interval funds, Ovation funds, and small closed end private funds. BDC assets decreased due to the termination of the Logan Ridge IMA as well as due to underlying decline in performance of assets in the portfolio of BCIC - the new merged entity of Portman and Logan. CLO assets will continue to decline given both are in post reinvestment period and continue to harvest their assets. Redemptions in OCIF drove the decrease in Interval funds’ AUM. Ovation funds’ AUM will also continue to decline pursuant to their wind down. The AUM of a small closed end private fund decreased due to a capital distribution after realizing its last investment, and the AUM ML Management sub-advises decreased due to distributions and redemptions. The total decrease in AUM was offset by increases in AUM attributable to growth in Ability’s AUM from additional capital contribution, the addition of a portion of the Vista portfolio of assets to which Mount Logan has been appointed manager, and new MYGA business assumed.
Insurance Solutions
The following tables present Spread Related Earnings, the performance measure of Mount Logan’s Insurance Solutions segment:
| Three Months Ended September 30, | Nine Months Ended September 30, | |||||||||||||||||||||||||||||||||||||||||||||||||
| 2025 | 2024 | Change ($) | Change (%) | 2025 | 2024 | Change ($) | Change (%) | |||||||||||||||||||||||||||||||||||||||||||
| Insurance Solutions | ||||||||||||||||||||||||||||||||||||||||||||||||||
| Net investment income and realized gain (loss), net | 12,034 | 13,760 | (1,726) | (12.5) | % | 36,041 | 40,647 | (4,606) | (11.3) | % | ||||||||||||||||||||||||||||||||||||||||
| Cost of funds | (7,273) | (7,098) | (175) | 2.5 | % | (23,946) | (17,347) | (6,599) | 38.0 | % | ||||||||||||||||||||||||||||||||||||||||
| Compensation and benefits | (73) | (471) | 398 | (84.5) | % | (540) | (1,120) | 580 | (51.8) | % | ||||||||||||||||||||||||||||||||||||||||
| Interest expense | (408) | (328) | (80) | 24.4 | % | (1,143) | (984) | (159) | 16.2 | % | ||||||||||||||||||||||||||||||||||||||||
| General, administrative and other | (3,153) | (3,692) | 539 | (14.6) | % | (9,340) | (11,609) | 2,269 | (19.5) | % | ||||||||||||||||||||||||||||||||||||||||
| Spread related earnings | 1,127 | 2,171 | (1,044) | (48.1) | % | 1,072 | 9,587 | (8,515) | (88.8) | % | ||||||||||||||||||||||||||||||||||||||||
89
Three Months Ended September 30, 2025 Compared to Three Months Ended September 30, 2024
In this section, references to 2025 refer to the three months ended September 30, 2025, and references to 2024 refer to the three months ended September 30, 2024.
Spread Related Earnings
SRE was $1.1 million in 2025, a decrease of $1.0 million, or 50%, compared to $2.2 million in 2024. The decrease in SRE was primarily driven by lower investment income and realized gains (losses) net and higher cost of funds, partially offset by lower general, administrative & other expenses.
Net investment income and realized gains (losses) net decreased by $1.7 million. Net investment income decreased due to lower treasury yields and and higher realized losses in 2025 compared to 2024.
Cost of funds increased by $0.2 million, primarily due to increased DAC amortization from the assumption of the NSG MYGA block and increased surrenders of existing MYGA policies. This increase was partially offset by reduced claims in 2025 compared to 2024.
General, administrative & other expenses decreased by $0.5 million in 2025 primarily due to the absence of new MYGA business, which reduced MYGA related costs. Additionally, consulting, legal, and valuation expenses declined in 2025 compared to 2024.
Net Investment Spread
| Three Months Ended September 30, | ||||||||||||||||||||
| 2025 | 2024 | Change | ||||||||||||||||||
| Net investment income and realized gain or (loss), net | 1.55% | 1.87% | -32bps | |||||||||||||||||
Cost of funds¹ | (1.43)% | (1.47)% | 04bps | |||||||||||||||||
| Net Investment spread | 0.12% | 0.40% | -28bps | |||||||||||||||||
| Nine Months Ended September 30, | ||||||||||||||||||||
| 2025 | 2024 | Change | ||||||||||||||||||
| Net investment income and realized gain or (loss), net | 4.73% | 5.71% | -98bps | |||||||||||||||||
Cost of funds¹ | (4.05)% | (3.99)% | -05bps | |||||||||||||||||
| Net Investment spread | 0.69% | 1.72% | -103bps | |||||||||||||||||
_______________
(1)Excludes changes in future policy benefits liabilities of LTC line of business, to calculate net investment spread, which result from changes in actuarial assumptions and future cash flow projections.
Net investment spread measures Insurance Solutions segment’s investment performance less its total cost of funds excluding changes in future policy benefits liabilities of LTC line of business, for interim periods.
Net investment spread was 0.12% in 2025, a decrease of 28 basis points compared to 0.4% in 2024, primarily driven by lower net investment income and realized gain or (loss), partially offset by lower cost of funds in 2025 compared to 2024.
Net investment income and realized gain or (loss) percent represents a percent of net investment income and realized gain (loss) over average net invested assets. Net investment income and realized gain (loss) was 1.55% in 2025, a decrease of 32 basis points compared to 1.87% in 2024, primarily driven by higher average net invested assets, lower treasury yields, and higher realized losses.
Cost of funds percent represents the percent of cost of funds over average net invested assets. Cost of funds were lower in 2025 compared to 2024 primarily due to the magnitude of the favorable claims experience in the LTC business, partially offset by increased DAC amortization due to the assumption of the NSG MYGA block and increased surrenders of existing MYGA policies.
90
Net invested assets represent investments that directly back Insurance Solutions segment’s net reserve liabilities as well as surplus assets. Net invested assets for Insurance Solutions segment includes (a) total investments on the consolidated statements of financial position, with available-for-sale securities, trading securities and mortgage loans at cost or amortized cost, (b) cash and cash equivalents and restricted cash, (c) investments in related parties, (d) accrued investment income, (e) VIE assets, and (f) net investment payables and receivables. Net invested assets exclude the investment assets under funds withheld arrangement with FSR and assets under Modco agreement with Vista. Net invested assets also exclude mark-to-market adjustment (net unrealized gains (losses)) including provision for credit losses recognized in consolidated statement of operations during the year.
Nine Months Ended September 30, 2025 Compared to Nine Months Ended September 30, 2024
In this section, references to 2025 refer to the nine months ended September 30, 2025, and references to 2024 refer to the nine months ended September 30, 2024.
Spread Related Earnings
SRE was $1.1 million in 2025, a decrease of $8.5 million, or 89%, compared to $9.6 million in 2024. The decrease in SRE was primarily driven by lower investment income and realized gains (losses) net and higher cost of funds, partially offset by lower general, administrative & other expenses.
Net investment income and realized gains (losses) net decreased by $4.6 million. Net investment income decreased due to lower treasury yields and higher realized losses in 2025 compared to 2024.
Cost of funds increased by $6.6 million, primarily due to the one-time benefit of an in-force update in the LTC business in the first quarter of 2024 which was not present in 2025, increased DAC amortization from the assumption of the NSG MYGA block in the second quarter of 2025, as well as higher claims experience in the LTC business in 2025.
General, administrative & other expenses decreased by $2.3 million in 2025 due to a reduction in new MYGA business in 2025 compared to 2024, which reduced MYGA related costs. Additionally, consulting and legal expenses declined and valuation costs were reduced in 2025 following the transition to a new valuation service provider in the fourth quarter of 2024.
Net Investment Spread
Net investment spread was 0.69% in 2025, a decrease of 103 basis points compared to 1.72% in 2024, primarily driven by lower net investment income and realized gain or (loss) and higher costs of funds in 2025 compared to 2024.
Net investment income and realized gain or (loss) percent represents a percent of net investment income and realized gain (loss) over average net invested assets. Net investment income and realized gain (loss) was 4.73% in 2025, a decrease of 98 basis points compared to 5.71% in 2024, primarily driven by higher average net invested assets, lower treasury yields and higher realized losses.
Cost of funds percent represents the percent of cost of funds over average net invested assets. Cost of funds were higher in 2025 compared to 2024 primarily due to increased DAC amortization due to the assumption of the NSG MYGA block as well as unfavorable claims experience in the LTC business.
Investment Portfolio
Ability had total investments, including related parties and consolidated VIEs, of $1,054 million and $1,057 million as of September 30, 2025, and September 30, 2024, respectively. Total investments have decreased by 0.3% compared to 2024, which is primarily driven by the dispositions of investment assets. Ability’s investment strategy seeks to achieve sustainable risk-adjusted returns through the disciplined management of its investment portfolio against its duration of liabilities. The investment strategies focus primarily on a buy and hold asset allocation strategy that may be adjusted periodically in response to changing market conditions and the nature of Ability’s liability profile. Ability takes advantage of its generally persistent liability profile by identifying investment
91
opportunities with an emphasis on earning incremental yield by taking measured liquidity and complexity risk rather than assuming incremental credit risk. Ability has selected a diverse array of primarily high-grade fixed income assets including corporate bonds, structured securities and commercial real estate loans, among others. Ability also maintains holdings in floating rate and less rate-sensitive instruments, including CLOs, non-agency RMBS and various types of structured products, both as an expression of its macroeconomic views as well as to capture incremental returns versus fixed rate instruments. Depending on its market outlook, Ability will use financial hedges to increase or reduce its exposure to various macroeconomic factors, including interest rate, foreign currency exchange rate, and / or performance of market indices. In addition to its fixed income portfolio, Ability opportunistically allocates to alternative investments where it primarily focuses on fixed income-like, cash flow-based investments.
Liquidity and Capital Resources
Overview
Mount Logan primarily derives revenues and cash flows from the assets it manages and the retirement savings products it issues and reinsures. Based on management’s experience, Mount Logan believes that its current liquidity position, together with the cash generated from revenues will be sufficient to meet Mount Logan’s anticipated expenses and other working capital needs for at least the next 12 months. For the longer-term liquidity needs of the Asset Management business, Mount Logan expects to continue to fund the Asset Management business’s operations through management fees and incentive fees received. The principal sources of liquidity for the Insurance Solutions segment, in the ordinary course of business, are operating cash flows and holdings of cash, cash equivalents and other readily marketable assets. At September 30, 2025, Mount Logan had $151.8 million of unrestricted cash and cash equivalents.
Primary Uses of Cash
Over the next 12 months, Mount Logan expects its primary liquidity needs will be to:
•support the future growth of Mount Logan's businesses through strategic corporate investments;
•pay Mount Logan’s operating expenses, including, compensation, general, administrative, and other expenses;
•make payments to policyholders for surrenders, withdrawals and payout benefits;
•make interest and principal payments on funding agreements;
•pay taxes; and
•pay cash dividends.
Over the long term, Mount Logan believes it will be able to (i) grow Mount Logan's Assets Under Management and generate positive investment performance in the funds Mount Logan manages, which it expects will allow us to grow its management fees and incentive fees and (ii) grow the investment portfolio of insurance solutions services, in each case in amounts sufficient to cover Mount Logan’s long-term liquidity requirements, which may include:
•supporting the future growth of our businesses;
•creating new or enhancing existing products and investment platforms;
•making payments to policyholders;
•pursuing new strategic corporate investment opportunities; and
•paying interest and principal on Mount Logan’s financing arrangements.
92
Cash Flow Analysis
The section below discusses in more detail Mount Logan’s primary sources and uses of cash and the primary drivers of cash flows within Mount Logan’s condensed consolidated statements of cash flows:
| Nine months ended September 30, | ||||||||||||||
| (in thousands) | 2025 | 2024 | ||||||||||||
| Operating activities | $ | (25,640) | $ | (21,866) | ||||||||||
| Investing activities | $ | 71,018 | $ | (22,177) | ||||||||||
| Financing activities | $ | 14,734 | $ | 66,951 | ||||||||||
| Cash, cash equivalents and restricted cash, and cash and cash equivalents of consolidated VIEs, end of period | $ | 161,815 | $ | 113,129 | ||||||||||
Operating Activities
Mount Logan’s operating activities support its Asset Management and Insurance Solutions businesses. The primary sources of cash within operating activities include: (a) management and performance fees, (b) insurance premiums, (c) reinsurance recoverable, (d) proceeds from sales of investments from Mount Logan’s consolidated VIEs and (e) cash interest received from investments. The primary uses of cash within operating activities include: (a) investment purchases from Mount Logan’s consolidated VIEs (b) compensation and non-compensation related expenses, (c) benefit payments, (d) cash interest paid on debt obligations and (e) other operating expenses. A significant use of cash within operating activities pertain to future policy benefits incurred in the LTC business. As the LTC business is in run-off, this activity is expected to have less of an impact to cash outflow over time.
•During the nine months ended September 30, 2025 and September 30, 2024, cash used in operating activities reflects Asset Management expense reimbursements to BCPA under the servicing agreement for third-party costs incurred, interest expense on borrowings, compensation and quarterly tax payments. Cash used in operating activities also reflects net cash benefit payments associated with the LTC business, purchases of investments by consolidated VIEs, policy acquisition costs, and other operating expenses within Insurance Solutions. These outflows were partially offset by inflows of management fees, realized incentive fees, and distributions from SCIM within Asset Management, and investment income, reinsurance recoverables related to the LTC business and proceeds from the sale of investments held by consolidated VIEs within Insurance Solutions.
Investing Activities
Mount Logan’s investing activities support the growth of its business. The primary sources of cash within investing activities include sales, maturities and repayments of investments. The primary uses of cash within investing activities include: (a) acquisition of consolidated business(es) and (b) purchases and acquisitions of new investments. The cash flow activities related to MYGA products is split across investing activities and financing activities. As Mount Logan assumes new MYGA products, the receipt of cash is reported in financing activities and the corresponding purchase of securities is reported in investing activities. As a result, as the MYGA portfolio grows, these cash flow activities while related, will continue to present an inflow to financing activities and an outflow to investing activities.
•During the nine months ended September 30, 2025, cash provided by investing activities primarily reflects the net assets acquired from the reverse acquisition of TURN, and sales, maturities and repayment of investments, partially offset by purchase of investments, mainly available-for-sale (“AFS”) and mortgage loans within Insurance Solutions.
•During the nine months ended September 30, 2024, cash used in investing activities primarily reflects the purchase of investments due to the deployment of significant cash inflows from the reinsurance of MYGA contracts within Insurance Solutions, partially offset by the sales, maturities and repayments of investments.
93
Financing Activities
Mount Logan’s financing activities reflect its capital market transactions and transactions with equity holders. The primary sources of cash within financing activities primarily include proceeds from debt issuances and proceeds from reinsurance of MYGA. The primary uses of cash within financing activities include dividends paid and repayments of debt.
•During the nine months ended September 30, 2025, cash provided by financing activities primarily reflects deposits from the assumption of the NSG MYGA block as well as increased borrowings in the Insurance Solutions segment. These inflows were partially offset by surrenders or benefit payments related to MYGA policies (classified as investment-type contracts) within the Insurance Solutions segment, and the repayment of debt within the Asset Management segment, payment of dividends and repurchase of common shares.
•During the nine months ended September 30, 2024, cash provided by financing activities primarily reflects proceeds from the issuance of debenture units under the Asset Management segment and net inflows associated with the reinsurance of new MYGA contracts within the Insurance Solutions segment. These inflows were partially offset by repayments on borrowings within Asset Management and dividend payments.
Contractual Obligations, Commitments and Contingencies
For a summary and a description of the nature of Mount Logan’s commitments, contingencies and contractual obligations, see Note 24. Commitments and contingencies to the condensed consolidated financial statements.
Consolidated VIEs
Mount Logan manages its liquidity needs by evaluating unconsolidated cash flows; however, Mount Logan’s financial statements reflect the financial position of Mount Logan as well as consolidated VIEs. The primary sources and uses of cash at Mount Logan's consolidated VIEs include: (a) proceeds from sales, maturities and repayments of investments and (b) purchase of investments.
Dividends and Distributions
For information regarding the quarterly dividends that were made to common shareholders and distribution equivalents on participating securities, see Note 19. Equity to the condensed consolidated financial statements. Although Mount Logan currently expects to pay dividends, Mount Logan may not pay dividends if, among other things, Mount Logan does not have the cash necessary to pay the dividends. To the extent it does not have sufficient cash on hand to pay dividends, Mount Logan may have to borrow funds to pay dividends, or it may determine not to pay dividends. The primary source of funds for dividends is distributions from Mount Logan’s operating subsidiaries, which are expected to be adequate to fund dividends and other cash flow requirements based on current estimates of future obligations. The ability of these operating subsidiaries to make distributions to Mount Logan will depend on satisfying applicable law with respect to such distributions, including surplus and minimum solvency requirements among others. On March 13, 2025 Mount Logan declared a cash dividend of C$0.08 per share of its common stock, which was paid on April 10, 2025, to holders of record at the close of business on April 3, 2025. On May 15, 2025 Mount Logan declared a cash dividend of C$0.08 per share of its common stock, which was paid on June 2, 2025, to holders of record at the close of business on May 27, 2025. On August 7, 2025, Mount Logan declared a cash dividend of C$0.08 per share of its common stock, which was paid on August 25, 2025, to holders of record at the close of business on August 19, 2025. On November 5, 2025, Mount Logan declared a cash dividend in the amount of US$0.03 per common share to be paid on December 11, 2025 to shareholders of record on November 25, 2025.
94
Asset Management Liquidity
Mount Logan’s Asset Management business requires limited capital resources to support the working capital or operating needs of the business. For the Asset Management business’s longer term liquidity needs, Mount Logan expects to continue to fund the Asset Management business’s operations through management fees and performance fees received. Liquidity needs are also met through proceeds from borrowings and equity issuances as described in Note 12. Debt obligations and Note 19. Equity to the condensed consolidated financial statements, respectively. From time to time, if Mount Logan determines that market conditions are favorable after taking into account Mount Logan’s liquidity requirements, we may seek to raise proceeds through the issuance of additional debt or equity instruments.
At September 30, 2025, the Asset Management business had $22.3 million of unrestricted cash and cash equivalents.
Future Debt Obligations
The Asset Management business had long-term debt outstanding of $74.3 million at September 30, 2025, which includes notes with maturities in 2025, 2027, 2031 and 2032. There are also scheduled incremental repayments of principal on the credit facility in 2025 and 2026. See Note 12. Debt obligations to the condensed consolidated financial statements for further information regarding the Asset Management business’s debt arrangements.
Future Cash Flows
Mount Logan’s ability to execute Mount Logan’s business strategy, particularly Mount Logan’s ability to increase Mount Logan’s AUM, depends on Mount Logan’s ability to establish new funds and to raise additional investor capital within such funds. Mount Logan’s liquidity will depend on a number of factors, such as Mount Logan’s ability to project our financial performance, which is highly dependent on the funds it manages and its ability to manage our projected costs, fund performance, access to credit facilities, compliance with the existing credit agreement, as well as industry and market trends. Also during economic downturns the funds Mount Logan manages might experience cash flow issues or liquidate entirely. In these situations, Mount Logan might be asked to reduce or eliminate the management fee and incentive fees it charges, which could adversely impact Mount Logan’s cash flow in the future. An increase in the fair value of the investments of the funds Mount Logan manages, by contrast, could favorably impact its liquidity through higher management fees where the management fees are calculated based on the net asset value, gross assets or adjusted assets. Additionally, higher incentive fees not yet realized would generally result when investments appreciate over their cost basis which would not have an impact on the Asset Management business’s cash flow until realized.
Consideration of Financing Arrangements
As noted above, the Asset Management business has and may continue to issue debt to supplement its liquidity. The decision to enter into a particular financing arrangement is made after careful consideration of various factors, including the Asset Management business’s cash flows from operations, future cash needs, current sources of liquidity, demand for the Asset Management business’s debt or parent's equity, and prevailing interest rates.
Insurance Solutions Liquidity and funding risk
Liquidity risk is the risk that an entity will encounter difficulty in meeting obligations associated with its financial liabilities as they fall due or can only do so on terms that are materially disadvantageous. Prudent liquidity risk management includes maintaining sufficient cash on hand and the availability of funding through an adequate amount of committed credit facilities. Mount Logan also has the ability to raise additional liquidity through the issuance of debt, and through the sale of its portfolio investments. Periodic cash flow forecasts are performed to ensure Ability has sufficient cash to meet operational and financing costs.
95
Liquid assets
Liquid assets, including high-quality assets that are marketable, can be pledged as security for borrowings, and can be converted to cash in a time frame that meets liquidity and funding requirements.
| As at | September 30, 2025 | December 31, 2024 | ||||||||||||
Cash and cash equivalents1 | $ | 129,565 | $ | 77,055 | ||||||||||
| Restricted cash | 9,967 | 15,716 | ||||||||||||
| Investments | 608,851 | 637,048 | ||||||||||||
| Receivable for investments sold | 2,699 | 17,045 | ||||||||||||
Accrued interest and dividend receivable1 | 19,359 | 18,580 | ||||||||||||
| Total liquid assets | $ | 770,441 | $ | 765,444 | ||||||||||
_______________
(1)Cash and cash equivalents and accrued interest & dividend receivable includes cash and cash equivalent and accrued interest of consolidated VIEs, respectively.
The liquid assets held by Mount Logan's insurance company, Ability, are subject to restrictions which prevent Mount Logan from transferring these assets to other entities within the group without insurance regulatory approvals. These assets are not restricted for use within the insurance company.
Insurance Subsidiaries’ Operating Liquidity
The primary cash flow sources for Ability include retirement services product inflows, investment income, and principal repayments on its investments. Uses of cash include investment purchases, payments to policyholders for surrenders, withdrawals and payout benefits, interest and principal payments on funding agreements and outstanding debt, policy acquisition and general operating costs.
Ability’s policyholder obligations are generally long-term in nature. However, policyholders may elect to withdraw some, or all, of their account value in amounts that exceed Ability’s estimates and assumptions over the life of an annuity contract. Ability includes provisions within its annuity policies, such as surrender charges and market value adjustments, which are intended to protect it from early withdrawals. As of September 30, 2025, and September 30, 2024, approximately 77% and 76%, respectively, of Ability’s MYGA policies were subject to penalty upon surrender. In addition, as of September 30, 2025, and September 30, 2024, approximately 60% and 58%, respectively, of policies contained Market Value Adjustments (“MVAs”) that may also have the effect of limiting early withdrawals if interest rates increase but may encourage early withdrawals by effectively subsidizing a portion of surrender charges when interest rates decrease.
Dividends from Insurance Subsidiaries
The NAIC has established minimum capital requirements in the form of RBC that factors the type of business written by an insurance company, the quality of its assets and various other aspects of its business to develop a minimum level of capital known as “authorized control level risk-based capital” and compares this level to adjusted statutory capital that includes capital and surplus as reported under SAP, plus certain investment reserves. Should the ratio of adjusted statutory capital to control level RBC fall below 200%, a series of remedial actions by the affected company would be required. As of December 31, 2024, and 2023, the RBC ratio of Ability was 325% and 400%, respectively.
The ability to pay dividends is limited by applicable laws and regulations of the jurisdiction where Ability is domiciled, as well as agreement(s) entered into with regulators. These laws and regulations require, among other things, Ability to maintain minimum solvency requirements and limit the amount of dividends Ability can pay. Nebraska state insurance laws and regulations require that the statutory surplus following any dividend or distribution must be reasonable in relation to their outstanding liabilities and adequate for its financial needs.
96
Future Debt Obligations
Ability had long-term debt of $17.3 million as of September 30, 2025, which includes notes with maturities in 2028, 2032, and 2033. See Note 12. Debt obligations to the condensed consolidated financial statements for further information regarding Ability’s debt arrangements.
Capital
Ability believes it has a strong capital position and is well positioned to meet policyholder and other obligations. Ability measures capital sufficiency using various internal capital metrics which reflect management’s view on the various risks inherent to its business, the amount of capital required to support its core operating strategies and the amount of capital necessary to maintain its current ratings in a recessionary environment. The amount of capital required to support Ability’s core operating strategies is determined based upon internal modeling and analysis of economic risk, as well as inputs from rating agency capital models and consideration of NAIC risk-based capital (“RBC”) requirements. Capital in excess of this required amount is considered excess equity capital, which is available to deploy. As of December 31, 2024, and December 31, 2023, Ability’s RBC ratio was 325% and 400%, respectively. The formulas for determining the amount of RBC specify various weighting factors that are applied to financial balances or various levels of activity based on the perceived degree of risk.
Critical Accounting Estimates
This Management’s Discussion and Analysis of Financial Condition and Results of Operations is based upon the consolidated financial statements, which have been prepared in accordance with U.S. GAAP. The preparation of financial statements in accordance with U.S. GAAP requires the use of estimates and assumptions that could affect the reported amounts of assets and liabilities, the disclosure of contingent assets and liabilities and the reported amounts of revenues and expenses. Actual results could differ from these estimates. A summary of our significant accounting policies is presented in Note 2. Summary of significant accounting policies to our condensed consolidated financial statements. The following is a summary of our accounting policies that are affected most by judgments, estimates and assumptions.
Critical Accounting Estimates - Overall
Consolidation
Mount Logan assesses all entities in which Mount Logan has a variable interest for consolidation including management companies, insurance companies, investment companies, collateralized loan obligations (“CLOs”), and other entities. A variable interest is an investment or other interest that will absorb portions of an entity’s expected losses and/or receive expected residual returns. Fees earned by Mount Logan that (i) include terms, conditions, or amounts that are customarily present in arrangements for similar services negotiated at arm’s length, (ii) are commensurate with the level of effort required to provide those services, and (iii) where Mount Logan does not hold other economic interests in the entity that would absorb more than an insignificant amount of the expected losses or returns of the entity, would not be considered to be variable interests.
Pursuant to its consolidation policy, once Mount Logan determines it has a variable interest in an entity, Mount Logan considers whether the entity is a VIE. Entities that do not qualify as VIEs are assessed for consolidation as voting interest entities ("VOEs") under the voting interest model.
An entity is a VIE if one of the following conditions exist: (a) the equity at risk is not sufficient for the entity to finance its activities without additional subordinated financial support, (b) the holders of the equity at risk (as a group) lack the ability to make decisions about the activities that most significantly impact the entity’s economic performance, or (c) the voting rights of some investors are disproportionate to their obligation to absorb the expected losses of the legal entity, their rights to receive the expected residual returns of the legal entity, or both and substantially all of the legal entity's activities either involve or are conducted on behalf of an investor with disproportionately few voting rights. Limited partnerships and other similar entities where limited partners, not affiliated with the general partner, have not been granted (i) substantive participation rights or (ii) substantive rights to either dissolve the partnership or remove the general partner are VIEs.
97
Mount Logan consolidates VIEs in which it is the primary beneficiary. Mount Logan is the primary beneficiary if it holds a controlling financial interest which is defined as possessing both (a) the power to direct the activities of a VIE that most significantly impact the VIE's economic performance and (b) the obligation to absorb losses of the VIE or the right to receive benefits from the VIE that could potentially be significant to the VIE. Mount Logan determines whether it is the primary beneficiary of a VIE at the time it becomes involved with a VIE and reconsiders that conclusion on an ongoing basis if facts and circumstances change.
Entities determined not to be VIEs are VOEs and are evaluated under the voting interest model. Mount Logan typically consolidates VOEs when it has a majority voting interest.
Each entity is assessed for consolidation individually considering the specific facts and circumstances surrounding that entity. The consolidation assessment, including the determination whether an entity is a VIE or VOE, depends on the facts and circumstances for each entity, and therefore Mount Logan’s investment companies may qualify as VIEs or VOEs.
With respect to CLOs (which are generally VIEs), as collateral manager, Mount Logan generally has the power to direct the activities of the CLO that most significantly impact the CLO’s economic performance. In some, but not all cases, Mount Logan, through its ownership in the CLOs, may have variable interests that represent an obligation to absorb losses of, or a right to receive benefits from, the CLO that could potentially be significant to the CLO. In cases where Mount Logan has both the power to direct the activities of the CLO that most significantly impact the CLO’s economic performance and the obligation to absorb losses of the CLO or the right to receive benefits from the CLO that could potentially be significant to the CLO, Mount Logan is deemed to be the primary beneficiary and consolidates the CLO.
Assets and liabilities of the consolidated VIEs are primarily presented in separate sections within the Consolidated Statements of Financial Position. Changes in the fair value of the consolidated VIEs’ assets and liabilities and related interest, dividend and other income and expenses are primarily presented within revenues of consolidated variable interest entities and Income of consolidated variable interest entities, for the Asset Management and Insurance Solutions segments, respectively, in the Consolidated Statements of Operations.
Income Taxes
Significant judgment is required in determining tax expense and in evaluating certain and uncertain tax positions. Mount Logan recognizes the tax benefit of uncertain tax positions when the position is “more likely than not” to be sustained upon examination, including resolution of any related appeals or litigation processes, based on the technical merits of the position. The tax benefit is measured as the largest amount of benefit that has a greater than 50% likelihood of being realized upon ultimate settlement. If a tax position is not considered more likely than not to be sustained, then no benefits of the position are recognized. Mount Logan’s tax positions are reviewed and evaluated quarterly to determine whether Mount Logan has uncertain tax positions that require financial statement recognition.
Deferred tax assets and liabilities are recognized for the expected future tax consequences of differences between the carrying amount of assets and liabilities and their respective tax bases using currently enacted tax rates. The effect on deferred tax assets and liabilities of a change in tax rates is recognized in income in the period during which the change is enacted. Deferred tax assets are reduced by a valuation allowance when it is more likely than not that all or a portion of the deferred tax assets will not be realized.
Critical Accounting Estimates - Asset Management Segment
Investments, at Fair Value
On a quarterly basis, Mount Logan utilizes a valuation committee consisting of members from senior management, to review and approve the valuation results related to the investments of the funds ML Management manages. Mount Logan also retains external valuation firms to provide third-party valuation consulting services to Mount Logan, which consist of certain limited procedures that management identifies and requests them to perform. The limited procedures provided by the external valuation firms assist management with validating their valuation
98
results or determining fair value. Mount Logan performs various back-testing procedures to validate their valuation approaches, including comparisons between expected and observed outcomes, forecast evaluations and variance analyses. However, because of the inherent uncertainty of valuation, the estimated values may differ significantly from the values that would have been used had a ready market for the investments existed, and the differences could be material. The fair values of the investments in the funds Mount Logan manages can be impacted by changes to the assumptions used in the underlying valuation models. There have been no material changes to the valuation approaches utilized during the periods that Mount Logan’s financial results are presented in this report.
Fair Value of Financial Instruments
Except for Mount Logan’s debt obligations (each as defined in Note 12. Debt obligations to Mount Logan’s condensed consolidated financial statements), Mount Logan's financial instruments are recorded at fair value or at amounts whose carrying values approximate fair value. See “Investments, at Fair Value” above. While Mount Logan's valuations of portfolio investments are based on assumptions that Mount Logan believes are reasonable under the circumstances, the actual realized gains or losses will depend on, among other factors, future operating results, the value of the assets and market conditions at the time of disposition, any related transaction costs and the timing and manner of sale, all of which may ultimately differ significantly from the assumptions on which the valuations were based. Financial instruments’ carrying values generally approximate fair value because of the short-term nature of those instruments or variable interest rates related to the borrowings.
Revenue Recognition
Management Fees
ML Management provides investment management services to investment funds, CLOs, and other vehicles in exchange for a management fee. Management fees are determined quarterly using an annual rate which are generally based upon (i) a percentage of the capital committed during the commitment period, and thereafter based on the remaining invested capital of unrealized investments, or (ii) net asset value, gross assets, or as otherwise provided in the respective agreements. Management fees are recognized over time, during the period in which the related services are performed.
Incentive Fees
ML Management provides investment management services to investment funds, CLOs, managed accounts and other vehicles in exchange for a management fee, as discussed above and, in some cases an incentive fee, a type of performance revenue. The incentive fee consists of two parts: (i) an income incentive fee which is based on pre-incentive fee net investment income in excess of a hurdle rate and (ii) a capital gains incentive fee which is based on cumulative realized capital gains and losses and unrealized capital depreciation. Incentive fees are considered a form of variable consideration as they are based the fund achieving certain investment return hurdles. Accordingly, the recognition of such fee is deferred until it is probable that a significant reversal in the amount of cumulative revenue will not occur, which is generally upon liquidation of the investment fund. Accordingly, the recognition of such fee is deferred until it is probable that a significant reversal in the amount of cumulative revenue will not occur, which is generally upon liquidation of the investment fund.
Critical Accounting Estimates - Insurance Solutions Segment
Investments
Mount Logan is responsible for the fair value measurement of investments presented in the consolidated financial statements. Mount Logan performs regular analysis and review of its valuation techniques, assumptions and inputs used in determining fair value to evaluate if the valuation approaches are appropriate and consistently applied, and the various assumptions are reasonable. Mount Logan also performs quantitative and qualitative analysis and review of the information and prices received from commercial pricing services and broker-dealers, to verify it represents a reasonable estimate of the fair value of each investment. In addition, Mount Logan uses both internally-developed and commercially-available cash flow models to analyze the reasonableness of fair values using credit spreads and other market assumptions, where appropriate. For investment funds, Mount Logan typically
99
recognizes its investment, including those for which it has elected the fair value option, based on net asset value information provided by the general partner or related asset manager. For a discussion of investment funds for which it has elected the fair value option, see Note 9. Fair value measurements to the condensed consolidated financial statements.
Valuation of Fixed Maturity Securities, Equity Securities and Mortgage Loans
The following table presents the fair value of fixed maturity securities, equity securities and mortgage loans, including those with related parties and those held by consolidated VIEs, by fair value hierarchy. Investments classified as Equity Method for which the FVO has not been elected have been excluded from the table below:
| Fair Value Measurements | ||||||||||||||||||||||||||||||||
| September 30, 2025 | Level 1 | Level 2 | Level 3 | NAV | Total | |||||||||||||||||||||||||||
| Financial assets | ||||||||||||||||||||||||||||||||
| Asset Management | ||||||||||||||||||||||||||||||||
| Equity securities | $ | 14,346 | $ | 64 | $ | 5,941 | $ | — | $ | 20,351 | ||||||||||||||||||||||
| Derivatives | — | — | 13 | — | 13 | |||||||||||||||||||||||||||
| Other invested assets | — | — | 73 | — | 73 | |||||||||||||||||||||||||||
| Total financial assets — Asset Management | 14,346 | 64 | 6,027 | — | 20,437 | |||||||||||||||||||||||||||
| Insurance Solutions | ||||||||||||||||||||||||||||||||
| Debt securities: | ||||||||||||||||||||||||||||||||
| U.S. government and agency | $ | — | $ | 10,376 | $ | — | $ | — | $ | 10,376 | ||||||||||||||||||||||
| U.S. state, territories and municipalities | — | 5,368 | — | — | 5,368 | |||||||||||||||||||||||||||
| Other government and agency | — | 2,568 | — | — | 2,568 | |||||||||||||||||||||||||||
| Corporate | — | 262,160 | 5,108 | — | 267,268 | |||||||||||||||||||||||||||
| Asset and mortgage-backed securities | — | 305,662 | 18,832 | — | 324,494 | |||||||||||||||||||||||||||
| Corporate loans | — | 1,030 | 132,925 | — | 133,955 | |||||||||||||||||||||||||||
| Equity securities | 218 | 2,250 | 3,347 | 1,937 | 7,752 | |||||||||||||||||||||||||||
| Other invested assets | — | — | 4,424 | 297 | 4,721 | |||||||||||||||||||||||||||
| Total financial assets — Insurance Solutions | 218 | 589,414 | 164,636 | 2,234 | 756,502 | |||||||||||||||||||||||||||
| Corporate loans of consolidated VIEs | — | — | $ | 129,166 | $ | — | $ | 129,166 | ||||||||||||||||||||||||
| Equity of consolidated VIEs | — | — | 895 | — | 895 | |||||||||||||||||||||||||||
| Total financial assets including consolidated VIEs | $ | 218 | $ | 589,414 | $ | 294,697 | $ | 2,234 | $ | 886,563 | ||||||||||||||||||||||
| Derivatives | — | 45 | — | — | 45 | |||||||||||||||||||||||||||
| Total financial assets | $ | 14,564 | $ | 589,523 | $ | 300,724 | $ | 2,234 | $ | 907,045 | ||||||||||||||||||||||
| Financial liabilities | ||||||||||||||||||||||||||||||||
| Asset Management | ||||||||||||||||||||||||||||||||
| Debt obligations | $ | — | $ | — | $ | 132 | $ | — | $ | 132 | ||||||||||||||||||||||
| Total financial liabilities — Asset Management | — | — | 132 | — | 132 | |||||||||||||||||||||||||||
| Insurance Solutions | ||||||||||||||||||||||||||||||||
| Ceded reinsurance - embedded derivative | $ | — | $ | 28,286 | $ | — | $ | — | $ | 28,286 | ||||||||||||||||||||||
| Interest rate swaps | — | — | — | — | — | |||||||||||||||||||||||||||
| Total financial liabilities — Insurance Solutions | — | 28,286 | — | — | 28,286 | |||||||||||||||||||||||||||
| Total financial liabilities | $ | — | $ | 28,286 | $ | 132 | $ | — | $ | 28,418 | ||||||||||||||||||||||
100
| Fair Value Measurements | ||||||||||||||||||||||||||||||||
| December 31, 2024 | Level 1 | Level 2 | Level 3 | NAV | Total | |||||||||||||||||||||||||||
| Financial assets | ||||||||||||||||||||||||||||||||
| Asset Management | ||||||||||||||||||||||||||||||||
| Equity securities | $ | 1,777 | $ | — | $ | 499 | $ | — | $ | 2,276 | ||||||||||||||||||||||
| Total financial assets — Asset Management | $ | 1,777 | $ | — | $ | 499 | $ | — | $ | 2,276 | ||||||||||||||||||||||
| Insurance Solutions | ||||||||||||||||||||||||||||||||
| Debt securities: | ||||||||||||||||||||||||||||||||
| U.S. government and agency | $ | — | $ | 8,075 | $ | — | $ | — | $ | 8,075 | ||||||||||||||||||||||
| U.S. state, territories and municipalities | — | 5,252 | — | — | 5,252 | |||||||||||||||||||||||||||
| Other government and agency | — | 2,369 | — | — | 2,369 | |||||||||||||||||||||||||||
| Corporate | — | 226,249 | — | — | 226,249 | |||||||||||||||||||||||||||
| Asset and mortgage-backed securities | — | 364,875 | 8,641 | — | 373,516 | |||||||||||||||||||||||||||
| Corporate loans | — | — | 114,734 | — | 114,734 | |||||||||||||||||||||||||||
| Equity securities | 310 | 11,134 | 2,918 | 2,042 | 16,404 | |||||||||||||||||||||||||||
| Other invested assets | — | — | 4,575 | — | 4,575 | |||||||||||||||||||||||||||
| Total financial assets — Insurance Solutions | $ | 310 | $ | 617,954 | $ | 130,868 | $ | 2,042 | $ | 751,174 | ||||||||||||||||||||||
| Corporate loans of consolidated VIEs | — | — | 125,757 | — | 125,757 | |||||||||||||||||||||||||||
| Equity securities of consolidated VIEs | — | — | 141 | — | 141 | |||||||||||||||||||||||||||
| Total financial assets including consolidated VIEs | $ | 310 | $ | 617,954 | $ | 256,766 | $ | 2,042 | $ | 877,072 | ||||||||||||||||||||||
| Total financial assets | $ | 2,087 | $ | 617,954 | $ | 257,265 | $ | 2,042 | $ | 879,348 | ||||||||||||||||||||||
| Financial liabilities | ||||||||||||||||||||||||||||||||
| Asset Management | ||||||||||||||||||||||||||||||||
| Debt obligations | $ | — | $ | — | $ | 1,471 | $ | — | $ | 1,471 | ||||||||||||||||||||||
| Total financial liabilities — Asset Management | $ | — | $ | — | $ | 1,471 | $ | — | $ | 1,471 | ||||||||||||||||||||||
| Insurance Solutions | ||||||||||||||||||||||||||||||||
| Ceded reinsurance - embedded derivative | $ | — | $ | 34,770 | $ | — | $ | — | $ | 34,770 | ||||||||||||||||||||||
| Interest rate swaps | — | 5,192 | — | — | 5,192 | |||||||||||||||||||||||||||
| Total financial liabilities — Insurance Solutions | $ | — | $ | 39,962 | $ | — | $ | — | $ | 39,962 | ||||||||||||||||||||||
| Total financial liabilities | $ | — | $ | 39,962 | $ | 1,471 | $ | — | $ | 41,433 | ||||||||||||||||||||||
Goodwill
We review goodwill for impairment annually and whenever events or changes in the business environment may indicate the carrying amount of one of our reporting units may exceed its fair value. Our methodology for conducting this goodwill impairment testing contains both a qualitative and quantitative assessment. In evaluating the recoverability of goodwill, we perform a qualitative analysis at the reporting unit level to determine whether there are any events or circumstances that would indicate it is more likely than not that the fair value of a reporting unit is below its carrying value. Based on the results of this analysis, if we determine that it is more likely than not that the fair value of a reporting unit is less than its carrying amount, we then perform the impairment evaluation using a quantitative assessment based on an analysis of the discounted future cash flows generated by the underlying assets. The process of determining whether goodwill is impaired or recoverable relies on projections of future cash flows, operating results and market conditions. Future cash flow estimates are based partly on economic trends such as interest rates and market conditions, which are beyond our control and are likely to fluctuate.
101
Mount Logan has determined it has two reporting units: (1) LTC, its legacy run-off business, and (2) MYGA and & Other (“MYGA”). The fair value of reporting unit is determined from a projection of future cash flows and operating results derived from both the in-force business and new business expected in the future. This approach requires assumptions including premium growth rates, capital requirements, interest rates, mortality, morbidity, policyholder behavior, and discount rates. These assumptions are consistent with internal projections and operating plans. We believe these estimates and assumptions are reasonable and comparable to those that would be used by other marketplace participants. To calculate the fair value of the insurance business, Mount Logan discounted projected earnings from in-force contracts and valued new business growing at expected plan levels, consistent with the periods used for forecasting long term businesses, in addition to considering a terminal value for the value of new business beyond five years at Mount Logan’s long-term growth rate. In arriving at its projections, Mount Logan considered past experience, economic trends such as interest rates, capital requirements and market trends. Capital requirements were based on a risk based capital (RBC) ratio of 350.0%. Excess capital above this requirement was added to the fair value of the reporting units, consistent with market participant treatment. Mount Logan's key assumptions for the new MYGA business were the (i) discrete premium growth rate, (ii) interest rate, and (iii) capital requirements, which are discussed further below:
i.The discrete MYGA premium growth rate in the fair value calculations were based on maintaining management’s target RBC ratio of 350%. RBC of 350% is anticipated to be maintained based on the performance of the investment portfolio and additional capital contributions. We assumed a higher growth rate in initial years with declining growth in the later years as we continue to scale the business;
ii.Interest rate assumptions are based on prevailing market rates at the valuation date;
iii.and,Capital requirements assumed per management’s target RBC ratio of 350%.
Management has not adjusted its assumptions between the year ended December 31, 2023 and December 31, 2024, rather, the discount rate applied to the quantitative assessment has had the most significant impact. Discount rates assumed in determining the fair value for applicable reporting units was based on a cost of equity of 17.5% and 23.5% on an after-tax basis for LTC and MYGA, respectively for impairment testing for the year ended December 31, 2024. Capital Asset Pricing Model (“CAPM”) was used to estimate the cost of equity. The cost of equity was derived using the 20-year U.S. treasury bond yield and by adding an equity risk premium. The equity risk premium considers 100 basis point and 700 basis point execution risk to account for the risk of achieving the planned forecast for LTC and MYGA, respectively. This represents a change in approach from the year ended December 31, 2023 where discount rates were based on a weighted average cost of capital of 16.0% on an after-tax basis for both LTC and MYGA. Management believes the updated approach better represents the underlying economics of its business. Changes to the discount rate ultimately impact the fair value of each reporting unit, as discussed further below.
We apply significant judgement when determining the estimated fair value of our reporting units. While we believe that our estimates of future cash flows are reasonable, these estimates are not guarantees of future performance and are subject to risks and uncertainties that may cause actual results to differ from what is assumed in our impairment tests. Such analyses are particularly sensitive to changes in estimates of discount rates, future cash flows and other market conditions. A 50 basis point increase to the discount rate assumption, all other assumptions remaining constant, would result in the carrying value exceeding the fair value of the MYGA reporting unit but not the LTC reporting unit. While a 50 basis point decrease to future cash flows, all other assumptions remaining constant, would not result in the carrying value exceeding the fair value of the LTC and/or MYGA reporting units. Management notes that these assumptions are often interdependent and shouldn’t be assessed in isolation. Further changes to these estimates might result in material changes in fair value and determination of the recoverability of goodwill, which may result in charges against earnings and a reduction in the carrying value of our goodwill in the future.
We complete our annual goodwill impairment analyses in the fourth quarter of each period presented using an October 1 measurement date. For the years ended December 31, 2024 and December 31, 2023, we determined from a qualitative standpoint there were no events or circumstances that indicated that the carrying value exceeded the fair value. From a quantitative standpoint as of October 1, 2024, we performed our annual quantitative goodwill
102
impairment test for our reporting units, LTC and MYGA, and as of such date, the fair value was in excess of the carrying value for each reporting unit, by 24.3% and 10.7%, respectively.
Derivatives
Freestanding derivatives are instruments that Ability has entered into as part of their overall risk management strategies. Such contracts include interest rate swaps to convert floating-rate interest receipts to fixed-rate interest receipts to reduce exposure to interest rate changes. All derivatives are recognized in Derivatives liability and are presented on a gross basis in the Consolidated Statements of Financial Position and measured at fair value. Changes in fair value are recorded in Accumulated Other Comprehensive Income as the swaps are in hedging relationships, with changes in fair value reclassified into Interest income in the same period as the hedged transactions affect earnings. Any interest accruals will flow through earnings as adjustments to Interest income. Ability’s derivative financial instruments contain credit risk to the extent that its counterparties may be unable to meet the terms of the agreements. Ability attempts to reduce this risk by limiting its counterparties to major financial institutions with strong credit ratings.
To qualify for hedge accounting, at the inception of the hedging relationship, Ability formally documents its risk management objective and strategy for undertaking the hedging transaction. This documentation identifies how the hedging instrument is expected to mitigate the designated risk related to the hedged item and the method that will be used to retrospectively and prospectively assess the hedge effectiveness. A derivative designated as a hedging instrument must be assessed as being highly effective in offsetting the designated risk of the hedged item. Hedge effectiveness is formally assessed at inception and periodically throughout the life of the hedge accounting relationship.
Ability issues and reinsures products or purchases investments that contain embedded derivatives. If it determines an embedded derivative has economic characteristics not clearly and closely related to the economic characteristics of the host contract, and a separate instrument with the same terms would qualify as a derivative instrument, the embedded derivative is bifurcated from the host contract and accounted for separately, unless the Fair Value Option (“FVO”) is elected on the host contract. Under the FVO, bifurcation of the embedded derivative is not necessary as the entire contract is carried at fair value with all related gains and losses recognized in Net gains (losses) from investment activities in the Consolidated Statements of Operations. Embedded derivatives are carried at fair value in the Consolidated Statements of Financial Position in the same line item as the host contract.
Additionally, reinsurance agreements written on a funds withheld or Modco basis contain embedded derivatives. Ability has determined that the obligation to pay the total return on the assets supporting the funds withheld liability represents a total return swap with a floating rate leg. The fair value of embedded derivatives on funds withheld and Modco agreements is computed as the unrealized gain (loss) on the underlying assets and is included within the funds withheld under reinsurance contracts in the Consolidated Statements of Financial Position.
The change in the fair value of the embedded derivatives is recorded in Net investment income (loss) on funds withheld in the Consolidated Statements of Operations. Ceded earnings from funds withheld liability and changes in the fair value of embedded derivatives are reported in operating activities in the Consolidated Statements of Cash Flows. Contributions to and withdrawals from funds withheld liability are reported in operating activities in the Consolidated Statements of Cash Flows.
Ability’s insurance operations include providing reinsurance related to LTC, as well as MYGA products. Insurance contracts are contracts with significant mortality and/or morbidity risks, while investment contracts are contracts without such risks. MYGA contracts were deemed to be investment contracts. Insurance revenue is comprised primarily of premiums and investment income. For traditional long-duration insurance contracts, Mount Logan reports premiums as revenue when due. Premiums received on MYGA products (a product without significant mortality risk) are not reported as revenue but rather as deposit liabilities. Mount Logan recognizes revenue for charges and assessments on these contracts, mostly relating to surrender charges. Interest credited to policyholder accounts is charged to expense.
Future policy benefit reserves represent the present value of future benefits to be paid to or on behalf of policyholders and related expenses less the present value of future net premiums. The liability is measured for each
103
group of contracts (i.e., cohorts) using current cash flow assumptions. Contracts are grouped into cohorts by line of business, product type and cash flow streams, based on the date the policy was acquired (which for the entire LTC portfolio is the date of the acquisition of Ability). Future policy benefit reserves are adjusted each period because of updating lifetime net premium ratios for differences between actual and expected experience with the retroactive effect of those variances recognized in current period earnings. Ability reviews at least annually in the third quarter, future policy benefit reserves cash flow assumptions, and if the review concludes that the assumptions need to be updated, future policy benefit reserves are adjusted retroactively based on the revised net premium ratio using actual historical experience, updated cash flow assumptions, and the locked-in discount rate with the effect of those changes recognized in current period earnings.
As Ability’s LTC business is in run-off, the locked-in discount rate is used for the computation of interest accretion on future policy benefit reserves recognized in earnings. However, cash flows used to estimate future policy benefit reserves are also discounted using an upper-medium grade (i.e., low credit risk) fixed-income instrument yield reflecting the duration characteristics of the liabilities and is updated each reporting period with changes recorded in AOCI. As a result, changes in the current discount rate at each reporting period are recognized as an adjustment to AOCI and not earnings each period, whereas, changes relating to cash flow assumptions are recognized in the Insurance Solutions Statement of Earnings (Loss).
Liabilities for the MYGA investment contracts equal the account value, that is, the amount that accrues to the benefit of the contract or policyholder including credited interest and assessments through the financial statement date. See Note 15. Interest sensitive contract liabilities for further information.
Recent Accounting Pronouncements
A list of recent accounting pronouncements that are relevant to Mount Logan and its industries is included in Note 2. Summary of significant accounting policies to Mount Logan’s condensed consolidated financial statements.
104
MANAGEMENT’S DISCUSSION AND ANALYSIS OF FINANCIAL CONDITION AND RESULTS OF OPERATIONS OF MOUNT LOGAN - YEARS ENDED DECEMBER 31, 2024 AND 2023
The following discussion should be read in conjunction with Mount Logan Capital Inc.'s consolidated financial statements and the related notes as of December 31, 2024 and 2023 and for the years ended December 31, 2024 and 2023. This discussion contains forward-looking statements that are subject to known and unknown risks and uncertainties. Actual results and the timing of events may differ significantly from those expressed or implied in such forward-looking statements due to a number of factors, including those included in the section of this report entitled “Item 1A. Risk Factors.” The highlights listed below have had significant effects on many items within our consolidated financial statements and affect the comparison of the current period’s activity with those of prior periods.
Nature of Business
General
Mount Logan’s Business
Mount Logan, together with its consolidated subsidiaries is an alternative asset management and insurance solutions company. Mount Logan manages its business through two business segments: Asset Management and Insurance Solutions. Its Asset Management segment is focused on investing in and actively managing credit investment opportunities in North America through its wholly-owned subsidiary Mount Logan Management LLC (“ML Management”). The Insurance Solutions segment is conducted by Ability Insurance Company (“Ability”), a Nebraska domiciled insurer, that specializes in reinsuring annuity products for the increasing number of individuals seeking to fund retirement needs. Ability also holds a run-off book of long-term care policies. As of December 31, 2024, Mount Logan had a team of 30 employees.
Asset Management
Our Asset Management segment focuses on generating recurring asset management fee streams across a variety of credit investing strategies. Mount Logan raises, invests and manages funds, accounts and other vehicles with an emphasis on private credit. As of December 31, 2024, Mount Logan had a total AUM of $2.3 billion.
As an alternative asset manager, through Mount Logan’s wholly and partially owned SEC-registered investment advisers (“RIAs”), Mount Logan earns management and incentive fees for providing investment advisory and management services to multiple diversified investment vehicles, which include Mount Logan’s Insurance Solutions segment. The majority of these vehicles are permanent or semi-permanent capital, generating recurring management and fee-related performance fees from indefinite term vehicles, that are measured and received on a recurring basis, primarily focused on North American and European direct and indirect private loan origination in the middle-market across the capital structure, as well as corporate credit, specialty finance, and other mandates across managed accounts and CLOs. Mount Logan benefits from its investment in and expansion into high-growth areas of private credit and private solutions investing, including asset-backed finance, opportunistic credit, and venture and growth lending. Beyond participation in the traditional primary and secondary credit markets, through Mount Logan’s origination and corporate solutions capabilities, Mount Logan seeks to originate assets with attractive risk-adjusted returns, in the funds Mount Logan manages, through the employment of rigorous and deep diligence on the opportunities Mount Logan assesses.
Through Mount Logan’s RIAs, Mount Logan seeks to invest in well-established middle market businesses that operate across a wide range of industries (i.e., no concentration in any one industry). Mount Logan employs fundamental credit analysis, targeting investments in businesses with relatively low levels of cyclicality and operating risk. Mount Logan has experience managing levered vehicles, both public and private, and seek to enhance returns through the prudent use of leverage with a conservative approach that prioritizes downside protection and capital preservation. Mount Logan believes this strategy and approach offers attractive risk-adjusted returns with lower volatility featuring the potential for fewer defaults and greater resilience through market cycles.
105
The amount of fees charged for managing these assets depends on the underlying investment strategy, vehicle being managed, liquidity profile, and, ultimately, Mount Logan’s ability to generate returns for Mount Logan’s clients. After expenses associated with generating fee-related revenues, Mount Logan measures the resulting earnings stream “Fee Related Earnings” or “FRE”, which represents the primary performance measure for the Asset Management segment. FRE is the sum of (i) management fees, (ii) performance fees received from certain managed funds (iii) equity investment earnings related to fee generating vehicles, and (iv) interest income attributable to investment management activity, less (a) fee-related compensation, excluding equity-based compensation, and (b) other associated operating expenses, which excludes amortization of acquisition-related intangible assets and interest and other credit facility expenses. FRE excludes non-fee generating revenues and expenses, transaction-related charges, equity-based compensation costs, the amortization of intangible assets, the operating results of VIEs that are included in the consolidated financial statements, and any other non-recurring income and expenses. In addition, FRE excludes interest and other financing costs related to the Company not attributable to any specific segment, and corporate overhead expenses incurred to support the operations of the business rather than directly fee-related. Management considers these types of costs corporate in nature, and are included only for reconciliation purposes to income (loss) before income tax (provision) benefit.
The Asset Management segment also holds minority interests in two Canadian asset managers and in Sierra Crest Investment Management (“SCIM”), which manages Portman Ridge Finance Corp. (“Portman Ridge”), a United States business development company, and Alternative Credit Income Fund (“ACIF”), a closed-end interval fund that invests in a portfolio of public and private credit investments. SCIM is majority owned by BCPA.
Insurance Solutions
Mount Logan’s Insurance Solutions segment is operated by Ability, a Nebraska domiciled insurer and reinsurer of long-term care ("LTC") policies and retirement savings products, licensed in 42 states and the District of Columbia. Upon closing of the acquisition of Ability in late 2021, ML Management entered into an investment management agreement with Ability (the "Ability IMA") to manage certain of Ability’s assets that are within the scope of ML Management’s expertise in providing investment management advisory services (the assets of Ability managed by ML Management referred to herein as the "Managed Ability Portfolio"). In the second quarter of 2022, management began to implement its plan to expand and diversify the Insurance Solutions business, including ceasing to insure new long-term care risk and, instead, reinsuring multi-year guaranteed annuity ("MYGA") policies. The Insurance Solutions segment also includes the economic benefits of the three Cornhusker CLOs (collectively, the "Cornhusker CLOs"), which represent consolidated variable interest entities ("VIEs"). Annuity policies are contracts with insurers where individuals agree to pay a certain amount of money, either in a lump sum or through installments, which entitles them to receive a series of payments at a future date.
Long-term care insurance policies reimburse policyholders a daily amount, upon meeting certain requirements, for services to assist with daily living as they age. Ability's long-term care portfolio's morbidity risk has been largely reinsured to third-parties.
A reinsurance contract is a type of insurance contract that is issued by an entity (the reinsurer) to compensate another entity (the cedant) for claims arising from insurance contract(s) issued by the cedant.
Consistent with the overall business strategy, Ability assumes certain policy risks written by other insurance companies and cedes insurance risks to reinsurers. Reinsurance accounting is applied for reinsurance transactions when risk transfer provisions have been met. Ability reviews all contractual features, particularly those that may limit the amount of insurance risk to which the reinsurer is subject or features that delay the timely reimbursement of claims. Ability does not have any assumed or ceded reinsurance contracts for the LTC line of business that do not meet risk transfer requirements. The MYGA line of business does not meet the risk requirements to qualify as an insurance contract and is therefore considered an investment contract.
Ability uses ceded reinsurance contracts in the normal course of business to manage its risk exposure. For each of its reinsurance agreements, cessions under reinsurance agreements do not discharge Ability’s obligations as the primary insurer. Reinsurance assets represent the benefit derived from reinsurance agreements in force at the reporting date, considering the financial condition of the reinsurer. Amounts recoverable from reinsurers are
106
estimated in accordance with the terms of the relevant reinsurance contract and historical reinsurance recovery information. Amounts recoverable from reinsurers are based on what Ability believes are reasonable estimates and the balance is reported as an asset in the Insurance section of the Consolidated Statements of Financial Position. However, the ultimate amount of the reinsurance recoverable is not known until all claims are settled.
Mount Logan provides a full suite of services for Ability's investment portfolio, including direct investment management, asset allocation, mergers and acquisitions asset diligence and certain operational support services, including investment compliance, tax, legal and risk management support. Mount Logan’s Insurance Solutions business focuses on generating spread income by combining the two core competencies of (1) sourcing long-term, persistent liabilities through reinsurance treaties and (2) using the scale and reach of Mount Logan’s Asset Management business to actively source or originate assets with Ability's preferred risk and return characteristics. Ability's investment philosophy is to invest a portion of its assets in securities that earn an incremental yield by taking measured liquidity and complexity risk and capitalize on its long-dated, persistent liability profile to prudently achieve higher net investment earned rates, rather than assuming incremental credit risk. Because Ability maintains discipline in reinsuring attractively priced liabilities, it has the ability to invest in a broad range of high-quality assets to generate attractive earnings.
Mount Logan uses Spread Related Earnings (“SRE”) to assess the performance of the Insurance Solutions segment. SRE is a component of Segment Income that is used to assess the performance of the Insurance Solutions segment, excluding certain market volatility, which consists of investment gains (losses), other income and certain general, administrative & other expenses. For the Insurance Solutions segment, SRE equals the sum of (i) the net investment earnings on Insurance Solutions segment’s net invested assets (excluding investment earnings on funds held under reinsurance contracts and modified coinsurance agreement), less (ii) cost of funds (as described below), (iii) compensation and benefits, (iv) interest expense and (v) operating expenses. SRE represents the difference between actual earnings generated on the assets and investments made and the interest or crediting rate guaranteed to policyholders or participants. Rather than increasing allocations to higher risk securities to increase yields, or returns, on the assets invested, Ability and ML Management focus on proprietary origination of high-quality, predominantly senior secured loans and assets, which Mount Logan believes reduce downside risk.
The diagram below depicts Mount Logan’s current organizational structure:
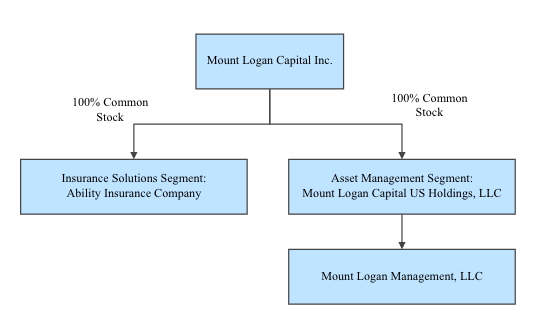
Note: The organizational structure chart above depicts a simplified version of the Mount Logan structure. It does not include all legal entities in the structure.
107
Business Environment
Industry Trends and Market Conditions
Mount Logan’s asset management and insurance solutions businesses are affected by the conditions in the political environment and financial markets and economic conditions of the United States, such as changes in interest rates, availability of credit, and inflation rates (including persistent inflation). These conditions can significantly impact the performance of Mount Logan’s business, including, but not limited to, the valuation of investments, including those of the vehicles Mount Logan manages, and related income Mount Logan may recognize.
Mount Logan carefully monitors economic and market conditions that could potentially give rise to market volatility and affect its business operations, which include inflation and benchmark interest rates. The US inflation rates experienced a notable change from 2023 to 2024. According to the U.S. Bureau of Labor Statistics, the annual U.S. inflation rate decreased from 3.4% as of December 31, 2023, to 2.9% as of December 31, 2024. This easing of inflation was part of a broader trend of declining inflationary pressures during that period. The Federal Reserve initiated its first rate cut in nearly three years in September 2024, bringing the rate to 5.13%. By December 2024, the Federal Reserve made its final interest rate decision of the year, capping a year during which the central bank provided some financial relief to borrowers weary of the inflation-related high-interest rate environment . While the Federal Reserve in the United States and central banks in other countries have begun to cut interest rates as inflation rates have gradually weakened, they may raise rates again in the future due to ongoing inflation concerns. This potential increase, combined with reduced government spending and financial market volatility, could further elevate economic uncertainty and associated risks. Additionally, interest rate hikes or other government measures aimed at curbing inflation might lead to recessionary pressures globally. Such a recession could significantly and adversely impact Mount Logan’s business, financial condition, operational results, liquidity, and cash flows.
Moreover, Ability is materially affected by conditions in the capital markets and the U.S. economy generally. Actual or perceived stressed conditions, volatility and disruptions in financial asset classes or various capital and credit markets may have an adverse effect on Mount Logan’s insurance business because such conditions may decrease the returns on, and value of, its investment portfolio.
Interest Rate Environment
Medium and long-term rates increased in 2024, with the U.S. 10-year Treasury yield at 4.58% as of December 31, 2024 compared to 3.88% as of December 31, 2023. Short term rates decreased in 2024, with the 3-month secured overnight financing rate at 4.31% as of December 31, 2024 compared to 5.33% as of December 31, 2023.
With respect to the Insurance Solutions segment, Ability's investment portfolio consists predominantly of fixed maturity investments. Both rising and declining interest rates can negatively affect the income Ability derives from these interest rate spreads. During periods of rising interest rates, Ability may be contractually obligated to reimburse its clients for the greater amounts they credit on certain interest-sensitive products. However, Ability may not have the ability to immediately acquire investments with interest rates sufficient to offset the increased crediting rates on its reinsurance contracts. During periods of falling interest rates, Ability’s investment earnings will be lower because new investments in fixed maturity securities will likely bear lower interest rates. Ability may not be able to fully offset the decline in investment earnings with lower crediting rates on underlying annuity products related to certain of its reinsurance contracts. Higher interest rates may result in increased surrenders on interest-based products of Ability’s clients, which may affect its fees and earnings on those products. Lower interest rates may result in lower sales of certain insurance and investment products of Ability’s clients, which would reduce the demand for its reinsurance of these products. If interest rates remain low for an extended period, it may adversely affect Ability’s cash flows, financial condition and results of operations. Ability addresses interest rate risk through managing the duration of the liabilities it sources with assets it acquires through asset/liability management (“ALM”) programs. As part of its investment strategy, Ability purchases floating rate investments, which are expected to perform well in a rising interest rate environment and are expected to underperform in a declining rate environment. Ability manages its floating interest rate risk in a declining rate environment through hedging activity.
108
As of December 31, 2024, Ability's net invested asset portfolio included $382 million of floating rate investments, or 53% of its net invested assets. In periods of prolonged low interest rates, the net investment spread may be negatively impacted by reduced investment income to the extent that Ability is unable to adequately reduce policyholder crediting rates due to policyholder guarantees in the form of minimum crediting rates or otherwise due to market conditions. A significant majority of the MYGA policies Ability reinsures have crediting rates that reset upon renewal. While Ability has the contractual right to not accept the renewals, its willingness to do so may be limited by competitive pressures.
Significant interest rate risk may arise from mismatches in the timing of cash flows from Ability’s assets and liabilities. Management of interest rate risk at the company-wide level, and at the various operating company levels, is one of the main risk management activities in which MLC senior management engages.
Interest rate sensitivity
The following table summarizes the potential impact on net income of hypothetical base rate changes in interest rates on Mount Logan’s debt investments, future policy benefits, and interest rate swaps assuming a parallel shift in the yield curve, with all other variables remaining constant for the insurance solutions segment. The impact of interest rates sensitivity on the Asset Management segment is immaterial.
| As at | December 31, 2024 | December 31, 2023 | ||||||||||||
| 50 basis point increase (1) | $ | 578 | $ | 13,798 | ||||||||||
| 50 basis point decrease (1) | (11,778) | (15,277) | ||||||||||||
_______________
(1)Losses are presented in brackets and gains are presented as positive numbers
Actual results may differ significantly from these sensitivity analyses. As such, the sensitivities should only be viewed as directional estimates of the underlying sensitivities for the respective factors based on the assumptions outlined above.
During the first quarter of 2024, Mount Logan entered into interest rate swaps to economically hedge fair value interest rate risk on floating rate debt investments. Mount Logan does not designate derivatives (interest rate swaps) as hedging instruments under a fair value hedge accounting model. Derivatives are initially measured at fair value with subsequent changes therein recognized in the Consolidated Statements of Comprehensive Income (Loss). Mount Logan's derivative instruments are disclosed below:
| As at December 31, 2024 | Notional | Derivative assets | Derivative liabilities | |||||||||||||||||
| Interest rate swaps | $ | 187,000 | $ | — | $ | 5,192 | ||||||||||||||
| Total | 187,000 | — | 5,192 | |||||||||||||||||
| As at December 31, 2023 | Notional | Derivative assets | Derivative liabilities | |||||||||||||||||
| Interest rate swaps | $ | — | $ | — | $ | — | ||||||||||||||
| Total | — | — | — | |||||||||||||||||
The interest rate swaps are recorded in the Consolidated Statement of Financial Position as "Derivatives" within the insurance segment with the mark-to-market changes in fair value being recorded as part of "Net gains (losses) from investment activities" within the insurance segment on the Consolidated Statement of Comprehensive Income.
109
Restricted cash posted as collateral consists of cash deposited at a bank that is pledged as collateral in connection with the interest rate swaps. The table below represents the cash posted as collateral associated with open derivative positions:
| As at | December 31, 2024 | December 31, 2023 | ||||||||||||
| Restricted cash posted as collateral | $ | 15,716 | $ | — | ||||||||||
| Total | 15,716 | — | ||||||||||||
Overview of Results of Operations
Financial Measures under U.S. GAAP - Asset Management
The following discussion of financial measures under U.S. GAAP is based on Mount Logan's Asset Management business as of December 31, 2024.
Revenues
Management fees
Mount Logan provides investment management services to investment funds, CLOs, managed accounts and other vehicles in exchange for a management fee. The significant growth of assets Mount Logan manages has had a positive effect on Mount Logan’s revenues. Management fees are determined quarterly using an annual rate which are generally based upon (i) a percentage of the capital committed during the commitment period, and thereafter based on the remaining invested capital of unrealized investments, or (ii) net asset value, gross assets, or as otherwise provided in the respective agreements. Management fees are recognized over time, during the period in which the related services are performed.
Incentive fees
Mount Logan provides investment management services to investment funds, CLOs, managed accounts and other vehicles in exchange for a management fee, as discussed above and, in some cases an incentive fee, a type of performance revenue. The incentive fee consists of two parts: (i) an income incentive fee which is based on pre-incentive fee net investment income in excess of a hurdle rate and (ii) a capital gains incentive fee which is based on cumulative realized capital gains and losses and unrealized capital depreciation. Incentive fees are considered a form of variable consideration as they are based on the fund achieving certain investment return hurdles. Accordingly, the recognition of such fee is deferred until it is probable that a significant reversal in the amount of cumulative revenue will not occur, which is generally upon liquidation of the investment fund.
110
The following table summarizes Mount Logan’s (i) management fees and (ii) incentive fees by fee generating vehicle:
| As of December 31, | As of December 31, | For the year ended | For the year ended | Year on Year change in Total Fees | ||||||||||||||||||||||||||||||||||||||||||||||||||||||||||||||||||||||
| 2024 | 2023 | 2024 | 2023 | December 31, 2024 | December 31, 2023 | |||||||||||||||||||||||||||||||||||||||||||||||||||||||||||||||||||||
Management Fees Receivable (7) | Incentive Fees Receivable (7) | Management Fees | Incentive Fees | Total Fees | Management Fees | Incentive Fees | Total Fees | $ Change | % Change | |||||||||||||||||||||||||||||||||||||||||||||||||||||||||||||||||
| Fee Generating Vehicle | ||||||||||||||||||||||||||||||||||||||||||||||||||||||||||||||||||||||||||
Ability (including consolidated VIEs) (1) | $ | 526 | $ | — | $ | — | $ | — | $ | 5,626 | $ | — | $ | 5,626 | $ | 4,247 | $ | — | $ | 4,247 | $ | 1,379 | 32 | % | ||||||||||||||||||||||||||||||||||||||||||||||||||
BDCs (2) | 834 | 869 | — | — | 3,486 | — | 3,486 | 3,660 | — | 3,660 | (174) | -5 | % | |||||||||||||||||||||||||||||||||||||||||||||||||||||||||||||
CLOs (3) | 779 | 1,022 | — | — | 3,059 | — | 3,059 | 3,029 | — | 3,029 | 30 | 1 | % | |||||||||||||||||||||||||||||||||||||||||||||||||||||||||||||
Interval Funds (4) | 157 | 25 | 544 | — | 908 | 1,706 | 2,614 | 25 | 38 | 64 | 2,551 | 4002 | % | |||||||||||||||||||||||||||||||||||||||||||||||||||||||||||||
Ovation Funds (5) | 269 | 297 | — | 329 | 2,935 | 1,491 | 4,426 | 2,222 | 1,244 | 3,466 | 960 | 28 | % | |||||||||||||||||||||||||||||||||||||||||||||||||||||||||||||
Other (6) | $ | 74 | $ | 57 | $ | — | $ | — | $ | 742 | $ | — | $ | 742 | $ | 197 | $ | — | $ | 197 | $ | 545 | 276 | % | ||||||||||||||||||||||||||||||||||||||||||||||||||
| Total Fees | $ | 2,639 | $ | 2,271 | $ | 544 | $ | 329 | $ | 16,757 | $ | 3,198 | $ | 19,954 | $ | 13,380 | $ | 1,283 | $ | 14,663 | $ | 5,291 | 36 | % | ||||||||||||||||||||||||||||||||||||||||||||||||||
______________
(1)ML Management earns a base management fee of 1% on the average statutory book value of the portion of Ability’s investments it manages. Management fees earned by ML Management from Ability are eliminated on consolidation.
(2)ML Management earns a base management fee of 1.75% on the gross assets of Logan Ridge Finance Corporation. Management fees earned indirectly through ML Management’s 24.99% interest in SCIM, which is the manager of Portman, are excluded as management fee revenue, but are paid as cash distributions from SCIM.
(3)ML Management as the adviser to two CLOs, 2018-01 and 2019-01, earns senior and subordinated management fees on these vehicles, calculated on the outstanding collateral balance. CLO 2018-1 earns 0.25% senior and 0.35% subordinated fees, and 2019-1 earns 0.25% senior and 0.25% subordinated fees. These rates are fixed for the life of the transaction and is not subject to repricing.
(4)ML Management is the adviser to OCIF and earns management and incentive fees directly from this fund. Base management fees are earned at 1.25% of gross assets. Incentive fees are realized when the fund reaches a hurdle rate of return each quarter, based on the pre-incentive fee net investment income. When OCIF’s pre-incentive net investment income – i.e. interest income, dividend income and any other income accrued during the calendar quarter, less OCIF’s operating expenses for the quarter – exceeds the hurdle rate of return on OCIF’s adjusted capital of 1.5% (or 6% annualized), ML Management earns an incentive fee at 15% of the pre-incentive fee net investment income. All incentive fees recognized are considered realized as they are calculated and payable quarterly in arrears based on the pre-incentive fee net investment income for the immediately preceding calendar quarter. All recorded incentive fees have been subsequently received in cash. Separately, Mount Logan receives the economics of ACIF, which is an interval fund advised by SCIM, via a servicing agreement with SCIM over ACIF. The SCIM servicing fee over ACIF is excluded.
(5)Mount Logan as the general partner accrues base management fees, calculated monthly, due and payable either monthly or quarterly in arrears at 0.125% of the net assets in the Ovation funds. Incentive fees, calculated monthly, due and payable quarterly in arrears, are calculated as 10% of pre-incentive fee distributable income. If pre-incentive fee distributable income amounts do not exceed 0% in any fiscal quarter, such shortfall (a “High Watermark Shortfall”) will carry forward to subsequent quarters. No incentive fees are payable to the general partner in any fiscal quarter in which a High Watermark Shortfall exists.
(6)Consists of several small, closed end private funds which are sub-advised by ML Management at 1% of net assets, as well as management fees earned from a portfolio of Vista Life & Casualty Reinsurance Company’s (Vista) assets to which ML Management was appointed as the investment manager of, effective March 2025, at a rate of 1% on the average statutory book value of investments under management. Only fees which are crystallized and not subject to reversal are recognized and included.
(7)Management and incentive fees receivable are part of Other assets on the Consolidated Statement of Financial Position.
The fee rates described above are contractually fixed, however Mount Logan retains the right to voluntarily waive all or a portion of any management or incentive fee in circumstances where doing so would better align the economic interests of Mount Logan and the investors in a particular vehicle. Any such waiver would be approved by the applicable fund board.
Expenses
Compensation and Benefits
The most significant expense in Mount Logan’s Asset Management business is compensation and benefits expense. This consists of fixed salary, discretionary and non-discretionary bonuses, profit sharing expense associated with the performance fees earned and compensation expense associated with the vesting of non-cash equity-based awards. Mount Logan’s current compensation arrangements with certain of its employees include non-
111
cash equity-based awards, which are considered to be ‘performance-based incentives.’ The non-cash equity-based awards are granted subject to management’s discretion and approval by the Board of Directors. There are no clawback provisions associated with the non-cash equity-based awards; however, they are subject to a time-based vesting requirement and continued employment. To date, Mount Logan has not paid any profit sharing associated with performance fees. Because of these performance-based incentives, as Mount Logan’s net revenues increase, Mount Logan’s compensation costs rise. Mount Logan’s compensation costs also reflect the increased investment in people as Mount Logan continues to grow its AUM both organically and inorganically.
Mount Logan grants equity awards to certain directors, officers, service providers and employees, consisting of Restricted Stock Units ("RSUs") that generally vest and become exercisable in annual installments depending on the award terms. See note 20 to Mount Logan’s consolidated financial statements for further discussion of equity-based compensation.
Administration and servicing fees
On November 20, 2018, Mount Logan entered into a servicing agreement (the “Servicing Agreement”) with BCPA. Under the terms of the Servicing Agreement, BCPA as servicing agent (the "Servicing Agent") performs (or oversees, or arranges for, the performance of) the administrative services necessary for the operation of Mount Logan, including, without limitation, office facilities, equipment, bookkeeping and record keeping services and such other services the Servicing Agent, subject to review by the Board, shall from time to time deem necessary or useful to perform its obligations under this Servicing Agreement. The Servicing Agent is authorized to enter into sub-administration agreements as determined to be necessary in order to carry out the administrative services.
Unless earlier terminated as described below, the Servicing Agreement will remain in effect from year-to-year if approved annually by (i) the vote of the Board and (ii) the vote of a majority of Mount Logan’s independent directors. The Servicing Agreement may be terminated at any time, without the payment of any penalty, upon 60 days’ written notice by the vote of the Board or by the Servicing Agent.
Mount Logan reimburses BCPA for an allocable portion of compensation paid to Mount Logan’s Chief Financial Officer, associated management personnel (based on a percentage of time such individuals devote, on an estimated basis, to the business affairs of Mount Logan), and out-of-pocket expenses. While the Servicing Agent performs certain administrative functions for Mount Logan, the management functions of Mount Logan are wholly performed by Mount Logan’s management team.
Mount Logan provides administrative and reporting services to SCIM in respect of the management of ACIF in exchange for a servicing fee. The servicing fee is variable consideration as it is calculated quarterly based on the fees received by SCIM under its advisory agreement with ACIF, less a specified fee retained by SCIM, debt servicing expense, compensation and other certain expenses SCIM incurs in connection with investment advisory services it provides to ACIF. As Mount Logan determined it acts as the agent in this relationship, Mount Logan recognizes in income the amount it is entitled to receive or obligated to pay. In the Consolidated Statements of Financial Position, uncollected amounts are classified as Due from related parties when money is owed to Mount Logan and money owed by Mount Logan is presented as Due to related parties.
Financial Measures under U.S. GAAP - Insurance Solutions
The following discussion of financial measures under U.S. GAAP is based on Mount Logan’s Insurance Solutions business, which is operated by Ability, as of December 31, 2024.
Revenues
Net premiums
Net premiums for long-duration contracts, including products with fixed and guaranteed premiums and benefits, are recognized as revenue when due from policyholders. Insurance premiums are reported net of reinsurance ceded premiums.
112
Product charges
Product charges mainly include surrender charges on MYGA product which are earned when assessed against policyholder account balances during the period.
Net investment income
Net investment income is a significant component of Ability's total revenues. Ability recognizes investment income as it accrues or is legally due, net of investment management and custody fees. Investment income on fixed maturity securities includes coupon interest, as well as the amortization of any premium and the accretion of any discount. Investment income on equity securities represents dividend income and preferred coupon interest.
Net gains (losses) from investment activities
Investment related gains (losses) primarily consist of (i) realized gains and losses on sales of investments, (ii) unrealized gains and losses on trading securities, (iii) unrealized gains and losses on equity securities, (iv) changes in the fair value of the embedded derivatives and derivatives not designated as a hedge, and (v) changes in the provision for credit losses.
Net revenues of consolidated variable interest entities
Changes in the fair value of the consolidated VIEs’ assets and liabilities and related interest, dividend and other income and expenses are presented within net revenues of consolidated variable interest entities.
Net investment income (loss) on funds withheld
Net gains (losses) on funds withheld consists of investment activity pertaining to funds withheld assets which includes any interest income, unrealized gains, and losses, and realized gains and losses from sales of these assets.
Ceded reinsurance – Funds withheld with Front Street Re
Mount Logan has a coinsurance with funds withheld arrangement with Front Street Re covering a significant portion of the LTC business (the “Medico” block of policies). Under the funds withheld arrangement, assets are retained by Mount Logan; however, all investment activity pertaining to those assets are passed through to Front Street Re. Investment activity includes any interest income, unrealized gains, and losses, and realized gains and losses from sales of these assets. The liability for this funds held arrangement is in the liability section of the Insurance section of the Consolidated Statements of Financial Position, and the income statement items related to this contract are in the line item net investment income (loss) on funds withheld in the Insurance section of the Consolidated Statement of Operations.
Ceded reinsurance – Modified coinsurance with Vista Life and Casualty Reinsurance Company
Mount Logan also has a modified coinsurance (“Modco”) agreement with Vista Life and Casualty Reinsurance Company (“Vista”). Pursuant to such agreement, Mount Logan retains assets in a designated custody account to support the quota share of the ceded Modco reserves. Similar to a funds withheld arrangement, all investment activity pertaining to those assets are passed through to Vista. Investment activity includes any interest income, unrealized gains, and losses, and realized gains and losses from sales on these assets. The liability for this funds held agreement is netted against the reinsurance recoverable of the Insurance section of the Consolidated Statements of Financial Position, and the income statement items related to this contract are in the line item net investment income (loss) on funds withheld in the Insurance Consolidated Statement of Operations.
Expenses
Interest sensitive contract benefits
Liabilities for the MYGA investment contracts equal the account value, that is, the amount that accrues to the benefit of the contract or policyholder including credited interest and assessments through the financial statement
113
date. Changes in interest sensitive contract liabilities, excluding deposits and withdrawals, are recorded in interest sensitive contract benefits or product charges on the consolidated statements of operations.
Net policy benefit and claims
Net policy benefit and claims represent the present value of future benefits to be paid to or on behalf of policyholders and related expenses less the present value of future net premiums. The liability is measured for each group of contracts (i.e., cohorts) using current cash flow assumptions. Contracts are grouped into cohorts by line of business, product type and cash flow streams, based on the date the policy was acquired (which for the entire LTC portfolio is the date of the acquisition of Ability Insurance). Future policy benefit reserves are adjusted each period because of updating lifetime net premium ratios for differences between actual and expected experience with the retroactive effect of those variances recognized in current period earnings. Mount Logan reviews at least annually in the third quarter, future policy benefit reserves cash flow assumptions, and if the review concludes that the assumptions need to be updated, future policy benefit reserves are adjusted retroactively based on the revised net premium ratio using actual historical experience, updated cash flow assumptions, and the locked-in discount rate with the effect of those changes recognized in current period earnings.
As Mount Logan’s LTC business is in run-off, the locked-in discount rate is used for the computation of interest accretion on future policy benefit reserves recognized in earnings. However, cash flows used to estimate future policy benefit reserves are also discounted using an upper-medium grade (i.e., low credit risk) fixed-income instrument yield reflecting the duration characteristics of the liabilities and is updated each reporting period with changes recorded in Accumulated Other Comprehensive Income (“AOCI”). As a result, changes in the current discount rate at each reporting period are recognized as an adjustment to AOCI and not earnings each period, whereas, changes relating to cash flow assumptions are recognized in the Insurance Statement of Earnings (Loss).
Amortization of deferred acquisition costs
Mount Logan incurs significant costs in connection with its renewals for its MYGA business. Costs that are related directly to the successful acquisition or renewal of MYGA contracts are capitalized as Deferred Acquisition Costs (“DAC”). Such costs for Mount Logan are comprised mostly of incremental direct costs of contract acquisitions, which for Mount Logan are primarily commissions. Deferred acquisition costs will be amortized to expense on a straight-line basis, at the individual level over the expected term of the related contract.
All other acquisition-related costs, as well as all indirect costs, are expensed as incurred.
Compensation and Benefits
This consists of fixed salary, discretionary and non-discretionary bonuses.
Interest expense
This includes interest expense on the debt obligations.
General, administrative and other
General, administrative and other expenses include normal operating expenses, integration, restructuring and other non-operating expenses.
Other Financial Measures under U.S. GAAP
Income Taxes
Mount Logan’s income tax expense increased year over year from $0.4 million to $0.6 million as there was more income subject to tax in 2024 compared to 2023 relating to Mount Logan’s US operations due to a true up of unrealized carry being recognized as income for tax purposes in 2024.
114
Managing Business Performance - Key Segment and Non-U.S. GAAP Performance Measures
Mount Logan believes that the presentation of Segment Income supplements a reader’s understanding of the economic operating performance of each of Mount Logan’s segments.
Segment Income is the key performance measure used by management in evaluating the performance of the Asset Management and Insurance Solutions segments. See Note 23 to the consolidated financial statements for more details regarding the components of Segment Income and management’s consideration of Segment Income. Mount Logan believes that Segment Income is helpful for an understanding of Mount Logan’s business and that investors should review the same supplemental financial measure that management uses to analyze Mount Logan’s segment performance. This measure supplements and should be considered in addition to and not in lieu of the results of operations discussed in “Overview of Results of Operations” that have been prepared in accordance with U.S. GAAP.
Fee Related Earnings and Spread Related Earnings
Fee Related Earnings (“FRE”) is a component of Segment Income that is used to assess the performance of the Asset Management segment. FRE is the sum of (i) management fees, (ii) performance fees received from certain managed funds (iii) equity investment earnings related to fee generating vehicles, and (iv) interest income attributable to investment management activity, less (a) fee-related compensation, excluding equity-based compensation, and (b) other associated operating expenses, which excludes amortization of acquisition-related intangible assets and interest and other credit facility expenses.
FRE excludes non-fee generating revenues and expenses, transaction-related charges, equity-based compensation costs, the amortization of intangible assets, the operating results of VIEs that are included in the consolidated financial statements, and any other non-recurring income and expenses. In addition, FRE excludes interest and other financing costs related to the Company not attributable to any specific segment, and corporate overhead expenses incurred to support the operations of the business rather than directly fee-related. Management considers these types of costs corporate in nature, and are included only for reconciliation purposes to income (loss) before income tax (provision) benefit.
Spread Related Earnings (“SRE”) is a component of Segment Income that is used to assess the performance of the Insurance Solutions segment, excluding certain market volatility, which consists of investment gains (losses), other income and certain general, administrative & other expenses. For the Insurance Solutions segment, SRE equals the sum of (i) the net investment earnings on Insurance Solutions segment’s net invested assets (excluding investment earnings on funds held under reinsurance contracts and modified coinsurance agreement), less (ii) cost of funds (as described below), (iii) compensation and benefits, (iv) interest expense and (v) operating expenses.
Cost of funds includes liability costs associated with the crediting cost on MYGA liabilities as well as other liability costs. Other liability costs include DAC amortization, the cost of liabilities associated with LTC, net of reinsurance, which includes change in reserves, premiums, actual claim experience including related expenses and certain product charges related to MYGA.
Mount Logan uses FRE and SRE as measures of operating performance, not as measures of liquidity. These measures should not be considered in isolation or as a substitute for net income or other income data prepared in accordance with U.S. GAAP. The use of these measures without consideration of their related U.S. GAAP measures is not adequate due to the adjustments described above.
Results of Operations
Below is a discussion of Mount Logan’s consolidated statements of operations for the years ended December 31, 2024 and 2023. For additional analysis of the factors that affected Mount Logan’s results at the segment level, see “Segment Analysis” below:
115
| Years Ended | |||||||||||||||||||||||
| December 31, 2024 | December 31, 2023 | Change ($) | Change (%) | ||||||||||||||||||||
| ($ in thousands) | |||||||||||||||||||||||
'REVENUES | |||||||||||||||||||||||
| Asset Management | |||||||||||||||||||||||
'Management fees | 11,131 | 9,134 | 1,997 | 22 | % | ||||||||||||||||||
| Incentive fees | 3,198 | 1,283 | 1,915 | 149 | % | ||||||||||||||||||
| Equity investment earning | 680 | 1,124 | (444) | -40 | % | ||||||||||||||||||
| 15,009 | 11,541 | 3,468 | 30 | % | |||||||||||||||||||
| Insurance Solutions | |||||||||||||||||||||||
| Net Premiums | (15,479) | (17,288) | 1,809 | -10 | % | ||||||||||||||||||
| Product charges | 266 | 134 | 132 | 99 | % | ||||||||||||||||||
| Net investment income | 74,638 | 69,688 | 4,950 | 7 | % | ||||||||||||||||||
| Net gains (losses) from investment activities | (8,211) | 16,246 | (24,457) | -151 | % | ||||||||||||||||||
| Net revenues of consolidated variable interest entities | 15,082 | 16,889 | (1,807) | -11 | % | ||||||||||||||||||
| Net investment income (loss) on funds withheld | (32,056) | (51,641) | 19,585 | -38 | % | ||||||||||||||||||
| Other income | 541 | 1,013 | (472) | -47 | % | ||||||||||||||||||
| 34,781 | 35,041 | (260) | -1 | % | |||||||||||||||||||
'Total revenues | 49,790 | 46,582 | 3,208 | 7 | % | ||||||||||||||||||
| EXPENSES | |||||||||||||||||||||||
| Asset Management | |||||||||||||||||||||||
| Administration and servicing fees | 5,895 | 2,943 | 2,952 | 100 | % | ||||||||||||||||||
| Transaction costs | 2,174 | 3,721 | (1,547) | -42 | % | ||||||||||||||||||
| Compensation and benefits | 8,412 | 3,405 | 5,007 | 147 | % | ||||||||||||||||||
| Amortization and impairment of intangible assets | 3,582 | 1,504 | 2,078 | 138 | % | ||||||||||||||||||
| Interest and other credit facility expenses | 7,001 | 5,977 | 1,024 | 17 | % | ||||||||||||||||||
| General, administrative and other | 6,480 | 10,529 | (4,049) | -38 | % | ||||||||||||||||||
| 33,544 | 28,079 | 5,465 | 19 | % | |||||||||||||||||||
| Insurance Solutions | |||||||||||||||||||||||
| Net policy benefit and claims (remeasurement gain on policy liabilities of $16,237 and $11,757 for the year ended December 31, 2024 and 2023, respectively) | (10,091) | (5,491) | (4,600) | 84 | % | ||||||||||||||||||
| Interest sensitive contract benefits | 14,972 | 9,443 | 5,529 | 59 | % | ||||||||||||||||||
| Amortization of deferred acquisition costs | 2,175 | 1,652 | 523 | 32 | % | ||||||||||||||||||
| Compensation and benefits | 1,367 | 2,019 | (652) | -32 | % | ||||||||||||||||||
| Interest expense | 1,313 | 513 | 800 | 156 | % | ||||||||||||||||||
| General, administrative and other (including related party amounts of $7,169 and $7,360 for the year ended December 31, 2024 and 2023, respectively) | 16,276 | 19,210 | (2,934) | -15 | % | ||||||||||||||||||
| 26,012 | 27,346 | (1,334) | -5 | % | |||||||||||||||||||
| Total expenses | 59,556 | 55,425 | 4,131 | 7 | % | ||||||||||||||||||
| Investment and other income (Loss) - Asset Management | |||||||||||||||||||||||
| Net gains (losses) from investment activities | (1,531) | (104) | (1,427) | 1372 | % | ||||||||||||||||||
| Dividend income | 356 | 584 | (228) | -39 | % | ||||||||||||||||||
| Interest income | 1,091 | 1,087 | 4 | — | % | ||||||||||||||||||
| Other income (loss), net | 69 | — | 69 | — | % | ||||||||||||||||||
| Net revenues of consolidated variable interest entities | — | 964 | (964) | -100 | % | ||||||||||||||||||
| Total investment income (loss) | (15) | 2,531 | (2,546) | -101 | % | ||||||||||||||||||
116
| Years Ended | |||||||||||||||||||||||
| December 31, 2024 | December 31, 2023 | Change ($) | Change (%) | ||||||||||||||||||||
| Income (loss) before taxes | (9,781) | (6,312) | (3,469) | 55 | % | ||||||||||||||||||
| Income tax (expense) benefit — asset management | (606) | (391) | (215) | 55 | % | ||||||||||||||||||
| Net income (loss) | (10,387) | (6,703) | (3,684) | 55 | % | ||||||||||||||||||
In this section, references to 2024 refer to the year ended December 31, 2024 and references to 2023 refer to the year ended December 31, 2023.
Asset Management Segment
Revenues
Revenues were $15.0 million in 2024, an increase of $3.5 million from $11.5 million in 2023, driven by an increase in management and incentive fees partially offset by a decrease in equity investment earnings.
Management fees increased by $2.0 million to $11.1 million in 2024 from $9.1 million in 2023. The increase in management fees was primarily attributable to higher fees earned from Opportunistic Credit Interval Fund (“OCIF”) due to increased AUM, a full year of management fees from Ovation Alternative Income Fund and Ovation Alternative Income Fund-A LP (collectively the “Ovation funds”) managed funds compared to 2023 during which the Ovation GP acquisition closed in the third quarter, and First Trust continuing to scale with increased AUM.
The $1.9 million increase in incentive fees was primarily driven by incentive fees earned from OCIF of $1.7 million in 2024 compared to close to $nil in 2023. The increase in OCIF incentive fee was primarily due to growth in OCIF’s pre-incentive fee net investment income (NII). The growth in NII was driven by OCIF’s increased fundraising which allowed OCIF to deploy additional capital into yielding assets. Net assets increased from around $37.9 million to $145.7 million year on year while operating expenses remained relatively flat. All incentive fees recognized are realized incentive fees as they are calculated and payable quarterly in arrears based on the pre-incentive fee net investment income for the immediately preceding calendar quarter. All recorded incentive fees have been subsequently received in cash.
The increase in revenue was partially offset by a decrease in equity investment earnings due to the loss of significant influence over the investment in OCIF in the third quarter of 2023 and decreased performance in SCIM.
Expenses
Expenses were $33.5 million in 2024, an increase of $5.5 million from $28.1 million in 2023, driven by increases in administrative and servicing fees, compensation and benefits, amortization and impairment of intangibles and interest and credit facility expenses, offset by decreases in general, administrative and other expenses, and transaction costs.
Administration and servicing fees increased $3.0 million in 2024 due to additional headcount, increased net economic loss attributable to Mount Logan's service agreement with SCIM, and an increase in sub-investment management expenses.
Compensation and benefits increased $5.0 million in 2024 primarily due to increased headcount and costs associated with the operations of Ovation GP, RSUs granted and quarterly guaranteed bonus accruals from the third quarter of 2024 onwards.
Amortization and impairment of intangible assets increased $2.1 million in 2024 due to an impairment loss in the fourth quarter of 2024 on the IMA purchased in the Ovation GP acquisition as well as a decrease in the remaining useful life of that intangible asset, as the underlying fund is being wound down.
117
Interest and other credit facility expenses increased $1.0 million in 2024 primarily due to increased borrowings from upsizing our existing credit facility during the second quarter of 2023 and the issuance of debenture units during the first quarter of 2024, as well as refinancing costs incurred in the fourth quarter of 2024.
The increase in expenses was offset by a $4.0 million decrease in general, administrative and other expenses attributable to significantly lower professional services fee spend due to active management efforts to reduce costs, the expiration of transition services agreements on assets purchased and fee-sharing agreements associated with the CLOs, and the improved performance of OCIF. Transaction costs were also lower by $1.5 million due to reduced deal activity in most of 2024 compared to 2023.
Investment and Other Income (Loss)
Total investment and other loss were close to $nil in 2024, a decrease of $2.5 million from $2.5 million of investment income in 2023. This decrease was primarily driven by an increase in unrealized losses on equity security investments compared to 2023, and the decrease in interest income attributable to consolidated VIEs as Mount Logan deconsolidated its interest in 2018-01 when it was no longer the primary beneficiary.
Insurance Solutions Segment
Revenues
Revenues were $34.8 million in 2024, a decrease of $0.3 million from $35.0 million in 2023. The decrease was primarily driven by a decrease in net gains (losses) from investment activities and a decrease in net revenue of consolidated VIEs. These decreases were partially offset by an increase in net premiums, an increase in net investment income and an increase in net investment income (loss) on funds withheld.
Net gains (losses) from investment activities were ($8.2) million in 2024, a decrease of $24.5 million from $16.2 million in 2023, primarily due to an unfavorable change in the fair value of investment assets and also due to an unfavorable change in the provision for credit losses. The unfavorable change in the fair value of investment assets was primarily driven by an increase in bond yield in 2024 compared to 2023, which resulted in decrease in the fair value of existing bonds in 2024 compared to 2023. Consequently, there were higher unrealized losses on these bonds in 2024 compared to 2023. The unfavorable change in the provision for credit losses of $4.1 million was primarily driven by deterioration in credit ratings of certain mortgage loans.
Net revenues of consolidated VIEs were $15.1 million in 2024, a decrease of $1.8 million from $16.9 million in 2023, primarily driven by lower realized gains on the sale of investments in 2024 compared to 2023 and also due to lower accretion of discounts in 2024 compared to 2023. This decrease was partially offset by favorable returns on underlying assets.
Net premiums were ($15.5) million in 2024, an increase of $1.8 million from ($17.3) million in 2023. The negative net premiums resulted from ceded premiums exceeding direct/assumed premiums within the LTC business. The increase in net premiums was primarily driven by a decrease of $5.2 million in ceded premium related to LTC business compared to 2023, which was partially offset by a decrease of $3.4 million in direct/assumed premium compared to 2023.
Net investment income was $74.6 million in 2024, an increase of $5.0 million from $69.6 million in 2023, primarily driven by growth in the Insurance Segment's investment portfolio and higher rates on new deployment in comparison to existing portfolio related to the higher interest rate environment.
Net investment income (loss) on funds withheld were ($32.1) million in 2024, which reflects an increase of $19.5 million from ($51.6) million in 2023. The corresponding balance sheet account, funds withheld under reinsurance contracts, reflects the collateral payable to reinsurers for the LTC block of business. Typically, when the investments held as collateral as part of the funds withheld decrease in value, the funds withheld liability also decreases. Thus, the unfavorable change in the fair value of investment assets related to reinsurers under funds withheld/modco arrangement resulted in higher unrealized losses. The unfavorable change in the fair value of
118
investment assets related to reinsurers under funds withheld/modco arrangement was primarily driven by an increase in bond yield in 2024 compared to 2023.
Expenses
Expenses were $26.0 million in 2024, a decrease of $1.3 million from $27.3 million in 2023. The decrease was driven by a decrease in net policy benefit & claims, a decrease in general, administrative & other expenses and a decrease in compensation & benefits, partially offset by an increase in interest sensitive contract benefits, an increase in interest expense and an increase in DAC amortization.
Net policy benefits and claims were ($10.0) million in 2024, a decrease of $4.6 million from ($5.5) million in 2023, primarily driven by a favorable in-force updates and favorable assumption changes related to the LTC business in 2024, partially offset by higher interest accretion in 2024 compared to 2023.
General, administrative & other expenses were $16.3 million in 2024, a decrease of $2.9 million from $19.2 million in 2023. Expenses were higher in 2023 primarily due to the one-time implementation cost of IFRS 17.
Compensation and benefits were $1.4 million in 2024, a decrease of $0.6 million from $2.0 million in 2023, primarily driven by departure of employees in 2024. This reduction in cost is anticipated to be temporary in nature.
Interest sensitive contract benefits were $15.0 million in 2024, an increase of $5.5 million from $9.4 million in 2023, primarily driven by growth in the Insurance Segment's MYGA business and higher rates on new MYGA.
Interest expense was $1.3 million in 2024, an increase of $0.8 million from $0.5 million in 2023, primarily due to a full year of interest expense in 2024 on a new surplus note which was issued in August 2023 and had only 4 months worth of interest expense in 2023.
DAC amortization was $2.2 million in 2024, an increase of $0.5 million from $1.7 million in 2023, primarily due to growth in insurance segment's MYGA business resulted in higher DAC and its amortization.
Income Tax (Provision) Benefit
Mount Logan’s income tax expense was $0.6 million in 2024, an increase of $0.2 million from $0.4 million in 2023. Income taxes were higher in 2024 due to higher taxable income attributable to Mount Logan’s Asset Management segment, which primarily operates in the US, including a catch up tax expense for unrealized carry being recognized as income for tax purposes in one of the fund’s managed by Mount Logan. The (provision) benefit for income taxes includes federal, state, local and foreign income taxes, resulting in an effective income tax rate of (6.2%) for 2024 and 2023, respectively. The most significant reconciling items between the U.S. federal statutory income tax rate and the effective income tax rate were due to the following: (i) foreign accrual property income, as Mount Logan Capital is a Canadian tax paying entity and (ii) changes in deferred tax assets. Mount Logan does not expect a material increase to its consolidated effective tax rate or earnings and results of operations as a result of the utilization of the deferred tax assets, though Mount Logan can provide no assurance that the impacts will not be material in future years. See note 18 to the consolidated financial statements for further details regarding Mount Logan’s income tax (provision) benefit.
Segment Analysis
Discussed below are Mount Logan’s results of operations for each of Mount Logan’s reportable segments. They represent the segment information available and utilized by management to assess performance and to allocate resources. See note 23 to Mount Logan’s consolidated financial statements for more information regarding Mount Logan’s segment reporting.
119
Asset Management
The following table presents FRE, the performance measure of Mount Logan’s Asset Management segment.
| For the year ended | December 31, 2024 | December 31, 2023 | ||||||||||||
| Asset Management | ||||||||||||||
| Management fees | $ | 16,758 | $ | 13,990 | ||||||||||
| Incentive fees | 3,198 | 1,283 | ||||||||||||
| Equity investment earnings | 680 | 1,124 | ||||||||||||
Interest income(1) | 1,091 | 1,087 | ||||||||||||
| Fee-related compensation | (5,665) | (1,895) | ||||||||||||
| Other operating expenses: | ||||||||||||||
| Administration and servicing fees | (4,290) | (1,907) | ||||||||||||
| General, administrative and other | (2,693) | (4,725) | ||||||||||||
| Fee related earnings | 9,079 | 8,957 | ||||||||||||
_______________
(1)Represents interest income on a loan asset related to a fee generating vehicle
Year Ended December 31, 2024 Compared to Year Ended December 31, 2023
In this section, references to 2024 refer to the year ended December 31, 2024, and references to 2023 refer to the year ended December 31, 2023.
FRE was $9.1 million in 2024, an increase of $0.1 million compared to $9.0 million in 2023. FRE was flat primarily because increases in management and incentive fees were offset by increases in fee-related compensation and administration and servicing fees.
The increase in management fees was primarily attributable to higher fees earned from OCIF due to growth in AUM, a full year of management fees from the funds managed by the Ovation GP compared to 2023 during which the Ovation GP acquisition closed in the third quarter, and First Trust continuing to scale with increased AUM.
The increase in incentive fees was primarily attributable to fees earned from OCIF of $1.7 million in 2024 compared to close to $nil in 2023, reflecting improved fund performance.
The growth in revenues was offset by increases in fee-related compensation and other operating expenses. The increase in fee-related compensation was driven by corresponding growth in fee related revenues and increased headcount. The increase in other operating expenses was primarily driven by additional headcount which support the Asset Management segment, an increase in net economic loss attributable to Mount Logan's service agreement with SCIM, and an increase in sub-investment management expenses. Mount Logan’s servicing agreement with SCIM is for ACIF, an interval fund, and is calculated as the gross management and incentive fees paid by ACIF net of expenses incurred under the servicing agreement. During 2024, management and performance fees decreased compared to 2023, while expenses remained fairly consistent. As a result, the increase in net economic loss attributable to the performance of ACIF drove the increase in operating expenses of the Asset Management segment. Sub-management expenses increased as the Asset Management segment only entered into sub-management agreements from the fourth quarter of 2023 with third parties to help manage Ability’s growing portfolio of assets.
120
Asset Management Operating Metrics
Assets Under Management
The following presents Mount Logan’s total AUM by vehicle (in millions):
| Year ended December 31, | |||||||||||||||||||||||||||||||||||||||||
| 2024 | |||||||||||||||||||||||||||||||||||||||||
| (in millions) | Ability (including consolidated VIEs) (1) | BDCs (2) | CLOs (3) | Interval Funds (4) | Ovation Funds | Other (5) | Total | ||||||||||||||||||||||||||||||||||
Change in Total AUM (6) | |||||||||||||||||||||||||||||||||||||||||
| Beginning of Period | $ | 695 | $ | 334 | $ | 634 | $ | 342 | $ | 255 | $ | 66 | $ | 2,326 | |||||||||||||||||||||||||||
| Inflows | 73 | 116 | — | 147 | 8.00 | 44 | 388 | ||||||||||||||||||||||||||||||||||
| Outflows | (23) | (172) | — | (73) | (7) | (3) | (278) | ||||||||||||||||||||||||||||||||||
| Net Flows | 50 | (56) | — | 74 | 1 | 41 | 110 | ||||||||||||||||||||||||||||||||||
| Realizations | — | (34) | (68) | (32) | (26) | (2) | (162) | ||||||||||||||||||||||||||||||||||
| Market activity and other | 1 | 61 | (2) | 25 | (19) | 5 | 71 | ||||||||||||||||||||||||||||||||||
Inter-vehicle eliminations (7) | — | — | — | (5) | — | — | (5) | ||||||||||||||||||||||||||||||||||
| End of Period | $ | 746 | $ | 305 | $ | 564 | $ | 404 | $ | 211 | $ | 110 | $ | 2,340 | |||||||||||||||||||||||||||
| Year ended December 31, | |||||||||||||||||||||||||||||||||||||||||
| 2023 | |||||||||||||||||||||||||||||||||||||||||
| (in millions) | Ability (including consolidated VIEs) (1) | BDCs (2) | CLOs (3) | Interval Funds (4) | Ovation Funds | Other (5) | Total | ||||||||||||||||||||||||||||||||||
Change in Total AUM (6) | |||||||||||||||||||||||||||||||||||||||||
| Beginning of Period | $ | 543 | $ | 370 | $ | 637 | $ | 292 | $ | 273 | $ | 49 | $ | 2,164 | |||||||||||||||||||||||||||
| Inflows | 150 | 75 | — | 98 | 33.00 | 29 | 385 | ||||||||||||||||||||||||||||||||||
| Outflows | (6) | (144) | — | (43) | (61) | (17) | (271) | ||||||||||||||||||||||||||||||||||
| Net Flows | 144 | (69) | — | 55 | (28) | 12 | 114 | ||||||||||||||||||||||||||||||||||
| Realizations | — | (33) | — | (21) | (12) | 1 | (65) | ||||||||||||||||||||||||||||||||||
| Market activity and other | 8 | 67 | (3) | 17 | 22 | 6 | 117 | ||||||||||||||||||||||||||||||||||
Inter-vehicle eliminations (7) | — | — | — | (8) | — | — | (8) | ||||||||||||||||||||||||||||||||||
| End of Period | $ | 695 | $ | 335 | $ | 634 | $ | 335 | $ | 255 | $ | 68 | $ | 2,322 | |||||||||||||||||||||||||||
______________
(1)Ability’s AUM excludes assets held under the funds withheld and modco agreements.
(2)ML Management manages Logan Ridge Finance Corporation and through another subsidiary, owns a 24.99% interest in SCIM, which is the manager of Portman.
(3)ML Management is the adviser to two CLOs 2018-01 and 2019-01.
(4)ML Management is the adviser to OCIF. Separately Mount Logan receives the economics of ACIF, which is an interval fund advised by SCIM, via a servicing agreement with SCIM over ACIF.
(5)Consists of several small closed end private funds and AUM which is sub-advised by ML Management.
(6)Inflows generally represent new capital which includes capital contributions, subscriptions, dividend reinvestments, draw downs on leverage facilities, and new MYGA flows and managed reinsurance assets added at Ability. Outflows include redemptions, pay downs on leverage facilities, and claims and benefits payments at Ability. Realizations represent distributions of realized income, repurchases of capital, and repayments on CLO notes. Market activity and other generally represents realized and unrealized gains (losses) on investments and other changes in AUM.
(7)Represents ACIF’s investment in OCIF.
(8)Several of the above funds are still subject to their annual audits, thus the AUM quoted above represents management’s best estimate of AUM as of December 31, 2024, but may be subject to change.
121
Year ended December 31, 2024 versus year ended December 31, 2023
Total AUM was $2.3 billion at December 31, 2024, remaining relatively flat from $2.3 billion at December 31, 2023. Mount Logan saw an increase in interval fund assets, as OCIF’s AUM increased significantly as it has continued to scale, since it was seeded in 2022. Additionally, the sub advisory relationship continued to grow in 2024, leading to a positive increase in AUM. These increases were offset by slight decreases in AUM with the CLOs Mount Logan manages as they begin harvesting their assets as well as a slight decline in the BDC assets due to the underlying decline in performance of several assets in their portfolios. The Ovation funds’ AUM will continue to decline pursuant to their winddown, which was announced in mid-2024.
Insurance Solutions
The following table presents Spread Related Earnings, the performance measure of Mount Logan’s Insurance Solutions segment:
| For the year ended | December 31, 2024 | December 31, 2023 | ||||||||||||
Insurance Solutions | ||||||||||||||
| Net investment income and realized gain (loss), net | $ | 53,477 | $ | 50,202 | ||||||||||
| Cost of funds | (22,269) | (22,758) | ||||||||||||
| Compensation and benefits | (1,367) | (2,019) | ||||||||||||
| Interest expense | (1,313) | (513) | ||||||||||||
| General, administrative and other | (14,788) | (15,730) | ||||||||||||
| Spread related earnings | $ | 13,740 | $ | 9,182 | ||||||||||
In this section, references to 2024 refer to the year ended December 31, 2024, and references to 2023 refer to the year ended December 31, 2023.
Spread Related Earnings
SRE was $13.7 million in 2024, an increase of $4.5 million, or 50%, compared to $9.2 million in 2023. The increase in SRE was primarily driven by higher net investment earnings, lower general, administrative & other expenses and lower compensation cost, partially offset by higher interest cost.
Net investment earnings increased $3.3 million, primarily driven by growth in the insurance segment's investment portfolio and higher rates on new deployment in comparison to existing portfolio related to the higher interest rate environment.
Compensation and benefits decreased by $0.6 million, primarily driven by departure of employees in 2024. This reduction in cost is expected to be temporary in nature.
Interest expense increased by $0.8 million, primarily due to full year interest expense in 2024 on a new surplus note, which was issued in August 2023 and had only 4 months’ worth of interest expense in 2023.
General, administrative & other expenses decreased by $0.9 million primarily as a result of efforts to reduce overall costs in 2024.
Net Investment Spread
| Years ended December 31, | |||||||||||||||||
| 2024 | 2023 | Change | |||||||||||||||
| Net investment income and realized gain or (loss), net | 7.4% | 8.3% | -89bps | ||||||||||||||
Cost of funds (1) | (5.3)% | (5.7)% | 37bps | ||||||||||||||
| Net Investment spread | 2.1% | 2.6% | -52bps | ||||||||||||||
122
_______________
(1)Excludes changes in future policy benefits liabilities of LTC line of business, to calculate net investment spread, which resulted from change in actuarial assumptions and future cash flow projections.
Net investment spread was 2.1% in 2024, a decrease of 52 basis points compared to 2.6% in 2023, primarily driven by lower net investment income and realized gain or (loss) percent in 2024 verses 2023 which was partially offset by lower percent of costs of funds.
Net investment income and realized gain or (loss) percent represents a percent of net investment income and realized gain (loss) over average net invested assets. Net investment income and realized gain (loss) was higher in 2024 compared to 2023 primarily driven by growth in the insurance segment's investment portfolio and higher rates on new deployment. However, net investment income percent was lower in 2024 primarily due to higher average net invested assets compared to 2023.
Cost of funds percent represents a percent of cost of funds over average net invested assets. Cost of funds were higher in 2024 compared to 2023 primarily due to higher crediting cost of MYGA liabilities and higher amortization of DAC which was partially offset by lower cost of liabilities for LTC line of business. However, cost of funds percent was lower due to higher average net invested assets in 2024 compared to 2023.
Net invested assets represent investments that directly back insurance segment’s net reserve liabilities as well as surplus assets. Net invested assets for insurance segment includes (a) total investments on the consolidated statements of financial position, with available-for-sale securities, trading securities and mortgage loans at cost or amortized cost, (b) cash and cash equivalents and restricted cash, (c) investments in related parties, (d) accrued investment income, (e) VIE assets, and (f) net investment payables and receivables. Net invested assets exclude the investment assets under funds withheld arrangement with FSR and assets under Modco agreement with Vista. Net invested assets also exclude mark-to-market adjustment (net unrealized gains (losses)) including provision for credit losses recognized in consolidated statement of operations during the year.
Investment Portfolio and Net Investment Spread
Ability had total investments, including related parties and consolidated VIEs, of $1,042 million and $1,009 million as of December 31, 2024, and December 31, 2023, respectively. Total investments have risen by 3.3% compared to 2023, which is primarily driven by acquisition of new investments into Ability's portfolio. Ability’s investment strategy seeks to achieve sustainable risk-adjusted returns through the disciplined management of its investment portfolio against its duration of liabilities. The investment strategies focus primarily on a buy and hold asset allocation strategy that may be adjusted periodically in response to changing market conditions and the nature of Ability’s liability profile. Ability takes advantage of its generally persistent liability profile by identifying investment opportunities with an emphasis on earning incremental yield by taking measured liquidity and complexity risk rather than assuming incremental credit risk. Ability has selected a diverse array of primarily high-grade fixed income assets including corporate bonds, structured securities and commercial real estate loans, among others. Ability also maintains holdings in floating rate and less rate-sensitive instruments, including CLOs, non-agency RMBS and various types of structured products, both as an expression of its macroeconomic views as well as to capture incremental returns versus fixed rate instruments. Depending on its market outlook, Ability will use financial hedges to increase or reduce its exposure to various macroeconomic factors, including interest rate, foreign currency exchange rate, and / or performance of market indices. In addition to its fixed income portfolio, Ability opportunistically allocates to alternative investments where it primarily focuses on fixed income-like, cash flow-based investments.
Liquidity and Capital Resources
Overview
Mount Logan primarily derives revenues and cash flows from the assets it manages and the retirement savings products it issues and reinsures. Based on management’s experience, Mount Logan believes that its current liquidity position, together with the cash generated from revenues will be sufficient to meet Mount Logan’s anticipated expenses and other working capital needs for at least the next 12 months. For the longer-term liquidity
123
needs of the Asset Management business, Mount Logan expects to continue to fund the Asset Management business’s operations through management fees and incentive fees received. The principal sources of liquidity for the Insurance Solutions segment, in the ordinary course of business, are operating cash flows and holdings of cash, cash equivalents and other readily marketable assets. At December 31, 2024, Mount Logan had $86.0 million of unrestricted cash and cash equivalents.
Primary Uses of Cash
Over the next 12 months, Mount Logan expects its primary liquidity needs will be to:
•support the future growth of Mount Logan's businesses through strategic corporate investments;
•pay Mount Logan’s operating expenses, including, compensation, general, administrative, and other expenses;
•make payments to policyholders for surrenders, withdrawals and payout benefits;
•make interest and principal payments on funding agreements;
•pay taxes; and
•pay cash dividends.
Over the long term, Mount Logan believes it will be able to (i) grow Mount Logan's Assets Under Management and generate positive investment performance in the funds Mount Logan manages, which it expects will allow us to grow its management fees and incentive fees and (ii) grow the investment portfolio of insurance solutions services, in each case in amounts sufficient to cover Mount Logan’s long-term liquidity requirements, which may include:
•supporting the future growth of our businesses;
•creating new or enhancing existing products and investment platforms;
•making payments to policyholders;
•pursuing new strategic corporate investment opportunities; and
•paying interest and principal on Mount Logan’s financing arrangements.
Cash Flow Analysis
The section below discusses in more detail Mount Logan’s primary sources and uses of cash and the primary drivers of cash flows within Mount Logan’s consolidated statements of cash flows:
| Years ended December 31, | |||||||||||
| (in thousands) | 2024 | 2023 | |||||||||
| Operating activities | $ | (37,768) | $ | (48,942) | |||||||
| Investing activities | (26,497) | (74,476) | |||||||||
| Financing activities | 75,749 | 128,721 | |||||||||
| Cash, cash equivalents and restricted cash, and cash and cash equivalents of consolidated VIEs, end of period | $ | 101,704 | $ | 90,220 | |||||||
Operating Activities
Mount Logan’s operating activities support its Asset Management and Insurance Solutions activities. The primary sources of cash within operating activities include: (a) management and performance fees, (b) insurance premiums, (c) reinsurance recoverable, (d) proceeds for sales of investments from Mount Logan’s consolidated VIEs and (e) cash interest received from investments. The primary uses of cash within operating activities include: (a)
124
investment purchases from Mount Logan’s consolidated VIEs (b) compensation and non-compensation related expenses, (c) benefit payments, (d) cash interest paid on debt obligations and (e) other operating expenses. A significant use of cash within operating activities pertain to future policy benefits incurred in the LTC business. As the LTC business is in run-off, this activity is expected to have less of an impact to cash outflow over time.
•During the year ended December 31, 2024, cash used in operating activities reflects cash inflows of management fees, realized incentive fees revenues, net investment income, and reinsurance recoverables offset by cash paid for interest on funding agreements, taxes, benefit payments, policy acquisition costs and other operating expenses. Net cash provided by operating activities includes net cash used in Mount Logan’s consolidated VIEs, which primarily includes purchases of VIEs’ investments offset by net proceeds from the sale of VIEs’ investments.
•We financed our negative cashflow from operations during the year ended December 31, 2024 through increased borrowings of the Asset Management business. We monitor our cash flow projections on a current basis and take active measures to obtain the funding it requires to continue our operations. However, these cash flow projections are subject to various uncertainties concerning their fulfillment such as the ability to increase revenues by establishing new funds and to raise additional investor capital within such funds as well as continuing to grow and scale our Insurance Solutions business. When disbursements for claims, policy acquisition costs and other operating expenses exceed premium inflows, cash flow from insurance operations is negative. The effect on cash flow from operations is partially offset by cash flow from investment income. Additionally, cash inflows from investment maturities of both short-term investments and longer-term maturities are available to supplement other operating cash flows.
•During the year ended December 31, 2023, cash used in operating activities reflects cash inflows of management fees, incentive fees, net investment income, offset by cash paid for interest on funding agreements, policy acquisition costs, reinsurance recoverables, and operating expenses. Net cash provided by operating activities includes net cash used in Mount Logan’s consolidated VIEs, which primarily includes purchases of VIEs’ investments, offset by net proceeds from the sale of VIEs’ investments.
•We financed our negative cashflow from operations during the year ended December 31, 2023 through increased borrowings of the Asset Management and Insurance Solutions businesses.
Mount Logan’s ability to execute Mount Logan’s business strategy, particularly Mount Logan’s ability to increase Mount Logan’s AUM, depends on Mount Logan’s ability to establish new funds and to raise additional investor capital within such funds. Mount Logan’s liquidity will depend on a number of factors, such as Mount Logan’s ability to project our financial performance, which is highly dependent on the funds it manage and its ability to manage our projected costs, fund performance, access to credit facilities, compliance with existing credit agreement, as well as industry and market trends. Also during economic downturns the funds Mount Logan manages might experience cash flow issues or liquidate entirely. In these situations, Mount Logan might be asked to reduce or eliminate the management fee and incentive fees it charges, which could adversely impact Mount Logan’s cash flow in the future. An increase in the fair value of the investments of the funds Mount Logan manages, by contrast, could favorably impact its liquidity through higher management fees where the management fees are calculated based on the net asset value, gross assets or adjusted assets. Additionally, higher incentive fees not yet realized would generally result when investments appreciate over their cost basis which would not have an impact on the Asset Management business’s cash flow until realized.
Investing Activities
Mount Logan’s investing activities support the growth of its business. The primary sources of cash within investing activities include sales, maturities and repayments of investments. The primary uses of cash within investing activities include: (a) acquisition of consolidated business(es) and (b) purchases and acquisitions of new investments. The cash flow activities related to MYGA products is split across investing activities and financing activities. As the Company assumes new MYGA products, the receipt of cash is reported in financing activities and the corresponding purchase of securities is reported in investing activities. As a result, as the MYGA portfolio
125
grows, these cash flow activities while related, will continue to present an inflow to financing activities and an outflow to investing activities.
•During the year ended December 31, 2024, cash used in investing activities primarily reflects the purchase of investments, mainly available-for-sale (“AFS”) and mortgage loans, due to the deployment of significant cash inflows from Ability's growth, partially offset by the sales, maturities and repayments of investments.
•During the year ended December 31, 2023, cash used in investing activities primarily reflects the purchase of investments due to the deployment of significant cash inflows from Ability's growth, partially offset by the sales, maturities and repayments of investments, and cash used to acquire Ovation.
Financing Activities
Mount Logan’s financing activities reflect its capital market transactions and transactions with equity holders. The primary sources of cash within financing activities primary include proceeds from debt issuances and proceeds from reinsurance of MYGA. The primary uses of cash within financing activities include dividends paid and repayments of debt.
•During the year ended December 31, 2024, cash provided by financing activities primarily reflects cash received from increased borrowings of the Asset Management business partially offset by repayment of debt and dividends to shareholders as well as annuity payments, net of cash inflows of the insurance solutions business for investment-type policies.
•During the year ended December 31, 2023, cash provided by financing activities primarily reflects cash received from increased borrowings of the Asset Management business and insurance solutions business partially offset by repayment of borrowings from the Asset Management business and annuity payments, net of cash inflows of the Insurance Solutions business for investment-type policies.
Contractual Obligations, Commitments and Contingencies
For a summary and a description of the nature of Mount Logan’s commitments, contingencies and contractual obligations, see note 24 to the consolidated financial statements.
Consolidated VIEs
Mount Logan manages its liquidity needs by evaluating unconsolidated cash flows; however, Mount Logan’s financial statements reflect the financial position of Mount Logan as well as consolidated VIEs. The primary sources and uses of cash at Mount Logan's consolidated VIEs include: (a) proceeds from sales, maturities and repayments of investments and (b) purchase of investments.
Dividends and Distributions
For information regarding the quarterly dividends that were made to common stockholders and distribution equivalents on participating securities, see note 19 to the consolidated financial statements. Although Mount Logan currently expects to pay dividends, Mount Logan may not pay dividends if, among other things, Mount Logan does not have the cash necessary to pay the dividends. To the extent it does not have sufficient cash on hand to pay dividends, Mount Logan may have to borrow funds to pay dividends, or it may determine not to pay dividends. The primary source of funds for dividends is distributions from Mount Logan’s operating subsidiaries, which are expected to be adequate to fund dividends and other cash flow requirements based on current estimates of future obligations. The ability of these operating subsidiaries to make distributions to Mount Logan will depend on satisfying applicable law with respect to such distributions, including surplus and minimum solvency requirements among others. On March 13, 2025 Mount Logan declared a cash dividend of C$0.02 per share of its common stock, which was paid on April 10, 2025, to holders of record at the close of business on April 3, 2025.
126
Asset Management Liquidity
Mount Logan’s Asset Management business requires limited capital resources to support the working capital or operating needs of the business. For the Asset Management business’s longer term liquidity needs, Mount Logan expects to continue to fund the Asset Management business’s operations through management fees and performance fees received. Liquidity needs are also met through proceeds from borrowings and equity issuances as described in note 12 and note 19 to the consolidated financial statements, respectively. From time to time, if Mount Logan determines that market conditions are favorable after taking into account Mount Logan’s liquidity requirements, we may seek to raise proceeds through the issuance of additional debt or equity instruments.
At December 31, 2024, the Asset Management business had $8.9 million of unrestricted cash and cash equivalents.
Future Debt Obligations
The Asset Management business had long-term debt of $76.3 million at December 31, 2024, which includes notes with maturities in 2025, 2027, 2031 and 2032. There are also scheduled incremental repayments of principal on the credit facility in 2025 and 2026. See note 12 to the consolidated financial statements for further information regarding the Asset Management business’s debt arrangements.
Future Cash Flows
Mount Logan’s ability to execute Mount Logan’s business strategy, particularly Mount Logan’s ability to increase Mount Logan’s AUM, depends on Mount Logan’s ability to establish new funds and to raise additional investor capital within such funds. Mount Logan’s liquidity will depend on a number of factors, such as Mount Logan’s ability to project our financial performance, which is highly dependent on the funds it manage and its ability to manage our projected costs, fund performance, access to credit facilities, compliance with existing credit agreement, as well as industry and market trends. Also during economic downturns the funds Mount Logan manages might experience cash flow issues or liquidate entirely. In these situations, Mount Logan might be asked to reduce or eliminate the management fee and incentive fees it charges, which could adversely impact Mount Logan’s cash flow in the future. An increase in the fair value of the investments of the funds Mount Logan manages, by contrast, could favorably impact its liquidity through higher management fees where the management fees are calculated based on the net asset value, gross assets or adjusted assets. Additionally, higher incentive fees not yet realized would generally result when investments appreciate over their cost basis which would not have an impact on the Asset Management business’s cash flow until realized.
Consideration of Financing Arrangements
As noted above, the Asset Management business has and may continue to issue debt to supplement its liquidity. The decision to enter into a particular financing arrangement is made after careful consideration of various factors, including the Asset Management business’s cash flows from operations, future cash needs, current sources of liquidity, demand for the Asset Management business’s debt or parent's equity, and prevailing interest rates.
Insurance Solutions Liquidity and funding risk
Liquidity risk is the risk that an entity will encounter difficulty in meeting obligations associated with its financial liabilities as they fall due or can only do so on terms that are materially disadvantageous. Prudent liquidity risk management includes maintaining sufficient cash on hand and the availability of funding through an adequate amount of committed credit facilities. Mount Logan also has the ability to raise additional liquidity through the issuance of debt, and through the sale of its portfolio investments. Periodic cash flow forecasts are performed to ensure Ability has sufficient cash to meet operational and financing costs.
127
Liquid assets
Liquid assets, including high-quality assets that are marketable, can be pledged as security for borrowings, and can be converted to cash in a time frame that meets liquidity and funding requirements.
| As at | December 31, 2024 | December 31, 2023 | ||||||||||||
Cash and cash equivalents(1) | $ | 77,055 | $ | 89,230 | ||||||||||
| Restricted cash | 15,716 | — | ||||||||||||
| Investments | 637,048 | 645,559 | ||||||||||||
| Receivable for investments sold | 17,045 | 6,511 | ||||||||||||
Accrued interest and dividend receivable(1) | 18,580 | 18,521 | ||||||||||||
| Total liquid assets | $ | 765,444 | $ | 759,821 | ||||||||||
______________
(1)Cash and cash equivalents and accrued interest & dividend receivable includes cash and cash equivalent and accrued interest of consolidated VIEs, respectively.
The liquid assets held by Mount Logan's insurance company, Ability, are subject to restrictions which prevent Mount Logan from transferring these assets to other entities within the group without insurance regulatory approvals. These assets are not restricted for use within the insurance company.
Insurance Subsidiaries’ Operating Liquidity
The primary cash flow sources for Ability include retirement services product inflows, investment income, and principal repayments on its investments. Uses of cash include investment purchases, payments to policyholders for surrenders, withdrawals and payout benefits, interest and principal payments on funding agreements and outstanding debt, policy acquisition and general operating costs.
Ability’s policyholder obligations are generally long-term in nature. However, policyholders may elect to withdraw some, or all, of their account value in amounts that exceed Ability’s estimates and assumptions over the life of an annuity contract. Ability includes provisions within its annuity policies, such as surrender charges and market value adjustments, which are intended to protect it from early withdrawals. As of December 31, 2024, and December 31, 2023, approximately 76% and 78%, respectively, of Ability’s annuity liabilities were subject to penalty upon surrender. In addition, as of December 31, 2024, and December 31, 2023, approximately 85% and 98%, respectively, of policies contained Market Value Adjustments (“MVAs”) that may also have the effect of limiting early withdrawals if interest rates increase but may encourage early withdrawals by effectively subsidizing a portion of surrender charges when interest rates decrease.
Dividends from Insurance Subsidiaries
The NAIC has established minimum capital requirements in the form of RBC that factors the type of business written by an insurance company, the quality of its assets and various other aspects of its business to develop a minimum level of capital known as “authorized control level risk-based capital” and compares this level to adjusted statutory capital that includes capital and surplus as reported under SAP, plus certain investment reserves. Should the ratio of adjusted statutory capital to control level RBC fall below 200%, a series of remedial actions by the affected company would be required. As of December 31, 2024, and 2023, the RBC ratio of Ability was 325% and 400%, respectively.
The ability to pay dividends is limited by applicable laws and regulations of the jurisdiction where Ability is domiciled, as well as agreement(s) entered into with regulators. These laws and regulations require, among other things, Ability to maintain minimum solvency requirements and limit the amount of dividends Ability can pay. Nebraska state insurance laws and regulations require that the statutory surplus following any dividend or distribution must be reasonable in relation to their outstanding liabilities and adequate for its financial needs.
128
Future Debt Obligations
Ability had long-term debt of $14.3 million as of December 31, 2024, which includes notes with maturities in 2028 and 2032. See note 12 to the consolidated financial statements for further information regarding Ability’s debt arrangements.
Capital
Ability believes it has a strong capital position and is well positioned to meet policyholder and other obligations. Ability measures capital sufficiency using various internal capital metrics which reflect management’s view on the various risks inherent to its business, the amount of capital required to support its core operating strategies and the amount of capital necessary to maintain its current ratings in a recessionary environment. The amount of capital required to support Ability’s core operating strategies is determined based upon internal modeling and analysis of economic risk, as well as inputs from rating agency capital models and consideration of NAIC risk-based capital (“RBC”) requirements. Capital in excess of this required amount is considered excess equity capital, which is available to deploy. As of December 31, 2024, and December 31, 2023, Ability’s RBC ratio was 325% and 400%, respectively. The formulas for determining the amount of RBC specify various weighting factors that are applied to financial balances or various levels of activity based on the perceived degree of risk.
Critical Accounting Estimates
This Management’s Discussion and Analysis of Financial Condition and Results of Operations is based upon the consolidated financial statements, which have been prepared in accordance with U.S. GAAP. The preparation of financial statements in accordance with U.S. GAAP requires the use of estimates and assumptions that could affect the reported amounts of assets and liabilities, the disclosure of contingent assets and liabilities and the reported amounts of revenues and expenses. Actual results could differ from these estimates. A summary of our significant accounting policies is presented in note 2 to our consolidated financial statements. The following is a summary of our accounting policies that are affected most by judgments, estimates and assumptions.
Critical Accounting Estimates - Overall
Consolidation
Mount Logan assesses all entities in which Mount Logan has a variable interest for consolidation including management companies, insurance companies, investment companies, collateralized loan obligations (“CLOs”), and other entities. A variable interest is an investment or other interest that will absorb portions of an entity’s expected losses and/or receive expected residual returns. Fees earned by Mount Logan that (i) include terms, conditions, or amounts that are customarily present in arrangements for similar services negotiated at arm’s length, (ii) are commensurate with the level of effort required to provide those services, and (iii) where Mount Logan does not hold other economic interests in the entity that would absorb more than an insignificant amount of the expected losses or returns of the entity, would not be considered to be variable interests.
Pursuant to its consolidation policy, once Mount Logan determines it has a variable interest in an entity, Mount Logan considers whether the entity is a VIE. Entities that do not qualify as VIEs are assessed for consolidation as voting interest entities ("VOEs") under the voting interest model.
An entity is a VIE if one of the following conditions exist: (a) the equity at risk is not sufficient for the entity to finance its activities without additional subordinated financial support, (b) the holders of the equity at risk (as a group) lack the ability to make decisions about the activities that most significantly impact the entity’s economic performance, or (c) the voting rights of some investors are disproportionate to their obligation to absorb the expected losses of the legal entity, their rights to receive the expected residual returns of the legal entity, or both and substantially all of the legal entity's activities either involve or are conducted on behalf of an investor with disproportionately few voting rights. Limited partnerships and other similar entities where limited partners, not affiliated with the general partner, have not been granted (i) substantive participation rights or (ii) substantive rights to either dissolve the partnership or remove the general partner are VIEs.
129
Mount Logan consolidates VIEs in which it is the primary beneficiary. Mount Logan is the primary beneficiary if it holds a controlling financial interest which is defined as possessing both (a) the power to direct the activities of a VIE that most significantly impact the VIE's economic performance and (b) the obligation to absorb losses of the VIE or the right to receive benefits from the VIE that could potentially be significant to the VIE. Mount Logan determines whether it is the primary beneficiary of a VIE at the time it becomes involved with a VIE and reconsiders that conclusion on an ongoing basis if facts and circumstances change.
Entities determined not to be VIEs are VOEs and are evaluated under the voting interest model. Mount Logan typically consolidates VOEs when it has a majority voting interest.
Each entity is assessed for consolidation individually considering the specific facts and circumstances surrounding that entity. The consolidation assessment, including the determination whether an entity is a VIE or VOE, depends on the facts and circumstances for each entity, and therefore Mount Logan’s investment companies may qualify as VIEs or VOEs.
With respect to CLOs (which are generally VIEs), as collateral manager, Mount Logan generally has the power to direct the activities of the CLO that most significantly impact the CLO’s economic performance. In some, but not all cases, Mount Logan, through its ownership in the CLOs, may have variable interests that represent an obligation to absorb losses of, or a right to receive benefits from, the CLO that could potentially be significant to the CLO. In cases where Mount Logan has both the power to direct the activities of the CLO that most significantly impact the CLO’s economic performance and the obligation to absorb losses of the CLO or the right to receive benefits from the CLO that could potentially be significant to the CLO, Mount Logan is deemed to be the primary beneficiary and consolidates the CLO.
Assets and liabilities of the consolidated VIEs are primarily presented in separate sections within the Consolidated Statements of Financial Position. Changes in the fair value of the consolidated VIEs’ assets and liabilities and related interest, dividend and other income and expenses are primarily presented within revenues of consolidated variable interest entities and Income of consolidated variable interest entities, for the Asset Management and Insurance Solutions segments, respectively, in the Consolidated Statements of Operations.
Income Taxes
Significant judgment is required in determining tax expense and in evaluating certain and uncertain tax positions. Mount Logan recognizes the tax benefit of uncertain tax positions when the position is “more likely than not” to be sustained upon examination, including resolution of any related appeals or litigation processes, based on the technical merits of the position. The tax benefit is measured as the largest amount of benefit that has a greater than 50% likelihood of being realized upon ultimate settlement. If a tax position is not considered more likely than not to be sustained, then no benefits of the position are recognized. Mount Logan’s tax positions are reviewed and evaluated quarterly to determine whether Mount Logan has uncertain tax positions that require financial statement recognition.
Deferred tax assets and liabilities are recognized for the expected future tax consequences of differences between the carrying amount of assets and liabilities and their respective tax bases using currently enacted tax rates. The effect on deferred tax assets and liabilities of a change in tax rates is recognized in income in the period during which the change is enacted. Deferred tax assets are reduced by a valuation allowance when it is more likely than not that all or a portion of the deferred tax assets will not be realized.
Critical Accounting Estimates- Asset Management Segment
Investments, at Fair Value
On a quarterly basis, Mount Logan utilizes a valuation committee consisting of members from senior management, to review and approve the valuation results related to the investments of the funds ML Management manages. Mount Logan also retains external valuation firms to provide third-party valuation consulting services to Mount Logan, which consist of certain limited procedures that management identifies and requests them to perform. The limited procedures provided by the external valuation firms assist management with validating their valuation
130
results or determining fair value. Mount Logan performs various back-testing procedures to validate their valuation approaches, including comparisons between expected and observed outcomes, forecast evaluations and variance analyses. However, because of the inherent uncertainty of valuation, the estimated values may differ significantly from the values that would have been used had a ready market for the investments existed, and the differences could be material. The fair values of the investments in the funds Mount Logan manages can be impacted by changes to the assumptions used in the underlying valuation models. There have been no material changes to the valuation approaches utilized during the periods that Mount Logan’s financial results are presented in this report.
Fair Value of Financial Instruments
Except for Mount Logan’s debt obligations (each as defined in note 12 to Mount Logan’s consolidated financial statements), Mount Logan's financial instruments are recorded at fair value or at amounts whose carrying values approximate fair value. See “Investments, at Fair Value” above. While Mount Logan's valuations of portfolio investments are based on assumptions that Mount Logan believes are reasonable under the circumstances, the actual realized gains or losses will depend on, among other factors, future operating results, the value of the assets and market conditions at the time of disposition, any related transaction costs and the timing and manner of sale, all of which may ultimately differ significantly from the assumptions on which the valuations were based. Financial instruments’ carrying values generally approximate fair value because of the short-term nature of those instruments or variable interest rates related to the borrowings.
Revenue Recognition
Management Fees
ML Management provides investment management services to investment funds, CLOs, and other vehicles in exchange for a management fee. Management fees are determined quarterly using an annual rate which are generally based upon (i) a percentage of the capital committed during the commitment period, and thereafter based on the remaining invested capital of unrealized investments, or (ii) net asset value, gross assets, or as otherwise provided in the respective agreements. Management fees are recognized over time, during the period in which the related services are performed.
Incentive Fees
ML Management provides investment management services to investment funds, CLOs, managed accounts and other vehicles in exchange for a management fee, as discussed above and, in some cases an incentive fee, a type of performance revenue. The incentive fee consists of two parts: (i) an income incentive fee which is based on pre-incentive fee net investment income in excess of a hurdle rate and (ii) a capital gains incentive fee which is based on cumulative realized capital gains and losses and unrealized capital depreciation. Incentive fees are considered a form of variable consideration as they are based the fund achieving certain investment return hurdles. Accordingly, the recognition of such fee is deferred until it is probable that a significant reversal in the amount of cumulative revenue will not occur, which is generally upon liquidation of the investment fund. Accordingly, the recognition of such fee is deferred until it is probable that a significant reversal in the amount of cumulative revenue will not occur, which is generally upon liquidation of the investment fund.
Critical Accounting Estimates - Insurance Solutions Segment
Investments
Mount Logan is responsible for the fair value measurement of investments presented in the consolidated financial statements. Mount Logan performs regular analysis and review of its valuation techniques, assumptions and inputs used in determining fair value to evaluate if the valuation approaches are appropriate and consistently applied, and the various assumptions are reasonable. Mount Logan also performs quantitative and qualitative analysis and review of the information and prices received from commercial pricing services and broker-dealers, to verify it represents a reasonable estimate of the fair value of each investment. In addition, Mount Logan uses both internally-developed and commercially-available cash flow models to analyze the reasonableness of fair values using credit spreads and other market assumptions, where appropriate. For investment funds, Mount Logan typically
131
recognizes its investment, including those for which it has elected the fair value option, based on net asset value information provided by the general partner or related asset manager. For a discussion of investments for which it has elected the fair value option, see note 9 to the consolidated financial statements.
Valuation of Fixed Maturity Securities, Equity Securities and Mortgage Loans
The following table presents the fair value of fixed maturity securities, equity securities and mortgage loans, including those with related parties and those held by consolidated VIEs, by fair value hierarchy. Investments classified as Equity Method for which the FVO has not been elected have been excluded from the table below:
| Fair Value Measurements | ||||||||||||||||||||||||||||||||
| December 31, 2024 | Level 1 | Level 2 | Level 3 | NAV | Total | |||||||||||||||||||||||||||
| Financial assets | ||||||||||||||||||||||||||||||||
| Asset Management | ||||||||||||||||||||||||||||||||
| Equity securities | $ | 1,777 | $ | — | $ | 499 | $ | — | $ | 2,276 | ||||||||||||||||||||||
Total financial assets — Asset Management | 1,777 | — | 499 | — | 2,276 | |||||||||||||||||||||||||||
| Insurance Solutions | ||||||||||||||||||||||||||||||||
| Debt securities: | ||||||||||||||||||||||||||||||||
| U.S. government and agency | — | 8,075 | — | — | 8,075 | |||||||||||||||||||||||||||
| U.S. state, territories and municipalities | — | 5,252 | — | — | 5,252 | |||||||||||||||||||||||||||
| Other government and agency | — | 2,369 | — | — | 2,369 | |||||||||||||||||||||||||||
| Corporate | — | 226,249 | — | — | 226,249 | |||||||||||||||||||||||||||
| Asset and mortgage-backed securities | — | 364,875 | 8,641 | — | 373,516 | |||||||||||||||||||||||||||
| Corporate loans | — | — | 114,734 | — | 114,734 | |||||||||||||||||||||||||||
| Equity securities | 310 | 11,134 | 2,918 | 2,042 | 16,404 | |||||||||||||||||||||||||||
| Other invested assets | — | — | 4,575 | — | 4,575 | |||||||||||||||||||||||||||
Total financial assets — Insurance Solutions | 310 | 617,954 | 130,868 | 2,042 | 751,174 | |||||||||||||||||||||||||||
| Equity securities of consolidated VIEs | — | — | 141 | — | 141 | |||||||||||||||||||||||||||
| Corporate loans of consolidated VIEs | — | — | 125,757 | — | 125,757 | |||||||||||||||||||||||||||
| Total financial assets including consolidated VIEs | 310 | 617,954 | 256,766 | 2,042 | 877,072 | |||||||||||||||||||||||||||
| Total financial assets | $ | 2,087 | $ | 617,954 | $ | 257,265 | $ | 2,042 | $ | 879,348 | ||||||||||||||||||||||
| Financial liabilities | ||||||||||||||||||||||||||||||||
| Asset Management | ||||||||||||||||||||||||||||||||
| Debt obligations | $ | — | $ | — | $ | 1,471 | $ | — | $ | 1,471 | ||||||||||||||||||||||
Total financial liabilities — Asset Management | — | — | 1,471 | — | 1,471 | |||||||||||||||||||||||||||
| Insurance Solutions | ||||||||||||||||||||||||||||||||
| Ceded reinsurance - embedded derivative | — | 34,770 | — | 0 | 34,770 | |||||||||||||||||||||||||||
| Interest rate swaps | — | 5,192 | — | 0 | 5,192 | |||||||||||||||||||||||||||
Total financial liabilities — Insurance Solutions | — | 39,962 | — | 0 | 39,962 | |||||||||||||||||||||||||||
| Total financial liabilities | $ | — | $ | 39,962 | $ | 1,471 | $ | 0 | $ | 41,433 | ||||||||||||||||||||||
132
| Fair Value Measurements | ||||||||||||||||||||||||||||||||
| December 31, 2023 | Level 1 | Level 2 | Level 3 | NAV | Total | |||||||||||||||||||||||||||
| Financial assets | ||||||||||||||||||||||||||||||||
| Asset Management | ||||||||||||||||||||||||||||||||
| Equity securities | $ | 4,386 | $ | — | $ | 1,670 | $ | — | $ | 6,056 | ||||||||||||||||||||||
Total financial assets — Asset Management | $ | 4,386 | $ | — | $ | 1,670 | $ | — | $ | 6,056 | ||||||||||||||||||||||
| Insurance Solutions | ||||||||||||||||||||||||||||||||
| Debt securities: | ||||||||||||||||||||||||||||||||
| U.S. government and agency | — | 7,845 | — | — | 7,845 | |||||||||||||||||||||||||||
| U.S. state, territories and municipalities | — | 5,471 | — | — | 5,471 | |||||||||||||||||||||||||||
| Other government and agency | — | 2,396 | — | — | 2,396 | |||||||||||||||||||||||||||
| Corporate | — | 191,346 | — | — | 191,346 | |||||||||||||||||||||||||||
| Asset and mortgage-backed securities | — | 369,338 | 2,240 | — | 371,578 | |||||||||||||||||||||||||||
| Corporate loans | — | 28,039 | 104,588 | — | 132,627 | |||||||||||||||||||||||||||
| Equity securities | 345 | 12,088 | 3,107 | 2158 | 17,698 | |||||||||||||||||||||||||||
| Other invested assets | — | — | 10,605 | — | 10,605 | |||||||||||||||||||||||||||
Total financial assets — Insurance Solutions | 345 | 616,523 | 120,540 | 2,158 | 739,566 | |||||||||||||||||||||||||||
| Corporate loans of consolidated VIEs | — | — | 124,637 | 0 | 124,637 | |||||||||||||||||||||||||||
| Total financial assets including consolidated VIEs | 345 | 616,523 | 245,177 | 2,158 | 864,203 | |||||||||||||||||||||||||||
| Total financial assets | $ | 4,731 | $ | 616,523 | $ | 246,847 | $ | 2,158 | $ | 870,259 | ||||||||||||||||||||||
| Financial liabilities | ||||||||||||||||||||||||||||||||
| Asset Management | ||||||||||||||||||||||||||||||||
| Debt obligations | $ | — | $ | — | $ | 1,175 | $ | — | $ | 1,175 | ||||||||||||||||||||||
Total financial liabilities — Asset Management | — | — | 1,175 | — | 1,175 | |||||||||||||||||||||||||||
| Insurance Solutions | ||||||||||||||||||||||||||||||||
| Ceded reinsurance - embedded derivative | — | 34,882 | — | — | 34,882 | |||||||||||||||||||||||||||
Total financial liabilities — Insurance Solutions | — | 34,882 | — | — | 34,882 | |||||||||||||||||||||||||||
| Total financial liabilities | $ | — | $ | 34,882 | $ | 1,175 | $ | — | $ | 36,057 | ||||||||||||||||||||||
Goodwill
We review goodwill for impairment annually and whenever events or changes in the business environment may indicate the carrying amount of one of our reporting units may exceed its fair value. Our methodology for conducting this goodwill impairment testing contains both a qualitative and quantitative assessment. In evaluating the recoverability of goodwill, we perform a qualitative analysis at the reporting unit level to determine whether there are any events or circumstances that would indicate it is more likely than not that the fair value of a reporting unit is below its carrying value. Based on the results of this analysis, if we determine that it is more likely than not that the fair value of a reporting unit is less than its carrying amount, we then perform the impairment evaluation using a quantitative assessment based on an analysis of the discounted future cash flows generated by the underlying assets. The process of determining whether goodwill is impaired or recoverable relies on projections of future cash flows, operating results and market conditions. Future cash flow estimates are based partly on economic trends such as interest rates and market conditions, which are beyond our control and are likely to fluctuate.
Mount Logan has determined it has two reporting units: (1) LTC, its legacy run-off business, and (2) MYGA and & Other (“MYGA”). The fair value of reporting unit is determined from a projection of future cash flows and operating results derived from both the in-force business and new business expected in the future. This approach requires assumptions including premium growth rates, capital requirements, interest rates, mortality, morbidity, policyholder behavior, and discount rates. These assumptions are consistent with internal projections and operating plans. We believe these estimates and assumptions are reasonable and comparable to those that would be used by other marketplace participants. To calculate the fair value of the insurance business, Mount Logan discounted projected earnings from in-force contracts and valued new business growing at expected plan levels,
133
consistent with the periods used for forecasting long term businesses, in addition to considering a terminal value for the value of new business beyond five years at Mount Logan’s long-term growth rate. In arriving at its projections, Mount Logan considered past experience, economic trends such as interest rates, capital requirements and market trends. Capital requirements were based on a risk based capital (RBC) ratio of 350.0%. Excess capital above this requirement was added to the fair value of the reporting units, consistent with market participant treatment. Mount Logan's key assumptions for the new MYGA business were the (i) discrete premium growth rate, (ii) interest rate, and (iii) capital requirements, which are discussed further below:
i.The discrete MYGA premium growth rate in the fair value calculations were based on maintaining management’s target RBC ratio of 350%. RBC of 350% is anticipated to be maintained based on the performance of the investment portfolio and additional capital contributions. We assumed a higher growth rate in initial years with declining growth in the later years as we continue to scale the business;
ii.Interest rate assumptions are based on prevailing market rates at the valuation date; and,
iii.Capital requirements assumed per management’s target RBC ratio of 350%.
Management has not adjusted its assumptions between the year ended December 31, 2023 and December 31, 2024, rather, the discount rate applied to the quantitative assessment has had the most significant impact. Discount rates assumed in determining the fair value for applicable reporting units was based on a cost of equity of 17.5% and 23.5% on an after-tax basis for LTC and MYGA, respectively for impairment testing for the year ended December 31, 2024. Capital Asset Pricing Model (“CAPM”) was used to estimate the cost of equity. The cost of equity was derived using the 20-year U.S. treasury bond yield and by adding an equity risk premium. The equity risk premium considers 100 basis point and 700 basis point execution risk to account for the risk of achieving the planned forecast for LTC and MYGA, respectively. This represents a change in approach from the year ended December 31, 2023 where discount rates were based on a weighted average cost of capital of 16.0% on an after-tax basis for both LTC and MYGA. Management believes the updated approach better represents the underlying economics of its business. Changes to the discount rate ultimately impact the fair value of each reporting unit, as discussed further below.
We apply significant judgement when determining the estimated fair value of our reporting units. While we believe that our estimates of future cash flows are reasonable, these estimates are not guarantees of future performance and are subject to risks and uncertainties that may cause actual results to differ from what is assumed in our impairment tests. Such analyses are particularly sensitive to changes in estimates of discount rates, future cash flows and other market conditions. A 50 basis point increase to the discount rate assumption, all other assumptions remaining constant, would result in the carrying value exceeding the fair value of the MYGA reporting unit but not the LTC reporting unit. While a 50 basis point decrease to future cash flows, all other assumptions remaining constant, would not result in the carrying value exceeding the fair value of the LTC and/or MYGA reporting units. Management notes that these assumptions are often interdependent and shouldn’t be assessed in isolation. Further changes to these estimates might result in material changes in fair value and determination of the recoverability of goodwill, which may result in charges against earnings and a reduction in the carrying value of our goodwill in the future.
We complete our annual goodwill impairment analyses in the fourth quarter of each period presented using an October 1 measurement date. For the years ended December 31, 2024 and December 31, 2023, we determined from a qualitative standpoint there were no events or circumstances that indicated that the carrying value exceeded the fair value. From a quantitative standpoint as of October 1, 2024, we performed our annual quantitative goodwill impairment test for our reporting units, LTC and MYGA, and as of such date, the fair value was in excess of the carrying value for each reporting unit, by 24.3% and 10.7%, respectively.
Derivatives
Freestanding derivatives are instruments that Ability has entered into as part of their overall risk management strategies. Such contracts include interest rate swaps to convert floating-rate interest receipts to fixed-rate interest receipts to reduce exposure to interest rate changes. All derivatives are recognized in Derivatives liability and are presented on a gross basis in the Consolidated Statements of Financial Position and measured at fair
134
value. Changes in fair value are recorded in Accumulated Other Comprehensive Income as the swaps are in hedging relationships, with changes in fair value reclassified into Interest income in the same period as the hedged transactions affect earnings. Any interest accruals will flow through earnings as adjustments to Interest income. Ability’s derivative financial instruments contain credit risk to the extent that its counterparties may be unable to meet the terms of the agreements. Ability attempts to reduce this risk by limiting its counterparties to major financial institutions with strong credit ratings.
To qualify for hedge accounting, at the inception of the hedging relationship, Ability formally documents its risk management objective and strategy for undertaking the hedging transaction. This documentation identifies how the hedging instrument is expected to mitigate the designated risk related to the hedged item and the method that will be used to retrospectively and prospectively assess the hedge effectiveness. A derivative designated as a hedging instrument must be assessed as being highly effective in offsetting the designated risk of the hedged item. Hedge effectiveness is formally assessed at inception and periodically throughout the life of the hedge accounting relationship.
Ability issues and reinsures products or purchases investments that contain embedded derivatives. If it determines an embedded derivative has economic characteristics not clearly and closely related to the economic characteristics of the host contract, and a separate instrument with the same terms would qualify as a derivative instrument, the embedded derivative is bifurcated from the host contract and accounted for separately, unless the Fair Value Option (“FVO”) is elected on the host contract. Under the FVO, bifurcation of the embedded derivative is not necessary as the entire contract is carried at fair value with all related gains and losses recognized in Net gains (losses) from investment activities in the Consolidated Statements of Operations. Embedded derivatives are carried at fair value in the Consolidated Statements of Financial Position in the same line item as the host contract.
Additionally, reinsurance agreements written on a funds withheld or modco basis contain embedded derivatives. Ability has determined that the obligation to pay the total return on the assets supporting the funds withheld liability represents a total return swap with a floating rate leg. The fair value of embedded derivatives on funds withheld and modco agreements is computed as the unrealized gain (loss) on the underlying assets and is included within the funds withheld under reinsurance contracts in the Consolidated Statements of Financial Position.
The change in the fair value of the embedded derivatives is recorded in Net investment income (loss) on funds withheld in the Consolidated Statements of Operations. Ceded earnings from funds withheld liability and changes in the fair value of embedded derivatives are reported in operating activities in the Consolidated Statements of Cash Flows. Contributions to and withdrawals from funds withheld liability are reported in operating activities in the Consolidated Statements of Cash Flows.
Ability’s insurance operations include providing reinsurance related to LTC, as well as MYGA products. Insurance contracts are contracts with significant mortality and/or morbidity risks, while investment contracts are contracts without such risks. MYGA contracts were deemed to be investment contracts. Insurance revenue is comprised primarily of premiums and investment income. For traditional long-duration insurance contracts, Mount Logan reports premiums as revenue when due. Premiums received on MYGA products (a product without significant mortality risk) are not reported as revenue but rather as deposit liabilities. Mount Logan recognizes revenue for charges and assessments on these contracts, mostly relating to surrender charges. Interest credited to policyholder accounts is charged to expense.
Future policy benefit reserves represent the present value of future benefits to be paid to or on behalf of policyholders and related expenses less the present value of future net premiums. The liability is measured for each group of contracts (i.e., cohorts) using current cash flow assumptions. Contracts are grouped into cohorts by line of business, product type and cash flow streams, based on the date the policy was acquired (which for the entire LTC portfolio is the date of the acquisition of Ability Insurance). Future policy benefit reserves are adjusted each period because of updating lifetime net premium ratios for differences between actual and expected experience with the retroactive effect of those variances recognized in current period earnings. Ability reviews at least annually in the third quarter, future policy benefit reserves cash flow assumptions, and if the review concludes that the assumptions need to be updated, future policy benefit reserves are adjusted retroactively based on the revised net premium ratio
135
using actual historical experience, updated cash flow assumptions, and the locked-in discount rate with the effect of those changes recognized in current period earnings.
As Ability’s LTC business is in run-off, the locked-in discount rate is used for the computation of interest accretion on future policy benefit reserves recognized in earnings. However, cash flows used to estimate future policy benefit reserves are also discounted using an upper-medium grade (i.e., low credit risk) fixed-income instrument yield reflecting the duration characteristics of the liabilities and is updated each reporting period with changes recorded in AOCI. As a result, changes in the current discount rate at each reporting period are recognized as an adjustment to AOCI and not earnings each period, whereas, changes relating to cash flow assumptions are recognized in the Insurance Solutions Statement of Earnings (Loss).
Liabilities for the MYGA investment contracts equal the account value, that is, the amount that accrues to the benefit of the contract or policyholder including credited interest and assessments through the financial statement date. See Note 15 Interest sensitive contract liabilities for further information.
Recent Accounting Pronouncements
A list of recent accounting pronouncements that are relevant to Mount Logan and its industries is included in Note 2 to Mount Logan’s consolidated financial statements.
136
MANAGEMENT
The following table sets forth certain information regarding our executive officers, key persons and directors as of January 12, 2026.
Directors
Name | Age | Position(s) Held | Director Since | Other Public Company Directorships Held by Directors During the Past Five Years | ||||||||||||||||||||||
| Interested Director | ||||||||||||||||||||||||||
| Edward (Ted) Goldthorpe | 49 | Chief Executive Officer, Chair of the Board (Class III Director) | 2025 | Mount Logan Capital Inc. (September 12, 2025 – Present) Legacy MLC (October 2018 – September 12, 2025) KITS Eyecare (December 2020 – June 2024) Crescent Point Energy Corp. (May 2018 – May 2023) | ||||||||||||||||||||||
| Independent Directors | ||||||||||||||||||||||||||
| David Allen | 51 | Class III Director | 2025 | Mount Logan Capital Inc. (September 12, 2025 – Present) Legacy MLC (May 2023 – September 12, 2025) | ||||||||||||||||||||||
| Sabrina Liak | 46 | Class II Director | 2025 | Mount Logan Capital Inc. (September 12, 2025 – Present) Legacy MLC (October 2018 – September 12, 2025) KITS Eyecare (2018 – November 2024) | ||||||||||||||||||||||
| Buckley Ratchford | 54 | Class III Director | 2025 | Mount Logan Capital Inc. (September 12, 2025 – Present) Legacy MLC (June 2023 – September 12, 2025) | ||||||||||||||||||||||
| R. Rudolph Reinfrank | 70 | Class II Director | 2025 | Mount Logan Capital Inc. (September 12, 2025 – Present) Legacy MLC (February 2022 – September 12, 2025) Perception Capital Corp. II (November 2021 – October 2023) Perception Capital Corp. III (October 2023 – present) Perception Capital Corp. IV (November 2023 – present) Midcap Financial Investment Corporation (July 2013 – present) | ||||||||||||||||||||||
| Parker A. Weil | 60 | Class I Director | 2025 | Mount Logan Capital,Inc. (September 12, 2025 – Present) 180 Degree Capital Corp. (July 2017 – Present) Clean Energy Fuels, Inc. (June 2020-February 2024) | ||||||||||||||||||||||
| Matt Westwood | 55 | Class I Director | 2025 | Mount Logan Capital Inc. (September 12, 2025 – Present) Portman Ridge Finance Corporation (October 2020 – June 2025) Garrison Capital (May 2011 – October 2020) | ||||||||||||||||||||||
The address for each director is c/o Mount Logan Capital Inc., 650 Madison Avenue, 3rd Floor, New York, NY 10022.
137
Officers Who Are Not Directors
| Name | Age | Position(s) Held | Principal Occupation(s) During Past Five Years | |||||||||||||||||
| Henry Wang | 48 | President | September 12, 2025 – Present: President, Mount Logan; October 2018 - September 12, 2025: Co-President, Legacy MLC; February 2017 – current: Partner, BC Partners | |||||||||||||||||
| Nikita Klassen | 37 | Chief Financial Officer and Corporate Secretary | September 12, 2025 – Present: Chief Financial Officer and Corporate Secretary, Mount Logan; April 2024 – September 12, 2025: Chief Financial Officer, Legacy MLC; March 2023 – March 2024: Senior Controller, BC Partners; May 2022 – April 2023: Managing Director, Head of Accounting Policy, Silicon Valley Bank; May 2021 – April 2022: Head of SEC Reporting, Galaxy Digital Holdings | |||||||||||||||||
| David Held | 55 | Chief Compliance Officer | September 12, 2025 – Present, Chief Compliance Officer, Mount Logan; May 2021 – September 12, 2025: Chief Compliance Officer, Legacy MLC; May 2021 – Current: Chief Compliance Officer, BC Partners, Logan Ridge Finance Corporation, Mount Logan Management; February 2015 – May 2021: Chief Compliance Officer, Lyxor Asset Management | |||||||||||||||||
The address for each executive officer is c/o Mount Logan Capital Inc., 650 Madison Avenue, 3rd Floor, New York, NY 10022.
Biographical Information
Interested Director
Edward (Ted) Goldthorpe: Mr. Edward Goldthorpe has served on the Board of Directors since September 2025. Mr. Goldthorpe serves as Chief Executive Officer of Mount Logan and served as Chief Executive Officer and a board member of Legacy MLC from October 2018 until September 2025. Mr. Goldthorpe is the Partner in charge of the Global Credit Business for BCPA. Previously, he was the President of Apollo Investment Corporation and the Chief Investment Officer of Apollo Investment Management, heading its U.S. Opportunistic Platform. Prior to Apollo, Mr. Goldthorpe worked at Goldman Sachs for 13 years where he most recently ran the bank loan distressed investing desk and spent considerable time in their Special Situations Group. Mr. Goldthorpe currently serves on the Global Advisory Board for the Queen’s School of Business and serves on the board of directors for Crescent Point Energy, Her Justice, the Canadian Olympic Foundation and Capitalize for Kids. Mr. Goldthorpe holds a Bachelor of Commerce from Queen’s University. We believe Mr. Goldthorpe is qualified to serve on the board of Mount Logan due to the perspective and experience he brings as one of Legacy MLC’s founders and its Chief Executive Officer.
Independent Directors
David Allen: Mr. David Allen has served on the Board of Directors since September 2025. Mr. Allen served as a board member of Legacy MLC from May 2023 until September 2025. Mr. Allen is the Managing Partner of Energy Capital & Origination, LLC, an advisory firm which acts as Senior Advisor and Board Member to financial sponsors and their portfolio companies, since November 2017. Mr. Allen is also a Senior Advisor at Grant Thornton LLP, the seventh largest global tax, audit, accounting and advisory firm. Mr. Allen is also a Senior Advisor and Board Member at CBRE Investment Management, a $144 billion real estate investment management firm, and previously acted as a Senior Advisor at BC Partners, an international investment company with main offices in New York and London. Mr. Allen has served as a Director of Navigant Consulting Inc., NextEra Energy Inc. and AIG Financial Products Corp. He was formerly the Chief of Infrastructure and Operations of US Energy at Barclays Capital, the Chief Investment Officer and Chief Operations Officer for energy credit at III Advisors, as well as the Operating Partner, Energy and Infrastructure at Apollo Global Management. Mr. Allen started his career as an options trader for Spear, Leeds and Kellogg (now Goldman Sachs). Mr. Allen has over 25 years of experience
138
in deal origination, financings, mergers and acquisitions, valuations and restructurings (including serving as expert witness at trial), and previously held senior advisory positions with portfolio companies of private equity firms Trilantic Capital Partners, Black Diamond Capital Management, and Warburg Pincus LLC. Mr. Allen holds a Bachelor of Sciences, Industrial and Labour Relations from Cornell University and a Certificate in Options and Derivatives from the New York Institute of Finance. We believe Mr. Allen is qualified to serve on the board of Mount Logan due to his extensive experience in the financial industry and his years of service on the board of Legacy MLC. His financial expertise further qualifies him to be a member of Mount Logan’s Audit Committee.
Sabrina Liak: Ms. Sabrina Liak has served on the Board of Directors since September 2025. Ms. Liak served as a board member of Legacy MLC from October 2018 until September 2025. Ms. Liak is a Partner at ALOI Investment Management, a global investment and advisory firm focused on private equity opportunities. Ms. Liak is the co-founder and formerly the President and director of Kits Eyecare Ltd., an online eyecare company trading on the TSX. Ms. Liak formerly served as a Managing Director and Portfolio Manager at Goldman Sachs in New York where she managed a private equity portfolio of growth companies for Goldman Sachs Investment Partners, an investment fund. Ms. Liak has served on the board of directors of several companies, including Petroedge Energy, an exploration company, Lightfoot Capital, a Master Limited Partnership, and FloDesign Wind, a renewable energy company. Ms. Liak joined Goldman Sachs in 2001 in the Fixed Income, Currency, and Commodities Division. Prior to joining Goldman Sachs, Ms. Liak started her career in investment banking at Donaldson, Lufkin & Jenrette. Ms. Liak holds an HBA from the Richard Ivey School of Business at the University of Western Ontario and is a CFA charterholder. We believe Ms. Liak is qualified to serve on the board of Mount Logan due to her extensive experience in the financial industry and her years of service on the boards of several companies, including Legacy MLC.
Buckley Ratchford: Mr. Buckley Ratchford has served on the Board of Directors since September 2025. Mr. Ratchford served as a board member of Legacy MLC from June 2023 until September 2025. Mr. Ratchford worked as a Managing Director and Partner at Goldman, Sachs & Co. from 1998 to 2012, where he worked as the Head Portfolio Manager, Head of Global Credit Distressed Investing (2003-2012) and Head of Global Bank Loans in the Securities Division (2010-2012) in both New York and London. In addition, Mr. Ratchford was the Head of Asia Credit Trading & Principal Investing in Hong Kong from 2007-2009. During his time at Goldman Sachs, Mr. Ratchford served as a member of the Global Credit Operating Committee and Asia Risk Committee, and was the co-head of Fixed Income, Currencies and Commodities Managing Director Selection. Mr. Ratchford was also previous NASD (now called FINRA) licensed for Series 7, 24, 55 and 63. Mr. Ratchford holds a Bachelor of Arts, Government from Dartmouth College, a Masters in International Political Economy from the London School of Economics, as well as a Juris Doctor from Harvard Law School. We believe Mr. Ratchford is qualified to serve on the board of Mount Logan due to his expertise in financial matters and his years of service on the board of Legacy MLC.
R. Rudolph Reinfrank: Mr. R. Rudolph Reinfrank has served on the Board of Directors since September 2025. Mr. Reinfrank served as a board member of Legacy MLC from February 2022 until September 2025. Mr. Reinfrank is also a director of Midcap Financial Investment Corp. (“MFIC”, formerly Apollo Investment Corp.) since June 2013. MFIC is an externally managed, publicly traded business development company that provides senior debt solutions to middle market companies. He is a board member of Midcap Apollo Institutional Private Lending and Perception Capital IV, which is a special purpose acquisition company. Since October 2009, Mr. Reinfrank has served as the Managing General Partner of Riverford Partners, LLC, a strategic advisory and investment firm based in Los Angeles, California. Riverford Partners acts as an investor, board member and strategic adviser to growth companies and companies in transition. Mr. Reinfrank formerly served as Managing General Partner of Rader Reinfrank & Co. Mr. Reinfrank is also an advisor or board member to several privately held companies. Mr. Reinfrank holds a Bachelor of Arts degree from Stanford University and a Masters of Business Administration from UCLA. We believe Mr. Reinfrank is qualified to serve on the board of Mount Logan due to his expertise in advising public companies and his years of service on the board of Legacy MLC. His financial experience further qualifies him to be a member of Mount Logan’s Audit Committee.
Parker A. Weil: Mr. Parker Weil has served on the Board of Directors since September 2025. Since March 2024, Mr. Weil has served as the Global Co-Head of Investment Banking at TD Cowen. From August 2018 to March 2024, Mr. Weil served as Vice Chair of Investment Banking at TD Cowen. TD Cowen is a division of TD
139
Bank Group (TSX and NYSE: TD) which offers a full range of financial products and services to more than 27 million customers worldwide. TD Cowen is an institutional financial services firm that operates through Cowen and Company, a broker dealer, and an investment management division. In addition to Investment Banking, Cowen and Company also offers equity and credit research, sales and trading, and a wide array of institutional services capabilities. From June 2012 to April 2018, Mr. Weil served as Managing Director of investment banking for Stifel Financial Corp. During his almost 30+ years in investment banking, he has served as an advisor, underwriter and placement agent on numerous initial public offerings, add-on financings and merger and acquisition transactions. He has worked with companies in a wide range of industries including Energy, Power, Industrials, Telecommunications and Business Services. Since July 2017, Mr. Weil has served on the board of directors of 180 Degree Capital, and is Chair of its Compensation and Nominating Committees. From June 2020 to February 2024, Mr. Weil has served on the board of directors of Clean Energy Fuels Corporation. Mr. Weil has served on the board of trustees of the Ridgewood Lacrosse Association, Maroons Soccer Club and Ridgewood Education Foundation. Mr. Weil graduated from the University of Pennsylvania (B.A.) and the Kellogg Graduate School of Management at Northwestern University (M.B.A.). We believe Mr. Weil is qualified to serve on our Board because of his extensive financial and investment banking experience. We believe is experience as a senior manager in finance-related businesses further qualifies him to be a member of Mount Logan’s Audit Committee.
Matthew Westwood: Mr. Matthew Westwood has served on the Board of Directors since September 2025. Mr. Westwood formerly served as a managing director and principal of Wilshire Associates Incorporated. While at Wilshire Associates Incorporated, Mr. Westwood was a senior investment professional for Wilshire Private Markets, a global private equity fund of funds. Prior to joining Wilshire Associates Incorporated, Mr. Westwood worked at Ernst & Young LLP where he managed audit and consulting engagements for both public and private clients. During his career, Mr. Westwood has served on numerous private equity limited partner advisory boards. He also formerly served as a director of Garrison Capital from May 2011 to October 2020, as a member of the board of the Pittsburgh Venture Capital Association, and as a member of Wilshire Associates Incorporated’s 401k Committee. Mr. Westwood received a B.S. from Villanova University and an M.B.A. from the University of Pittsburgh. We believe Mr. Westwood is qualified to serve on the board of Mount Logan due to his financial expertise and years of experience advising companies in various industries.
Executive Officers Who are Not Directors
Henry Wang: Mr. Wang currently serves as President of Mount Logan. He joined BC Partners in 2017 as a co-founder of BC Partners Credit. He is a Partner in the Credit team based in New York. Previously, Henry was a Partner at Stonerise Capital Partners. Prior to this, he worked in the Special Situations Group and Investment Banking Division at Goldman Sachs and has held roles at Vulcan Capital (Paul Allen’s investment firm, co-founder of Microsoft) and Thomas Weisel Partners. Mr. Wang holds an MBA, Kellogg School of Management from Northwestern University and a BSBA from Boston University.
Nikita Klassen: Ms. Klassen currently serves as Chief Financial Officer and Corporate Secretary of Mount Logan. She previously served as Senior Controller of Legacy MLC and has over 14 years of experience in the financial services industry, including roles as Director, Accounting Policy at Silicon Valley Bank; Vice President, SEC Reporting and Accounting Policy at Galaxy Digital (TSX: GLXY); and Director, Global Accounting Policy and Advisory at American Express (NYSE: AXP). Ms. Klassen has also previously provided audit and consulting services in various roles over a 6 year career at PricewaterhouseCoopers LLP. Ms. Klassen holds a Bachelor of Commerce (Hons) degree from the Asper School of Business at the University of Manitoba and is a Chartered Professional Accountant (Canada).
David Held: Mr. Held currently serves as the Chief Compliance Officer of Mount Logan and has served as the Chief Compliance Officer, Credit for BC Partners since 2021. Previously, David was Chief Compliance Officer with Lyxor Asset Management. Prior to that, he held senior compliance positions at American Securities, AXA Investment Managers and Bank of America. He has a J.D. from Georgetown University Law Center.
140
Board Leadership and Structure
The Board monitors and performs an oversight role with respect to our business and affairs, including with respect to our financial condition and performance, compliance with regulatory requirements and the services, expenses and performance of our service providers, including the services provided by BCPA pursuant to the Servicing Agreement (as defined and described below). Among other things, the Board approves the appointment of our executive officers, reviews and monitors the services and activities performed by BCPA pursuant to the Servicing Agreement, as well as our executive officers, and approves the engagement and reviews the performance of the independent registered public accounting firm.
Under our amended and restated bylaws, the Board may designate a Chair to preside over the meetings of the Board and meetings of the shareholders and to act as a liaison with Mount Logan, counsel and other directors generally between meetings. The Chair serves as a key point person for dealings between management and the directors. The Chair also may perform such other functions or duties as may be delegated or assigned by the Board from time to time. We do not have a fixed policy as to whether the Chair of the Board should be an Independent Director and we will maintain the flexibility to select the Chair and reorganize the leadership structure from time to time, based on criteria that are in our and our shareholders' best interests at such times.
We our that different board leadership structures are appropriate for companies in different situations. We intend to re-examine its corporate governance policies on an ongoing basis to ensure that they continue to meet our needs.
Director Independence
Under the Nasdaq Listing Rules, a majority of the members of the Board must satisfy Nasdaq’s criteria for “independence.” The Board currently has determined that each of the directors on the Board, other than Mr. Goldthorpe (as a result of his position as our Chief Executive Officer), qualifies as an independent director, as defined by Rule 5605(a)(2) of the Nasdaq Listing Rules, and the Board consists of a majority of “independent directors” as defined under the rules of the SEC and Nasdaq relating to director independence requirements. In addition, we are subject to the rules of the SEC relating to the membership, qualifications and operations of the Audit Committee, as discussed below.
The Board's Role in Risk Oversight
The Board performs its risk oversight function primarily through (i) its standing committees, which report to the entire Board, and (ii) active monitoring of our executive officers and our compliance policies and procedures.
As described below in more detail under “Committees of the Board,” the Audit Committee assists the Board in fulfilling its risk oversight responsibilities. The Audit Committee's risk oversight responsibilities include overseeing accounting and financial reporting processes, our systems of internal controls regarding finance and accounting and audits of our financial statements.
We recognize that different board roles in risk oversight are appropriate for companies in different situations. We intend to re-examine the manner in which the Board administers its oversight function on an ongoing basis to ensure that it continues to meet our needs.
Committees of the Board
The Board has established an Audit Committee, a Compensation Committee and a Nominating and Corporate Governance Committee, and may establish additional committees in the future. The Board has adopted a new charter for each of these committees, each of which complies with the applicable requirements of current Nasdaq Listing Rules. Copies of the charters for each committee are available on the investor relations portion of our website. We require each director to make a diligent effort to attend all Board and committee meetings as well as each annual meeting of the shareholders.
141
Audit Committee
The members of the Audit Committee are David Allen, Rudolph Reinfrank and Parker Weil. David Allen serves as the chairperson of the Audit Committee. Each of the members of the Audit Committee satisfies the independence requirements under the applicable Nasdaq Listing Rules and the rules of the SEC. The Board has determined that each of Rudolph Reinfrank and Parker Weil is an “audit committee financial expert” as defined under the rules of the SEC and that each of the members of the Audit Committee meets the financial sophistication requirements under the applicable Nasdaq Listing Rules. The responsibilities of the Audit Committee include: (i) the integrity of our financial statements and financial reporting process; (ii) the systems of internal accounting and financial controls; (iii) the performance of our internal audit function and independent auditors; (iv) the independent auditor’s qualifications and independence; (v) the annual independent audit of Mount Logan’s financial statements; (vi) the selection and performance of our compliance officer; (vii) the effectiveness of the structure and operations of our compliance program; (viii) our compliance with each of our Code of Business Conduct and Ethics and Code of Ethics for Senior Financial Officers and other legal compliance and ethics programs established by management and the Board; (ix) our compliance with applicable legal and regulatory requirements; and (x) our policies in respect of risk assessment and risk management, including the security of and risks related to computerized information systems and data privacy. In so doing, the Audit Committee is responsible for maintaining free and open communication among its members, the independent registered public accounting firm, the internal auditors and our management.
Nominating and Corporate Governance Committee
The members of the Nominating and Corporate Governance Committee are Sabrina Liak, Buckley Ratchford and Matthew Westwood. Sabrina Liak serves as chair of the Nominating and Corporate Governance Committee. Each of the members of the Nominating and Corporate Governance Committee satisfies the independence requirements of the applicable Nasdaq Listing Rules. The Nominating and Corporate Governance Committee operates pursuant to a charter approved by the Board. The charter sets forth the responsibilities of the Nominating and Corporate Governance Committee, including selecting, researching and nominating directors for election by the shareholders, selecting nominees to fill vacancies on the Board or a committee of the Board, monitoring our corporate governance structure, developing and recommending to the Board a set of corporate governance principles and overseeing the evaluation of the Board and management.
The Nominating and Corporate Governance Committee seeks candidates who possess the background, skills and experience to make a significant contribution to Mount Logan, the Board and our shareholders. In considering possible candidates for election as a director, the Nominating and Corporate Governance Committee takes into account, in addition to such other factors as it deems relevant, the desirability of selecting directors who:
•are of high character and integrity;
•are accomplished in their respective fields, with superior credentials and recognition;
•have relevant experience upon which to be able to offer advice and guidance to management;
•have sufficient time available to devote to our affairs;
•are able to work with the other members of the Board and contribute to our success;
•can represent the long-term interests of shareholders as a whole; and
•are selected such that the Board represents a range of backgrounds and experience.
Compensation Committee
The members of the Compensation Committee are David Allen, Sabrina Liak and Buckley Ratchford. Buckley Ratchford serves as chair of the Compensation Committee. The Compensation Committee operates pursuant to a charter approved by the Board. Each of the members of the Compensation Committee qualifies as a “non-employee director” under Rule 16b-3 under the Exchange Act and satisfies the independence requirements of
142
the applicable Nasdaq Listing Rules. The Compensation Committee charter sets forth the responsibilities of the Compensation Committee, including determining, or recommending to the Board for determination, any issuances under the 2025 Omnibus Incentive Plan (the “2025 Plan”) (as described below), evaluating and approving our executive officer and director compensation plans, policies and programs and preparing the Compensation Discussion and Analysis report for inclusion in our annual proxy statement filed with the SEC.
Compensation of Executive Officers
Our executive officers receive direct compensation from us. Certain of our executive officers, through their ownership interest in or management positions with BCPA and BC Partners, may be entitled to a portion of any profits earned by BCPA, BC Partners or their respective affiliates (including any fees payable to BCPA under the terms of the Servicing Agreement, less expenses incurred by BCPA in performing its services under the Servicing Agreement). BCPA, BC Partners or their respective affiliates may pay additional salaries, bonuses, and individual performance awards or individual performance bonuses to our executive officers in addition to their ownership interest.
We have adopted the 2025 Plan. The 2025 Plan provides for grants of stock options, stock appreciation rights, restricted stock, other stock-based awards and other cash-based awards. Directors, officers and other employees of us or of our subsidiaries, as well as others performing consulting or advisory services for us, are eligible for grants under the 2025 Plan. The purpose of the 2025 Plan is to provide incentives that will attract, retain and motivate high performing officers, directors, employees and consultants by providing them with appropriate incentives and rewards either through a proprietary interest in our long-term success or compensation based on their performance in fulfilling their personal responsibilities.
Compensation of Directors
The Independent Directors’ annual fee is $140,000, payable in both cash and restricted stock unit compensation. In addition, the chairs of the Audit Committee, the Compensation Committee and the Nominating and Corporate Governance Committee will receive an additional annual fee of $5,000. The Independent Directors also receive reimbursement of reasonable out-of-pocket expenses incurred in connection with attending each regular Board meeting, each special meeting, and each committee meeting. No compensation is expected to be paid to our Interested Director on account of his service as a Director.
Director Independence
The Board consists of seven members, six of whom qualify as “independent directors” as defined in Nasdaq Listing Rule 5605(a)(2) (each such qualifying director, an “Independent Director”).
143
EXECUTIVE AND DIRECTOR COMPENSATION
This section provides an overview of the principal components of Mount Logan’s 2025 executive compensation program as applied to Mount Logan’s “named executive officers” (or “NEOs”), and, prior to the Business Combination, Legacy MLC’s 2025 executive compensation program. The amounts for the financial year ended December 31, 2025 are preliminary and subject to further internal review by our management and compilation of actual results. Our closing procedures for the quarter and 12 months ended December 31, 2025 are not yet complete. Our independent registered public accounting firm, Deloitte & Touche LLP, has not audited, reviewed, compiled or performed any procedures with respect to this preliminary financial information and, accordingly, Deloitte & Touche LLP does not express an opinion or any other form of assurance with respect thereto.
Executive Compensation
Summary Compensation Table
For the financial year ended December 31, 2025, Mount Logan had three (3) NEOs, namely: (a) Edward Goldthorpe, Chief Executive Officer (“PEO”); (b) Nikita Klassen, Chief Financial Officer and Corporate Secretary; and (c) Henry Wang, President. The following table presents the compensation earned by the NEOs for the years ended December 31, 2025 and December 31, 2024.
Name and Principal Position | Year | Salary ($) | Stock Awards ($)(2) | Total Compensation ($) | ||||||||||||||||||||||
Edward Goldthorpe | 2025 | Nil | Nil | Nil | ||||||||||||||||||||||
Chief Executive Officer | 2024 | Nil | $553,656 | $553,656 | ||||||||||||||||||||||
Nikita Klassen(1) | 2025 | $426,000 | Nil | Nil | ||||||||||||||||||||||
Chief Financial Officer and Corporate Secretary | 2024 | $177,500 | $102,167 | $279,667 | ||||||||||||||||||||||
Henry Wang | 2025 | Nil | Nil | Nil | ||||||||||||||||||||||
President | 2024 | Nil | $182,990 | $182,990 | ||||||||||||||||||||||
______________
(1)Ms. Klassen became Chief Financial Officer of Legacy MLC in April 2024.
(2)Represents the fair value at the date of grant for restricted share units of Legacy MLC (“RSUs”) (including the DEUs) granted to each NEO. The fair values are based on the closing price of the Shares on the Exchange on the date of grant as converted to US dollars at the Bank of Canada’s conversion rate on the date of grant. The actual value received was different as it depended on the price of the underlying Shares at the time such RSUs vested and were settled in connection with the Business Combination.
Outstanding Equity Awards at Fiscal Year-End
In connection with the Business Combination, the Board approved the Mount Logan Capital Inc. 2025 Omnibus Incentive Plan (the “2025 Plan”), with an aggregate of 2,600,000 shares of Mount Logan common stock available for issuance. As of December 31, 2025, there were no awards outstanding under the 2025 Plan, and 2,600,000 shares of Mount Logan common stock remained available for issuance. As of December 31, 2025, Mount Logan did not have any equity plans that had not been approved by Shareholders.
None of the NEOs held outstanding stock awards at December 31, 2025.
| Stock Awards | ||||||||||||||
| Name | Number of shares or units of stock that have not vested (#) | Market value of shares of units of stock that have not vested ($) | ||||||||||||
Edward Goldthorpe Chief Executive Officer | $ | — | $ | — | ||||||||||
Nikita Klassen Chief Financial Officer and Corporate Secretary | $ | — | $ | — | ||||||||||
Henry Wang President | $ | — | $ | — | ||||||||||
144
Executive Employment Arrangements
Neither Legacy MLC nor Mount Logan maintained any employment contract, agreement, plan, or arrangement that provided for the employment of, and payments to, the NEOs (including such payments to be made at, following or in connection with the resignation, retirement, or other termination of a NEO, or following a change in control).
Grant of Certain Equity Awards Close in Time to the Release of Material Nonpublic Information
Neither Legacy MLC nor Mount Logan granted awards of stock options, stock appreciation rights or similar option-like instruments during 2025. Accordingly, there is nothing to report under Item 402(x) of Regulation S-K.
Director Compensation
Director Compensation Table
The directors of Mount Logan were compensated by Mount Logan for the services that they provided to Mount Logan as directors. Prior to the Business Combination, the directors of Legacy MLC were compensated by Legacy MLC for the services that they provided to Legacy MLC as directors.
The following table sets forth the compensation paid to non-management Directors during the financial year ended December 31, 2025.
Name(1) | Fees Earned or paid in cash(2) | Stock Awards(3)(4) | Total | |||||||||||||||||
Perry Dellelce | $17,065 | $236,410 | $253,475 | |||||||||||||||||
Sabrina Liak | $17,073 | $236,410 | $253,483 | |||||||||||||||||
R. Rudolph Reinfrank | $24,521 | $236,410 | $260,931 | |||||||||||||||||
David Allen | $21,847 | $236,410 | $258,257 | |||||||||||||||||
Buckley Ratchford | $21,847 | $236,410 | $258,257 | |||||||||||||||||
Matthew Westwood | $5,000 | Nil | $5,000 | |||||||||||||||||
Parker Weil | $5,000 | Nil | $5,000 | |||||||||||||||||
________________
(1)Edward Goldthorpe was a Named Executive Officer and as such, did not receive compensation as a director.
(2)Values shown were converted from CAD to USD at the average exchange rate reported by the Royal Bank of Canada for fiscal year 2025.
(3)Represents the fair value at the date of grant for RSUs with respect to Legacy MLC granted to each non-management Director. For the grants included herein, the fair values were based on the closing price of the shares of common stock of Legacy MLC on Cboe Canada on the date of grant as converted to US dollars at the Bank of Canada’s conversion rate on the date of grant. The actual value received, if any, is different as it depended on the price of the underlying shares of Legacy MLC at the time such RSUs vested and were settled in connection with the Business Combination. Further detail regarding these RSU awards, the method of valuation and the assumptions made are set forth in Note 20, “Equity based compensation,” to the Condensed Consolidated Financial Statements for the period ended September 30, 2025 and Note 20, “Equity based compensation,” to the Consolidated Financial Statements for the years ended December 31, 2024 and December 31, 2023, included in this prospectus. No awards with respect to Mount Logan were granted to directors under the 2025 Plan during the year ended December 31, 2025.
(4)In connection with the Business Combination, these awards vested and were settled. As of December 31, 2025, there were no outstanding awards with respect to Legacy MLC or Mount Logan.
(5)Mr. Dellelce resigned as a director in September 2025 in connection with the Business Combination.
(6)Mr. Westwood and Mr. Weil each became a director in September 2025 in connection with the Business Combination.
Director Compensation Program
Directors of Legacy MLC were paid a retainer of C$25,000 per annum. In addition, the Chair of the Audit Committee was paid a retainer of C$2,500 per annum, the Chair of the Corporate Governance and Nominating Committee was paid a retainer of C$2,500 per annum, the Chair of the Compensation Committee was paid a retainer of C$2,500 per annum and the Lead Director was paid a retainer of C$5,000 per annum. Directors were also paid C$500 per meeting attended (paid quarterly). The Chair of the Board was not paid a retainer for acting in such capacity. Each of the Directors also were entitled to stock-based compensation having the value of C$125,000 per annum, vesting over a three-year period.
145
Following the Business Combination, each of the members of the board of directors of Mount Logan are entitled to cash compensation of $20,000 annually, payable in quarterly installments, and will be granted an equity incentive award under the 2025 Plan having a value of $120,000. The 2025 Plan contains a provision that no non-employee director will be granted compensation having an aggregate maximum value exceeding $350,000.
Compensation Committee Interlocks and Insider Participation
As of December 2025, none of Mount Logan’s officers served, or in the prior year served, as a member of the Compensation Committee of any entity that had one or more officers serving on Mount Logan’s board of directors.
146
PRINCIPAL STOCKHOLDERS
The following table and accompanying footnotes set forth information with respect to the beneficial ownership of our Common Stock, as of December 31, 2025, for (1) each member of the Board, (2) each of our named executive officers, and (3) our current directors and officers as a group. As of the date hereof, we are not aware of any stockholders that beneficially own 5% or more of our shares of Common Stock.
Beneficial ownership is determined according to the rules of the SEC, which generally provide that a person has beneficial ownership of a security if he, she or it possesses sole or shared voting or investment power over that security, including options and warrants that are currently exercisable or exercisable within 60 days. Shares of Common Stock issuable pursuant to options or warrants are deemed to be outstanding for purposes of computing the beneficial ownership percentage of the person or group holding such options or warrants but are not deemed to be outstanding for purposes of computing the beneficial ownership percentage of any other person.
As of December 31, 2025 there were 12,786,792 shares of our Common Stock outstanding.
Subject to applicable community property laws, the persons and entities named in the table have sole voting and investment power with respect to their beneficially owned shares of our Common Stock.
Name of Beneficial Owner | Shares of Common Stock Beneficially Owned | Percentage of Outstanding Common Stock | ||||||||||||
| Directors and Named Executive Officers: | ||||||||||||||
| Edward (Ted) Goldthorpe | 215,570 | 1.7% | ||||||||||||
| David Allen | 31,617 | * | ||||||||||||
| Sabrina Liak | 39,256 | * | ||||||||||||
| Buckley Ratchford | 31,617 | * | ||||||||||||
| R. Rudolph Reinfrank | 56,868 | * | ||||||||||||
| Parker A. Weil | 6,251 | * | ||||||||||||
| Matt Westwood | — | — | ||||||||||||
| Nikita Klassen | 16,736 | * | ||||||||||||
| Henry Wang | 50,155 | * | ||||||||||||
| All executive officers and directors as a group (10 persons) | 448,070 | 3.5% | ||||||||||||
_______________
*Less than 1%
147
CERTAIN RELATIONSHIPS AND RELATED PERSON TRANSACTIONS
Mount Logan’s Relationship with BCPA and its Affiliates
BC Partners Investment Holdings, an affiliate of BCPA, holds a minority equity investment in Mount Logan. As of September 12, 2025, such investment amounts to approximately 1.7% of the outstanding shares of our Common Stock.
Servicing Agreement
Since November 20, 2018, BCPA, as servicing agent (the “Servicing Agent”), performs (or oversees, or arranges for the performance of) the administrative services necessary for the operation of Mount Logan, including, without limitation, office facilities, equipment, bookkeeping and recordkeeping services and such other services as the Servicing Agent, subject to review by our Board, shall from time to time deem necessary or useful to perform its obligations under the servicing agreement (as amended from time to time, the “Servicing Agreement”). The Servicing Agreement, by its terms, is subject to annual approval by the Board.
We pay the Servicing Agent an amount equal to our allocable portion of the Servicing Agent’s overhead resulting from its obligations under the Servicing Agreement, including rent and the allocable portion of the cost of our Chief Financial Officer and associated personnel. The Servicing Agent, from time to time, pays amounts owed by us to third-party providers of goods or services, and subsequently reimburse the Servicing Agent for such amounts paid on our behalf at cost.
For the years ended December 31, 2024, 2023 and 2022, Legacy MLC incurred fees payable to the Servicing Agent under the Servicing Agreement of $2.7 million, $2.2 million, and $1.3 million under Asset Management and $0.3 million, $0.3 million and $0.2 million under Insurance Solutions. For the nine months ended September 30, 2025, the Company incurred servicing fees of $1.5 million (September 30, 2024 – $1.9 million). As of December 31, 2024, Legacy MLC owed the Servicing Agent $7.6 million and $1.0 million for Asset Management and Insurance Solutions, respectively, under the Servicing Agreement. As of September 30, 2025, MLC owed the Servicing Agent $4.0 million and $0.3 million for Asset Management and Insurance Solutions, respectively.
We may, from time to time, enter into transactions in the normal course of operations with certain of the BCPA Credit Affiliates or affiliates thereof. At September 30, 2025 Asset Management held investments with affiliates of BCPA Credit Affiliates totaling $24.7 million, and Insurance Solutions held investments with affiliates of BCPA Credit Affiliates totaling $21.7 million. On these investments, Asset Management recognized (i) interest income of $0.8 million for the nine months ended September 30, 2025 (September 30, 2024 $0.8 million), earnings on equity method investments of $0.8 million for the nine months ended September 30, 2025 (September 30, 2024 - $0.2 million), and (iii) dividend income on equity securities of less than $0.1 million for the nine months ended September 30, 2025 (September 30, 2024 – $0.3 million). On these investments, Insurance Solutions recognized (i) interest income of $0.9 million for the nine months ended September 30, 2025 (September 30, 2024 - $1.9 million) and (ii) dividend income of $0.2 million for the nine months ended September 30, 2025 (September 30, 2024 - $0.2 million).
At December 31, 2024 and 2023, Asset Management held investments with affiliates of BCPA Credit Affiliates totaling $20.9 million and $24.7 million, respectively, and Insurance Solutions held investments with affiliates of BCPA Credit Affiliates totaling $23.7 million and $24.7 million, respectively. On these investments, Asset Management recognized (i) interest income of $1.1 million and $1.1 million for the years ended December 31, 2024 and 2023, respectively, (ii) earnings on equity method investments of $0.7 million and $1.1 million for the years ended December 31, 2024 and 2023, respectively, and (iii) dividend income on equity securities of $0.4 million and $0.4 million for the years ended December 31, 2024 and 2023, respectively. On these investments, Insurance Solutions recognized (i) interest income of $2.4 million and $1.6 million for the years ended December 31, 2024 and 2023, respectively, and (ii) dividend income of $0.3 million and $0.2 million for the years ended December 31, 2024 and 2023, respectively.
Further, for the nine months ended September 30, 2025, the Company incurred expenses of $5.3 million (September 30, 2024 - $5.4 million) to an affiliate, for third party administrative services relating to Ability for
148
administering its long-term care block of business. As of September 30, 2025, there was a payable to this affiliate of $0.6 million (December 31, 2024 – $0.6 million).
For the years ended December 31, 2024 and 2023, the Company incurred expenses of $7.2 million and $7.4 million, respectively, to an affiliate, for third party administrative services relating to Ability for administering its long-term care block of business. As at December 31, 2024 and 2023, there was a payable to this affiliate of $0.6 million and $0.6 million, respectively.
Transactions with Affiliates - profit sharing interest
On July 15, 2025, Portman Ridge Finance Corporation (“Portman” or “Portman Ridge”) and Logan Ridge, business development companies previously managed by SCIM and ML Management, respectively, completed a merger whereby Logan Ridge merged with and into Portman (the “Portman-Logan Merger”). Pursuant to the Portman-Logan Merger, Portman was the surviving public entity and continues to be advised by SCIM, which the Company holds a minority ownership interest of 24.99%. The Portman-Logan Merger resulted in the existing IMA between ML Management and Logan Ridge being terminated. In connection with the closing of the Portman-Logan Merger, MLCSC Holdings LLC, our wholly-owned subsidiary (“MLCSC”), entered into a Profit-Sharing Agreement with BCPSC Holdings LLC, a wholly-owned subsidiary of BCPA and the majority owner of SCIM (the “Profit-Sharing Agreement”). Pursuant to the Profit-Sharing Agreement, MLCSC is entitled to 16.03% of BCPA’s distributions from SCIM. The value of the Profit-Sharing Agreement was determined to be $11.2 million and is considered an indefinite lived intangible asset. Income earned as a result of the profit sharing agreement is recorded as “Other income (loss), net” on the condensed consolidated statement of operations. For the nine months ended September 30, 2025, income earned on the profit sharing agreement was $0.3 million (September 2024: nil).
Potential Conflicts of Interest
Upon the consummation of the Business Combination, we became a party to the Servicing Agreement with BCPA to enable us to receive the management and administrative functions that were provided to Legacy MLC pursuant to the Servicing Agreement.
We will rely on the Servicing Agent or personnel provided by the Servicing Agent to perform certain management and administrative services functions, and the personnel at the Servicing Agent performing such services are presently, and plan in the future to continue to be, involved with activities that are unrelated to us. The Servicing Agent will cause its employees to only devote as much time to our business as the Servicing Agent, in its judgment, determines is reasonably required, which will be less than their full time. Therefore, the Servicing Agent, its personnel and the BCPA Credit Affiliates will face conflicts of interest in allocating time, services and functions between us and BCPA and the BCPA Credit Affiliates.
The foregoing description of the Servicing Agreement is not complete and covers only certain key terms. The Servicing Agreement is attached as an exhibit hereto, and you are encouraged to read the entire document for further information about its terms and conditions.
Staffing and Resource Agreement
On November 18, 2025, we and BCPA entered into a Staffing and Resource Agreement (the “Staffing and Resource Agreement” and together with the Servicing Agreement, the “BCPA Arrangements”), pursuant to which certain designated BCPA employees provide services to us, as described in more detail below. The Staffing and Resource Agreement allows us and BCPA to share personnel for a variety of investment advisory activities. Pursuant to the Staffing and Resource Agreement, BCPA may allocate costs and expenses relating to the Staffing and Resource Agreement as agreed to between us and BCPA. The Staffing and Resource Agreement, by its terms, can be terminated upon sixty (60) days’ prior written notice to the non-terminating party or as otherwise mutually agreed between us and CPA.
The foregoing description of the Staffing and Resource Agreement is not complete and covers only certain key terms. The Staffing and Resource Agreement is attached as an exhibit hereto and you are encouraged to read the entire document for further information about its terms and conditions.
149
In connection with entering into the Staffing and Resource Agreement, ML Management and BCPA mutually agreed to terminate the Staffing Agreement by and between them, dated as of October 1, 2020, pursuant to which BCPA historically provided to ML Management services and resources similar to those they provide to us under the Staffing and Resource Agreement.
The BCPA Arrangements allow us to leverage BCPA’s infrastructure and scale, including the resources of BCPA’s credit team.
In the future, we and our subsidiaries may, from time to time, (i) agree to amend, modify, supplement or otherwise change the BCPA Arrangements or aspects of such arrangements, and (ii) may otherwise agree to enter into additional, alternative or similar arrangements with BCPA. As of the date of this prospectus, we and BCPA have discussed potential amendments to the BCPA Arrangements relating to some or all of the employees of Mount Logan or our subsidiaries instead becoming employees of BCPA or one of its affiliates and changes to the compensation arrangements with BCPA, including the methodology for determining the compensation of BCPA (including, without limitation, such compensation being paid in the form of equity compensation and/or determined on the basis of metrics tied to our consolidated assets or performance). Such amendments are expected to be agreed to and implemented at some time in the future.
Senior Management
Our senior management team is comprised of substantially the same personnel as the senior management team of BCPA, and such personnel have in the past, and may in the future, serve in similar or other capacities for BCPA or to future investment vehicles affiliated with BCPA, such as in an advisory capacity to other managed accounts or investment vehicles or as members of an investment or advisory committee or a board of directors (or similar governing body) for one or more investment funds, corporations, foundations or other organizations. As a result, such personnel with management functions are involved with both us and other activities unrelated to us, which could create conflicts of interest as described in more detail below.
Investments and Other Transactions and Matters involving BCPA, the BCPA Credit Affiliates, BC Partners, and the BC Partners PE/RE Affiliates
BCPA, together with its affiliate BC Partners, is a global alternative asset manager focused on private credit, private equity and real estate, and currently collectively manages approximately $40 billion of assets. Because of the global nature of its business and its breadth across different verticals, BCPA, the BCPA Credit Affiliates, BC Partners and the BC Partners PE/RE Affiliates have interests of differing types in a broad range of companies.
We have engaged, and may in the future engage, in the following activities: (i) investing alongside, or buying certain assets from, or selling certain assets to BCPA or the BCPA Credit Affiliates in which some or all of the foregoing have an interest; or (ii) entering into commercial transactions in the ordinary course of its business with BCPA or the BCPA Credit Affiliates (x) in which some or all of the foregoing have an interest or (y) in which some or all of the foregoing directly or indirectly benefit from us engaging in commercial activities with such companies, which in each case has created or could create a benefit for BCPA or the BCPA Credit Affiliates or otherwise had or could have a more favorable result for BCPA or the BCPA Credit Affiliates as compared to us. Additional details about these arrangements can be found below.
Investment Advisory Services Arrangements
SCIM
We hold a minority ownership interest in SCIM of 24.99% as of September 30, 2025. SCIM provides investment advisory services and is majority owned by BCPA. Because SCIM is majority owned by BCPA, we will have a limited role in determining the business activities and strategic direction of SCIM. In addition, BCPA has caused and may continue to cause SCIM to undertake activities or transactions that have different impacts on BCPA as compared to us, and we will generally not be able to block or alter the nature of such activities or the terms or conditions of such transactions.
150
Through MLC US Holdings, our wholly-owned subsidiary, we provide certain administrative services to SCIM in respect of the management of an investment fund (“ACIF”) in exchange for a servicing fee. Servicing fees are determined quarterly based on an amount equal to the aggregate base management fee and incentive fees received by SCIM from ACIF in respect of such quarter, net of debt servicing expense, a quarterly fee to be retained by SCIM comprised of a specified amount, and an allocable portion of the compensation of SCIM’s investment professionals in connection with their performance of investment advisory services for ACIF (collectively, the “Retained Benefits”). In addition, SCIM is reimbursed by MLC US Holdings quarterly for certain expenses it incurs in connection with the investment advisory services provided to ACIF. Pursuant to this arrangement, we receive the net economic benefit derived by SCIM under the ACIF advisory agreement, subject to the holdback of the Retained Benefits and expense reimbursements. For the three months ended September 30, 2025 the Company incurred servicing fees of $0.4 million (September 30, 2024 – $0.4 million). For the nine months ended September 30, 2025, the Company incurred servicing fees of $1.5 million (September 30, 2024 – $1.9 million).
Through MLC US Holdings, our wholly-owned subsidiary, we issued a promissory note to SCIM on October 30, 2020, with a maturity of October 30, 2040. The note’s value is not to exceed $15 million and bears interest at 8.0% per annum, payable quarterly, for the first 10 years. During the second 10 years outstanding, repayments of the note shall occur in equal quarterly installment payments, bearing interest at 8.0% per annum, plus an additional 2% annually on overdue principal. As at September 30, 2025 and 2024, the outstanding principal value of the note was $13.6 million, respectively. As at December 31, 2024 and 2023, the outstanding principal value of the note was $13.6 million and $13.6 million, respectively. For the nine months ended September 30, 2025 and 2024, total interest income was $0.8 million and $0.8 million, respectively For the years ended December 31, 2024 and 2023, total interest income was $1.1 million and $1.1 million, respectively. As at September 30, 2025 and 2024, the total accrued interest income receivable was $2.7 million and $1.9 million, respectively. As at December 31, 2024 and 2023, the total accrued interest income receivable was $1.9 million and $0.8 million, respectively.
On January 30, 2025, Portman Ridge and Logan Ridge announced that they had entered into an agreement under which Logan Ridge would merge with and into Portman Ridge (the “Portman-Logan Merger”), subject to the receipt of certain shareholder approvals and the satisfaction of other closing conditions, including a payment by ML Management of approximately $1.25 million to the former shareholders of Logan Ridge in July 2025.
On July 15, 2025, Portman Ridge announced the closing of the Portman-Logan Merger. The Company, through ML Management, previously acquired an investment management agreement (“IMA”) through an asset purchase that resulted in ML Management becoming the investment advisor of Logan Ridge. The merging of Logan Ridge into Portman Ridge resulted in Logan Ridge’s existing IMA being terminated and, therefore, the Company's management fee stream from Logan Ridge ceasing. Portman Ridge was subsequently renamed to BCP Investment Corporation (“BCIC”). In connection with the closing of the Portman-Logan Merger, MLCSC Holdings LLC, our wholly-owned subsidiary (“MLCSC”), entered into a profit-sharing agreement with BCPSC Holdings LLC, pursuant to which MLCSC received economic interests in units worth 16.03% of BCPA’s distributions received under SCIM’s IMA with BCIC.
BCPA
Due to the overlapping nature of the business of ML Management and BCPA and our reliance on the BCPA Arrangements, conflicts may exist with BCPA, including those described below.
ML Management relies heavily upon the expertise and relationships developed by the employees of BCPA (generally provided to them through the Staffing and Resource Agreement) to identify and evaluate potential investment opportunities for clients. As a result, personnel of BCPA who are provided to ML Management (generally through the Staffing and Resource Agreement) work on projects unrelated to us, which creates conflicts in the allocation of management or other resources and related costs.
In addition, the advisory services that ML Management provides to its clients, and that BCPA provides to its clients, often in reliance upon the same employees, create conflicts of interests.
From time to time, ML Management expects to invest in securities or other financial instruments of an issuer for a client that are senior or junior to securities or financial instruments of the same issuer that are bought for
151
or held by another client of BCPA or a proprietary account. In such circumstances, if an issuer enters bankruptcy or undergoes a capital restructuring, ML Management clients holding securities that are senior in preference might have the right to pursue the issuer’s assets to fully satisfy the issuer’s indebtedness to the client, and as a fiduciary, ML Management could have an obligation to pursue aggressive remedies on behalf of such clients, including to the detriment of BCPA’s clients. The reverse situation could also arise. An ML Management client holding junior securities also might not have access to sufficient assets of the issuer to completely satisfy its bankruptcy claim against the issuer and could suffer loss.
In addition, the payment by clients receiving investment advisory services at varying rates can create an incentive for BCPA, whose employees manage ML Management pursuant to the Staffing and Resource Agreement, to direct ML Management to disproportionately allocate time, services or functions to clients paying management fees and/or incentive fees at a higher rate, or direct ML Management to allocate investment opportunities to such clients. BCPA and ML Management seek to mitigate risks and conflicts of interest with respect to differing fee arrangements by, among other things, allocating investments among clients with similar investment programs but different fee structures in a manner consistent with BCPA’s and ML Management’s investment allocation policy.
Commercial Transactions with Portfolio Companies of Funds Advised by BCPA or BC Partners and Other Companies
Private equity funds advised by BC Partners have ownership interests in a broad range of companies. We and our subsidiaries have entered, and may in the future enter, into commercial transactions in the ordinary course of our business with some of these companies, including the sale of goods and services and the purchase of goods and services. These transactions could provide indirect benefits to BC Partners and the BC Partners PE/RE Affiliates. For example, because the Servicing Agent is authorized to enter into sub-administration agreements as determined to be necessary in order to carry out the administrative services, certain service providers provide services to ML Management, while also providing similar or related services to other BCPA or BC Partners entities and/or portfolio investments of Mount Logan and/or funds advised by BCPA or BC Partners. Ability also uses service providers that provide similar or related services to other BCPA or BC Partners entities and/or portfolio investments of Mount Logan and/or funds advised by BCPA or BC Partners. Payments to such service providers indirectly benefit BC Partners (which does not manage the day-to-day affairs of its portfolio companies) and/or the BC Partners PE/RE Affiliates to the extent any of the foregoing has an ownership or other interest in any such service providers. These relationships may influence BCPA in deciding whether to select such service providers to perform services for us, and may incentivize BCPA to engage such a service provider over a different third party.
Allocation of Investment Opportunities
Because BCPA and its clients invest in similar, or the same assets as, us and clients of ML Management, BCPA and Mount Logan are presented with a variety of conflicts of interests related to investments. In particular, it is likely that investments that are suitable for clients of ML Management will also be suitable for clients of BCPA. BCPA and ML Management have implemented an allocation policy applicable to ML Management, BCPA and the BCPA Credit Affiliates pursuant to which investment opportunities are allocated among their respective clients. The allocation policy provides that, to the extent any clients have investment objectives or guidelines that overlap, in whole or in part, investment opportunities that fall within such common objectives or guidelines will be generally be allocated pro rata, subject to, among other limitations, (A) any applicable investment parameters, limitations and other contractual provisions, (B) available capital of participating clients, and (C) legal, tax, accounting, regulatory and other considerations deemed relevant by such clients. While the allocation policy has been designed to reasonably assure fair and equitable treatment over time, it does not guarantee that any client will participate in each or every investment that is consistent with its mandate.
Co-Investment Opportunities
Co-investments can occur when an investment is shared between a ML Management fund and one or more affiliated or third-party investors, including investors in funds sponsored or advised by BCPA. There are expected to be circumstances where an amount that would have otherwise been invested by an ML Management fund (even if such opportunity was sourced through Mount Logan) will instead be allocated to such other investors (including
152
investors in funds sponsored or advised by BCPA). There is no guarantee for any investor in an ML Management fund that it will be offered any co-investment opportunities that are offered to others. As a general matter, the allocation of co-investment opportunities is entirely discretionary, subject to the organizational documents of such investment vehicles. BCPA and ML Management will generally take into account various facts and circumstances deemed relevant in allocating co-investment opportunities pursuant to a co-investment allocation policy.
Additionally, it can be expected that BCPA will, from time to time, enter into arrangements or strategic relationships with third parties, including other asset managers, financial firms or other businesses or companies, which, among other things, may provide for referral, sourcing or sharing of investment opportunities. While it is possible that an ML Management client will, along with BCPA itself, benefit from the existence of those arrangements and/or relationships, it is also possible that investment opportunities that would otherwise be presented to or made by an ML Management affiliated fund would instead be referred (in whole or in part) to such third parties.
Purchases and Sales of Assets
As stated above, we and clients of ML Management may in the future engage in investing alongside, or buying certain assets from, or selling certain assets to BCPA or the BCPA Credit Affiliates in which some or all of the foregoing may have an interest. BCPA and ML Management have adopted policies and procedures designed to address related conflicts that may arise in the context of cross trades. Pursuant to current policies and procedures, BCPA and ML Management will only effect such a cross trade if they were to first determine that such trade is in the best interests of the affected clients, and then only in compliance with the requirements of applicable law, and the governing documents of the affected clients, including obtaining any required informed consent.
Other Matters
BCPA may come into possession of confidential or material, non-public information (including as a result of information that BC Partners and/or BCPA may have access to). Consequently, we may be restricted from initiating a transaction or selling an investment which, if such information had not been known to us, we otherwise would have initiated or sold. Additionally, BCPA and the BCPA Credit Affiliates may enter into information sharing and use arrangements with clients or portfolio companies, which may give BCPA access to data that it would not otherwise obtain in the ordinary course and could further increase the universe of such information that BCPA has in its possession.
Policy Regarding Transactions with Related Persons
We have adopted a formal written policy that became effective upon the completion of the Business Combination setting forth policies and procedures for the review and approval or ratification of “related party transactions,” which are those transactions required to be disclosed pursuant to Item 404 of Regulation S-K as promulgated by the SEC. Our related person policy requires that a “related person” (as defined in paragraph (a) of Item 404 of Regulation S-K) must promptly disclose to our Corporate Secretary any “related person transaction” (defined as any transaction that is anticipated would be reportable by us under Item 404(a) of Regulation S-K in which we were or are to be a participant and the amount involved exceeds $120,000 and in which any related person had or will have a direct or indirect material interest) and all material facts with respect thereto. Our Corporate Secretary will then promptly communicate that information to our Audit Committee. At its meetings, the Audit Committee shall be provided with the details of each new, existing or proposed related party transaction, including the terms of the transaction, any contractual restrictions that we have already committed to, the business purpose of the proposed transaction and the benefits of the proposed transaction to us and to the relevant related party. Any member of the Audit Committee who has an interest in the related party transaction under review (including as a result of their relationship with BCPA and/or the BCPA Credit Affiliates) will be required to abstain from voting on the approval of the related party transaction, but may, if so requested by the chairman of the Audit Committee, participate in some or all of the Audit Committee’s discussions of the related party transaction. As part of its review, the Audit Committee will take into account, among other factors, whether the transaction is on terms no more favorable than terms generally available to an unaffiliated third party under the same or similar
153
circumstances and the extent of the related person’s interest in the transaction. Upon completion of its review of the related party transaction, the Audit Committee may determine to permit or to prohibit the related party transaction.
154
DESCRIPTION OF NOTES
Mount Logan Capital Inc. (the “Company”) will issue $ in aggregate principal amount of % Senior Notes due 2031 (the “Notes”) under an indenture dated as of , 2026 (the “base indenture”) between the Company and U.S. Bank National Association, as trustee (the “trustee”), as supplemented by the first supplemental indenture (together with the base indenture, the “indenture”).
Unless the context requires otherwise, all references to “we,” “us,” “our” and the “Company” in this section refer solely to Mount Logan Capital Inc., the issuer of the Notes, and not to any of its subsidiaries.
The following description is only a summary of certain provisions of the indenture and the Notes. You should read these documents in their entirety because they, and not this description, define your rights as holders of the Notes. The following summary does not purport to be complete and is subject to, and is qualified in its entirety by reference to, the indenture and to the Trust Indenture Act of 1939, as amended (the “Trust Indenture Act”), and to all of the provisions of the indenture and those terms made a part of the indenture by reference to the Trust Indenture Act.
General
The Notes:
•will be our general unsecured, senior obligations;
•will be initially limited to an aggregate principal amount of $ (assuming no exercise of the underwriters’ option to purchase additional Notes described herein);
•will mature on , 20 unless earlier redeemed or repurchased, and 100% of the aggregate principal amount will be paid at maturity;
•will bear cash interest from , 2026 at an annual rate of %, payable in arrears on and of each year, commencing on , 2026, and at maturity;
•will be redeemable at our option, in whole or in part, at any time on or after , 20 , at the prices and on the terms described under “– Optional Redemption” below;
•will be redeemable at our option, in whole, but not in part, at any time upon the occurrence of certain change of control events, at the prices and on the terms described under “– Optional Redemption Upon Change of Control” below;
•will be issued in denominations of $25 and integral multiples of $25 in excess thereof;
•will not have a sinking fund;
•are expected to be listed on The Nasdaq Global Market under the symbol “MLCIL”; and
•will be represented by one or more registered Notes in global form, but in certain limited circumstances may be represented by Notes in definitive form.
The indenture does not limit the amount of indebtedness that we or our subsidiaries may issue. The indenture does not contain any financial covenants and does not restrict us from paying dividends or issuing or repurchasing our other securities. Other than restrictions described under “– Covenants – Merger, Consolidation or Sale of Assets” below, the indenture does not contain any covenants or other provisions designed to afford holders of the Notes protection in the event of a highly leveraged transaction involving us or in the event of a decline in our credit rating as the result of a takeover, recapitalization, highly leveraged transaction or similar restructuring involving us that could adversely affect such holders.
We may from time to time, without the consent of the existing holders, issue additional Notes having the same terms as to status, redemption or otherwise (except the price to public, the issue date and, if applicable, the
155
initial interest accrual date and the initial interest payment date) that may constitute a single fungible series with the Notes offered by this prospectus supplement; provided that if any such additional Notes are not fungible with the Notes initially offered hereby for U.S. federal income tax purposes, such additional Notes will have one or more separate CUSIP numbers. For the avoidance of doubt, such additional Notes will still constitute a single series with all other Notes issued under the indenture for all purposes, including waivers, amendments, redemptions and offers to purchase.
Ranking
The Notes will be senior unsecured obligations of the Company and, upon our liquidation, dissolution or winding up, will rank: (i) senior to the outstanding shares of our common stock, (ii) senior to any of our future subordinated debt, (iii) pari passu (or equally) with our outstanding and future unsecured and unsubordinated indebtedness, (iv) effectively subordinated to any existing or future secured indebtedness (including indebtedness that is initially unsecured to which we subsequently grant security), including borrowings under the Credit Facility, to the extent of the value of the assets securing such indebtedness, and (v) structurally subordinated to all existing and future indebtedness of our subsidiaries, financing vehicles or similar facilities. See “Risk Factors – The Notes will be unsecured and therefore will be effectively subordinated to our existing secured indebtedness and any secured indebtedness we may incur in the future.”
The Notes will be obligations solely of the Company and will not be guaranteed by any of our subsidiaries. We derive substantially all of our operating income and cash flow from our investments in our subsidiaries. Claims of creditors of our subsidiaries generally will have priority with respect to the assets and earnings of such subsidiaries over the claims of our creditors, including holders of the Notes. As a result, the Notes will be effectively subordinated to creditors, including trade creditors and preferred stockholders, if any, other than us, of our subsidiaries. See “Risk Factors - The Notes will be structurally subordinated to the indebtedness and other liabilities of our future subsidiaries, if any.”
As of September 30, 2025, we had approximately $74.3 million of outstanding indebtedness, of which $38.0 million was secured and all of which was indebtedness of our subsidiaries.
Interest
Interest on the Notes will accrue at an annual rate equal to % from and including , 2026 to, but excluding, the maturity date or earlier acceleration or redemption and will be payable in arrears on and of each year, commencing on , 20 and at maturity, to the holders of record at the close of business on the immediately preceding , , and , as applicable (whether or not a business day).
The initial interest period for the Notes will be the period from and including , 20 , to, but excluding, , 20 , and subsequent interest periods will be the periods from and including an interest payment date to, but excluding, the next interest payment date or the stated maturity date, as the case may be. The amount of interest payable for any interest period, including interest payable for any partial interest period, will be computed on the basis of a 360-day year comprised of twelve 30-day months. If an interest payment date falls on a non-business day, the applicable interest payment will be made on the next business day and no additional interest will accrue as a result of such delayed payment.
“Business day” means, for any place where the principal and interest on the Notes is payable, each Monday, Tuesday, Wednesday, Thursday and Friday which is not a day in which banking institutions in New York are authorized or obligated by law or executive order to close.
Optional Redemption
We may, at our option, redeem the Notes for cash, in whole at any time or in part from time to time: (i) on or after , 20 (the “First Call Date”), and prior to , 20 , at a redemption price equal to the sum of % of their principal amount, and (ii) on or after , 20 at a redemption price equal to the sum of
156
100% of their principal amount, and, in each case, plus (in each case noted above) accrued and unpaid interest to, but excluding, the date of redemption.
At any time prior to the First Call Date, we may, at our option, redeem the Notes for cash, in whole at any time or in part from time to time at a redemption price equal to: (i) 100% of the principal amount of Notes redeemed, plus (ii) a Make-Whole Amount (as defined below), plus (iii) accrued and unpaid interest, if any, to, but excluding, the date of redemption.
In each case, redemption shall be upon notice not fewer than 10 days and not more than 60 days prior to the date fixed for redemption, except that redemption notices may be delivered more than 60 days prior to a redemption date if the notice is issued in connection with a defeasance of the Notes or a discharge of the indenture. Notices of redemption may be subject to satisfaction or waiver of one or more conditions precedent specified in the notice of redemption.
If less than all of the Notes are to be redeemed, the particular Notes to be redeemed will be selected not more than 45 days prior to the redemption date by the trustee from the outstanding Notes not previously called for redemption, by lot, or in the trustee’s discretion, on a pro-rata basis, subject to the applicable procedures of DTC, provided that the unredeemed portion of the principal amount of any Notes will be in an authorized denomination (which will not be less than the minimum authorized denomination) for such Notes. The trustee will promptly notify us in writing of the Notes selected for redemption and, in the case of any Notes selected for partial redemption, the principal amount thereof to be redeemed. Beneficial interests in any of the Notes or portions thereof called for redemption that are registered in the name of DTC or its nominee will be selected by DTC in accordance with DTC’s applicable procedures.
Unless we default on the payment of the redemption price, on and after the date of redemption, interest will cease to accrue on the Notes called for redemption.
We may at any time, and from time to time, purchase Notes at any price or prices in the open market or otherwise.
“Make-Whole Amount” means, in connection with any optional redemption of any Note, the excess, if any, of: (i) the sum of the present values, as of the date of such redemption, of the remaining scheduled payments of principal (including the redemption price of such Note on the First Call Date) of, and interest (exclusive of interest accrued to, but excluding, the date of redemption) on, such Note being redeemed, assuming such Note matured on, and that accrued and unpaid interest on such Note was payable through, the First Call Date, determined by discounting, on a semiannual basis (assuming a 360-day year consisting of twelve 30-day months), such principal and interest at the Reinvestment Rate (as defined below) (determined on the third business day preceding the date of redemption (or in the case of a discharge, as of the date that redemption funds are deposited with the trustee)) over (ii) the aggregate principal amount of such Notes being redeemed.
“Reinvestment Rate” means %, or basis points, plus the arithmetic mean (rounded to the nearest one-hundredth of one percent) of the yields displayed for the five most recent Business Days published in the most recent Statistical Release under the caption “Treasury constant maturities” for the maturity (rounded to the nearest month) corresponding to the remaining life to maturity of the Notes (assuming that the Notes matured on the First Call Date) as of the date of redemption. If no maturity exactly corresponds to such remaining life to maturity, yields for the two published maturities most closely corresponding to such remaining life to maturity shall be calculated pursuant to the immediately preceding sentence and the Reinvestment Rate shall be interpolated or extrapolated from such yields on a straight-line basis, rounding in each of such relevant periods to the nearest month. For the purpose of calculating the Reinvestment Rate, the most recent Statistical Release published prior to the date of determination of the Reinvestment Rate shall be used.
“Statistical Release” means the statistical release designated “H.15” or any comparable online data source or publication which is made available by the Federal Reserve System and which establishes yields on actively traded U.S. government securities adjusted to constant maturities, or, if such Statistical Release is not published at the time of any determination under the indenture, then such other reasonably comparable index which shall be designated by us.
157
Optional Redemption Upon Change of Control
The Notes may be redeemed for cash in whole but not in part at our option at any time within 90 days of the occurrence of a Change of Control, at a price equal to 100% of their principal amount, plus accrued and unpaid interest to, but excluding, the date of redemption. Redemption shall be upon notice not fewer than 10 days and not more than 60 days prior to the date fixed for redemption. Notices of redemption may be subject to satisfaction or waiver of one or more conditions precedent specified in the notice of redemption.
A “Change of Control” will be deemed to have occurred at the time after the Notes are originally issued if:
(a)any “Person” (as such term is used in Sections 13(d) and 14(d) of the Exchange Act) is or becomes the “Beneficial Owner” (as defined in Rules 13d-3 and 13d-5 under the Exchange Act, except that for purposes of this clause (1) such Person shall be deemed to have “Beneficial Ownership” of all shares that any such Person has the right to acquire, whether such right is exercisable immediately or only after the passage of time), directly or indirectly, of more than 50.0% of the total voting power of the Voting Stock of the Company;
(b)the merger or consolidation of the Company with or into another Person or the merger of another Person with or into the Company, or the sale of all or substantially all the assets of the Company (determined on a consolidated basis) to another Person other than a transaction following which, in the case of a merger or consolidation transaction, holders of securities that represented 100.0% of the Voting Stock of the Company immediately prior to such transaction (or other securities into which such securities are converted as part of such merger or consolidation transaction) own directly or indirectly at least a majority of the voting power of the Voting Stock of the surviving Person in such merger or consolidation transaction immediately after such transaction and in substantially the same proportion as before the transaction;
(c)“Continuing Directors” (as defined below) cease to constitute at least a majority of the Company’s board of directors; or
(d)if after the Notes are initially listed on The Nasdaq Global Market or another national securities exchange, the Notes fail, or at any point cease, to be listed on The Nasdaq Global Market or such other national securities exchange. For the avoidance of doubt, it shall not be a Change of Control if after the Notes are initially listed on The Nasdaq Global Market or another national securities exchange, such Notes are subsequently listed on a different national securities exchange and the prior listing is terminated.
“Continuing Director” means a director who either was a member of our board of directors on the issue date of the Notes or who becomes a member of our board of directors subsequent to that date and whose election, appointment or nomination for election by our stockholders is duly approved by a majority of the continuing directors on our board of directors at the time of such approval by such election or appointment.
“Voting Stock” of any specified Person as of any date means the Capital Stock of such Person that is at the time entitled to vote generally in the election of the Board of Directors of such Person.
Events of Default
Holders of our Notes will have rights if an Event of Default occurs in respect of the Notes and is not cured, as described later in this subsection. The term “Event of Default” in respect of the Notes means any of the following:
•we do not pay interest on any Note when due, and such default is not cured within 30 days;
•we do not pay the principal (or premium, if any) of the Notes when due and payable;
•we breach any covenant or warranty in the indenture with respect to the Notes and such breach continues for 60 days after we receive a written notice of such breach from the trustee or the holders of at least 25% of the principal amount of the Notes; and
158
•certain specified events of bankruptcy, insolvency or reorganization occur and remain undischarged or unstayed for a period of 90 days.
The trustee may withhold notice to the holders of the Notes of any default, except in the payment of principal or interest, if the trustee in good faith determines the withholding of notice to be in the interest of the holders of the Notes.
Each year, we will furnish to the trustee a written statement of certain of our officers certifying that to their knowledge we are in compliance with the indenture and the Notes, or else specifying any default, its status and what actions we are taking or propose to take with respect thereto.
Remedies if an Event of Default Occurs
If an Event of Default has occurred and is continuing, the trustee or the holders of not less than 25% of the outstanding principal amount of the Notes may declare the entire principal amount of the Notes, together with accrued and unpaid interest, if any, to be due and payable immediately by a notice in writing to us and, if notice is given by the holders of the Notes, the trustee. This is called an “acceleration of maturity.” If the Event of Default occurs in relation to our filing for bankruptcy or certain other events of bankruptcy, insolvency or reorganization occur, the principal amount of the Notes, together with accrued and unpaid interest, if any, will automatically, and without any declaration or other action on the part of the trustee or the holders, become immediately due and payable.
At any time after a declaration of acceleration of the Notes has been made by the trustee or the holders of the Notes and before any judgment or decree for payment of money due has been obtained by the trustee, the holders of a majority of the outstanding principal of the Notes, by written notice to us and the trustee, may rescind and annul such declaration and its consequences if: (i) we have paid or deposited with the trustee all amounts due and owed with respect to the Notes (other than principal that has become due solely by reason of such acceleration) and certain other amounts, and (ii) any other Events of Default have been cured or waived.
At our election, the sole remedy with respect to an Event of Default due to our failure to comply with certain reporting requirements under the Trust Indenture Act or under “- Covenants - Reporting” below, for the first 180 calendar days after the occurrence of such Event of Default, consists exclusively of the right to receive additional interest on the Notes at an annual rate equal to: (1) 0.25% for the first 90 calendar days after such default and (2) 0.50% for calendar days 91 through 180 after such default. On the 181st day after such Event of Default, if such violation is not cured or waived, the trustee or the holders of not less than 25% of the outstanding principal amount of the Notes may declare the principal, together with accrued and unpaid interest, if any, on the Notes to be due and payable immediately. If we choose to pay such additional interest, we must notify the trustee and the holders of the Notes by certificate of our election at any time on or before the close of business on the first business day following the Event of Default and we shall deliver to the trustee an officer’s certificate (upon which the trustee may rely conclusively) to that effect stating: (i) the amount of such additional interest that is payable and (ii) the date on which such additional interest is payable. Unless and until the trustee receives such a certificate, the trustee may assume without inquiry that no such additional interest is payable and the trustee shall not have any duty to verify our calculations of additional interest.
Before a holder of the Notes is allowed to bypass the trustee and bring a lawsuit or other formal legal action or take other steps to enforce such holder’s rights relating to the Notes, the following must occur:
•such holder must give the trustee written notice that the Event of Default has occurred and remains uncured;
•the holders of at least 25% of the outstanding principal of the Notes must have made a written request to the trustee to institute proceedings in respect of such Event of Default in its own name as trustee;
•such holder or holders must have offered to the trustee indemnity satisfactory to the trustee against the costs, expenses and liabilities to be incurred in compliance with such request;
159
•the trustee for 60 days after its receipt of such notice, request and offer of indemnity has failed to institute any such proceeding; and
•no direction inconsistent with such written request has been given to the trustee during such 60-day period by holders of a majority of the outstanding principal of the Notes.
No delay or omission in exercising any right or remedy will be treated as a waiver of that right, remedy or Event of Default.
The holders of a majority in principal amount of the outstanding Notes may waive any default or Event of Default and its consequences, except defaults or Events of Default regarding payment of principal, premium, if any, or interest, unless we have cured the default or Event of Default in accordance with the indenture.
Any waiver shall cure the default or Event of Default.
Subject to the terms of the indenture, if an Event of Default occurs and continues, the trustee is under no obligation to exercise any of its rights or powers under the indenture at the request or direction of any of the holders, unless such holders have offered the trustee security or indemnity satisfactory to the trustee. The holders of a majority in principal amount of the outstanding Notes will have the right to direct the time, method and place of conducting any proceeding for any remedy available to the trustee, or exercising any trust or power conferred on the trustee, with respect to the Notes, provided that:
•the direction so given by the holder is not in conflict with any law or the indenture, nor does it subject the trustee to a risk of personal liability in respect of which the trustee has not received indemnification satisfactory to it in its sole discretion against all losses, liabilities and expenses caused by taking or not taking such action; and
•the trustee may take any other action deemed proper by the trustee which is not inconsistent with such direction.
A holder of the Notes will have the right to institute a proceeding under the indenture or to appoint a receiver or trustee, or to seek other remedies only if:
•the holder has given written notice to the trustee of a continuing Event of Default;
•the holders of at least 25% in aggregate principal amount of the then-outstanding Notes have made written request to the trustee to institute proceedings in respect of such Event of Default in its own name as trustee under the indenture, and such holders have offered security or indemnity satisfactory to the trustee to institute the proceeding as trustee; and
•the trustee does not institute the proceeding, and does not receive from the holders of a majority in aggregate principal amount of the outstanding Notes other conflicting directions within 60 days after the notice, request and offer.
These limitations do not apply to a suit instituted by a holder if we default in the payment of the principal, premium, if any, or interest on, the Notes.
Book-entry and other indirect holders of the Notes should consult their banks or brokers for information on how to give notice or direction to or make a request of the trustee and how to declare or cancel an acceleration of maturity.
Waiver of Defaults
The holders of not less than a majority of the outstanding principal amount of the Notes may on behalf of the holders of all Notes waive any past default with respect to the Notes other than: (i) a default in the payment of principal or interest on the Notes when such payments are due and payable (other than by acceleration as described
160
above), or (ii) in respect of a covenant that cannot per the terms of the indenture be modified or amended without the consent of each holder of Notes.
Covenants
In addition to standard covenants relating to payment of principal and interest, maintaining an office where payments may be made or securities can be surrendered for payment, payment of taxes by us and related matters, the following covenants will apply to the Notes.
Merger, Consolidation or Sale of Assets
The indenture provides that we will not merge or consolidate with or into any other person, or convey or transfer all or substantially all our properties and assets unless:
•we are the surviving entity or the entity (if other than us) formed by such merger or consolidation or to which such conveyance or transfer is made will be a corporation, statutory trust or limited liability company organized and existing under the laws of the United States of America or any state or territory thereof;
•the surviving entity (if other than us) expressly assumes, by supplemental indenture in form reasonably satisfactory to the trustee, executed and delivered to the trustee by such surviving entity, the due and punctual payment of the principal of, and premium, if any, and interest on, all the Notes outstanding, and the performance of every covenant of the indenture to be performed by us;
•immediately after giving effect to such transaction, no default or Event of Default shall have happened and be continuing; and
•we and the surviving entity will deliver, or cause to be delivered, to the trustee, an officers’ certificate and an opinion of counsel, each stating that such consolidation, merger, conveyance or transfer and the supplemental indenture, if any, in respect thereto, comply with this covenant and that all conditions precedent in the indenture relating to such consolidation, merger, conveyance or transfer have been complied with; provided that in giving an opinion of counsel, counsel may rely on an officers’ certificate as to any matters of fact, including as to the satisfaction of the preceding bullet.
The surviving entity (if other than us) will succeed to, and be substituted for, and may exercise every right and power of, the Company under the Notes and the indenture, and the Company will automatically and unconditionally be released and discharged from its obligations under the Notes and the indenture and may be dissolved and liquidated.
Reporting
If, at any time, we are not subject to the reporting requirements of Sections 13 or 15(d) of the Exchange Act to file any periodic reports with the SEC, we agree to furnish to holders of the Notes and the trustee, for the period of time during which the Notes are outstanding, our audited annual consolidated financial statements, within 90 days of our fiscal year end, and unaudited interim consolidated financial statements, within 45 days of our fiscal quarter end (other than our fourth fiscal quarter). All such financial statements will be prepared, in all material respects, in accordance with GAAP, consistently applied, as applicable.
The posting or delivery of any such information, documents and reports to the trustee is for informational purposes only and the trustee’s receipt of such shall not constitute constructive notice of any information contained therein or determinable from information contained therein, including the Company’s compliance with any of the covenants under the indenture (as to which the trustee is entitled to rely exclusively on an officer’s certificate). The trustee shall have no duty to review or analyze reports, information and documents delivered to it. Additionally, the trustee shall not be obligated to monitor or confirm, on a continuing basis or otherwise, the Company’s compliance with the covenants or with respect to any reports or other documents filed with any protected online data system or participate on any conference calls.
161
Interest Coverage Ratio
We will not, and will not permit any Subsidiary (other than the Insurance Subsidiary) to, incur any Indebtedness (other than Permitted Debt) unless, on the date of such incurrence and after giving pro forma effect thereto and to the application of the proceeds thereof, the Company’s Cash Interest Coverage Ratio for the Latest LTM Period is not less than 2.0 to 1.0.
“Capitalized Lease Obligations” means the capitalized amount which, in accordance with GAAP is required to be reported as a liability on the balance sheet of a Person at such time in respect of such Person’s interest as lessee under a capitalized lease.
“Cash Interest Coverage Ratio” means the ratio of (i) LTM Total Earnings to (ii) LTM Cash Interest Expense.
“Contingent Obligation” means, as to any Person and without duplication of amounts, any written obligation of such Person guaranteeing or intended to guarantee (whether guaranteed, endorsed, co-made, discounted, or sold with recourse to such Person) any Indebtedness, noncancellable lease, dividend, reimbursement obligations relating to letters of credit, or any other obligation that pertains to Indebtedness, a noncancellable lease, a dividend, or a reimbursement obligation related to letters of credit (each, a “primary obligation”) of any other Person (“primary obligor”) in any manner, whether directly or indirectly, including any written obligation of such Person, irrespective of whether contingent, (a) to purchase any such primary obligation, (b) to advance or supply funds (whether in the form of a loan, advance, Equity Interests purchase, capital contribution, or otherwise) (i) for the purchase, repurchase, or payment of any such primary obligation or any asset constituting direct or indirect security therefor, or (ii) to maintain working capital or equity capital of the primary obligor, or otherwise to maintain the net worth, solvency, or other financial condition of the primary obligor, or (c) to purchase or make payment for any asset, securities, services, or noncancellable lease if primarily for the purpose of assuring the owner of any such primary obligation of the ability of the primary obligor to make payment of such primary obligation; provided that the term “Contingent Obligation” shall not include endorsements or instruments for deposit or collection in the ordinary course of business or customary and reasonable contingent indemnification obligations or purchase price holdbacks in effect on the date the Notes are originally issued or entered into in connection with any acquisition or disposition of assets permitted under the Indenture. The amount of any Contingent Obligation shall be deemed to be an amount equal to the stated or determinable amount of the related primary obligation, or portion thereof, in respect of which such Contingent Obligation is made or, if not stated or determinable, the maximum reasonably anticipated liability in respect thereof as determined by the guaranteeing Person in good faith.
“Equity Interests” means (a) all shares of capital stock (whether denominated as common stock or preferred stock), equity interests, beneficial, partnership or membership interests, joint venture interests, participations or other ownership or profit interests in or equivalents (regardless of how designated) of or in a Person (other than an individual), whether voting or non-voting and (b) all securities convertible into or exchangeable for any of the foregoing and all warrants, options or other rights to purchase, subscribe for or otherwise acquire any of the foregoing, whether or not presently convertible, exchangeable or exercisable.
“Indebtedness” means as of any date of determination, all indebtedness for borrowed money of the Company and its Subsidiaries that is included as a liability on the consolidated financial statements of the Company in accordance with GAAP, excluding: (i) any indebtedness to the extent discharged or to the extent secured by cash, cash equivalents or marketable securities (it being understood that cash collateral shall be deemed to include cash deposited with a trustee or other agent with respect to third party indebtedness), (ii) Intercompany Debt, (iii) all liabilities associated with customary exceptions to non-recourse indebtedness, such as for fraud, misapplication of funds, environmental indemnities, voluntary bankruptcy, collusive involuntary bankruptcy and other similar exceptions and (iv) any redeemable equity interest in the Company; provided that Indebtedness of a Subsidiary of the Company that is not a wholly owned Subsidiary of the Company shall be reduced to reflect the Company’s proportionate interest therein.
“Insurance Subsidiary” means Ability Insurance Company and any other Subsidiary whose primary business is insurance or reinsurance (and its and their respective subsidiaries).
162
“Intercompany Debt” means, as of any date, Indebtedness to which the only parties are the Company and any of its Subsidiaries as of such date; provided, however, that with respect to any such Indebtedness of which the Company is the borrower, such Indebtedness is subordinate in right of payment to the Notes.
“Latest LTM Period” means the most recently ended four fiscal quarter period.
“LTM Cash Interest Expense” means, for the Latest LTM Period, cash interest actually paid or payable in cash by Company and its Subsidiaries on Indebtedness, excluding: (i) any interest of Insurance Subsidiaries (including on insurance surplus notes), (ii) non-cash interest (including PIK, amortization of deferred financing costs, OID, accretion, or fair-value changes), and (iii) interest capitalized to asset cost.
“LTM FRE” means the total aggregate Fee Related Earnings for the Latest LTM Period, calculated consistently with the Company’s consolidated financial statements and notes thereto prepared in accordance with GAAP.
“LTM SRE” means the total aggregate Spread Related Earnings for the Latest LTM Period, calculated consistently with the Company’s consolidated financial statements and notes thereto prepared in accordance with GAAP.
“LTM Total Earnings” means the sum of LTM FRE and LTM SRE for the Latest LTM Period.
“Permitted Debt” means:
(a)Indebtedness evidenced by the Notes;
(b)(i) Indebtedness resulting from Capitalized Lease Obligations and (ii) Indebtedness incurred to finance the acquisition, construction or improvement of any fixed or capital assets, and extensions, renewals and replacements of any such Indebtedness that do not increase the outstanding principal amount thereof;
(c)Contingent Obligations resulting from the endorsement of instruments for collection in the ordinary course of business;
(d)Indebtedness owed to any Person providing property, casualty, liability, or other insurance to us or any of our Subsidiaries which Indebtedness is incurred in the ordinary course of business, so long as the amount of such Indebtedness is not in excess of the amount of the unpaid cost of, and shall be incurred only to defer the cost of, such insurance for the year in which such Indebtedness is incurred;
(e)Indebtedness incurred in the ordinary course of business under performance, surety, statutory, and appeal bonds;
(f)Indebtedness incurred in the ordinary course of business with banks or financial institutions that arises in connection with cash management arrangements and related treasury services;
(g)Indebtedness existing on the date the Notes are originally issued;
(h)Indebtedness of us or any Subsidiary owing to us, any Subsidiary or Sierra Crest;
(i)non-speculative Swap Arrangements for the purpose of limiting interest rate risk or exchange rate risk with respect to any Indebtedness not prohibited under the Indenture;
(j)other Indebtedness in an aggregate principal amount not exceeding the greater of $15,000,000 and 100% of LTM Total Earnings at any one time outstanding;
(k)Indebtedness in respect of netting services, overdraft protections and otherwise in connection with deposit accounts or in connection with endorsement of instruments for deposit incurred in the ordinary course of business;
163
(l)Indebtedness incurred in the ordinary course of business under incentive, non-compete, consulting, deferred compensation, or other similar arrangements incurred by us or any Subsidiary;
(m)Indebtedness incurred in the ordinary course of business with respect to the financing of insurance premiums;
(n)Indebtedness in respect of taxes, assessments or governmental charges to the extent that payment thereof shall not at the time be required to be made hereunder;
(o)guaranties by us or any Subsidiary in respect of real estate lease obligations incurred in the ordinary course of business;
(p)Indebtedness incurred by us or any Subsidiary arising from agreements providing for indemnities, adjustment of purchase price or similar obligations in connection with acquisitions or dispositions of any business assets;
(q)Indebtedness under any revolving credit facility or facilities, including drawings upon any letters of credit, in an aggregate principal amount not exceeding the greater of $7,500,000 and 50% of LTM Total Earnings at any one time outstanding;
(r)Indebtedness that is contractually or structurally subordinated in right of payment to the Notes;
(s)Indebtedness incurred in connection with litigation or regulatory investigations or enforcement actions, including any judgment, settlement or other resolution thereof; and
(t)Indebtedness incurred in connection with the refinancing of any Indebtedness incurred in compliance with the Indenture.
“Swap Arrangements” means (i) any interest rate, foreign currency, commodity, equity, equity market index-based or debt-market index-based swap, collar, cap, floor or forward rate agreement (which may include, for the avoidance of doubt, any of the foregoing entered into for speculative purposes), (ii) any agreement or arrangement designed to protect against fluctuations in, or to provide for periodic settlements or settlements upon termination based on, interest rates or currency, commodity or equity values, the values of one or more portfolios of, or indices based on, debt or equity securities, or the performance of one or more economic indicators (including, without limitation, any option with respect to any of the foregoing and any combination of the foregoing agreements or arrangements), and (iii) any confirmation executed in connection with any such agreement or arrangement.
Modification or Waiver
There are three types of changes we can make to the indenture and the Notes:
Changes Not Requiring Approval
We can make certain changes to the indenture and the Notes without the specific approval of the holders of the Notes. This type is limited to clarifications and certain other changes that would not adversely affect holders of the Notes in any material respect and include changes:
•to evidence the succession of another Person, and the assumption by the successor of our covenants, agreements and obligations under the indenture and the Notes;
•to add to our covenants such new covenants, restrictions, conditions or provisions for the protection of the holders of the Notes, and to make the occurrence, or the occurrence and continuance, of a default in any of such additional covenants, restrictions, conditions or provisions an Event of Default;
•to cure any ambiguity or to correct or supplement any provision contained in the indenture or in any supplemental indenture which may be defective or inconsistent with other provisions;
•to secure the Notes;
164
•to evidence and provide for the acceptance and appointment of a successor trustee and to add or change any provisions of the indenture as necessary to provide for or facilitate the administration of the trust by more than one trustee; and
•to make provisions in regard to matters or questions arising under the indenture, so long as such other provisions do not materially adversely affect the interest of any other holder of the Notes.
Changes Requiring Approval of Each Holder
We cannot make certain changes to the Notes without the specific approval of each holder of the Notes. The following is a list of those types of changes:
•changing the stated maturity of the principal of, or any installment of interest on, any Note;
•reducing the principal amount or rate of interest of any Note;
•changing the place of payment where any Note or any interest is payable;
•impairing the right to institute suit for the enforcement of any payment on or after the date on which it is due and payable;
•reducing the percentage in principal amount of holders of the Notes whose consent is needed to modify or amend the indenture; and
•reducing the percentage in principal amount of holders of the Notes whose consent is needed to waive compliance with certain provisions of the indenture or to waive certain defaults.
Changes Requiring Majority Approval
Any other change to the indenture and the Notes would require the approval by holders of not less than a majority in aggregate principal amount of the outstanding Notes.
Consent from holders to any change to the indenture or the Notes must be given in writing. The consent of the holders of the Notes is not necessary under the indenture to approve the particular form of any proposed amendment. It is sufficient if such consent approves the substance of the proposed amendment.
Further Details Concerning Voting
The amount of Notes deemed to be outstanding for the purpose of voting will include all Notes authenticated and delivered under the indenture as of the date of determination except:
•Notes cancelled by the trustee or delivered to the trustee for cancellation;
•Notes for which we have deposited with the trustee or paying agent or set aside in trust money for their payment or redemption and, if money has been set aside for the redemption of the Notes, notice of such redemption has been duly given pursuant to the indenture to the satisfaction of the trustee;
•Notes held by the Company, its subsidiaries or any other entity which is an obligor under the Notes, unless such Notes have been pledged in good faith and the pledgee is not the Company, an affiliate of the Company or an obligor under the Notes;
•Notes which have undergone full defeasance, as described below; and
•Notes which have been paid or exchanged for other Notes due to such Notes loss, destruction or mutilation, with the exception of any such Notes held by bona fide purchasers who have presented proof to the trustee that such Notes are valid obligations of the Company.
We will generally be entitled to set any day as a record date for the purpose of determining the holders of the Notes that are entitled to vote or take other action under the indenture, and the trustee will generally be entitled
165
to set any day as a record date for the purpose of determining the holders of the Notes that are entitled to join in the giving or making of any Notice of Default, any declaration of acceleration of maturity of the Notes, any request to institute proceedings or the reversal of such declaration. If we or the trustee set a record date for a vote or other action to be taken by the holders of the Notes, that vote or action can only be taken by persons who are holders of the Notes on the record date and, unless otherwise specified, such vote or action must take place on or prior to the 180th day after the record date. We may change the record date at our option, and we will provide written notice to the trustee and to each holder of the Notes of any such change of record date.
Discharge
The indenture will provide that we can elect to be discharged from our obligations with respect to the Notes, except for specified obligations, including obligations to:
•register the transfer or exchange of the Notes;
•replace stolen, lost or mutilated Notes;
•maintain paying agencies; and
•hold monies for payment in trust.
In order to exercise our rights to be discharged, we must: (i) deposit with the trustee money or U.S. government obligations, or a combination thereof, sufficient (to the extent of any U.S. government obligations, in the opinion of a nationally recognized firm of independent public accountants, investment bank or appraisal firm, to generate enough cash to make interest, principal and any other applicable payments on the Notes on the applicable due date) to pay all the principal of, any premium and interest on, the Notes on the dates payments are due, (ii) deliver irrevocable written instructions to the trustee to apply the deposited cash and/or U.S. government obligations toward the payment of the Notes at maturity or on the redemption date, as the case may be, and (iii) deliver an officer’s certificate and opinion of counsel to the trustee, stating that all conditions precedent under the indenture relating to the satisfaction and discharge of the indenture have been complied with.
“U.S. government obligations” means securities that are: (1) direct obligations of the United States for the payment of which its full faith and credit is pledged, or (2) obligations of a person controlled or supervised by and acting as an agency or instrumentality of the United States, the payment of which is unconditionally guaranteed as a full faith and credit obligation by the United States, which in either case, are not callable or redeemable by the issuer thereof and shall also include a depository receipt issued by a bank (as defined in Section 3(a)(2) of the Securities Act) as custodian with respect to any such U.S. government obligations or a specific payment of principal of or interest on any such U.S. government obligations held by such custodian for the account of the holder of such depository receipt; provided that (except as required by law) such custodian is not authorized to make any deduction from the amount payable to the holder of such depository receipt from any amount received by the custodian in respect of the U.S. government obligations or the specific payment of principal of or interest on the U.S. government obligations evidenced by such depository receipt.
Defeasance
The following defeasance provisions will be applicable to the Notes. “Defeasance” means that, by irrevocably depositing with the trustee an amount of cash denominated in U.S. dollars and/or U.S. government obligations sufficient to pay all principal and interest, if any, on the Notes when due and satisfying any additional conditions noted below, we will be deemed to have been discharged from our obligations under the Notes. In the event of a “covenant defeasance,” upon depositing such funds and satisfying similar conditions discussed below we would be released from certain covenants under the indenture governing the Notes. The consequences to the holders of the Notes would be that, while they would no longer benefit from certain covenants under the indenture, and while the Notes could not be accelerated for any reason, the holders of the Notes nonetheless would be guaranteed to receive the principal and interest owed to them.
166
Covenant Defeasance
Under the indenture, we have the option to take the actions described below and be released from some of the restrictive covenants under the indenture under which the Notes were issued. This is called “covenant defeasance.” In that event, holders of the Notes would lose the protection of those restrictive covenants but would gain the protection of having money and government securities set aside in trust to repay the Notes. In order to achieve covenant defeasance, the following must occur:
•we must irrevocably deposit or cause to be deposited with the trustee as trust funds for the benefit of all holders of the Notes cash, U.S. government obligations or a combination of cash and U.S. government obligations sufficient, without reinvestment, in the opinion of a nationally recognized firm of independent public accountants, investment bank or appraisal firm, to generate enough cash to make interest, principal and any other applicable payments on the Notes on their various due dates;
•we must deliver to the trustee an opinion of counsel stating that under U.S. federal income tax law, we may make the above deposit and covenant defeasance without causing holders to be taxed on the Notes differently than if those actions were not taken;
•the covenant defeasance must not cause any Notes, if then listed on any securities exchange, to be delisted;
•no default or Event of Default with respect to the Notes has occurred and is continuing, and no defaults or Events of Defaults related to bankruptcy, insolvency or organization occurs during the 90 days following the deposit;
•the covenant defeasance must not cause the trustee to have a conflicting interest within the meaning of the Trust Indenture Act;
•the covenant defeasance must not result in a breach or violation of, or constitute a default under, the indenture or any other material agreements or instruments to which we are a party;
•the covenant defeasance must not result in the trust arising from the deposit constituting an investment company within the meaning of the Investment Company Act of 1940, as amended (the “Investment Company Act”), unless such trust will be registered under the Investment Company Act or exempt from registration thereunder; and
•we must deliver to the trustee an officers’ certificate and an opinion of counsel stating that all conditions precedent with respect to the covenant defeasance have been complied with.
Full Defeasance
If there is a change in U.S. federal income tax law, we can legally release ourselves from all payment and other obligations on the Notes if we take the following actions below:
•we must irrevocably deposit or cause to be deposited with the trustee as trust funds for the benefit of all holders of the Notes cash, U.S. government obligations or a combination of cash and U.S. government obligations sufficient, without reinvestment, in the opinion of a nationally recognized firm, of independent public accountants, investment bank or appraisal firm, to generate enough cash to make interest, principal and any other applicable payments on the Notes on their various due dates;
•we must deliver to the trustee an opinion of counsel confirming that there has been a change to the current U.S. federal income tax law or an Internal Revenue Service ruling that allows us to make the above deposit without causing holders to be taxed on the Notes any differently than if we did not make the deposit;
•the full defeasance must not cause any Notes, if then listed on any securities exchange, to be delisted;
167
•no default or Event of Default with respect to the Notes has occurred and is continuing and no defaults or Events of Defaults related to bankruptcy, insolvency or organization occurs during the 90 days following the deposit;
•the full defeasance must not cause the trustee to have a conflicting interest within the meaning of the Trust Indenture Act;
•the full defeasance must not result in a breach or violation of, or constitute a default under, the indenture or any other material agreements or instruments to which we are a party;
•the full defeasance must not result in the trust arising from the deposit constituting an investment company within the meaning of the Investment Company Act unless such trust will be registered under the Investment Company Act or exempt from registration thereunder; and
•we must deliver to the trustee an officers’ certificate and an opinion of counsel stating that all conditions precedent with respect to the full defeasance have been complied with.
In the event that the trustee is unable to apply the funds held in trust to the payment of obligations under the Notes by reason of a court order or governmental injunction or prohibition, then those of our obligations discharged under the full defeasance or covenant defeasance will be revived and reinstated as though no deposit of funds had occurred, until such time as the trustee is permitted to apply all funds held in trust under the procedure described above to the payment of obligations under the Notes. However, if we make any payment of principal or interest on the Notes to the holders, we will have the right to receive such payments from the trust in the place of the holders.
Counsel may rely on an officers’ certificate as to any matters of fact in giving an opinion of counsel in connection with the full defeasance or covenant defeasance provisions.
Listing
We have applied to list the Notes on Nasdaq under the symbol “MLCIL” If the application is approved, we expect trading in the Notes on Nasdaq to begin within 30 business days of the date of the original issue date. The Notes are expected to trade “flat,” meaning that purchasers will not pay and sellers will not receive any accrued and unpaid interest on the Notes that is not included in the trading price thereof.
Governing Law
The indenture and the Notes will be governed by and construed in accordance with the laws of the State of New York.
Global Notes; Book-Entry Issuance
The Notes will be issued in the form of one or more global certificates, or “Global Notes,” registered in the name of The Depository Trust Company, or “DTC.” DTC has informed us that its nominee will be Cede & Co. Accordingly, we expect Cede & Co. to be the initial registered holder of the Notes. No person that acquires a beneficial interest in the Notes will be entitled to receive a certificate representing that person’s interest in the Notes except as described herein. Unless and until definitive securities are issued under the limited circumstances described below, all references to actions by holders of the Notes will refer to actions taken by DTC upon instructions from its participants, and all references to payments and notices to holders will refer to payments and notices to DTC or Cede & Co., as the registered holder of these securities.
DTC has informed us that it is a limited-purpose trust company organized under the New York Banking Law, a “banking organization” within the meaning of the New York Banking Law, a member of the Federal Reserve System, a “clearing corporation” within the meaning of the New York Uniform Commercial Code, and a “clearing agency” registered pursuant to the provisions of Section 17A of the Exchange Act. DTC holds and provides asset servicing for over 3.5 million issues of U.S. and non-U.S. equity issues, corporate and municipal debt issues, and money market instruments from over 100 countries that DTC’s participants, or “Direct Participants,” deposit with DTC. DTC also facilitates the post-trade settlement among Direct Participants of sales and other securities
168
transactions in deposited securities through electronic computerized book-entry transfers and pledges between Direct Participants’ accounts. This eliminates the need for physical movement of securities certificates. Direct Participants include both U.S. and non-U.S. securities brokers and dealers, banks, trust companies, clearing corporations and certain other organizations. DTC is a wholly owned subsidiary of The Depository Trust & Clearing Corporation, or “DTCC.”
DTCC is the holding company for DTC, National Securities Clearing Corporation and Fixed Income Clearing Corporation, all of which are registered clearing agencies. DTCC is owned by the users of its regulated subsidiaries. Access to the DTC system is also available to others such as both U.S. and non-U.S. securities brokers and dealers, banks, trust companies and clearing corporations that clear through or maintain a custodial relationship with a Direct Participant, either directly or indirectly (“Indirect Participants” and, together with Direct Participants, “Participants”). DTC has an S&P rating of AA+ and a Moody’s rating of Aaa. The DTC Rules applicable to its participants are on file with the SEC. More information about DTC can be found at www.dtcc.com.
Purchases of the Notes under the DTC system must be made by or through Direct Participants, which will receive a credit for the Notes on DTC’s records. The ownership interest of each actual purchaser of each Note, or the “Beneficial Owner,” is in turn to be recorded on the Direct and Indirect Participants’ records. Beneficial Owners will not receive written confirmation from DTC of their purchase. Beneficial Owners are, however, expected to receive written confirmations providing details of the transaction, as well as periodic statements of their holdings, from the Direct or Indirect Participant through which the Beneficial Owner entered into the transaction. Transfers of ownership interests in the Notes are to be accomplished by entries made on the books of Direct and Indirect Participants acting on behalf of Beneficial Owners. Beneficial Owners will not receive certificates representing their ownership interests in the Notes, except in the event that use of the book-entry system for the Notes is discontinued.
To facilitate subsequent transfers, all Notes deposited by Direct Participants with DTC are registered in the name of DTC’s partnership nominee, Cede & Co., or such other name as may be requested by an authorized representative of DTC. The deposit of the Notes with DTC and their registration in the name of Cede & Co. or such other DTC nominee do not effect any change in beneficial ownership. DTC has no knowledge of the actual Beneficial Owners of the Notes; DTC’s records reflect only the identity of the Direct Participants to whose accounts the Notes are credited, which may or may not be the Beneficial Owners. The Direct and Indirect Participants will remain responsible for keeping account of their holdings on behalf of their customers.
Conveyance of notices and other communications by DTC to Direct Participants, by Direct Participants to Indirect Participants, and by Direct Participants and Indirect Participants to Beneficial Owners will be governed by arrangements among them, subject to any statutory or regulatory requirements as may be in effect from time to time.
Redemption notices will be sent to DTC. If less than all of the Notes are being redeemed, DTC’s practice is to determine by lot the amount of the interest of each Direct Participant in the Notes to be redeemed.
Neither DTC nor Cede & Co. (nor any other DTC nominee) will consent or vote with respect to the Notes unless authorized by a Direct Participant in accordance with DTC’s applicable procedures. Under its usual procedures, DTC mails an Omnibus Proxy to us as soon as possible after the record date. The Omnibus Proxy assigns Cede & Co.’s consenting or voting rights to those Direct Participants to whose accounts the Notes are credited on the record date (identified in a listing attached to the Omnibus Proxy).
Redemption proceeds, distributions and interest payments on the Notes will be made to Cede & Co., or such other nominee as may be requested by an authorized representative of DTC. DTC’s practice is to credit Direct Participants’ accounts upon DTC’s receipt of funds and corresponding detail information from us or the applicable trustee or depositary on the payment date in accordance with their respective holdings shown on DTC’s records. Payments by Participants to Beneficial Owners will be governed by standing instructions and customary practices, as is the case with the Notes held for the accounts of customers in bearer form or registered in “street name,” and will be the responsibility of such Participant and not of DTC nor its nominee, the applicable trustee or depositary, or us, subject to any statutory or regulatory requirements as may be in effect from time to time. Payment of redemption proceeds, distributions and interest payments to Cede & Co. (or such other nominee as may be requested by an authorized representative of DTC) is the responsibility of us or the applicable trustee or depositary. Disbursement of
169
such payments to Direct Participants will be the responsibility of DTC, and disbursement of such payments to the Beneficial Owners will be the responsibility of Direct Participants and Indirect Participants.
The information in this section concerning DTC and DTC’s book-entry system has been obtained from sources that we believe to be reliable, but we take no responsibility for the accuracy thereof.
None of the Company, the trustee, any depositary, or any agent of any of them will have any responsibility or liability for any aspect of DTC’s or any participant’s records relating to, or for payments made on account of, beneficial interests in a Global Note, or for maintaining, supervising or reviewing any records relating to such beneficial interests.
Termination of a Global Note
If a Global Note is terminated for any reason, interest in it will be exchanged for certificates in non-book- entry form as certificated securities. After such exchange, the choice of whether to hold the certificated Notes directly or in street name will be up to the investor. Investors must consult their own banks or brokers to find out how to have their interests in a Global Note transferred on termination to their own names, so that they will be holders of the Notes. See “- Form, Exchange and Transfer of Certificated Registered Securities.”
Payment and Paying Agents
We will pay interest to the person listed in the trustee’s records as the owner of the Notes at the close of business on the record date for the applicable interest payment date, even if that person no longer owns the Note on the interest payment date. Because we pay all the interest for an interest period to the holders on the record date, holders buying and selling the Notes must work out between themselves the appropriate purchase price. The most common manner is to adjust the sales price of the Notes to prorate interest fairly between buyer and seller based on their respective ownership periods within the particular interest period.
Payments on Global Notes
We will make payments on the Notes so long as they are represented by Global Notes in accordance with the applicable policies of the depositary in effect from time to time. Under those policies, we will make payments directly to the depositary, or its nominee, and not to any indirect holders who own beneficial interest in the Global Notes. An indirect holder’s right to those payments will be governed by the rules and practices of the depositary and its participants.
Payments on Certificated Securities
In the event the Notes become represented by certificates, we will make payments on the Notes as follows. We will pay interest that is due on an interest payment date by check mailed on the interest payment date to the holder of the Note at his or her address shown on the trustee’s records as of the close of business on the record date. We will make all payments of principal by check or wire transfer at the office of the trustee in the contiguous United States and/or at other offices that may be specified in the indenture or a notice to holders against surrender of the Note.
Payment When Offices Are Closed
If any payment is due on the Notes on a day that is not a business day, we will make the payment on the next day that is a business day. Payments made on the next business day in this situation will be treated under the indenture as if they were made on the original due date. Such payment will not result in a default under the Notes or the indenture, and no interest will accrue on the payment amount from the original due date to the next day that is a business day.
Book-entry and other indirect holders should consult their banks or brokers for information on how they will receive payments on the Notes.
170
Form, Exchange and Transfer of Certificated Registered Securities
Notes in physical, certificated form will be issued and delivered to each person that DTC identifies as a beneficial owner of the related Notes only if:
•DTC notified us at any time that it is unwilling or unable to continue as depositary for the Global Notes;
•DTC ceases to be registered as a clearing agency under the Securities Exchange Act of 1934, as amended; or
•an Event of Default with respect to such Global Note has occurred and is continuing.
Holders may exchange their certificated securities for Notes of smaller denominations or combined into fewer Notes of larger denominations, as long as the total principal amount is not changed and as long as the denomination is equal to or greater than $25.
Holders may exchange or transfer their certificated securities at the office of the trustee. We have appointed the trustee to act as our agent for registering the Notes in the name of holders transferring Notes. We may at any time designate additional transfer agents or rescind the designation of any transfer agent or approve a change in the office through which any transfer agent acts.
Holders will not be required to pay a service charge for any registration of transfer or exchange of their certificated securities, but they may be required to pay any tax or other governmental charge associated with the registration of transfer or exchange. The transfer or exchange will be made only if our transfer agent is satisfied with the holder’s proof of legal ownership.
If we redeem any of the Notes, we may block the transfer or exchange of those Notes selected for redemption during the period beginning 15 days before the day we deliver the notice of redemption and ending on the day of such delivery, in order to determine or fix the list of holders. We may also refuse to register transfers or exchanges of any certificated Notes selected for redemption, except that we will continue to permit transfers and exchanges of the unredeemed portion of any Note that will be partially redeemed.
About the Trustee
U.S. Bank Trust Company, National Association will be the trustee under the indenture and will be the principal paying agent and registrar for the Notes. The trustee may resign or be removed with respect to the Notes provided that a successor trustee is appointed to act with respect to the Notes.
171
DESCRIPTION OF OTHER INDEBTEDNESS
MLC US Holdings Credit Facility
On August 20, 2021, MLC US Holdings LLC (“MLC US Holdings”) entered into the Credit Agreement. On September 19, 2022, MLC US Holdings entered into an amendment to the Credit Agreement to increase the term loan available thereunder by $4.5 million. The primary use of the proceeds from the amendment was to seed Opportunistic Credit Interval Fund (“OCIF”), an interval fund managed by ML Management. On May 2, 2023, MLC US Holdings entered into an amendment to the Credit Agreement to increase the term loan available thereunder by an additional $4.5 million. The primary use of the proceeds from the most recent amendment was to finance the acquisition of Ovation on July 5, 2023, and other related fees and expenses. On December 17, 2024, MLC US Holdings entered into an amendment to upsize the Credit Facility by $13.0 million to support key business initiatives as well as for general corporate purposes and paying related transaction fees and expenses. The Credit Facility matures on August 20, 2027.
Amounts drawn under the Credit Facility initially bore interest at London Interbank Offer Rate (“LIBOR”) plus a spread of 7.50%. The benchmark, LIBOR, was replaced by the secured overnight financing rate (“SOFR”) upon the transition from LIBOR on May 2, 2023. Upon the most recent amendment, the Credit Facility bears interest based on a pricing step-down mechanism, starting from SOFR plus a spread of 7.50%, as the business continues to perform, which is expected to reduce our cost of debt over time. Payments of principal and interest are made on each payment date, with the remaining principal amount outstanding and accrued but unpaid interest payable on August 20, 2027. The Credit Facility is collateralized by assets held by MLC US Holdings. We are a guarantor of the Credit Facility. As of September 30, 2025, $38.0 million of borrowings were outstanding under the Credit Facility.
Seller notes
On October 29, 2021, Legacy MLC completed its acquisition of Ability through in part the issuance of an unsecured promissory note of $15.0 million, which bears interest at 5.0% per annum and is payable by October 29, 2031.
Debentures
In January 2024, Legacy MLC raised $18.8 million of new debt through the issuance of 18,752 Debenture Units on a non-brokered private placement basis (the “Debenture Unit Offering”). Each Debenture Unit consisted of: (i) one 8.85% paid-in-kind unsecured debenture of Mount Logan in the principal amount of $1,000, maturing on the date that is eight (8) years from the issuance thereof, and (ii) 50 common share purchase warrants of Legacy MLC, each of which is currently exercisable to acquire one common share of Mount Logan at a price of C$11.61 per share for a period of eight (8) years from the issuance thereof.
172
UNDERWRITING (CONFLICTS OF INTEREST)
Subject to the terms and conditions set forth in an underwriting agreement dated , 2026 between us and Lucid Capital Markets, LLC, acting as representative of the underwriters in this offering (the “Representative”), we have agreed to sell to the underwriters, and the underwriters have agreed to purchase from us, $40,000,000 aggregate principal amount of Notes indicated in the table below:
Underwriters | Principal Amount of Notes | |||||||
Lucid Capital Markets, LLC | ||||||||
Piper Sandler & Co. | ||||||||
BC Partners Securities LLC | ||||||||
Canaccord Genuity LLC | ||||||||
William Blair & Company, L.L.C. | ||||||||
Wedbush Securities Inc. | ||||||||
Total | $ | 40,000,000 | ||||||
Subject to the terms and conditions set forth in the underwriting agreement, the underwriters have agreed, severally and not jointly, to purchase all of the Notes sold under the underwriting agreement. The underwriting agreement provides that the obligations of the underwriters are subject to certain conditions precedent such as the receipt by the underwriters of officers’ certificates and legal opinions. If an underwriter defaults, the underwriting agreement provides that, under certain circumstances, the purchase commitments of the non-defaulting underwriters may be increased or the underwriting agreement may be terminated. We have agreed to indemnify the underwriters and their respective directors, officers, employees, agents, affiliates, and certain of their controlling persons against certain liabilities, including, among other things, liabilities under the Securities Act, or to contribute to payments an underwriter may be required to make in respect of those liabilities.
The underwriters are offering the Notes, subject to their acceptance of the Notes from us and subject to prior sale. The underwriters reserve the right to withdraw, cancel or modify offers to the public and to reject orders in whole or in part.
The Notes will be issued in book-entry form through the facilities of DTC for the accounts of its participants, including Clearstream and Euroclear, and will trade in DTC’s same day funds settlement system. Beneficial interests in Notes held in book-entry form will not be entitled to receive physical delivery of certificated Notes, except in certain limited circumstances.
Commissions and Expenses
The underwriters have advised us that they propose to offer the Notes to the public at the public offering price set forth on the cover page of this prospectus and to certain dealers at a price less a concession not in excess of $ per Note. The underwriters may allow, and the dealers may reallow, a discount from the concession not in excess of $ per Note to certain broker dealers. After the initial public offering, the public offering price, concessions and reallowance to dealers may be changed. No such reduction will change the amount of proceeds to be received by us as set forth on the cover page of this prospectus.
173
The following table shows the public offering price, the underwriting discounts and commissions that we are to pay to the underwriters and the proceeds, before expenses, to us in connection with this offering. The information assumes either no exercise or full exercise of the underwriters’ option to purchase additional Notes.
Per Note | Without Option | With Full Option | ||||||||||||||||||
Public Offering Price | $ | $ | $ | |||||||||||||||||
Underwriting Discounts and Commissions | $ | $ | $ | |||||||||||||||||
Estimated proceeds to us, before expenses | $ | $ | $ | |||||||||||||||||
We estimate expenses payable by us in connection with this offering (including up to $ in fees and expenses of the underwriters, and up to $ in reimbursement of the underwriters’ counsel fees in connection with the review of the terms of this offering by the Financial Industry Regulatory Authority), other than the underwriting commissions referred to above, will be approximately $ .
Determination of Offering Price
The public offering price for the Notes will be determined by negotiations between us and the underwriters. Among the factors to be considered in these negotiations will be prevailing market conditions, our financial information, market valuations of other companies that we and the underwriters believe to be comparable to us, estimates of our business potential, the present state of our development and other factors deemed relevant.
We offer no assurances that the public offering price will correspond to the price at which the Notes will trade in the public market subsequent to the offering or that an active trading market for the Notes will develop and continue after the offering.
Listing
We intend to apply to list the Notes on The Nasdaq Global Market under the trading symbol “MLCIL,” and if the application is approved, we expect trading in the Notes on The Nasdaq Global Market to begin within 30 days of the original issue date. The Notes are expected to trade “flat,” which means that purchasers will not pay, and sellers will not receive, any accrued and unpaid interest on the Notes that is not included in the trading price. Currently, there is no public market for the Notes.
Option to Purchase Additional Notes
We have granted to the underwriters an option, exercisable, in whole or from time to time in part, for 30 days from the date of this prospectus, to purchase up to an additional $6,000,000 aggregate principal amount of the Notes, to cover overallotments, if any, at the public offering price set forth on the cover of this prospectus less sales discounts and commissions. If any Notes are purchased pursuant to the Option, the underwriters will, severally but not jointly, purchase the Notes in approximately the same proportions as set forth in the above table.
No Sales of Similar Securities
We have agreed not to directly or indirectly, offer, pledge, sell, contract to sell, grant any option to purchase, make any short sale or otherwise transfer or dispose of any securities issued or guaranteed by Mount Logan substantially similar to the Notes, including but not limited to $25 par notes, preferred stock, debt securities, any options or warrants to purchase debt securities or any securities convertible into or exercisable or exchangeable for debt securities or substantially similar securities issued or guaranteed by Mount Logan or file any registration statement under the Securities Act with respect to any of the foregoing for a period of 30 days after the date of this prospectus without first obtaining the written consent of the Representative.
In addition, we have agreed not to, for the period between the date of execution and delivery of the underwriting agreement and the closing date for the sale of the Notes, without the prior written consent of the Representative, offer, sell, contract to sell, pledge, otherwise dispose of, or enter into any transaction which is designed to, or might reasonably be expected to, result in the disposition (whether by actual disposition or effective economic disposition due to cash settlement or otherwise) by us or any affiliate of us or any person in privity with us
174
or any affiliate of us, directly or indirectly, or announce the offering, of any debt securities issued or guaranteed by the us (other than the Notes).
Stabilization
The underwriters have advised us that, pursuant to Regulation M under the Exchange Act, certain persons participating in the offering may engage in transactions including over-allotment, covering transactions and stabilizing transactions, which may have the effect of stabilizing or maintaining the market price of the Notes at a level above that which might otherwise prevail in the open market. Over-allotment involves syndicate sales of securities in excess of the aggregate principal amount of securities to be purchased by the underwriters in the offering, which creates a short position for the underwriters. Covering transactions involve purchases of the securities in the open market after the distribution has been completed in order to cover short positions.
A stabilizing bid is a bid for the purchase of Notes on behalf of the underwriters for the purpose of fixing or maintaining the price of the Notes. A syndicate covering transaction is the bid for or the purchase of Notes on behalf of the underwriters to reduce a short position incurred by the underwriters in connection with the offering. Similar to other purchase transactions, the underwriters’ purchases to cover the syndicate short sales may have the effect of raising or maintaining the market price of our Notes or preventing or retarding a decline in the market price of our Notes. As a result, the price of our Notes may be higher than the price that might otherwise exist in the open market.
The underwriters also may impose a penalty bid. This occurs when a particular underwriter repays to the underwriters a portion of the underwriting discount received by it because the representative has repurchased Notes sold by or for the account of such underwriter in stabilizing or short covering transactions.
Neither we, nor the underwriters make any representation or prediction as to the direction or magnitude of any effect that the transactions described above may have on the price of the Notes. The underwriters are not obligated to engage in these activities and, if commenced, any of the activities may be discontinued at any time.
Electronic Offer, Sale and Distributions of Notes
This prospectus in electronic format may be made available on websites maintained by one or more of the underwriters, and the underwriters may distribute the prospectus electronically.
Other than this prospectus in electronic format, the information on any underwriter’s or any selling group member’s website and any information contained in any other website maintained by an underwriter or any selling group member is not part of this prospectus or the registration statement of which this prospectus forms a part, has not been approved and/or endorsed by us or any underwriter or any selling group member in its capacity as underwriter or selling group member and should not be relied upon by investors.
Conflicts of Interest
BC Partners Securities LLC, an affiliate of BCPA, is a broker-dealer and member of FINRA and will participate as an underwriter in this offering. An affiliate of BCPA holds a minority equity investment in us. Additionally, certain members of our management team serve as senior management of BCPA, including Edward Goldthorpe, our Chief Executive Officer and a member of our board of directors. We are also a party to the BCPA Arrangements, pursuant to which BCPA or its affiliates provide certain services to us. For more information on the relationship between us and BCPA, see “Certain Relationships and Related Person Transactions.”
Despite the conflict of interest, no “qualified independent underwriter” is required because (i) the underwriter primarily responsible for managing the public offering does not have a conflict of interest, is not an affiliate of any underwriter that does have a conflict of interest and meets the requirements of FINRA Rule 5121(f)(12)(E), and (ii) the securities offered are “investment grade rated” (as defined in FINRA Rule 5121).
Other Relationships
Certain of the underwriters and their affiliates have provided in the past and may provide from time to time in the future in the ordinary course of their business certain sales and trading, financial advisory, commercial and
175
investment banking, investment research, principal investment, hedging, market making, brokerage and other financial and non-financial activities and services to us, our portfolio companies or our affiliates or others for which they have received or will be entitled to receive separate fees.
In the ordinary course of their various business activities, the underwriters and their affiliates may make or hold a broad array of investments and actively trade debt and equity securities (or related derivative securities) and financial instruments (including bank loans) for their own account and for the accounts of their customers. Such investments and securities activities may involve securities and/or instruments of ours or our affiliates. The underwriters and their affiliates that may have a lending relationship with us may routinely hedge their credit exposure to us consistent with their customary risk management policies. Typically, such underwriters and their affiliates would hedge such exposure by entering into transactions that consist of either the purchase of credit default swaps or the creation of short positions in our securities, including potentially the Notes offered hereby. Any such short positions could adversely affect future trading prices of the Notes offered hereby. The underwriters and their affiliates may also make investment recommendations and/or publish or express independent research views in respect of such securities or financial instruments and may hold, or recommend to clients that they acquire, long and/or short positions in such securities and instruments.
Other Jurisdictions
The Notes offered by this prospectus may not be offered or sold, directly or indirectly, nor may this prospectus or any other offering material or advertisements in connection with the offer and sale of any such Notes be distributed or published in any jurisdiction, except under circumstances that will result in compliance with the applicable rules and regulations of that jurisdiction. Persons into whose possession this prospectus comes are advised to inform themselves about and to observe any restriction relating to the offering and the distribution of this prospectus. This prospectus does not constitute an offer to sell or a solicitation of an offer to buy the Notes offered by this prospectus in any jurisdiction in which such an offer or a solicitation is unlawful.
176
CERTAIN UNITED STATES FEDERAL INCOME TAX CONSIDERATIONS
The following is a summary of certain U.S. federal income tax considerations of the acquisition, ownership, and disposition of the Notes that we are offering. The following discussion is not exhaustive of all possible tax considerations. This summary is based upon the Internal Revenue Code of 1986, as amended (the “Code”), U.S. Treasury Department (the “U.S. Treasury”) regulations (including proposed and temporary regulations), rulings, current administrative interpretations and official pronouncements of the Internal Revenue Service (the “IRS”), and judicial decisions, all as currently in effect and all of which are subject to differing interpretations or to change, possibly with retroactive effect. No rulings have been sought or are expected to be sought from the IRS and no assurance can be given that the IRS would not assert, or that a court would not sustain, a position contrary to any of the tax consequences described below. There can be no assurance that a change in law will not alter significantly the tax considerations described in this summary discussion.
This summary is for general information only, and does not purport to discuss all aspects of U.S. federal income taxation that may be important to a particular beneficial owner (referred to in this summary as a “holder”) in light of its investment or tax circumstances or to holders subject to special tax rules, such as partnerships, subchapter S corporations or other pass-through entities (and, in each case, the owners of such pass-through entities), any government (or instrumentality or agency thereof), banks, financial institutions, tax-exempt entities, retirement plans, insurance companies, regulated investment companies, real estate investment trusts, “controlled foreign corporations” and “passive foreign investment companies” and shareholders of such corporations, trusts and estates, certain former citizens or residents of the United States, part-year non-resident aliens, holders of equity in Mount Logan, dealers or traders in securities, currencies or notional principal contracts, holders who mark their securities to market for federal income tax purposes, persons holding the Notes as part of an integrated investment, including a “straddle,” “hedge,” “constructive sale,” or “conversion transaction,” persons (other than Non-U.S. Holders (as defined below)) whose functional currency for tax purposes is not the U.S. dollar, and persons subject to the alternative minimum tax provisions of the Code. This summary does not include any description of any tax treaty or the tax laws of any state or local governments, or of any foreign government, that may be applicable to a particular holder nor does it discuss any U.S. federal tax consequences other than U.S. federal income tax consequences (such as U.S. federal estate or gift tax consequences). Furthermore, this summary does not address the tax consequences to any shareholder, beneficiary or other owner of an interest in a holder of Notes.
This summary is directed solely to beneficial owners that will purchase the Notes offered in this prospectus at the price printed on the front cover of this prospectus and that will hold such Notes as capital assets within the meaning of Section 1221 of the Code, which generally means as property held for investment.
You should consult your tax advisor concerning the U.S. federal income and estate tax consequences to you of acquiring, owning and disposing of the Notes, as well as any tax consequences arising under the laws of any state, local, foreign, or other tax jurisdiction and the possible effects of changes in U.S. federal or other tax laws.
As used in this prospectus, the term “U.S. Holder” means a beneficial owner of a Note offered in this prospectus that is for U.S. federal income tax purposes:
•An individual who is a citizen or resident of the United States;
•a corporation (including an entity treated as a corporation for U.S. federal income tax purposes) created or organized in or under the laws of the United States or of any state of the United States or the District of Columbia;
•an estate, the income of which is subject to U.S. federal income taxation regardless of its source; or
•a trust if (i) a court within the United States is able to exercise primary supervision over the administration of the trust and one or more U.S. persons have the authority to control all substantial decisions of the trust or (ii) it has a valid election in effect under applicable U.S. Treasury regulations to be treated as a “United States person.”
177
If an entity or arrangement treated as a partnership (or other flow-through entity) for U.S. federal income tax purposes holds the Notes offered in this prospectus, the U.S. federal income tax treatment of a partner (or other owner of the entity or arrangement) generally will depend upon the status of the partner (or other owner) and the activities of the partnership, and accordingly, this summary does not apply to partnerships (or other flow-through entities). A partner (or other owner) of a partnership (or other flow-through entity) holding the Notes should consult its tax advisor regarding the U.S. federal income tax consequences of the acquisition, ownership and disposition by the partnership of the Notes.
U.S. Holders
Payment of Interest. Interest on a Note generally will be included in the income of a U.S. Holder as ordinary interest income at the time it is accrued or is received in accordance with the U.S. Holder’s regular method of accounting for U.S. federal income tax purposes.
Sale, Exchange, or Retirement of the Notes. Upon the sale, exchange, retirement, or other taxable disposition of the Notes, a U.S. Holder will recognize gain or loss equal to the difference between the amount realized upon the sale, exchange, retirement, or other taxable disposition and the U.S. Holder’s adjusted tax basis in the Note. A U.S. Holder’s adjusted tax basis in a Note generally will be the cost of the Note to such U.S. Holder. Gain or loss realized on the sale, exchange, retirement, or other taxable disposition of the Notes generally will be capital gain or loss and will be long-term capital gain or loss if the Note has been held for more than one year. Long term capital gains of non-corporate U.S. Holders are generally subject to preferential rates of U.S. federal income taxation. The deductibility of capital losses is subject to limitations under the Code. Any amount attributable to accrued but unpaid interest will be treated as a payment of interest and taxed in the manner described above under “Payment of Interest.”
Additional Medicare Tax on Unearned Income. A tax of 3.8% is imposed on “net investment income” (or “undistributed net investment income”, in the case of estates and trusts) received by certain individuals, trusts and estates with adjusted gross income above certain threshold amounts. “Net investment income” as defined for United States federal Medicare contribution purposes generally includes interest payments on and gain recognized from the sale or other disposition of the Notes not held in a trade or business, other than a trade or business that consists of certain passive or trading activities, reduced by permitted deductions properly allocable to the income or gain. U.S. Holders should consult their own tax advisors regarding the effect, if any, of this tax on their ownership and disposition of the Notes.
Non-U.S. Holders
This discussion applies to you if you are a “Non-U.S. Holder.” A “Non-U.S. Holder” is a beneficial owner of a Note that is an individual, corporation, estate or trust (other than a grantor trust) for U.S. federal income tax purposes and that is not a U.S. Holder.
Payments of Interest. Subject to the discussions below concerning backup withholding and FATCA, interest payments that are received from us or our agent generally will not be subject to U.S. federal income or withholding tax if:
•a Non-U.S. Holder does not actually or constructively own 10% or more of our capital or profits interests within the meaning of 871(h)(3) of the Code;
•a Non-U.S. Holder is not a “controlled foreign corporation” for U.S. federal income tax purposes that is related to us (directly or indirectly) through ownership;
•a Non-U.S. Holder is not a bank extending credit under a loan agreement in the ordinary course of its trade or business;
•the Non-U.S. Holder satisfies the certification requirements described below; and
•such interest is not effectively connected with the conduct of a trade or business in the United States by a Non-U.S. Holder.
178
A Non-U.S. Holder generally will satisfy the certification requirements if either: (1) the Non-U.S. Holder certifies to the applicable withholding agent, under penalties of perjury, that it is a non-United States person and provides its name, address and U.S. taxpayer identification number, if any (which certification may generally be made on an IRS Form W-8BEN or W-8BEN-E, or a successor form), or (2) a securities clearing organization, bank, or other financial institution that holds customer securities in the ordinary course of its trade or business (a “financial institution”) and holds the Notes certifies to the applicable withholding agent under penalties of perjury that it has received the required statement from the Non-U.S. Holder certifying that it is a non-United States person and furnishes the applicable withholding agent with a copy of the statement.
Except as described below under “— Effectively Connected Income,” a Non-U.S. Holder that does not qualify for exemption from withholding as described above generally will be subject to withholding of U.S. federal income tax at a rate of 30% on payments of interest on the Notes. Payments not meeting the requirements for the exemption set forth above and thus subject to withholding of U.S. federal income tax may nevertheless be exempt from withholding (or subject to withholding at a reduced rate) if the Non-U.S. Holder provides us with a properly executed IRS Form W-8BEN or W-8BEN-E (or successor form) claiming an exemption from, or reduction in, withholding under the benefit of a tax treaty and complies with any other applicable procedures. We will not pay any additional amounts to U.S. Holders or Non-U.S. Holders in respect of any amounts withheld under applicable law.
Sale, Exchange, or Retirement of the Notes. Subject to the discussions below concerning backup withholding and FATCA, a Non-U.S. Holder generally will not be subject to U.S. federal income or withholding tax on any capital gain realized on the sale, exchange, retirement, or other taxable disposition of the Notes unless (1) the gain is effectively connected with the conduct of a trade or business within the United States, or a permanent establishment maintained in the United States if certain tax treaties apply and (2) in the case of a Non-U.S. Holder that is an individual, the Non-U.S. Holder is present in the United States for 183 days or more in the taxable year of the sale, exchange, or other disposition of the Notes and certain other conditions are met. An individual Non-U.S. Holder who is present in the United States for 183 days or more in the taxable year of sale, exchange, or other disposition of a Note, if certain other conditions are met, will be subject to U.S. federal income tax at a rate of 30% on the gain realized on the sale, exchange, or other taxable disposition of such Note, subject to the reduction of such gain by such Non-U.S. Holder’s capital losses from U.S. sources.
Effectively Connected Income. If a Non-U.S. Holder of a Note is engaged in the conduct of a trade or business within the United States and if interest on a Note, or gain realized on the sale, exchange, or other taxable disposition of the Note, is effectively connected with the conduct of such trade or business (or, if certain tax treaties apply, is attributable to a permanent establishment maintained by the Non-U.S. Holder in the United States), the Non-U.S. Holder, although exempt from U.S. federal withholding tax (provided that the certification requirements discussed above are satisfied), generally will be subject to regular U.S. federal income tax on such interest or gain on a net income basis in the same manner as if it were a U.S. Holder (unless an applicable treaty provides otherwise). In addition, if any such Non-U.S. Holder is a foreign corporation, it may also be subject to a branch profits tax equal to 30% (or such lower rate provided by an applicable U.S. income tax treaty) of a portion of its earnings and profits for the taxable year that are effectively connected with its conduct of a trade or business in the United States, subject to certain adjustments.
Backup Withholding and Information Reporting
In general, in the case of a U.S. Holder, other than certain exempt holders, we and other payors are required to report to the IRS all payments of principal and interest on the Notes. In addition, we and other payors generally are required to report to the IRS any payment of proceeds of the sale of a Note before maturity. Additionally, backup withholding generally will apply to any payments unless a U.S. Holder furnishes a correct taxpayer identification number (which for an individual is generally the individual’s Social Security Number) and certifies on an IRS Form W-9, under penalties of perjury, that the U.S. Holder is not subject to backup withholding and otherwise complies with applicable requirements of the backup withholding rules or such U.S. Holder otherwise establishes an exemption.
The amount of interest we pay to a Non-U.S. Holder on the Notes generally will be reported to the Non-U.S. Holder and to the IRS annually even if the Non-U.S. Holder is exempt from the 30% withholding tax described
179
above. Copies of the information returns reporting those payments and the amounts withheld may also be made available to the tax authorities in the country where the Non-U.S. Holder is resident under provisions of an applicable income tax treaty or agreement. In the case of a Non-U.S. Holder, backup withholding and certain other information reporting will not apply to payments made if the Non-U.S. Holder provides the required certification that it is not a United States person, or the Non-U.S. Holder otherwise establishes an exemption, provided that the payor or withholding agent does not have actual knowledge or reason to know that the holder is a United States person, or that the conditions of any exemption are not satisfied. Information reporting and, depending on the circumstances, backup withholding generally will apply to the proceeds of a disposition of the Notes effected within the United States or through certain U.S.-related financial intermediaries by a Non-U.S. Holder, unless the Non-U.S. Holder certifies under penalties of perjury that it is not a United States person (and certain other conditions are met) or otherwise establishes an exemption from such requirements.
Any amounts withheld under the backup withholding rules will be allowed as a refund or a credit against a holder’s U.S. federal income tax liability provided the required information is timely furnished to the IRS.
Foreign Account Tax Compliance Act
Sections 1471 through 1474 of the Code and related Treasury guidance (collectively referred to as “FATCA”) generally impose U.S. federal withholding tax at a rate of 30% on payments to certain foreign entities of (i) U.S.-source interest (including interest paid on the Notes) and (ii) the gross proceeds from the sale or other disposition after December 31, 2018 of an obligation that produces U.S.-source interest (including a disposition of the Notes), in each case, unless various information reporting, diligence and withholding requirements are satisfied. This 30% U.S. federal withholding tax would generally apply in the case of debt obligations held through intermediaries that do not satisfy such information reporting requirements. Accordingly, the entity through which a U.S. Holder or a Non-U.S. Holder holds its Notes will affect the determination of whether such withholding is required. We will not pay any additional amounts to U.S. Holders or Non-U.S. Holders in respect of any amounts withheld under FATCA. Foreign entities located in jurisdictions that have entered into an intergovernmental agreement with the U.S. governing FATCA may be subject to different rules. U.S. Holders that own their interests in a Note through a foreign entity or intermediary, and Non-U.S. Holders, are encouraged to consult their tax advisors regarding FATCA.
The U.S. federal income tax discussion set forth above is included for general information only and may not be applicable depending upon a holder’s particular situation. You should consult your tax advisors with respect to the tax consequences to you of the acquisition, ownership and disposition of the Notes, including the tax consequences under state, local, foreign and other tax laws and the possible effects of changes in U.S. federal or other tax laws.
180
CERTAIN ERISA CONSIDERATIONS
A fiduciary of a pension, profit-sharing or other employee benefit plan subject to the U.S. Employee Retirement Income Security Act of 1974, as amended (“ERISA”) (each, an “ERISA Plan”), should consider the fiduciary standards of ERISA in the context of the ERISA Plan’s particular circumstances before authorizing an investment in Notes. Among other factors, the fiduciary should consider whether the investment would satisfy the prudence and diversification requirements of ERISA and would be consistent with the documents and instruments governing the ERISA Plan, and whether the investment would involve a prohibited transaction under Section 406 of ERISA or Section 4975 of the Internal Revenue Code.
Section 406 of ERISA and Section 4975 of the Internal Revenue Code prohibit ERISA Plans, as well as individual retirement accounts, Keogh plans and other plans that are subject to Section 4975 of the Internal Revenue Code (collectively with ERISA Plans, “Plans”), from engaging in certain transactions involving “plan assets” with persons who are “parties in interest” under ERISA or “disqualified persons” under the Internal Revenue Code with respect to the Plan. A violation of these prohibited transaction rules may result in excise tax or other liabilities under ERISA or the Internal Revenue Code for those persons and in penalties and liabilities under ERISA and the Internal Revenue Code for the fiduciary of the Plan, unless exemptive relief is available under an applicable statutory, regulatory or administrative exemption. Employee benefit plans that are governmental plans (as defined in Section 3(32) of ERISA), certain church plans (as defined in Section 3(33) of ERISA) and non-U.S. plans (as described in Section 4(b)(4) of ERISA) (“Non-ERISA Arrangements”) are not subject to the requirements of Section 406 of ERISA or Section 4975 of the Internal Revenue Code, but may be subject to similar provisions under other applicable federal, state, local, non-U.S. or other laws (“Similar Laws”).
The acquisition, holding or disposition of Notes by a Plan or any entity whose underlying assets include “plan assets” by reason of any Plan’s investment in the entity (a “Plan Asset Entity”) with respect to which we, certain of our affiliates or the agents are or become a party in interest or a disqualified person may result in a direct or indirect prohibited transaction under Section 406 of ERISA or Section 4975 of the Internal Revenue Code, unless the Notes is acquired pursuant to an applicable exemption. The U.S. Department of Labor has issued prohibited transaction class exemptions, or “PTCEs”, that may provide exemptive relief if required for direct or indirect prohibited transactions that may arise from the purchase of the Notes. These exemptions include, without limitation, PTCE 84-14 (for certain transactions determined by independent qualified professional asset managers), PTCE 90-1 (for certain transactions involving insurance company pooled separate accounts), PTCE 91-38 (for certain transactions involving bank collective investment funds), PTCE 95-60 (for transactions involving certain insurance company general accounts), and PTCE 96-23 (for transactions managed by in-house asset managers). In addition, Section 408(b)(17) of ERISA and Section 4975(d)(20) of the Internal Revenue Code provide limited relief from the prohibited transactions provisions of ERISA and Section 4975 of the Internal Revenue Code for certain transactions, provided that neither we nor any of our affiliates (directly or indirectly) have or exercise any discretionary authority or control or render any investment advice with respect to the assets of any Plan involved in the transaction, and provided further that the Plan pays no more and receives no less than “adequate consideration” in connection with the transaction. There can be no assurance that all of the conditions of any such exemptions will be satisfied.
Because of the foregoing, the Notes should not be acquired or held by any person investing “plan assets” of any Plan, Plan Asset Entity or Non-ERISA Arrangement, unless such acquisition and holding will not constitute a non-exempt prohibited transaction under ERISA and the Internal Revenue Code or similar violation of any applicable Similar Laws.
Any purchaser or transferee of the Notes or any interest therein will be deemed to have represented and warranted by its acquisition of such Notes that it either (1) is not a Plan, a Plan Asset Entity or a Non-ERISA Arrangement and is not purchasing or holding such Notes on behalf of or with the assets of any Plan, Plan Asset Entity or Non-ERISA Arrangement or (2) the acquisition and holding of such Notes will not constitute a non-exempt prohibited transaction under Section 406 of ERISA or Section 4975 of the Internal Revenue Code because of an available administrative or statutory exemption, all of the conditions of which are satisfied, or a similar violation of any applicable Similar Laws.
181
LEGAL MATTERS
Certain legal matters regarding the securities offered hereby have been passed upon for us by Dechert LLP, New York, New York.
Certain legal matters in connection with this offering will be passed upon for the underwriters by Holland & Knight LLP, Miami, Florida.
EXPERTS
The consolidated financial statements of Legacy MLC as of December 31, 2024 and 2023 and for each of the two years in the period ended December 31, 2024 included in this prospectus and the registration statement of which this prospectus forms a part have been audited by Deloitte & Touche LLP, an independent registered public accounting firm, as stated in their report. Such consolidated financial statements are included in reliance upon the report of such firm given their authority as experts in accounting and auditing.
The consolidated financial statements of 180 Degree Capital as of December 31, 2024 and 2023 and for each of the two years in the period ended December 31, 2024 included in this prospectus and the registration statement of which this prospectus forms a part have been audited by EisnerAmper LLP, an independent registered public accounting firm, as stated in their report. Such consolidated financial statements are included in reliance upon the report of such firm given their authority as experts in accounting and auditing.
The consolidated financial statements of Yukon New Parent, Inc. (renamed Mount Logan Capital Inc. on September 12, 2025) as of June 30, 2025 and for the period from January 7, 2025 to June 30, 2025 included in this prospectus and the registration statement of which this prospectus forms a part have been audited by EisnerAmper LLP, an independent registered public accounting firm, as stated in their report. Such consolidated financial statements are included in reliance upon the report of such firm given their authority as experts in accounting and auditing.
182
INDEX TO FINANCIAL STATEMENTS
MOUNT LOGAN CAPITAL INC.
| Page No. | ||||||||
| Audited Consolidated Financial Statements | ||||||||
| Unaudited Consolidated Financial Statements | ||||||||
180 DEGREE CAPITAL CORP.
| Page No. | ||||||||
| 2024 Audited Consolidated Financial Statements | ||||||||
F-1
| Page No. | ||||||||
| 2023 Audited Consolidated Financial Statements | ||||||||
| Unaudited Consolidated Financial Statements | ||||||||
YUKON NEW PARENT, INC.
| Page No. | ||||||||
| Audited Consolidated Financial Statements | ||||||||
F-2


INDEPENDENT AUDITOR’S REPORT
To the Shareholders and Board of Directors of
Mount Logan Capital Inc.
Opinion
We have audited the consolidated financial statements of Mount Logan Capital Inc. (“MLC” or the “Company”), which comprise the consolidated statements of financial position as of December 31, 2024 and 2023, and the related consolidated statements of operations, comprehensive income (loss), changes in equity, and cash flows for the years then ended, and the related notes to the consolidated financial statements and Schedule 1: Summary of Investments – Other Than Investments in Related Parties listed in the Index (collectively referred to as the ”financial statements”).
In our opinion, the accompanying financial statements present fairly, in all material respects, the financial position of the Company as of December 31, 2024 and 2023, and the results of its operations and its cash flows for the years then ended in accordance with accounting principles generally accepted in the United States of America.
Basis for Opinion
We conducted our audits in accordance with auditing standards generally accepted in the United States of America (GAAS). Our responsibilities under those standards are further described in the Auditor’s Responsibilities for the Audit of the Financial Statements section of our report. We are required to be independent of the Company and to meet our other ethical responsibilities, in accordance with the relevant ethical requirements relating to our audits. We believe that the audit evidence we have obtained is sufficient and appropriate to provide a basis for our audit opinion.
Responsibilities of Management for the Financial Statements
Management is responsible for the preparation and fair presentation of the financial statements in accordance with accounting principles generally accepted in the United States of America, and for the design, implementation, and maintenance of internal control relevant to the preparation and fair presentation of financial statements that are free from material misstatement, whether due to fraud or error.
In preparing the financial statements, management is required to evaluate whether there are conditions or events, considered in the aggregate, that raise substantial doubt about the Company’s ability to continue as a going concern for one year after the date that the financial statements are issued.
Auditor’s Responsibilities for the Audit of the Financial Statements
Our objectives are to obtain reasonable assurance about whether the financial statements as a whole are free from material misstatement, whether due to fraud or error, and to issue an auditor’s report that includes our opinion. Reasonable assurance is a high level of assurance but is not absolute assurance and therefore is not a guarantee that an audit conducted in accordance with GAAS will always detect a material misstatement when it exists. The risk of not detecting a material misstatement resulting from fraud is higher than for one resulting from error, as fraud may involve collusion, forgery, intentional omissions, misrepresentations, or the override of internal control.
F-3
Misstatements are considered material if there is a substantial likelihood that, individually or in the aggregate, they would influence the judgment made by a reasonable user based on the financial statements.
In performing an audit in accordance with GAAS, we:
•Exercise professional judgment and maintain professional skepticism throughout the audit.
•Identify and assess the risks of material misstatement of the financial statements, whether due to fraud or error, and design and perform audit procedures responsive to those risks. Such procedures include examining, on a test basis, evidence regarding the amounts and disclosures in the financial statements.
•Obtain an understanding of internal control relevant to the audit in order to design audit procedures that are appropriate in the circumstances, but not for the purpose of expressing an opinion on the effectiveness of the Company’s internal control. Accordingly, no such opinion is expressed.
•Evaluate the appropriateness of accounting policies used and the reasonableness of significant accounting estimates made by management, as well as evaluate the overall presentation of the financial statements.
•Conclude whether, in our judgment, there are conditions or events, considered in the aggregate, that raise substantial doubt about the Company’s ability to continue as a going concern for a reasonable period of time.
We are required to communicate with those charged with governance regarding, among other matters, the planned scope and timing of the audit, significant audit findings, and certain internal control-related matters that we identified during the audit.
/s/ Deloitte & Touche LLP
May 5, 2025
F-4
MOUNT LOGAN CAPITAL INC.
CONSOLIDATED STATEMENTS OF FINANCIAL POSITION
| (in thousands, except per share data) | December 31, 2024 | December 31, 2023 | ||||||||||||
| ASSETS | ||||||||||||||
| Asset Management | ||||||||||||||
| Cash and cash equivalents | $ | $ | ||||||||||||
Investments (including related party amounts of $ | ||||||||||||||
| Intangible assets | ||||||||||||||
Other assets (including related party amounts of $ | ||||||||||||||
| Insurance Solutions | ||||||||||||||
| Cash and cash equivalents | ||||||||||||||
| Restricted cash | ||||||||||||||
Investments (including related party amounts of $ | ||||||||||||||
| Assets of consolidated variable interest entities | ||||||||||||||
| Cash and cash equivalents | ||||||||||||||
| Investments | ||||||||||||||
| Other assets | ||||||||||||||
| Reinsurance recoverable | ||||||||||||||
| Intangible assets | ||||||||||||||
| Deferred acquisition costs | ||||||||||||||
| Goodwill | ||||||||||||||
| Other assets | ||||||||||||||
| Total assets | $ | $ | ||||||||||||
| LIABILITIES | ||||||||||||||
| Asset Management | ||||||||||||||
| Due to related parties | $ | $ | ||||||||||||
| Debt obligations | ||||||||||||||
| Accrued expenses and other liabilities | ||||||||||||||
| Insurance Solutions | ||||||||||||||
| Future policy benefits | ||||||||||||||
| Interest sensitive contract liabilities | ||||||||||||||
| Funds held under reinsurance contracts | ||||||||||||||
| Debt obligations | ||||||||||||||
| Derivatives | ||||||||||||||
| Accrued expenses and other liabilities | ||||||||||||||
| Total liabilities | ||||||||||||||
| Commitments and Contingencies (See Note 24) | ||||||||||||||
| EQUITY | ||||||||||||||
| Common shares | ||||||||||||||
| Warrants | ||||||||||||||
| Additional paid-in-capital | ||||||||||||||
| Retained earnings (accumulated deficit) | ( | ( | ||||||||||||
| Accumulated other comprehensive income (loss) | ||||||||||||||
| Total equity | ||||||||||||||
| Total liabilities and equity | $ | |||||||||||||
The accompanying notes are an integral part of these Consolidated Financial Statements.
F-5
MOUNT LOGAN CAPITAL INC.
CONSOLIDATED STATEMENTS OF OPERATIONS
| Year Ended | ||||||||||||||
| (in thousands, except per share data) | December 31, 2024 | December 31, 2023 | ||||||||||||
| REVENUES | ||||||||||||||
| Asset Management | ||||||||||||||
| Management fees | $ | $ | ||||||||||||
| Incentive fees | ||||||||||||||
| Equity investment earning | ||||||||||||||
| Insurance Solutions | ||||||||||||||
| Net premiums | ( | ( | ||||||||||||
| Product charges | ||||||||||||||
| Net investment income | ||||||||||||||
| Net gains (losses) from investment activities | ( | |||||||||||||
| Net revenues of consolidated variable interest entities | ||||||||||||||
| Net investment income (loss) on funds withheld | ( | ( | ||||||||||||
| Other income | ||||||||||||||
| Total revenues | ||||||||||||||
| EXPENSES | ||||||||||||||
| Asset Management | ||||||||||||||
| Administration and servicing fees | ||||||||||||||
| Transaction costs | ||||||||||||||
| Compensation and benefits | ||||||||||||||
| Amortization and impairment of intangible assets | ||||||||||||||
| Interest and other credit facility expenses | ||||||||||||||
| General, administrative and other | ||||||||||||||
| Insurance Solutions | ||||||||||||||
Net policy benefit and claims (remeasurement gain on policy liabilities of $ | ( | ( | ||||||||||||
| Interest sensitive contract benefits | ||||||||||||||
| Amortization of deferred acquisition costs | ||||||||||||||
| Compensation and benefits | ||||||||||||||
| Interest expense | ||||||||||||||
General, administrative and other (including related party amounts of $ | ||||||||||||||
| Total expenses | ||||||||||||||
| Investment and other income (loss) - Asset Management | ||||||||||||||
| Net gains (losses) from investment activities | ( | ( | ||||||||||||
| Dividend income | ||||||||||||||
| Interest income | ||||||||||||||
| Other income (loss), net | ||||||||||||||
| Net revenues of consolidated variable interest entities | ||||||||||||||
| Total investment and other income (loss) | ( | |||||||||||||
| Income (loss) before taxes | ( | ( | ||||||||||||
| Income tax (expense) benefit — Asset Management | ( | ( | ||||||||||||
| Net income (loss) | $ | ( | $ | ( | ||||||||||
| Earnings per share | ||||||||||||||
| Net income (loss) attributable to common shareholders - Basic and diluted | $ | ( | $ | ( | ||||||||||
| Weighted average shares outstanding – Basic and diluted | ||||||||||||||
The accompanying notes are an integral part of these Consolidated Financial Statements.
F-6
MOUNT LOGAN CAPITAL INC.
CONSOLIDATED STATEMENTS OF COMPREHENSIVE INCOME (LOSS)
| Year ended | |||||||||||
| (in thousands, except per share data) | December 31, 2024 | December 31, 2023 | |||||||||
| Net income (loss) | $ | ( | $ | ( | |||||||
| Other comprehensive income (loss), before tax: | |||||||||||
| Unrealized investment gains (losses) on available-for-sale securities | |||||||||||
| Unrealized gains (losses) on hedging instruments | ( | ||||||||||
| Remeasurement gains (losses) on future policy benefits related to discount rate | ( | ||||||||||
| Other comprehensive income (loss), before tax | ( | ||||||||||
| Income tax expense (benefit) related to other comprehensive income (loss) | |||||||||||
| Other comprehensive income (loss) | ( | ||||||||||
| Comprehensive income (loss) | $ | ( | $ | ( | |||||||
The accompanying notes are an integral part of these Consolidated Financial Statements.
F-7
MOUNT LOGAN CAPITAL INC.
CONSOLIDATED STATEMENTS OF CHANGES IN EQUITY
(in thousands, except for number of shares)
| Year ended December 31, 2024 | Number of Voting Common Shares | Common Shares | Warrants | Additional Paid in Capital | Retained Earnings (Accumulated Deficit) | Accumulated Other Comprehensive Income (loss) | Total Equity | |||||||||||||||||||||||||||||||||||||
| Balance at December 31, 2023 | $ | $ | $ | $ | ( | $ | $ | |||||||||||||||||||||||||||||||||||||
| Issuance of warrants | — | — | — | — | — | |||||||||||||||||||||||||||||||||||||||
| Equity based compensation | — | — | — | — | — | |||||||||||||||||||||||||||||||||||||||
| Restricted stock release | — | ( | — | — | ( | |||||||||||||||||||||||||||||||||||||||
| Shareholder dividends | — | — | — | — | ( | — | ( | |||||||||||||||||||||||||||||||||||||
| Net income (loss) | — | — | — | — | ( | — | ( | |||||||||||||||||||||||||||||||||||||
| Other comprehensive income (loss) | — | — | — | — | — | |||||||||||||||||||||||||||||||||||||||
| Balance at December 31, 2024 | $ | $ | $ | $ | ( | $ | $ | |||||||||||||||||||||||||||||||||||||
| Year ended December 31, 2023 | Number of Voting Common Shares | Common Shares | Warrants | Additional Paid in Capital | Retained Earnings (Accumulated Deficit) | Accumulated Other Comprehensive Income (Loss) | Total Equity | |||||||||||||||||||||||||||||||||||||
| Balance at December 31, 2022 | $ | $ | $ | $ | ( | $ | $ | |||||||||||||||||||||||||||||||||||||
| Share issuance for investment in fixed income asset manager | — | — | — | — | ||||||||||||||||||||||||||||||||||||||||
| Share issuance for Ovation acquisition | — | — | — | — | ||||||||||||||||||||||||||||||||||||||||
| Equity based compensation | — | — | — | — | — | |||||||||||||||||||||||||||||||||||||||
| Shareholder dividends | — | — | — | — | ( | — | ( | |||||||||||||||||||||||||||||||||||||
| Net income (loss) | — | — | — | — | ( | — | ( | |||||||||||||||||||||||||||||||||||||
| Other comprehensive income (loss) | — | — | — | — | — | ( | ( | |||||||||||||||||||||||||||||||||||||
| Balance at December 31, 2023 | $ | $ | $ | $ | ( | $ | $ | |||||||||||||||||||||||||||||||||||||
The accompanying notes are an integral part of these Consolidated Financial Statements.
F-8
MOUNT LOGAN CAPITAL INC. CONSOLIDATED STATEMENTS OF CASH FLOWS | ||||||||||||||
| Years ended December 31, | ||||||||||||||
| (in thousands) | 2024 | 2023 | ||||||||||||
| Cash Flows from Operating Activities | ||||||||||||||
| Net income (loss) | $ | ( | $ | ( | ||||||||||
| Adjustments to reconcile net income (loss) to net cash used in operating activities: | ||||||||||||||
| Net realized (gains) losses on investments | ( | ( | ||||||||||||
| Net realized (gains) losses on foreign currency | ( | |||||||||||||
| Net change in unrealized (gains) losses on investments | ( | |||||||||||||
| Net change in (gain) loss on foreign currency | ( | |||||||||||||
| Change in fair value of debt obligation | ||||||||||||||
| Payment in-kind interest | ( | |||||||||||||
| Equity investment earnings | ( | ( | ||||||||||||
| Amortization of debt issuance costs | ||||||||||||||
| Amortization of deferred acquisition costs | ||||||||||||||
| Amortization of intangible assets | ||||||||||||||
| Net amortization of premiums and accretion of discounts on investments | ( | ( | ||||||||||||
| Impairment of intangible assets | ||||||||||||||
| Equity based compensation | ||||||||||||||
| Changes in consolidation | ( | |||||||||||||
| Increase (decrease) in estimated credit losses | ||||||||||||||
| (Increase) decrease in operating assets: | ||||||||||||||
| Due from affiliates | ||||||||||||||
| Reinsurance recoverable | ( | |||||||||||||
| Change in deferred acquisition costs | ( | ( | ||||||||||||
| Distributions from equity method investments | ||||||||||||||
| Other assets | ( | ( | ||||||||||||
| Other assets of consolidated VIEs | ||||||||||||||
| Purchases of investments by consolidated VIEs | ( | ( | ||||||||||||
| Proceeds from sale of investments by consolidated VIEs | ||||||||||||||
| Increase (decrease) in operating liabilities: | ||||||||||||||
| Due to affiliates | ( | |||||||||||||
| Future policy benefits | ( | ( | ||||||||||||
| Interest sensitive contract liabilities | ||||||||||||||
| Funds held under reinsurance contracts | ||||||||||||||
| Accrued expenses and other liabilities | ( | |||||||||||||
| Net cash used in operating activities | $ | ( | $ | ( | ||||||||||
| Investing Activities | ||||||||||||||
| Purchases of investments | $ | ( | $ | ( | ||||||||||
| Proceeds from sales and repayments of investments | ||||||||||||||
| Acquisition of Ovation, net of cash acquired | ( | |||||||||||||
| Payments to acquire intangible assets | ( | |||||||||||||
| Net cash used in investing activities | $ | ( | $ | ( | ||||||||||
The accompanying notes are an integral part of these Consolidated Financial Statements.
F-9
MOUNT LOGAN CAPITAL INC. CONSOLIDATED STATEMENTS OF CASH FLOWS | ||||||||||||||
| Years ended December 31, | ||||||||||||||
| (in thousands) | 2024 | 2023 | ||||||||||||
| Financing Activities | ||||||||||||||
| Shareholder dividends | $ | ( | $ | ( | ||||||||||
| Proceeds from borrowings of asset management business | ||||||||||||||
| Repayments of borrowings of asset management business | ( | ( | ||||||||||||
| Financing costs paid and deferred | ( | ( | ||||||||||||
| Proceeds from borrowings of insurance business | ||||||||||||||
| Deposits on investment-type policies and contracts | ||||||||||||||
| Withdrawals on investment-type policies and contracts | ( | ( | ||||||||||||
| Net cash provided by financing activities | $ | $ | ||||||||||||
| Net increase (decrease) in cash, cash equivalents and restricted cash, and cash and cash equivalents of consolidated VIEs | ||||||||||||||
| Cash, cash equivalents and restricted cash, and cash and cash equivalents of consolidated VIEs, beginning of the period | ||||||||||||||
| Cash, cash equivalents and restricted cash, and cash and cash equivalents of consolidated VIEs, end of period | $ | $ | ||||||||||||
| Cash, cash equivalents, restricted cash and cash and cash equivalents of consolidated VIEs | ||||||||||||||
| Asset Management | ||||||||||||||
| Cash and cash equivalents | ||||||||||||||
| Total Asset Management | ||||||||||||||
| Insurance Solutions | ||||||||||||||
| Cash and cash equivalents | ||||||||||||||
| Restricted cash | ||||||||||||||
| Cash and cash equivalents of consolidated VIEs | ||||||||||||||
| Total Insurance Solutions | ||||||||||||||
| Total cash, cash equivalents and restricted cash, and cash and cash equivalents of consolidated VIEs | $ | $ | ||||||||||||
| Supplemental disclosures of cash flow information | ||||||||||||||
| Interest received | $ | $ | ||||||||||||
| Interest paid | ||||||||||||||
| Dividends received | ||||||||||||||
| Income taxes paid | ||||||||||||||
| Supplemental Disclosures of Non-Cash Investing and Financing Activities | ||||||||||||||
| Contingent value rights write off | ( | |||||||||||||
| Issuance of common shares for investment in fixed income asset manager | ||||||||||||||
| Operating lease right-of-use asset exchanged for lease liabilities | ||||||||||||||
| Cashless repayment on borrowings | ||||||||||||||
The accompanying notes are an integral part of these Consolidated Financial Statements.
F-10
MOUNT LOGAN CAPITAL INC. CONSOLIDATED STATEMENTS OF CASH FLOWS | ||||||||||||||
| Years ended December 31, | ||||||||||||||
| (in thousands) | 2024 | 2023 | ||||||||||||
| Issuance of common shares for vested Restricted Share Units | ||||||||||||||
| Issuance of common shares for the Ovation acquisition | ||||||||||||||
| Supplemental Disclosure of Cash Flow Information of Consolidated VIEs | ||||||||||||||
| Changes in consolidation | ||||||||||||||
| Investments, at fair value | ||||||||||||||
| Other assets | ||||||||||||||
| Debt obligations | ( | |||||||||||||
| Accrued expenses and other liabilities | ( | |||||||||||||
The accompanying notes are an integral part of these Consolidated Financial Statements.
F-11
MOUNT LOGAN CAPITAL INC.
NOTES TO CONSOLIDATED FINANCIAL STATEMENTS
(All amounts in thousands, except share and per share data, and except where noted)
Note 1. Organization
Mount Logan (“MLC,” the “Company” or “we”), together with its consolidated subsidiaries is a diversified alternative asset management and insurance solutions platform. Our mission is to provide our investors access to a diversified and differentiated set of private market investment solutions to address their capital needs. Mount Logan conducts its business primarily in the United States through its two business segments: Asset Management and Insurance Solutions. Our Asset Management segment is conducted by Mount Logan Management LLC (“ML Management”), our SEC-registered investment adviser, manages a significant portion of our Assets Under Management (“AUM”) across our various managed funds supported by permanent and semi-permanent capital bases. Management also directly manages the capital of our wholly-owned insurance company, Ability Insurance Company (“Ability”), for the benefit of policyholders. The Company’s Insurance Solutions segment is conducted by Ability, a Nebraska domiciled insurer, specializes in reinsuring annuity products for the increasing number of individuals seeking to fund retirement needs and represents all of our insurance solutions operations.
Note 2. Basis of Presentation
Basis of presentation
The Consolidated Financial Statements (“Consolidated Financial Statements”) have been prepared in accordance with accounting principles generally accepted in the United States of America (“U.S. GAAP”). The results of the Company and its subsidiaries are presented on a consolidated basis. All intercompany transactions and balances are eliminated on consolidation.
The Company's Asset Management and Insurance Solutions segments possess distinct characteristics, and as a result are presented separately from each other. The Company believes that separate presentation provides a more informative view of the Company’s consolidated financial position and results of operations than an aggregated presentation and that reporting insurance solutions separately is appropriate given, among other factors, the relative significance of Ability's policy liabilities, which do not provide recourse to the remaining assets of MLC.
The summary of the significant accounting policies includes a section for common accounting policies and an accounting policy section for each of the two operating segments when a policy is specific to one operating segment and not the other. Unless otherwise specified, the significant accounting policy applies to both segments.
Due to rounding, numbers presented throughout these Consolidated Financial Statements may not add up precisely to the totals provided and percentages may not precisely reflect the absolute figures.
Significant accounting policies - overall
Consolidation
These Consolidated Financial Statements include the financial statements of the Company and its controlled subsidiaries and entities. The Company assesses all entities in which the Company has a variable interest for consolidation including management companies, insurance companies, investment companies, collateralized loan obligations (“CLOs”), and other entities. A variable interest is an investment or other interest that will absorb portions of an entity’s expected losses and/or receive expected residual returns. Fees earned by the Company that (i) include terms, conditions, or amounts that are customarily present in arrangements for similar services negotiated at arm’s length, (ii) are commensurate with the level of effort required to provide those services, and (iii) where the Company does not hold other economic interests in the entity that would absorb more than an insignificant amount of the expected losses or returns of the entity, would not be considered to be variable interests.
Pursuant to its consolidation policy, once the Company determines it has a variable interest in an entity, the Company considers whether the entity is a variable interest entity (“VIE”). Entities that do not qualify as VIEs are assessed for consolidation as voting interest entities (“VOEs”) under the voting interest model.
F-12
An entity is a VIE if one of the following conditions exist: (a) the equity at risk is not sufficient for the entity to finance its activities without additional subordinated financial support, (b) the holders of the equity at risk (as a group) lack the ability to make decisions about the activities that most significantly impact the entity’s economic performance, or (c) the voting rights of some investors are disproportionate to their obligation to absorb the expected losses of the legal entity, their rights to receive the expected residual returns of the legal entity, or both and substantially all of the legal entity's activities either involve or are conducted on behalf of an investor with disproportionately few voting rights. Limited partnerships and other similar entities where limited partners, not affiliated with the general partner, have not been granted (i) substantive participation rights or (ii) substantive rights to either dissolve the partnership or remove the general partner are VIEs.
The Company consolidates VIEs in which it is the primary beneficiary. The Company is the primary beneficiary if it holds a controlling financial interest which is defined as possessing both (a) the power to direct the activities of a VIE that most significantly impact the VIE's economic performance and (b) the obligation to absorb losses of the VIE or the right to receive benefits from the VIE that could potentially be significant to the VIE. The Company determines whether it is the primary beneficiary of a VIE at the time it becomes involved with a VIE and reconsiders that conclusion on an ongoing basis if facts and circumstances change.
Entities determined not to be VIEs are VOEs and are evaluated under the voting interest model. The Company typically consolidates VOEs when it has a majority voting interest.
Each entity is assessed for consolidation individually considering the specific facts and circumstances surrounding that entity. The consolidation assessment, including the determination whether an entity is a VIE or VOE, depends on the facts and circumstances for each entity, and therefore the Company’s investment companies may qualify as VIEs or VOEs.
With respect to CLOs (which are generally VIEs), as collateral manager, the Company generally has the power to direct the activities of the CLO that most significantly impact the CLO’s economic performance. In some, but not all cases, the Company, through its ownership in the CLOs, may have variable interests that represent an obligation to absorb losses of, or a right to receive benefits from, the CLO that could potentially be significant to the CLO. In cases where the Company has both the power to direct the activities of the CLO that most significantly impact the CLO's economic performance and the obligation to absorb losses of the CLO or the right to receive benefits from the CLO that could potentially be significant to the CLO, the Company is deemed to be the primary beneficiary and consolidates the CLO.
Assets of the consolidated VIEs are primarily presented in separate sections within the Consolidated Statements of Financial Position. Changes in the fair value of the consolidated VIEs’ assets and liabilities and related interest, dividend and other income and expenses are primarily presented within Revenues of consolidated variable interest entities in the Consolidated Statements of Operations.
Use of estimates
The preparation of the Consolidated Financial Statements in conformity with U.S. GAAP requires management to make estimates and assumptions that affect the reported amounts in the financial statements and related disclosures. Significant estimates and assumptions include but are not limited to estimating fair values of certain financial instruments (including derivatives), impairment of investments and allowances for expected credit losses, goodwill and intangible assets, insurance liabilities and reinsurance recoverables, income taxes, performance obligations and incentive fees, and equity based compensation. Actual results could differ from those estimates, and such differences could be material.
Cash and cash equivalents
The Company considers all highly liquid short-term investments, including money market funds, with original maturities of three months or less when purchased to be cash equivalents. Interest income from Cash and cash equivalents is recorded within the Investment and other income (loss) – Asset Management and Net investment income for Insurance Solutions in the Consolidated Statements of Operations. The carrying values of the money
F-13
market funds represent their fair values due to their short-term nature. Substantially all of the Company’s cash on deposit is in interest bearing accounts with financial institutions and exceed insured limits.
Restricted cash
Foreign currency translation
The functional currency is the currency of the primary economic environment in which an entity operates. If a subsidiary has a functional currency different from the Company’s reporting currency, the subsidiary’s results are translated into the reporting currency as follows:
•Assets and liabilities are translated at the closing rate as of the date of that Consolidated Balance Sheet
•Income and expenses for each Consolidated Statement of Operations and Consolidated Statement of Comprehensive Income (Loss) are translated at average exchange rates for the period
•All resulting exchange differences are recognized as a separate component of Accumulated other comprehensive income (loss) (“AOCI”)
When a subsidiary is sold or substantially liquidated, the cumulative amount in AOCI related to the subsidiary is recognized in the Consolidated Statements of Operations.
Foreign currency transactions
Transactions in foreign currencies are converted into the functional currency using exchange rates that approximate those prevailing at the date of the transactions. The Company remeasures monetary assets and liabilities denominated in a currency that is different from functional currency. The effect of this remeasurement process results in gains and losses that are recognized in the Consolidated Statements of Operations. Foreign currency transactions, such as, purchases and sales of investments, income and expenses, contributions and dividends to shareholders, are converted at the exchange rate prevailing on the respective dates of such transactions.
Investments
Investment transactions are recorded on trade date. Transaction costs incurred to acquire financial assets measured at fair value through earnings are recognized as an expense as incurred. Transaction costs incurred to acquire financial assets measured at cost are amortized over the contractual life of the instrument using the effective interest method. The periodic movement in fair value of financial assets measured at fair value through earnings is recorded as an unrealized gain or loss within Net gains (losses) from investment activities in the Consolidated Statements of Operations.
Realized gains or losses on investments are calculated, using the first-in, first-out (“FIFO”) method, as the difference between the net proceeds received (excluding prepayment fees, if any) and the amortized cost basis of the investment. Realized gains or losses on investments include investments charged off during the period, net of recoveries.
Interest income
Interest income is recognized using the effective interest method and recorded within Interest income for Asset Management segment and Net investment income for the Insurance Solutions segment on the Consolidated Statements of Operations. Discounts from and premiums to par value are accreted or amortized into Interest income over the contractual life of the investment using the effective interest method.
Debt securities and loans will be put on nonaccrual status when delinquent in principal and/or interest payments for a period exceeding 90 days. Any previously recognized interest receivable will be reversed through interest income once the instrument is put on nonaccrual status and determined to be on the cost recovery method.
F-14
In determining the accounting for individual payments on a nonaccrual loan or security, the Company will evaluate the instrument to determine whether doubt exists about the ultimate collectability of the cost basis. If collectability of the cost basis in the instrument is in doubt, any payment received on a nonaccrual instrument should be applied to reduce the cost basis to the extent necessary to eliminate such doubt.
When the Company can demonstrate that doubt about the ultimate collectability of the cost basis no longer exists, subsequent interest payments received may be recorded as Interest income on a cash basis.
Dividend income
Dividend income on preferred equity securities is recorded on the accrual basis to the extent that such amounts are payable by the portfolio company and are expected to be collected. Dividend income on common equity securities is recorded on the declaration date for private portfolio companies or on the ex-dividend date for publicly-traded portfolio companies.
Equity method investments
For equity investments in entities which the Company exercises significant influence, but does not meet the requirements for consolidation, and has not elected the FVO, the Company uses the equity method of accounting. The Company has significant influence when it can influence operating and financial policies of an investee, which can be indicated in several ways, including, but not limited to: (i) representation on the board of directors, (ii) participation in policy-making processes, and (iii) extent of ownership. Under the equity method of accounting, the Company records its share of the underlying income or loss of such entities adjusted for distributions. The Company recognizes its share of the underlying net income or loss of such entities, using best available information, in Equity investment earning for the Company in its Consolidated Statement of Operations. The initial carrying amount of an equity method investment equals the Company’s cost basis, including transaction costs. The carrying amount is subsequently adjusted for the Company’s share of the investees’ profit, dividends received, and the differences, if any, between the Company’s cost of the investment and the underlying equity in the net assets that arose upon acquisition. The Company evaluates its equity method investments for which it has not elected FVO for impairment whenever events or changes in circumstances indicate that the carrying amounts of such investments may not be recoverable. During the years ended December 31, 2024 and December 31, 2023, there were no impairment charges related to equity method investments.
The carrying amounts of all equity method investments are recorded in investments in the Consolidated Statements of Financial Position. If the Company loses significant influence over the investee, the Company will record its retained investment based on current carrying value as of that date. The subsequent accounting will depend on the accounting policy of the investment.
The Company evaluates each of its equity method investments to determine if any were significant, as defined by guidance from the Securities and Exchange Commission, to consider if the Company is required to present separate financial statements and additional information for its equity method investments. As of, and for the years ended December 31, 2024 and December 31, 2023, no equity method investment held by the Company met the significance criteria individually or in aggregate. As such, the Company is not required to present separate financial statements or supplemental information for any of its equity method investments.
Refer to the Note 22 Related Parties for more information on the Company’s equity method investments.
Allowance for credit losses
Credit losses for mortgage loans and other loans and receivables
The current expected credit losses (CECL) methodology is based on relevant information about past events, including historical experience, current conditions and reasonable and supportable (R&S) forecasts that affect the collectability of the reported financial asset balances. If the asset’s life extends beyond the R&S forecast period, then historical experience is considered over the remaining life of the assets in the allowance. The resulting allowance is adjusted in each subsequent reporting period in the consolidated statement of income to reflect changes
F-15
in history, current conditions and forecasts as well as changes in asset positions and portfolios. The allowance is a valuation account that is deducted from the amortized cost of the financial asset to present the net amount that management expects to collect on the financial asset over its expected life. All financial assets carried at amortized cost are in the scope of the CECL methodology, while assets measured at fair value are excluded.
The Company’s estimation of expected credit losses requires management to make assumptions regarding the likelihood and severity of credit loss events and their impact on expected cash flows, which drive the probability of default (PD), loss given default (LGD) and exposure at default in the Company’s credit loss methods, where the Company discounts the expected credit loss using discounting techniques.
The Company’s forecasts of the U.S. employment rate represent the key macroeconomic variable that most significantly affects its estimate of expected credit losses. The Company forecasts over the next four quarters and reverts to historical experience on a straight-line basis.
The Company estimates expected credit losses over the contractual term of the financial asset, which is adjusted for expected prepayments. Expected extensions are not considered unless the option to extend the loan are unilaterally held by the borrower. Credit enhancements are included in the assessment when embedded in the financial asset and not freestanding.
Expected credit losses are calculated on a pooled basis where financial assets share similar risk characteristics. The Company maintains a watch list and assigns a risk rating of 1 – 5 for each loan to gauge potential credit risk. The loans are then pooled by risk rating to determine the expected credit loss for the pool. The risk rating levels are the following:
Level 1 Borrower is performing above expectations and the trends and risk factors since origination or acquisition are generally favorable.
Level 2 Borrower is generally performing as expected and the risk factors are similar to the risk at the time of origination or acquisition.
Level 3 Borrower performing below expectations and the risk factors increased since origination or acquisition.
Level 4 Borrower performing materially below expectations and the risk factors increased materially since origination or acquisition. Borrower generally breaches debt covenants and loan payments(s) may be past due.
Level 5 Borrower performing significantly below expectations and the risk factors increased significantly since origination or acquisition. Borrower breached most or all debt covenants, loan payments(s) are significantly past due. Principal not expected to be repaid in full.
The loss likelihood and severity models use both internal and external information and are sensitive to forecast of macroeconomic conditions. Regression of information predicated on peer performance is utilized and management has elected the upper bound of the case scenario where PD/LGD estimates will be above the model midpoint. This process more adequately quantifies uncertainties or subjectively assesses risk.
For defaulted loans where repayment is based on sale or operations of the collateral, the Company will evaluate the fair value of the collateral to determine the measurement of expected credit losses. The Company excludes interest receivable from the measurement of expected credit losses and the Company will reverse interest income in a timely manager when loans are placed on nonaccrual. When all or a portion of a loan is deemed uncollectible, the uncollectible portion of the carrying amount of the loan is charged off against the allowance. If the Company recovers all or a portion of an amount previously written off on a credit impaired loan, the recovery is recognized through the allowance account. Expected credit losses are reported in “Net gains (losses) from investment activities” for loans and “Net policy and claims” for reinsurance recoverables.
The Company will measure expected credit losses arising from off-balance sheet commitments, including loan commitments, that are not unconditionally cancellable by the Company. This allowance for credit losses for off-balance sheet commitments is determined using methods consistent with those used for the associated mortgage
F-16
and other loan receivable class and is recognized in Accrued expenses and other liabilities in the Consolidated Statements of Financial Position, since there is no funded asset for the committed amount.
Credit losses for available-for-sale securities
Available-for-sale (“AFS”) securities with a fair value that has declined below amortized cost are evaluated for impairment. If the Company intends to sell a security or it is more likely than not that it would be required to sell a security before the recovery of its amortized cost, the security is written down to its fair value and any impairment is immediately recognized in “Net gains (losses) from investment activities”. If neither of these conditions exist, the decline in fair value is evaluated to determine whether a credit loss exists and an allowance for credit losses should be recognized.
For AFS securities, relevant facts and circumstances are qualitatively considered in evaluating whether a decline below fair value is credit-related. Relevant facts and circumstances include but are not limited to: (1) the extent to which the fair value is less than amortized cost; (2) changes in credit ratings, (3) adverse conditions related to the security’s industry or geographical area, (4) failure to make scheduled payments, and (5) other known changes in the financial condition of the issuer or quality of any underlying collateral or credit enhancements.
Management uses its best judgment in evaluating the cause of the decline in the estimated fair value of the security. Inherent in management’s evaluation of the security are assumptions and estimates about the operations of the issuer and its future earnings potential. The review of expected future cash flows can include assumptions about economic risks (e.g., unemployment, real estate prices), loan specific information (delinquency rates and loan-to-value ratios), facts and circumstances relevant to the security and the issuer, and secondary sources of repayment (e.g., credit enhancements).
Credit impairments are measured as the difference between the security’s amortized cost and the present value of expected cash flows discounted at the current effective interest rate. The credit impairment is subject to a floor equal to the fair value of the security and is recognized immediately in “Net gains (losses) from investment activities”. Any non-credit impairment will continue to be recorded in accumulated other comprehensive income. The Company continues to monitor impaired AFS securities for changes in the measurement of credit losses which will be reflected through adjustments to the allowance. Amounts are charged off against the allowance for credit losses when deemed uncollectible and any recoveries are recognized as a realized gain.
Financial instruments held by consolidated VIEs
The consolidated VIEs are primarily CLOs. Their investments include loans, debt securities, and equity securities held at fair value. Net income attributable to the Company reflects the Company’s own economic interests in the consolidated CLOs, including (i) changes in the fair value of the beneficial interests retained by the Company and (ii) beneficial interests that represent compensation for collateral management services. Using the measurement alternative for consolidated collateralized financing entities, the Company measures both the financial assets and financial liabilities of the consolidated CLOs using the fair value of the financial assets or financial liabilities, whichever are more observable. When the financial assets are more observable, the financial assets are measured at fair value. In consolidation, the financial liabilities are measured as the sum of (i) the fair value of financial assets and (ii) the carrying value of any nonfinancial assets held temporarily, less the sum of (i) the fair value of any beneficial interests owned by the Company and (ii) the carrying value of any beneficial interests that represent compensation for services. When financial liabilities are more observable, the financial liabilities are measured at fair value. In consolidation, the financial assets are measured as the sum of (i) the fair value of financial liabilities, (ii) the fair value of any beneficial interests retained by the Company, and (iii) the carrying value of any beneficial interests that represent compensation for services, less the carrying value of any nonfinancial assets held temporarily.
F-17
Fair value of financial instruments
Fair value measurement
Fair value is the price that would be received upon the sale of an asset or paid to transfer a liability in an orderly transaction between market participants at the measurement date under current market conditions. Where available, fair value is based on observable market prices or parameters, or derived from such prices or parameters. Where observable prices or inputs are not available, valuation techniques are applied. These valuation techniques involve varying levels of management estimation and judgement, the degree of which is dependent on a variety of factors. The actual realized gains or losses will depend on, among other factors, future operating results, the value of the assets and market conditions at the time of disposition, any related transaction costs and the timing and manner of sale, all of which may ultimately differ significantly from the assumptions on which the valuations were based.
U.S. GAAP establishes a hierarchical disclosure framework which prioritizes and ranks the level of market price observability used in measuring financial instruments at fair value. Market price observability is affected by a number of factors, including the type of financial instrument, the characteristics specific to the financial instrument and the state of the marketplace, including the existence and transparency of transactions between market participants. Financial instruments with readily available quoted prices in active markets generally will have a higher degree of market price observability and less judgment used in measuring fair value.
The Company undertakes a multi-step valuation process, which includes, among other procedures, the following:
•The Company’s quarterly valuation process begins with each investment being initially valued by the investment professionals responsible for the respective portfolio investment. The Company may utilize an independent valuation firm from time to time to provide valuation on material illiquid securities.
•The Company will review the recommended valuations and determine the fair value of each investment. Valuations that are not based on readily available market quotations will be valued in good faith based on, among other things, the input of management and, where applicable, other third-parties.
The Company classifies fair value measurements within a hierarchy which gives the highest priority to unadjusted quoted prices in active markets for identical assets or liabilities (Level 1) and the lowest priority to unobservable inputs (Level 3). The three levels of the fair value hierarchy are:
Level 1 Unadjusted quoted prices in active markets for identical assets or liabilities that the Company can access at the measurement date. The type of investments included in Level I include listed equities and listed securities. The Company does not adjust the quoted price for these investments, even in situations where the Company may hold a large position and a sale could reasonably affect the quoted price.
Level 2 Pricing inputs are other than quoted prices in active markets, which are either directly or indirectly observable as of the reporting date. Such inputs may be quoted prices for similar assets or liabilities, quoted markets that are not active, or other inputs that are observable or can be corroborated by observable market data for substantially the full character of the financial instrument, or inputs that are derived principally from, or corroborated by, observable market information. Investments which are generally included in this category include illiquid debt securities and less liquid, privately held or restricted equity securities, for which some level of recent trading activity has been observed.
Level 3 Pricing inputs are unobservable for the investment and includes situations where there is little, if any, market activity for the investment. The inputs may be based on our own assumptions about how market participants would price the asset or liability or may use Level 2 inputs, as adjusted, to reflect specific investment attributes relative to a broader market assumption. These inputs into the determination of fair value may require significant management judgment or estimation. Even if observable market data for comparable performance or valuation measures (earnings multiples, discount rates, other financial/valuation ratios, etc.) are available, such investments are grouped as Level 3 if any significant data point that is not also market observable (private company earnings, cash flows, etc.) is used in the valuation methodology.
F-18
In certain cases, the inputs used to measure fair value may fall into different levels of the fair value hierarchy. In such cases, a financial instrument’s level within the fair value hierarchy is based on the lowest level of input that is significant to the fair value measurement. The Company’s assessment of the significance of a particular input to the fair value measurement in its entirety requires judgment and considers factors specific to the financial instrument when the fair value is based on unobservable inputs. The Company evaluates these inputs and recognizes transfers between levels, if any, at the end of each reporting period.
A significant decrease in the volume and level of activity for the asset or liability is an indication that transactions or quoted prices may not be representative of fair value because in such market conditions there may be increased instances of transactions that are not orderly. In those circumstances, further analysis of transactions or quoted prices is needed, and a significant adjustment to the transactions or quoted prices may be necessary to estimate fair value.
When a security is valued based on broker quotes, the Company subjects those quotes to various criteria in making the determination as to whether a particular financial instrument would qualify for classification as Level 2 or Level 3. These criteria include, but are not limited to, the number and quality of the broker quotes, the standard deviations of the observed broker quotes, and the percentage deviation from external pricing services.
Debt securities: These financial instruments are generally valued using inputs obtained from dealers or market makers, and where these values are not available, generally valued based on a range of valuations determined by management or an independent valuation firm. Valuation models are based on discounted cash flow or enterprise value analyses, for which the key inputs are determined based on market comparables, which incorporate similar instruments from similar issuers.
Real estate and mortgage loans: The Company's investments in real estate and mortgage loans are illiquid, structured investments that are specific to the property and its operating performance. As there are no observable inputs, these investments are classified as Level 3 on the fair value hierarchy.
Fair value option
The Company elects the fair value option (“FVO”) to carry certain financial assets and financial liabilities at fair value, with changes in fair value recognized in the Consolidated Statements of Operations. The FVO election is irrevocable and is applied to financial instruments on an individual basis at initial recognition or at eligible remeasurement events. Transaction costs incurred to acquire financial assets which are accounted for under the FVO are expensed as incurred. The Company elected to present the accretion of purchase discounts and the amortization of purchase premiums separately from the changes in fair value. Interest income on interest-bearing financial instruments is based on the stated interest rates adjusted for the accretion of purchase discounts and the amortization of purchase premiums.
The Company elects FVO for certain debt securities collateralizing insurance contract liabilities to substantially reduce any accounting mismatch arising from changes in fair value of these assets and changes in the value of their related insurance contract liabilities. The Company also elects FVO on certain financial liabilities which contain embedded derivatives. By electing the FVO, the Company accounts for the entire financial liability at fair value with changes in fair value recognized in earnings, and therefore does not need to account for the derivative separately from the host contract. Additionally, the Company elects the FVO on certain loan assets and equity securities which the Company manages on a fair value basis.
Business combinations
The Company accounts for business combinations using the acquisition method of accounting where the consideration transferred for the acquisition is allocated to the assets acquired and liabilities assumed using the fair values determined by management as of the acquisition date. Contingent consideration obligations that are elements of the consideration transferred are recognized as of the acquisition date as part of the fair value transferred in exchange for the acquired business. Acquisition-related costs incurred in connection with a business combination are expensed as incurred.
F-19
Goodwill
Goodwill represents the excess of cost over the fair value of identifiable net assets of an acquired business. Goodwill is recorded as a separate line item in the Consolidated Statements of Financial Position for Insurance Solutions and included in Other assets for Asset Management. Refer to Note 11 Goodwill and intangible assets for disclosure regarding the goodwill recorded.
Intangible assets
The Company’s intangible assets include investment management contracts included in the Asset Management segment and state insurance licenses in the Insurance Solutions segment. Investment management contracts include payments made to purchase existing investment management contracts from third-party investment managers. The Company recognizes indefinite and definite lived investment management contracts. State insurance licenses are deemed intangible assets with an indefinite useful life. The indefinite useful life assessment for the state insurance licenses is based off the circumstances that these licenses are incapable of being separated from the entity and sold, arise from a contractual and legal right to write insurance policies in respective licensed states, and the expected future economic benefits attributable to the asset will flow to the entity.
Intangible assets with definite useful lives are measured at cost less accumulated amortization and accumulated impairment losses. Amortization is recorded using either the straight-line method or another systematic basis that reflects the pattern in which future economic benefits are expected to be consumed over the remaining useful life of the intangible asset. The useful life is based on the estimated periods that the Company expects to collect management fees, which range from 4 to 7 years. Amortization expense is recognized in the Consolidated Statements of Operations in Amortization and impairment of intangible assets. The indefinite useful life assessment for certain investment management contracts is based on the ability to renew these contracts indefinitely. In addition, there are no legal, regulatory or contractual provisions that limit the useful lives of these intangible assets. Intangible assets with definite useful lives are periodically tested for recoverability when indicators are present that indicate carrying amount of the asset or the asset group is not recoverable. A two-step recoverability test is performed where in first step asset is considered impaired when the carrying amount of asset or the asset group is less than future undiscounted cash flows attributed to asset or the asset group. In second step, an impairment charge is determined as the difference between fair value of the asset less the carrying value of the asset.
Intangible assets with indefinite useful lives are not amortized but are subject to an annual impairment test which is performed more frequently if an indication that it is not recoverable arises. Intangible assets are reviewed for impairment annually or more frequently if events or changes in circumstances indicate that the asset may be impaired. Intangible assets are first qualitatively assessed for indicators of impairment by looking at relevant events and circumstances that can affect the significant inputs used to determine the fair value of the indefinite-lived intangible assets. When results of qualitative test indicate that it is more likely than not that an intangible asset is impaired, a quantitative test is performed comparing intangible asset’s fair value to its carrying value. Intangible assets that are determined to be impaired are written down to their recoverable amount. The recoverable amount is
F-20
Additional information regarding intangible assets is included in Note 11 Goodwill and intangible assets.
Compensation and benefits
Compensation consists of base salary, benefits, discretionary and non-discretionary bonuses, severance, and stock-based awards. Compensation costs are recorded in compensation and benefits in the Consolidated Statements of Operations.
Certain employees and non-employees who provide services to the Company are granted equity-based awards as compensation that are measured based on the grant date fair value of the award. Equity-based employee awards that require future service are expensed over the relevant period of service. Under the Company’s performance and restricted share unit (“RSU”) plan (the “RSU Plan”), participants may be granted RSUs, each of which represents a conditional right to receive a common share in the future. The RSUs granted under this plan generally vest over a three-year period with 33
Earnings per share
Income taxes
The Company’s Consolidated Financial Statements present current and deferred income tax balances for both domestic and foreign operations, including U.S. federal, state and local income taxes. Any interest and penalties when incurred would be reflected within Income tax (expense) benefit as applicable, in the accompanying Consolidated Statements of Financial Position.
Deferred Income Taxes
Income taxes are accounted for using the asset and liability method of accounting. Under this method, deferred tax assets and liabilities are recognized for the expected future tax consequences of differences between the carrying amounts of assets and liabilities and their respective tax basis, using tax rates in effect for the year in which the differences are expected to reverse. The effect on deferred assets and liabilities of a change in tax rates is recognized in the Consolidated Statements of Operations in the period when the change is enacted. Deferred tax assets are reduced by a valuation allowance when, based on the weight of available evidence, it is more likely than not that some portion or all of the deferred tax assets will not be realized. When evaluating the realizability of the deferred tax assets, all evidence, both positive and negative, is considered. Items considered when evaluating the need for a valuation allowance include the ability to carry back losses, future reversals of existing temporary differences, tax planning strategies, and expectations of future earnings.
For a particular tax-paying component of an entity and within a particular tax jurisdiction, deferred tax assets and liabilities are offset and presented as a single amount within Other assets or Accrued expenses and other liabilities, as applicable, in the accompanying Consolidated Statements of Financial Position.
F-21
Uncertain Tax Positions
The Company analyzes its tax filing positions in all jurisdictions where it is required to file income tax returns, as well as for all open tax years in these jurisdictions. If, based on this analysis, the Company determines that uncertainties in tax positions exist, a reserve is established. The reserve for uncertain tax positions is recorded in Accrued and Other Liabilities in the accompanying Consolidated Statements of Financial Position. The Company recognizes accrued interest and penalties related to uncertain tax positions within the provision for income taxes in the Consolidated Statements of Operations.
The Company assesses uncertain tax positions on the basis of a two-step process: (a) determination is made whether it is more likely than not that the tax positions will be sustained based on the technical merits of the position and (b) those tax positions that meet the more-likely-than-not threshold are recognized as the largest amount of tax benefit that is greater than 50 percent likely to be realized upon ultimate settlement with the related tax authority. Any required liability reduces the tax benefit from the position to the amount determined under step (b), above.
Debt issuance costs
Debt issuance costs consist of costs incurred in obtaining financing and are amortized over the term of the financing using the effective interest method. These costs are generally recorded as a direct deduction from the carrying amount of the related debt liability in the Consolidated Statements of Financial Position. Costs incurred as a result of debt modification are either capitalized or expensed depending on if debt is considered extinguished or modified.
Warrants
Recently adopted accounting pronouncements
In August 2018, the Financial Accounting Standards Board (“FASB”) issued Accounting Standards Update (“ASU”) 2018-12, Targeted Improvements to the Accounting for Long-Duration Contracts (Topic 944). The update provides guidance to the existing recognition, measurement, presentation and disclosure requirements for long-duration contracts issued by an insurance entity. The FASB subsequently issued ASU 2019-09 in November 2019 and ASU 2020-11 in November 2020, which amended the effective date for this standard and provided transition relief to facilitate early application for long duration contracts. The standard will now take effect for public business entities for fiscal years, and interim periods within those fiscal years, beginning after December 15, 2022.
These updates amend four key areas pertaining to the accounting and disclosures for long-duration insurance and investment contracts and are commonly referred to as long duration targeted improvements (“LDTI”).
a.The update requires cash flow assumptions used to measure the liability for future policy benefits to be updated at least annually and no longer allows a provision for adverse deviation. The remeasurement of the liability associated with the update of assumptions is required to be recognized in net income. Loss recognition testing is eliminated for traditional and limited-payment contracts. The update also requires the discount rate used in measuring the liability to be an upper-medium grade fixed income instrument yield,
F-22
which is to be updated at each reporting date. The change in liability due to changes in the discount rate is to be recognized in OCI.
b.The update simplifies the amortization of DAC and other balances amortized in proportion to premiums, gross profits, or gross margins, requiring such balances to be amortized on a constant level basis over the expected term of the contracts. Deferred costs are required to be written off for unexpected contract terminations but are not subject to impairment testing.
c.The update requires certain contract features meeting the definition of market risk benefits to be measured at fair value. The change in fair value of the market risk benefits is to be recognized in net income, excluding the portion attributable to changes in instrument-specific credit risk which is recognized in OCI.
d.The update also introduces disclosure requirements around the liability for future policy benefits, policyholder account balances, market risk benefits, and deferred acquisition costs. This includes disaggregated rollforwards of these balances and information about significant inputs, judgments, assumptions and methods used in their measurement.
The Company adopted these updates on January 1, 2023 and, for all provisions of the update, applied a retrospective transition approach. Refer to Note 13, Deferred acquisition costs through Note 16, Reinsurance for the effects of long-duration targeted improvements (“LDTI”) on the Consolidated Financial Statements.
In June 2022, the FASB issued ASU 2022-03, ASC 820, Fair Value Measurement of Equity Securities Subject to Contractual Sale Restrictions. According to ASU 2022-03, an entity should not consider the contractual sale restriction when measuring the equity security’s fair value and an entity is not allowed to recognize a contractual sale restriction as a separate unit of account. ASU 2022-03 is effective for fiscal years beginning after December 15, 2023, and interim periods within those fiscal years. The Company adopted this accounting standard effective January 1, 2024 and its adoption on a prospective basis did not have a material impact on the consolidated financial statements.
In November 2023, the FASB issued ASU 2023-07, Segment Reporting (Topic 280): Improvements to Reportable Segment Disclosures. This ASU enhances disclosure of significant segment expenses by requiring disclosure of significant segment expenses regularly provided to the chief operating decision maker, extending certain annual disclosures to interim periods, and permitting more than one measure of segment profit or loss to be reported under certain conditions. The amendments are effective for the Company in years beginning after December 15, 2023, and interim periods within years beginning after December 15, 2024. Early adoption of ASU 2023-07 is permitted, including adoption in any interim period for which financial statements have not been issued. The Company adopted this effective January 1, 2023 and has provided comparative segment disclosures including effects of this ASU for annual periods ending December 31, 2023, and December 31, 2024.
Recently issued accounting pronouncements
In December 2023, the FASB issued ASU 2023-09, Income Taxes (Topic 740): Improvements to Income Tax Disclosures. This ASU requires additional quantitative and qualitative income tax disclosures to allow readers of the financial statements to assess how the Company’s operations, related tax risks and tax planning affect its tax rate and prospects for future cash flows. For public business entities, ASU 2023-09 is effective for annual periods beginning after December 15, 2024. The Company is currently evaluating the impact that the adoption of this ASU will have on its Consolidated Financial Statements.
In March 2024, the FASB issued ASU 2024-01, Compensation-Stock Compensation (Topic 718): Scope Application of Profits Interest and Similar Awards, which clarifies how an entity determines whether a profits interest or similar award (hereafter a “profits interest award”) is (1) within the scope of FASB ASC 718, Share-Based Payments, or (2) not a share-based payment arrangement and therefore within the scope of other guidance. This ASU will be effective for annual periods beginning after December 15, 2024, and interim periods within those annual periods. The Company has determined that the ASU will not have a material impact on its Consolidated Financial Statements.
F-23
In March 2024, the FASB issued ASU 2024-02, Codification Improvements-Amendments to Remove References to the Concepts Statements. This ASU contains amendments to the Codification that remove references to various FASB Concepts Statements. The effort facilitates Codification updates for technical corrections such as conforming amendments, clarifications to guidance, simplifications to wording or the structure of guidance and other minor improvements. While the amendments are not expected to result in significant changes for most entities, the FASB provided transition guidance since some entities could be affected. This ASU will be effective for fiscal years beginning after December 15, 2024, with early adoption permitted. The Company has determined that the ASU will not have a material impact on its Consolidated Financial Statements.
In November 2024, the FASB issued ASU 2024-03, Income Statement – Reporting Comprehensive Income – Expense Disaggregation Disclosures. This ASU requires disaggregation of certain expense captions into specified categories in disclosures within the footnotes to the financial statements. The ASU requires presentation in a tabular format of each pertinent expense category on the face of the income statement, such as employee compensation, depreciation, amortization of intangible assets, and other applicable expenses. This ASU will be effective for fiscal years beginning after December 15, 2026, and interim reporting periods beginning after December 15, 2027. Early adoption of the ASU is permitted, including adoption in any interim period for which financial statements have not been issued. The Company is currently evaluating the impact of adopting this ASU on its Consolidated Financial Statements.
Significant accounting policies – Asset Management
The material accounting policies applicable to the Asset Management business are described below.
Revenues
The Company provides investment management and related services to investment funds, CLOs, and other vehicles. The Company’s contracts generally impose single performance obligations, each consisting of a series of similar related services to the customers. The performance obligations are generally satisfied over time as the customers simultaneously receive and consume the benefits of the services rendered and are measured using an output method. The Company recognizes revenue to depict the transfer of promised goods or services to customers in an amount that reflects the consideration the Company expects to be entitled in exchange for those goods or services (i.e., the transaction price). When determining the transaction price, the Company recognizes variable consideration only to the extent that it is probable that a significant reversal in the amount of cumulative revenue will not occur when the uncertainty associated with the variable consideration is subsequently resolved. Additionally, when another party is involved in the Company’s provision of services, the Company determines whether it is the principal which results in the Company presenting revenue gross with a corresponding expense, or is an agent which results in net revenue presentation. The Company evaluates each arrangement separately, considering the transfer of control of the services, as well as, each party’s rights and obligations, including price discretion, inventory risk, and primary responsibility to the end customer.
Customers are billed regularly, typically quarterly and shortly after the control of services have been transferred to the customer. Amounts billed are recorded as receivables and require payment on a short-term basis and, therefore, the contracts do not contain a significant financing component. Additionally, the Company’s customers do not have a right to return the provided services. Fees earned from the Company’s consolidated entities are eliminated in consolidation.
The Company’s revenues include (i) Management fees, (ii) Incentive fees, (iii) Servicing fees, and (iv) Performance allocations.
Management fees
The Company provides investment management services to investment funds, CLOs, and other vehicles in exchange for a management fee. Management fees are determined quarterly using an annual rate which are generally based upon (i) a percentage of the capital committed during the commitment period, and thereafter based on the remaining invested capital of unrealized investments, or (ii) net asset value, gross assets, or as otherwise provided in the respective agreements. Management fees are recognized over time, during the period in which the related
F-24
services are performed. Uncollected amounts are classified as Other assets in the Consolidated Statements of Financial Position.
Incentive fees
The Company provides investment management services to investment funds, CLOs, managed accounts and other vehicles in exchange for a management fee, as discussed above and, in some cases an incentive fee, a type of performance revenue. The incentive fee consists of two parts: (i) an income incentive fee which is based on pre-incentive fee net investment income in excess of a hurdle rate and (ii) a capital gains incentive fee which is based on cumulative realized capital gains and losses and unrealized capital depreciation. Incentive fees are considered a form of variable consideration as they are based the fund achieving certain investment return hurdles. Accordingly, the recognition of such fee is deferred until it is probable that a significant reversal in the amount of cumulative revenue will not occur, which is generally upon liquidation of the investment fund. Uncollected amounts are classified as Other assets in the Consolidated Statements of Financial Position.
Servicing fees
The Company provides administrative and reporting services to Sierra Crest Investment Management LLC (“SCIM”) in respect of the management of an investment fund (“ACIF”) in exchange for a servicing fee. The servicing fee is variable consideration as it is calculated quarterly based on the fees received by SCIM under its advisory agreement with ACIF, less a specified fee retained by SCIM, debt servicing expense, compensation and other certain expenses SCIM incurs in connection with investment advisory services it provides to ACIF. As the Company determined it acts as the agent in this relationship, the Company recognizes in income the amount it is entitled to receive or obligated to pay. In the Consolidated Statements of Financial Position, uncollected amounts are classified as Due from related parties when money is owed to the Company and money owed by the Company is presented as Due to related parties.
Performance allocations
The Company provides investment management services to investment funds in exchange for a management fee as discussed above and, in some cases a performance allocation. Performance allocations are an allocation of capital that the Company receives in exchange for managing an investment company and are based on pre-incentive fee net investment income in excess of a hurdle rate. Performance allocations are variable consideration as these fees receive an allocation of capital after the investors receive a defined internal rate of return. As variable consideration, recognition of such fee is deferred until it is probable that a significant reversal in the amount of cumulative revenue will not occur, which is generally upon liquidation of the investment fund. Uncollected amounts are classified as Other assets in the Consolidated Statements of Financial Position.
Investments
Investments consist of loans and equity securities.
Loans
Loans consist of corporate loans that are classified as held for investment (“HFI”) since the Company has the ability and intent to hold the loan in the foreseeable future. These assets are recorded at amortized cost basis on the financial statements. The amortized cost basis is the amount the investment is originated or acquired, adjusted for applicable accrued interest, accretion, or amortization of premium, discount, and net deferred fees or costs, and an allowance for credit losses.
Equity securities
Equity securities consist primarily of investments in common stock of companies and mutual funds. These investments are recognized at fair value with changes in fair value recognized in earnings.
F-25
Significant accounting policies – Insurance Solutions
The material accounting policies applicable to the Insurance Solutions business are described below.
Investments
Investments consist primarily of the following: U.S. government and agency obligations; U.S. state, territories and municipalities obligations, government and agency obligations, corporate, CLOs, corporate loans, asset and mortgage-backed securities, mortgage loans, equity securities, and other invested assets.
Debt securities
The Company accounts for its debt securities at fair value as either AFS or under the fair value option. Classification is dependent on a variety of factors, including expected holding period. The Company makes the accounting policy election at the time of purchase or at eligible remeasurement events.
Unrealized gains and losses for AFS debt securities, calculated as the difference between fair value and amortized cost basis, exclusive of allowances for credit losses, are generally reflected in AOCI. The deferred income tax consequences of unrealized holding gains and losses on AFS securities are also reported in OCI, resulting in a net presentation within OCI. Any component of the overall change in fair value that may be associated with foreign exchange gains and losses on an AFS securities is treated in a manner consistent with the remaining overall change in the instrument’s fair value.
Gains and losses from debt securities under fair value option and sales of an AFS securities that result in gains and losses are recognized in Net gains (losses) from investment activities in the Consolidated Statements of Operations. The gain or loss for AFS debt securities are recognized on a FIFO basis and calculated as the difference between the sale proceeds and the security’s amortized cost basis (reduced by any allowance for credit losses).
Equity securities
Equity securities consist primarily of investments in common stock of companies and mutual funds. These investments are recognized at fair value with changes in fair value recognized in earnings. Certain investments are valued using the net asset value (“NAV”) per share equivalent calculated by the investment manager as a practical expedient to determine an independent fair value.
Mortgage loans
Mortgage loans are classified as HFI and are reported in the Consolidated Statements of Financial Position at their amortized cost basis. The amortized cost basis is the amount the investment is originated or acquired, adjusted for applicable accrued interest, accretion, or amortization of premium, discount, and net deferred fees or costs, and an allowance for credit losses.
Fair value option
The Company may elect the FVO to carry at fair value for certain financial assets and financial liabilities, including certain debt securities.
Other invested assets
Other invested assets include CLOs, asset-backed securities, and corporate loans. CLOs and asset-backed securities are recognized at fair value using the FVO. Corporate loans are recognized as either HFI or FVO.
Derivative instruments
Freestanding derivatives are instruments that the Company has entered into as part of their overall risk management strategies. Such contracts include interest rate swaps to convert floating-rate interest receipts to fixed-rate interest receipts to reduce exposure to interest rate changes. All derivatives are recognized in Derivatives liability and are presented on a gross basis in the Consolidated Statements of Financial Position and measured at fair
F-26
value. Changes in fair value are recorded in Accumulated Other Comprehensive Income as the swaps are in hedging relationships, with changes in fair value reclassified into Interest income in the same period as the hedged transactions affect earnings. Any interest accruals will flow through earnings as adjustments to Interest income. The Company’s derivative financial instruments contain credit risk to the extent that its counterparties may be unable to meet the terms of the agreements. The Company attempts to reduce this risk by limiting its counterparties to major financial institutions with strong credit ratings.
To qualify for hedge accounting, at the inception of the hedging relationship, the Company formally documents its risk management objective and strategy for undertaking the hedging transaction. This documentation identifies how the hedging instrument is expected to mitigate the designated risk related to the hedged item and the method that will be used to retrospectively and prospectively assess the hedge effectiveness. A derivative designated as a hedging instrument must be assessed as being highly effective in offsetting the designated risk of the hedged item. Hedge effectiveness is formally assessed at inception and periodically throughout the life of the hedge accounting relationship.
The Company issues and reinsures products or purchases investments that contain embedded derivatives. If it determines an embedded derivative has economic characteristics not clearly and closely related to the economic characteristics of the host contract, and a separate instrument with the same terms would qualify as a derivative instrument, the embedded derivative is bifurcated from the host contract and accounted for separately, unless the FVO is elected on the host contract. Under the FVO, bifurcation of the embedded derivative is not necessary as the entire contract is carried at fair value with all related gains and losses recognized in Net gains (losses) from investment activities in the Consolidated Statements of Operations. Embedded derivatives are carried at fair value in the Consolidated Statements of Financial Position in the same line item as the host contract.
Additionally, reinsurance agreements written on a funds withheld or modco basis contain embedded derivatives. The Company has determined that the obligation to pay the total return on the assets supporting the funds withheld liability represents a total return swap with a floating rate leg. The fair value of embedded derivatives on funds withheld and modco agreements is computed as the unrealized gain (loss) on the underlying assets and is included within the funds withheld under reinsurance contracts in the Consolidated Statements of Financial Position.
Insurance
The Company’s insurance operations include providing insurance and reinsurance related to LTC, and reinsurance for MYGA products. Insurance contracts are contracts with significant mortality and/or morbidity risks, while investment contracts are contracts without such risks. The MYGA contracts were deemed to be investment contracts as reported as Interest sensitive contract liabilities in the Consolidated Statements of Financial Position. Insurance revenue is comprised primarily of premiums and investment income. For traditional long-duration insurance contracts, the Company reports premiums as revenue when due. Premiums received on MYGA products (a product without significant mortality risk) are not reported as revenue but rather as deposit liabilities. The Company recognizes revenue for charges on these contracts, mostly relating to surrender charges. Interest credited to policyholder accounts is charged to expense.
Future policy benefit reserves represent the present value of future benefits to be paid to or on behalf of policyholders and related expenses less the present value of future net premiums. The liability is measured for each group of contracts (i.e., cohorts) using current cash flow assumptions. Contracts are grouped into cohorts by line of business, product type and cash flow streams, based on the date the policy was acquired (which for the entire LTC portfolio is the date of the acquisition of Ability Insurance). Future policy benefit reserves are adjusted each period because of updating lifetime net premium ratios for differences between actual and expected experience with the retroactive effect of those variances recognized in current period earnings. The Company reviews at least annually in the third quarter, future policy benefit reserves cash flow assumptions, and if the review concludes that the assumptions need to be updated, future policy benefit reserves are adjusted retroactively based on the revised net
F-27
premium ratio using actual historical experience, updated cash flow assumptions, and the locked-in discount rate with the effect of those changes recognized in current period earnings.
As the Company’s LTC business is in run-off, the locked-in discount rate is used for the computation of interest accretion on future policy benefit reserves recognized in earnings. However, cash flows used to estimate future policy benefit reserves are also discounted using an upper-medium grade (i.e., low credit risk) fixed-income instrument yield reflecting the duration characteristics of the liabilities and is updated each reporting period with changes recorded in AOCI. As a result, changes in the current discount rate at each reporting period are recognized as an adjustment to AOCI and not earnings each period, whereas, changes relating to cash flow assumptions are recognized in the Insurance Solutions section of the Consolidated Statements of Operations.
Reinsurance
A reinsurance contract is a type of insurance contract that is issued by an entity (the reinsurer) to compensate another entity (the cedant) for claims arising from insurance contract(s) issued by the cedant.
Consistent with the overall business strategy, the Company assumes certain policy risks written by other insurance companies and cedes insurance risks to reinsurers. Reinsurance accounting is applied for reinsurance transactions when risk transfer provisions have been met. The Company reviews all contractual features, particularly those that may limit the amount of insurance risk to which the reinsurer is subject or features that delay the timely reimbursement of claims. The Company does not have any assumed or ceded reinsurance contracts for the LTC line of business that do not meet risk transfer requirements. As noted above, the assumed MYGA line of business does not meet the risk requirements as noted above and is therefore considered an investment contract under U.S. GAAP.
The Company uses ceded reinsurance contracts in the normal course of business to manage its risk exposure. For each of its reinsurance agreements, cessions under reinsurance agreements do not discharge the Company’s obligations as the primary insurer. Reinsurance assets represent the benefit derived from reinsurance agreements in-force at the reporting date, considering the financial condition of the reinsurer. Amounts recoverable from reinsurers are estimated in accordance with the terms of the relevant reinsurance contract and historical reinsurance recovery information. Amounts recoverable from reinsurers are based on what the Company believes are reasonable estimates and the balance is reported as an asset in the Insurance section of the Consolidated Statements of Financial Position. However, the ultimate amount of the Reinsurance recoverable is not known until all claims are settled.
Ceded reinsurance – Funds withheld with Front Street Re
The Company has a coinsurance with funds withheld arrangement with Front Street Re covering a significant portion of the LTC business (the “Medico” block of policies). Under the funds withheld arrangement, assets are retained by the Company; however, all investment activity pertaining to those assets are passed through to Front Street Re. Investment activity includes any interest income, unrealized gains, and losses, and realized gains and losses from sales on these assets. The liability for this Funds Held agreement is in the liability section of the Insurance section of the Consolidated Statements of Financial Position, and the income statement items related to this contract are in the line item Net investment income (loss) on funds withheld in the Insurance Solutions section of the Consolidated Statements of Operations.
Ceded reinsurance – Modified coinsurance with Vista Life and Casualty Reinsurance Company
The Company also has a modified coinsurance (“Modco”) agreement with Vista Life and Casualty Reinsurance Company (“Vista”). Pursuant to such agreement, the Company retains assets in a designated custody account to support the quota share of the ceded Modco reserves. Similar to a funds withheld arrangement, all investment activity pertaining to those assets are passed through to Vista. Investment activity includes any interest income, unrealized gains, and losses, and realized gains and losses from sales on these assets. The liability for this
F-28
fund held agreement is netted against the reinsurance recoverable of the Insurance section of the Consolidated Statements of Financial Position, and the income statement items related to this contract are in the line item Net investment income (loss) on funds withheld in the Insurance Solutions section of the Consolidated Statements of Operations.
Ceded reinsurance – Embedded derivatives
As the return on receivables or payable balances under the arrangements with Front Street Re and Vista are not clearly and closely related to the host insurance contract, these contracts are deemed to contain embedded derivatives, which are measured at fair value based on the fair value of the assets held by the Company in designated portfolios to support the underlying liability. The fair value of the embedded derivatives for the funds withheld and Modco agreements are included in the Funds held under reinsurance contracts (Front Street Re) and reinsurance contract assets line items (Vista) in the Consolidated Statements of Financial Position, respectively.
Deferred acquisition costs (“DAC”)
The Company incurs significant costs in connection with its renewals for its MYGA business. Costs that are related directly to the successful acquisition or renewal of MYGA contracts are capitalized as DAC. Such costs for the Company are comprised mostly of incremental direct costs of contract acquisitions and renewals, which for the Company are primarily commissions. DAC related to products with significant revenue streams from sources other than investment of the policyholder funds or with significant surrender charges are amortized to expense on a straight-line basis, at the individual level over the expected term of the related contract. The amortization of deferred acquisition costs is recorded within Amortization of deferred acquisition costs in the Consolidated Statements of Operations.
All other acquisition-related costs, as well as all indirect costs, are expensed as incurred.
Note 3. Business Combinations
Acquisition of Ovation
On July 5, 2023, the Company completed the transactions under its membership interest and asset purchase agreement (the “Ovation Purchase Agreement”) to acquire 100 % of the interests of Ovation Fund Management II LLC (“Ovation”), a Texas-based specialty-finance focused asset manager, and in connection therewith ML Management became the investment advisor to the platform. Ovation’s platform is focused on investments in commercial lending, real estate lending, consumer finance and litigation finance, and contributes to the Company’s fee related earnings. The Company paid $0.3 million in cash and issued an aggregate of 3,186,398 common shares with a fair value of $6.8 million for a total purchase consideration of $7.1 million. On closing of the acquisition, Ovation’s line of credit remained in place and had an outstanding balance of $1.9 million. Management of the Ovation platform is part of the Company’s Asset Management segment.
The acquisition of Ovation was accounted for as a business combination and the Company was identified as the accounting acquirer. The acquisition of Ovation was accounted for using the acquisition method. The acquisition resulted in the Company recording excess consideration paid of $1.0 million to goodwill and is primarily attributable to expected synergies of the combined businesses and the acquisition of an assembled workforce knowledgeable of the asset management industry. The goodwill and intangible asset resulting from the acquisition are tax deductible.
F-29
The following table summarizes information related to this acquisition as of the acquisition date.
| Fair value of consideration transferred | ||||||||
| Common stock | $ | |||||||
| Cash | ||||||||
| Total | $ | |||||||
| Recognized amounts of identifiable assets acquired and liabilities assumed: | ||||||||
| Assets: | ||||||||
| Cash | $ | |||||||
| Accounts receivable | ||||||||
| Deferred incentive fees | ||||||||
| Prepaid expenses | ||||||||
| ROU asset | ||||||||
| Intangible asset – Investment Management Agreement | ||||||||
| Liabilities: | ||||||||
| Accounts payable | ||||||||
| Interest payable | ||||||||
| Lease liability | ||||||||
| Line of credit | ||||||||
| Total identifiable net assets | ||||||||
| Goodwill | $ | |||||||
Total transaction costs related to the Ovation acquisition of $0.9 million were expensed during the year ended December 31, 2023. These costs are included within Transaction costs in the Consolidated Statements of Operations.
As part of the acquisition of Ovation, an intangible asset representing the Investment Management Agreement for the Ovation sponsored funds – Ovation Alternative Income Fund-A LP and Ovation Alternative Income Fund LP was recognized. For tax purposes, both the investment management agreement and goodwill are considered deductible for tax purposes. The Investment Management Agreement has been deemed to have a useful life of ten years . This useful life has been revised down to four years at December 31, 2024. See further detail on the impairment assessment of this intangible asset in Note 11 Goodwill and intangible assets. The line of credit was repaid during the year ended December 31, 2023.
As of July 5, 2023, Ovation’s financial results are reflected in these Consolidated Financial Statements. Ovation’s revenues of $3.5 million and net loss of $0.9 million are included in the Consolidated Statement of Operations for the year ended December 31, 2023.
F-30
Note 4. Net gains (losses) from investment activities
The table below summarizes the net gains (losses) from investment activities:
| For the years ended December 31, | 2024 | 2023 | ||||||||||||||||||||||||||||||||||||||||||||||||
| Net realized gains (losses) | Net unrealized gains (losses) | Credit Losses | Total | Net realized gains (losses) | Net unrealized gains (losses) | Credit losses | Total | |||||||||||||||||||||||||||||||||||||||||||
| Asset Management | ||||||||||||||||||||||||||||||||||||||||||||||||||
| Debt securities: | ||||||||||||||||||||||||||||||||||||||||||||||||||
| Corporate | $ | $ | $ | $ | $ | ( | $ | $ | $ | ( | ||||||||||||||||||||||||||||||||||||||||
| Equity securities | ( | ( | ( | ( | ||||||||||||||||||||||||||||||||||||||||||||||
| Contingent value right | ||||||||||||||||||||||||||||||||||||||||||||||||||
| Debt obligation | ( | ( | ||||||||||||||||||||||||||||||||||||||||||||||||
| Net gains (losses) from investment activities - Asset Management | ( | ( | ( | ( | ||||||||||||||||||||||||||||||||||||||||||||||
| Investments of consolidated VIEs | ( | |||||||||||||||||||||||||||||||||||||||||||||||||
| Notes payable of consolidated VIEs | ( | ( | ||||||||||||||||||||||||||||||||||||||||||||||||
| Net gains (losses) from investment activities - Asset Management including consolidated VIEs | $ | $ | ( | $ | $ | ( | $ | $ | ( | $ | $ | ( | ||||||||||||||||||||||||||||||||||||||
| Insurance Solutions | ||||||||||||||||||||||||||||||||||||||||||||||||||
| Debt securities: | ||||||||||||||||||||||||||||||||||||||||||||||||||
| U.S. state, territories and municipalities | $ | ( | $ | ( | $ | $ | ( | $ | ( | $ | $ | $ | ||||||||||||||||||||||||||||||||||||||
| Other government and agency | ( | ( | ||||||||||||||||||||||||||||||||||||||||||||||||
| Corporate | ( | ( | ( | |||||||||||||||||||||||||||||||||||||||||||||||
| Asset and mortgage- backed securities | ( | |||||||||||||||||||||||||||||||||||||||||||||||||
| Corporate loans | ( | ( | ( | |||||||||||||||||||||||||||||||||||||||||||||||
| Mortgage loans | ( | ( | ( | ( | ( | |||||||||||||||||||||||||||||||||||||||||||||
| Equity securities | ( | ( | ||||||||||||||||||||||||||||||||||||||||||||||||
| Other invested assets | ( | ( | ||||||||||||||||||||||||||||||||||||||||||||||||
| Net gains (losses) from investment activities - Insurance Solutions | ( | ( | ( | ( | ( | |||||||||||||||||||||||||||||||||||||||||||||
| Investments of consolidated VIEs | ( | ( | ( | ( | ||||||||||||||||||||||||||||||||||||||||||||||
| Net gains (losses) from investment activities - Insurance Solutions including consolidated VIEs | $ | ( | $ | ( | $ | ( | $ | ( | $ | $ | $ | ( | $ | |||||||||||||||||||||||||||||||||||||
F-31
Note 5. Net investment income
Net investment income for the Insurance Solutions segment is comprised primarily of Interest income and Dividend income from common and preferred stock. The table below summarizes Net investment income:
| For the years ended December 31, | 2024 | 2023 | ||||||||||||
| Debt securities | $ | $ | ||||||||||||
| Corporate loans | ||||||||||||||
| Mortgage loans | ||||||||||||||
| Equity securities | ||||||||||||||
| Other | ||||||||||||||
| Gross investment income: | ||||||||||||||
| Less: | ||||||||||||||
| Investment expenses | ( | ( | ||||||||||||
| Net investment income | $ | $ | ||||||||||||
| Investment income - consolidated VIEs | ||||||||||||||
| Net investment income - Insurance Solutions including consolidated VIEs | $ | $ | ||||||||||||
Note 6. Investments
The following table outlines the carrying value of the Company’s investments:
| As of | December 31, 2024 | December 31, 2023 | ||||||||||||
| Asset Management | ||||||||||||||
| Corporate loans | $ | $ | ||||||||||||
| Equity securities | ||||||||||||||
| Equity method | ||||||||||||||
| Total investments - Asset Management | $ | $ | ||||||||||||
| Insurance Solutions | ||||||||||||||
| Debt securities | $ | $ | ||||||||||||
| Corporate loans | ||||||||||||||
| Mortgage loans | ||||||||||||||
| Equity securities | ||||||||||||||
| Other invested assets | ||||||||||||||
| Total investments - Insurance Solutions | $ | $ | ||||||||||||
| Corporate loans of consolidated VIEs | ||||||||||||||
| Equity securities of consolidated VIEs | ||||||||||||||
| Total investments - Insurance Solutions, including consolidated VIEs | ||||||||||||||
| Total investments | $ | $ | ||||||||||||
F-32
Financial assets
The following tables summarize the measurement categories of financial assets held by the Company as of December 31, 2024, and December 31, 2023:
| As of December 31, 2024 | Fair value | Amortized cost | Fair value option | Total(1) | ||||||||||||||||||||||
| Financial assets | ||||||||||||||||||||||||||
| Asset Management | ||||||||||||||||||||||||||
| Corporate loans | $ | — | $ | $ | — | $ | ||||||||||||||||||||
| Equity securities | — | — | ||||||||||||||||||||||||
Total financial assets - Asset Management(2) | $ | $ | $ | — | $ | |||||||||||||||||||||
| Insurance Solutions | ||||||||||||||||||||||||||
| Debt securities: | ||||||||||||||||||||||||||
| U.S. government and agency | $ | $ | — | $ | — | $ | ||||||||||||||||||||
| U.S. state, territories and municipalities | — | |||||||||||||||||||||||||
| Other government and agency | — | — | ||||||||||||||||||||||||
| Corporate | — | |||||||||||||||||||||||||
| Asset and mortgage-backed securities | — | |||||||||||||||||||||||||
| Corporate loans | — | — | ||||||||||||||||||||||||
| Mortgage loans | — | — | ||||||||||||||||||||||||
| Equity securities | — | — | ||||||||||||||||||||||||
Other invested assets(3) | ||||||||||||||||||||||||||
| Total financial assets - Insurance Solutions | $ | $ | $ | $ | ||||||||||||||||||||||
| Corporate loans of consolidated VIEs | — | — | ||||||||||||||||||||||||
| Equity securities of consolidated VIEs | — | — | ||||||||||||||||||||||||
| Total financial assets - Insurance Solutions, including consolidated VIEs | ||||||||||||||||||||||||||
| Total financial assets | $ | $ | $ | $ | ||||||||||||||||||||||
_______________
(1)The methodologies used in determining the values of investments are described in Note 2 Summary of significant accounting policies.
(2)The MLC US Holdings Credit Facility (as hereinafter defined) is collateralized by assets held by MLC US Holdings, including assets totaling $31.2 million as of December 31, 2024.
(3)Other invested assets primarily include structured securities and loan receivables.
F-33
| As of December 31, 2023 | Fair value | Amortized cost | Fair value option | Total(1) | ||||||||||||||||||||||
| Financial assets | ||||||||||||||||||||||||||
| Asset Management | ||||||||||||||||||||||||||
| Corporate loans | $ | — | $ | $ | — | $ | ||||||||||||||||||||
Equity securities(2) | — | — | ||||||||||||||||||||||||
Total financial assets - Asset Management(3) | $ | $ | $ | — | $ | |||||||||||||||||||||
| Insurance Solutions | ||||||||||||||||||||||||||
| Debt securities: | ||||||||||||||||||||||||||
| U.S. government and agency | $ | $ | — | $ | — | $ | ||||||||||||||||||||
| U.S. state, territories and municipalities | — | |||||||||||||||||||||||||
| Other government and agency | — | — | ||||||||||||||||||||||||
| Corporate | — | |||||||||||||||||||||||||
| Asset and mortgage-backed securities | — | |||||||||||||||||||||||||
| Corporate loans | — | — | ||||||||||||||||||||||||
| Mortgage loans | — | — | ||||||||||||||||||||||||
| Equity securities | — | — | ||||||||||||||||||||||||
Other invested assets(4) | ||||||||||||||||||||||||||
| Total financial assets - Insurance Solutions | $ | $ | $ | $ | ||||||||||||||||||||||
| Corporate loans of consolidated VIEs | — | — | ||||||||||||||||||||||||
| Total financial assets - Insurance Solutions, including consolidated VIEs | ||||||||||||||||||||||||||
| Total financial assets | $ | $ | $ | $ | ||||||||||||||||||||||
__________________
(1)The methodologies used in determining the values of investments are described in Note 2 Summary of significant accounting policies.
(2)On April 29, 2022, ML Management seeded Opportunistic Credit Interval Fund (“OCIF”), a closed-end, diversified management investment company $0.1 million. On October 5, 2022, ML Management invested an additional $4.0 million in OCIF. Investment in OCIF was reclassified from equity method Investment to equity securities at September 30, 2023 due to the decrease in ownership interest to below 20%.
(3)The MLC US Holdings Credit Facility (as hereinafter defined) is collateralized by assets held by MLC US Holdings, including assets totaling $27.8 million as of December 31, 2023.
(4)Other invested assets primarily include structured securities and loan receivables.
Available-for-sale – Insurance Solutions
The following table represents the amortized cost, gross unrealized gains, gross unrealized losses, and fair value of AFS investments by asset type:
| As of December 31, 2024 | Cost or amortized cost | Gross unrealized gains | Gross unrealized losses | Fair value(1) | ||||||||||||||||||||||
| Financial assets | ||||||||||||||||||||||||||
| Insurance Solutions | ||||||||||||||||||||||||||
| Debt securities: | ||||||||||||||||||||||||||
| U.S. government and agency | $ | $ | $ | ( | $ | |||||||||||||||||||||
| U.S. state, territories and municipalities | ( | |||||||||||||||||||||||||
| Corporate | ( | |||||||||||||||||||||||||
| Asset and mortgage-backed securities | ( | |||||||||||||||||||||||||
| Other invested assets | ( | |||||||||||||||||||||||||
| Total AFS — Insurance Solutions | $ | $ | $ | ( | $ | |||||||||||||||||||||
F-34
| As of December 31, 2023 | Cost or amortized cost | Gross unrealized gains | Gross unrealized losses | Fair value(1) | ||||||||||||||||||||||
| Financial assets | ||||||||||||||||||||||||||
| Insurance Solutions | ||||||||||||||||||||||||||
| Debt securities: | ||||||||||||||||||||||||||
| U.S. government and agency | $ | $ | $ | ( | $ | |||||||||||||||||||||
| U.S. state, territories and municipalities | ( | |||||||||||||||||||||||||
| Corporate | ( | |||||||||||||||||||||||||
| Asset and mortgage-backed securities | ( | |||||||||||||||||||||||||
| Other invested assets | ( | |||||||||||||||||||||||||
| Total AFS — Insurance Solutions | $ | $ | $ | ( | $ | |||||||||||||||||||||
_______________
(1)There is no
The maturity distribution for AFS securities is as follows:
| Tuesday, December 31, 2024 | ||||||||||||||
| Cost or amortized cost | Fair value | |||||||||||||
| Due in one year or less | $ | $ | ||||||||||||
| Due after one year through five years | ||||||||||||||
| Due after five years through ten years | ||||||||||||||
| Due after ten years | ||||||||||||||
| Total AFS securities | $ | $ | ||||||||||||
Actual maturities can differ from contractual maturities as borrowers may have the right to call or prepay obligations with or without call or prepayment penalties.
The following table provides information about AFS securities for which an allowance for credit losses has not been recorded aggregated by category and length of time that securities have been continuously in an unrealized loss position:
| Less than 12 months | 12 months or more | Total | ||||||||||||||||||||||||||||||||||||
| As of December 31, 2024 | Fair value | Unrealized losses | Fair value | Unrealized losses | Fair value | Unrealized losses | ||||||||||||||||||||||||||||||||
| Insurance Solutions | ||||||||||||||||||||||||||||||||||||||
| Debt securities: | ||||||||||||||||||||||||||||||||||||||
| U.S. government and agency | $ | $ | ( | $ | $ | ( | $ | $ | ( | |||||||||||||||||||||||||||||
| U.S. state, territories and municipalities | ( | ( | ||||||||||||||||||||||||||||||||||||
| Corporate | ( | ( | ( | |||||||||||||||||||||||||||||||||||
| Asset and mortgage-backed securities | ( | ( | ( | |||||||||||||||||||||||||||||||||||
| Other invested assets | ( | ( | ||||||||||||||||||||||||||||||||||||
| Total AFS securities in a continuous loss position | $ | $ | ( | $ | $ | ( | $ | $ | ( | |||||||||||||||||||||||||||||
F-35
| Less than 12 months | 12 months or more | Total | ||||||||||||||||||||||||||||||||||||
| As of December 31, 2023 | Fair value | Unrealized losses | Fair value | Unrealized losses | Fair value | Unrealized losses | ||||||||||||||||||||||||||||||||
| Insurance Solutions | ||||||||||||||||||||||||||||||||||||||
| Debt securities: | ||||||||||||||||||||||||||||||||||||||
| U.S. government and agency | $ | $ | $ | $ | ( | $ | $ | ( | ||||||||||||||||||||||||||||||
| U.S. state, territories and municipalities | ( | ( | ||||||||||||||||||||||||||||||||||||
| Corporate | ( | ( | ( | |||||||||||||||||||||||||||||||||||
| Asset and mortgage-backed securities | ( | ( | ( | |||||||||||||||||||||||||||||||||||
| Other invested assets | ( | ( | ||||||||||||||||||||||||||||||||||||
| Total AFS securities in a continuous loss position | $ | $ | ( | $ | $ | ( | $ | $ | ( | |||||||||||||||||||||||||||||
Unrealized gains and losses can be created by changing interest rates or several other factors, including changing credit spreads. The Company had gross unrealized losses on below investment grade AFS securities of $24.6 million and $30.9 million as of December 31, 2024 and December 31, 2023, respectively. The single largest unrealized loss on AFS securities was $1.2 million and $1.3 million as of December 31, 2024, and December 31, 2023, respectively. The Company had 359 and 286 positions in an unrealized loss position as of December 31, 2024, and December 31, 2023, respectively.
As of December 31, 2024, and December 31, 2023, AFS securities in an unrealized loss position for 12 months or more consisted of 216 and 261 debt securities. These debt securities primarily relate to Corporate, and U.S. state, municipal and political subdivisions securities, which have depressed values due primarily to an increase in interest rates since the purchase of these securities. Unrealized losses were not recognized in net income on these debt securities since the Company neither intends to sell the securities nor does it believe that it is more likely than not that it will be required to sell these securities before recovery of their cost or amortized cost basis. For securities with significant declines in value, individual security level analysis was performed utilizing underlying collateral default expectations, market data, and industry analyst reports.
Mortgage and corporate loans
Mortgage and corporate loans consist of the following:
F-36
| December 31, 2024 | December 31, 2023 | |||||||||||||
| Asset Management | ||||||||||||||
| Corporate loans | $ | $ | ||||||||||||
| Total corporate loans | ||||||||||||||
| Allowance for credit losses | ( | ( | ||||||||||||
| Total corporate loans, net of allowance for credit losses | $ | $ | ||||||||||||
| Insurance Solutions | ||||||||||||||
| Commercial real estate mortgage loans | $ | $ | ||||||||||||
| Multi-family mortgage loans | ||||||||||||||
| Other invested assets - corporate loans | ||||||||||||||
| Total mortgage and corporate loans | ||||||||||||||
| Allowance for credit losses | ( | ( | ||||||||||||
| Total mortgage and other invested assets - corporate loans, net of allowance for credit losses | $ | $ | ||||||||||||
The maturity distribution for commercial real estate, multi-family mortgage loans and corporate loans were as follows as of December 31, 2024:
| Asset Management | Corporate loans | |||||||
| 2025 | $ | |||||||
| 2026 | ||||||||
| 2027 | ||||||||
| 2028 | ||||||||
| 2029 and thereafter | ||||||||
| Total | $ | |||||||
| Insurance Solutions | Commercial real estate mortgage loans | Multi-family mortgage loans | Other invested assets - corporate loans | Total loans | ||||||||||||||||||||||
| 2025 | $ | $ | $ | — | $ | |||||||||||||||||||||
| 2026 | — | |||||||||||||||||||||||||
| 2027 | — | |||||||||||||||||||||||||
| 2028 | — | — | ||||||||||||||||||||||||
| 2029 and thereafter | — | — | ||||||||||||||||||||||||
| Total | $ | $ | $ | $ | ||||||||||||||||||||||
Actual maturities could differ from contractual maturities, because borrowers may have the right to prepay (with or without prepayment penalties) and loans may be refinanced.
F-37
The carrying value by credit risk and loan type were as follows:
| Asset Management | December 31, | |||||||||||||||||||||||||
| Loans – carrying value by credit risk | 2024 | 2023 | ||||||||||||||||||||||||
| Level 1 | $ | % | $ | % | ||||||||||||||||||||||
| Level 2 | — | — | % | — | — | % | ||||||||||||||||||||
| Level 3 | — | — | % | — | — | % | ||||||||||||||||||||
| Level 4 | — | — | % | — | — | % | ||||||||||||||||||||
| Level 5 | — | — | % | — | — | % | ||||||||||||||||||||
| Total by credit risk | $ | 100 | % | $ | 100 | % | ||||||||||||||||||||
| Asset Management | December 31, | |||||||||||||||||||||||||
| Loans – carrying value by loan type | 2024 | 2023 | ||||||||||||||||||||||||
| Corporate loans | $ | % | $ | % | ||||||||||||||||||||||
| Total by loan type | $ | 100 | % | $ | 100 | % | ||||||||||||||||||||
| Insurance Solutions | December 31, | |||||||||||||||||||||||||
| Loans – carrying value by credit risk | 2024 | 2023 | ||||||||||||||||||||||||
| Level 1 | $ | % | $ | % | ||||||||||||||||||||||
| Level 2 | % | % | ||||||||||||||||||||||||
| Level 3 | % | % | ||||||||||||||||||||||||
| Level 4 | — | — | % | % | ||||||||||||||||||||||
| Level 5 | % | % | ||||||||||||||||||||||||
| Total by credit risk | $ | 100 | % | $ | 100 | % | ||||||||||||||||||||
| Insurance Solutions | December 31, | |||||||||||||||||||||||||
| Loans – carrying value by loan type | 2024 | 2023 | ||||||||||||||||||||||||
| Commercial real estate mortgage loans | $ | % | $ | % | ||||||||||||||||||||||
| Multi-family mortgage loans | % | % | ||||||||||||||||||||||||
| Other invested assets - corporate loans | % | % | ||||||||||||||||||||||||
| Total by loan type | $ | 100 | % | $ | 100 | % | ||||||||||||||||||||
The following table summarizes the activity related to the allowance for credit losses for the years ended December 31, 2024 and 2023:
| Asset Management | Corporate loans | Total loans | ||||||||||||
| Balance, December 31, 2023 | $ | $ | ||||||||||||
| Charge-offs | — | |||||||||||||
| Recoveries | — | |||||||||||||
| Provision for credit losses | — | |||||||||||||
| Balance, December 31, 2024 | $ | $ | ||||||||||||
| Insurance Solutions | Commercial real estate mortgage loans | Multi-family mortgage loans | Corporate loans | Total loans | ||||||||||||||||||||||
| Balance, December 31, 2023 | $ | $ | $ | $ | ||||||||||||||||||||||
| Charge-offs | — | — | — | |||||||||||||||||||||||
| Recoveries | — | — | — | |||||||||||||||||||||||
| Provision for credit losses | ( | |||||||||||||||||||||||||
| Balance, December 31, 2024 | $ | $ | $ | $ | ||||||||||||||||||||||
F-38
| Asset Management | Corporate loans | Total loans | ||||||||||||
| Balance, December 31, 2022 | $ | $ | ||||||||||||
| Charge-offs | — | |||||||||||||
| Recoveries | — | |||||||||||||
| Provision for credit losses | — | |||||||||||||
| Balance, December 31, 2023 | $ | $ | ||||||||||||
| Insurance Solutions | Commercial real estate mortgage loans | Multi-family mortgage loans | Corporate loans | Total loans | ||||||||||||||||||||||
| Balance, December 31, 2022 | $ | $ | $ | $ | ||||||||||||||||||||||
| Charge-offs | — | — | — | |||||||||||||||||||||||
| Recoveries | — | — | — | |||||||||||||||||||||||
| Provision for credit losses | ( | |||||||||||||||||||||||||
| Balance, December 31, 2023 | $ | $ | $ | $ | ||||||||||||||||||||||
The following table presents an analysis of past-due loans:
| December 31, 2024 | ||||||||||||||||||||||||||||||||||||||
| Asset Management | Loans 30-59 days past due | Loans 60-89 days past due | Loans 90 days or more past due | Nonaccrual loans | Current loans | Total loans | ||||||||||||||||||||||||||||||||
| Corporate loans | $ | — | $ | — | $ | — | $ | $ | $ | |||||||||||||||||||||||||||||
| Total corporate loans | $ | $ | $ | $ | $ | $ | ||||||||||||||||||||||||||||||||
| December 31, 2024 | ||||||||||||||||||||||||||||||||||||||
| Insurance Solutions | Loans 30-59 days past due | Loans 60-89 days past due | Loans 90 days or more past due | Nonaccrual loans | Current loans | Total loans | ||||||||||||||||||||||||||||||||
| Commercial real estate mortgage loans | $ | — | $ | — | $ | — | $ | $ | $ | |||||||||||||||||||||||||||||
| Multi-family mortgage loans | — | — | — | |||||||||||||||||||||||||||||||||||
| Other invested assets - corporate loans | — | — | — | — | ||||||||||||||||||||||||||||||||||
| Total mortgage and other invested assets - corporate loans | $ | $ | $ | $ | $ | $ | ||||||||||||||||||||||||||||||||
F-39
| December 31, 2023 | ||||||||||||||||||||||||||||||||||||||
| Asset Management | Loans 30-59 days past due | Loans 60-89 days past due | Loans 90 days or more past due | Nonaccrual loans | Current loans | Total loans | ||||||||||||||||||||||||||||||||
| Corporate loans | $ | — | $ | — | $ | — | $ | $ | $ | |||||||||||||||||||||||||||||
| Total corporate loans | $ | $ | $ | $ | $ | $ | ||||||||||||||||||||||||||||||||
| December 31, 2023 | ||||||||||||||||||||||||||||||||||||||
| Insurance Solutions | Loans 30-59 days past due | Loans 60-89 days past due | Loans 90 days or more past due | Nonaccrual loans | Current loans | Total loans | ||||||||||||||||||||||||||||||||
| Commercial real estate mortgage loans | $ | — | $ | — | $ | — | $ | $ | $ | |||||||||||||||||||||||||||||
| Multi-family mortgage loans | — | — | — | |||||||||||||||||||||||||||||||||||
| Other invested assets - corporate loans | — | — | — | — | ||||||||||||||||||||||||||||||||||
| Total mortgage and other invested assets - corporate loans | $ | $ | $ | $ | $ | $ | ||||||||||||||||||||||||||||||||
The Company designates individually evaluated loans on nonaccrual status as collateral-dependent loans, as well as other loans that management of the Company designates as having higher risk. Collateral dependent loans are loans for which the repayment is expected to be provided substantially through the operation or sale of the collateral and the borrower is experiencing financial difficulty. These loans do not share common risk characteristics and are not included within the collectively evaluated loans for determining the allowance for credit losses.
The following represents total nonaccrual loans:
| December 31, 2024 | ||||||||||||||||||||
| Insurance Solutions | Nonaccrual loans with no allowance | Nonaccrual loans with an allowance | Total nonaccrual loans | |||||||||||||||||
| Commercial real estate mortgage loans | $ | — | $ | $ | ||||||||||||||||
| Multi-family mortgage loans | — | |||||||||||||||||||
| Other invested assets - corporate loans | — | — | ||||||||||||||||||
| Total loans | $ | $ | $ | |||||||||||||||||
| December 31, 2023 | ||||||||||||||||||||
| Insurance Solutions | Nonaccrual loans with no allowance | Nonaccrual loans with an allowance | Total nonaccrual loans | |||||||||||||||||
| Commercial real estate mortgage loans | $ | — | $ | $ | ||||||||||||||||
| Multi-family mortgage loans | — | |||||||||||||||||||
| Other invested assets - corporate loans | — | — | ||||||||||||||||||
| Total loans | $ | $ | $ | |||||||||||||||||
F-40
The following represents accrued interest receivables written off:
| For the year ended | December 31, 2024 | December 31, 2023 | ||||||||||||
| Insurance Solutions | ||||||||||||||
| Commercial real estate mortgage loans | $ | $ | ||||||||||||
| Multi-family mortgage loans | ||||||||||||||
| Other invested assets - corporate loans | ||||||||||||||
| Total accrued interest receivables written off | $ | $ | ||||||||||||
F-41
The following table represents the portfolio of mortgage and corporate loans by origination year as of December 31, 2024 and 2023:
| Performance status as of December 31, 2024 | 2024 | 2023 | 2022 | 2021 | 2020 | Prior | Total | |||||||||||||||||||||||||||||||||||||
| Asset Management | ||||||||||||||||||||||||||||||||||||||||||||
| Corporate loans | ||||||||||||||||||||||||||||||||||||||||||||
| Level 1 | $ | — | $ | — | $ | — | $ | — | $ | $ | — | $ | ||||||||||||||||||||||||||||||||
| Level 2 | — | — | — | — | — | — | ||||||||||||||||||||||||||||||||||||||
| Level 3 | — | — | — | — | — | — | ||||||||||||||||||||||||||||||||||||||
| Level 4 | — | — | — | — | — | — | ||||||||||||||||||||||||||||||||||||||
| Level 5 | — | — | — | — | — | — | ||||||||||||||||||||||||||||||||||||||
| Total corporate loans | $ | — | $ | — | $ | — | $ | — | $ | $ | — | $ | ||||||||||||||||||||||||||||||||
| Insurance Solutions | ||||||||||||||||||||||||||||||||||||||||||||
| Commercial real estate loans | ||||||||||||||||||||||||||||||||||||||||||||
| Level 1 | $ | — | $ | $ | — | $ | — | $ | — | $ | — | $ | ||||||||||||||||||||||||||||||||
| Level 2 | — | — | ||||||||||||||||||||||||||||||||||||||||||
| Level 3 | — | — | — | — | — | |||||||||||||||||||||||||||||||||||||||
| Level 4 | — | — | — | — | — | — | ||||||||||||||||||||||||||||||||||||||
| Level 5 | — | — | ||||||||||||||||||||||||||||||||||||||||||
| Total commercial real estate loans | ||||||||||||||||||||||||||||||||||||||||||||
| Multi-family loans | ||||||||||||||||||||||||||||||||||||||||||||
| Level 1 | — | — | — | — | — | — | ||||||||||||||||||||||||||||||||||||||
| Level 2 | — | — | ||||||||||||||||||||||||||||||||||||||||||
| Level 3 | — | — | — | — | — | |||||||||||||||||||||||||||||||||||||||
| Level 4 | — | — | — | — | — | — | ||||||||||||||||||||||||||||||||||||||
| Level 5 | — | — | — | |||||||||||||||||||||||||||||||||||||||||
| Total multi-family loans | ||||||||||||||||||||||||||||||||||||||||||||
| Other invested assets - corporate loans | ||||||||||||||||||||||||||||||||||||||||||||
| Level 1 | — | — | ||||||||||||||||||||||||||||||||||||||||||
| Level 2 | — | — | — | — | — | — | ||||||||||||||||||||||||||||||||||||||
| Level 3 | — | — | — | — | — | — | ||||||||||||||||||||||||||||||||||||||
| Level 4 | — | — | — | — | — | — | ||||||||||||||||||||||||||||||||||||||
| Level 5 | — | — | — | — | — | — | ||||||||||||||||||||||||||||||||||||||
| Total other invested assets - corporate loans | ||||||||||||||||||||||||||||||||||||||||||||
| Total mortgage and corporate loans | $ | $ | $ | $ | $ | $ | $ | |||||||||||||||||||||||||||||||||||||
F-42
| Performance status as of December 31, 2023 | 2023 | 2022 | 2021 | 2020 | 2019 | Prior | Total | |||||||||||||||||||||||||||||||||||||
| Asset Management | ||||||||||||||||||||||||||||||||||||||||||||
| Corporate loans | ||||||||||||||||||||||||||||||||||||||||||||
| Level 1 | $ | — | $ | — | $ | — | $ | $ | — | $ | — | $ | ||||||||||||||||||||||||||||||||
| Level 2 | — | — | — | — | — | — | ||||||||||||||||||||||||||||||||||||||
| Level 3 | — | — | — | — | — | — | ||||||||||||||||||||||||||||||||||||||
| Level 4 | — | — | — | — | — | — | ||||||||||||||||||||||||||||||||||||||
| Level 5 | — | — | — | — | — | — | ||||||||||||||||||||||||||||||||||||||
| Total corporate loans | $ | $ | $ | $ | $ | $ | $ | |||||||||||||||||||||||||||||||||||||
| Insurance Solutions | ||||||||||||||||||||||||||||||||||||||||||||
| Commercial real estate loans | ||||||||||||||||||||||||||||||||||||||||||||
| Level 1 | $ | $ | — | $ | — | $ | — | $ | — | $ | — | $ | ||||||||||||||||||||||||||||||||
| Level 2 | — | — | ||||||||||||||||||||||||||||||||||||||||||
| Level 3 | — | — | — | |||||||||||||||||||||||||||||||||||||||||
| Level 4 | — | — | — | — | — | — | ||||||||||||||||||||||||||||||||||||||
| Level 5 | — | — | — | — | — | |||||||||||||||||||||||||||||||||||||||
| Total commercial real estate loans | ||||||||||||||||||||||||||||||||||||||||||||
| Multi-family loans | ||||||||||||||||||||||||||||||||||||||||||||
| Level 1 | — | — | — | — | — | — | — | |||||||||||||||||||||||||||||||||||||
| Level 2 | — | — | ||||||||||||||||||||||||||||||||||||||||||
| Level 3 | — | — | — | — | — | |||||||||||||||||||||||||||||||||||||||
| Level 4 | — | — | — | — | — | — | ||||||||||||||||||||||||||||||||||||||
| Level 5 | — | — | — | — | ||||||||||||||||||||||||||||||||||||||||
| Total multi-family loans | ||||||||||||||||||||||||||||||||||||||||||||
| Other invested assets - corporate loans | ||||||||||||||||||||||||||||||||||||||||||||
| Level 1 | — | — | — | |||||||||||||||||||||||||||||||||||||||||
| Level 2 | — | — | — | — | — | — | ||||||||||||||||||||||||||||||||||||||
| Level 3 | — | — | — | — | — | — | ||||||||||||||||||||||||||||||||||||||
| Level 4 | — | — | — | — | — | — | ||||||||||||||||||||||||||||||||||||||
| Level 5 | — | — | — | — | — | — | ||||||||||||||||||||||||||||||||||||||
| Total other invested assets - corporate loans | ||||||||||||||||||||||||||||||||||||||||||||
| Total mortgage and corporate loans | $ | $ | $ | $ | $ | $ | $ | |||||||||||||||||||||||||||||||||||||
The following represents the carrying value of collateral-dependent loans of the Company as of December 31, 2024 and December 31, 2023:
| December 31, 2024 | December 31, 2023 | |||||||||||||
| Commercial real estate mortgage loans | $ | $ | ||||||||||||
The Company maintains a separate reserve for credit losses on off-balance sheet credit exposures, including unfunded loan commitments, which is included in Accrued expenses and other liabilities on the Consolidated
F-43
Statements of Financial Position. The reserve for credit losses on off-balance sheet credit exposures is adjusted as a provision for credit losses in the income statement. The estimate includes consideration of the likelihood that funding will occur and an estimate of expected credit losses on commitments expected to be funded over its estimated life, utilizing the same models and approaches for the Company's other loan portfolio segments described above, as these unfunded commitments share similar risk characteristics as its loan portfolio segments. The unfunded off-balance sheet credit line commitments for Corporate Loans accounted for as HFI was $1.4 million for Asset Management and $4.7 million for Insurance Solutions as of December 31, 2024 (December 31, 2023: $1.4 million and $13.0 million, for Asset Management and Insurance Solutions, respectively).
The liability for credit losses on off-balance sheet credit exposures for these loans included in Accrued expenses and other liabilities was less than $0.1
Note 7. Derivatives
The Company uses derivative instruments to manage interest rate risk. See Note 2 Summary of significant accounting policies and Note 9 Fair value measurements for a description of our accounting policies for derivatives and for information about the fair value hierarchy for derivatives.
The following table presents the notional amount and fair value of freestanding derivative instruments:
| December 31, 2024 | December 31, 2023 | |||||||||||||||||||||||||||||||||||||
| Notional amount | Assets | Liabilities | Notional amount | Assets | Liabilities | |||||||||||||||||||||||||||||||||
| Derivatives designated as hedges | ||||||||||||||||||||||||||||||||||||||
| Interest rate swaps | $ | $ | — | $ | $ | $ | — | $ | ||||||||||||||||||||||||||||||
Derivatives designated as hedges
Cash flow hedges
The Company uses interest rate swaps to convert floating-rate interest receipts to fixed-rate interest receipts to reduce exposure to interest rate changes. The interest rate swaps will expire by October 2036. During the year ended December 31, 2024, the Company reported losses of $5.2 million in OCI associated with these hedges. There were no amounts deemed ineffective during the year ended December 31, 2024. As of December 31, 2024, $0.9 million is expected to be reclassified into expense as part as earnings within the next 12 months.
Embedded derivatives
The Company has embedded derivatives which are required to be separated from their host contracts and reported as derivatives. Host contracts include reinsurance agreements structured on a modco or funds withheld basis. The fair value of the embedded derivative liability is $34.8 million and $34.9 million as of December 31, 2024, and 2023, respectively.
Credit risk
The Company may be exposed to credit-related losses in the event of counterparty nonperformance on derivative financial instruments. Generally, the current credit exposure of the Company’s derivative contracts is the fair value at the reporting date less any collateral received from the counterparty.
The Company manages credit risk related to derivatives by entering into transactions with creditworthy counterparties. Where possible, the Company maintains collateral arrangements and uses master netting agreements that provide for a single net payment from one counterparty to another at each due date and upon termination. The Company has also established counterparty exposure limits, where possible, in order to evaluate if there is sufficient collateral to support the net exposure. Collateral arrangements typically require the posting of collateral in
F-44
connection with its derivative instruments. Collateral agreements often contain posting thresholds, some of which may vary depending on the posting party’s financial strength ratings.
There is no difference between the current presentation of the fair value of the interest rate swaps and the presentation of fair value of the interest rate swaps after the application of any right of offset, as of December 31, 2024.
Note 8. Variable interest entities
Consolidated VIEs
Consolidated VIEs include CLOs managed by the Company. The assets of consolidated VIEs are not available to creditors of the Company, and the investors in these consolidated VIEs have no recourse against the assets of the Company.
During the year ended December 31, 2023, the Company deconsolidated one CLO as the Company ceased to meet the primary beneficiary criteria, when the Company’s guarantee of a third-party investor’s return expired. Upon deconsolidation, no gain or loss was recognized due to the Company’s election to measure the notes of the CLO equal to the assets of the CLO. Refer to Note 2 Summary of significant accounting policies for more information on the election to measure notes equivalent to the assets of the CLO. Upon deconsolidation, the Company continues to serve as the collateral manager and owns certain beneficial interests in the CLO, which were measured at fair value as of the date of deconsolidation.
Revenues of consolidated VIEs – Asset Management
The following summarizes the Consolidated Statements of Operations activity of the consolidated VIEs:
| For the years ended | December 31, 2024 | December 31, 2023 | ||||||||||||
| Interest income | $ | $ | ||||||||||||
| Interest and other expenses | ( | |||||||||||||
| Net investment income | ||||||||||||||
| Unrealized gain/(loss) on note payable | ( | |||||||||||||
| Unrealized gain/(loss) on investments | ||||||||||||||
| Realized gain/(loss) on investments | ( | |||||||||||||
| Net gains (losses) from investment activities | ( | |||||||||||||
| Net revenues of consolidated variable interest entities | $ | $ | ||||||||||||
Revenues of consolidated VIEs - Insurance Solutions
The following summarizes the Consolidated Statements of Operations activity of the consolidated VIEs:
| For the years ended | December 31, 2024 | December 31, 2023 | ||||||||||||
| Investment income | $ | $ | ||||||||||||
| Investment expense | ( | ( | ||||||||||||
| Net investment income | ||||||||||||||
| Unrealized gain/(loss) on investments | ( | ( | ||||||||||||
| Realized gain/(loss) on investments | ||||||||||||||
| Net gains (losses) from investment activities | ( | ( | ||||||||||||
| Net revenues of consolidated variable interest entities | $ | $ | ||||||||||||
F-45
Unconsolidated VIEs
The Company has variable interests in VIEs which it was determined not to be the primary beneficiary. The Company’s variable interests include equity interests, loans, and beneficial interests in CLOs and other entities, which are recorded in Investments in the Consolidated Statements of Financial Position. The following table presents the maximum exposure to losses relating to these VIEs for which the Company has a variable interest, but that it is not the primary beneficiary. The Company has exposure beyond the carrying value of its variable interests due to unfunded commitments on loans.
| December 31, 2024 | December 31, 2023 | |||||||||||||||||||||||||
| Carrying amount | Maximum exposure to loss | Carrying amount | Maximum Exposure to Loss | |||||||||||||||||||||||
| Asset Management | ||||||||||||||||||||||||||
| Variable interests | $ | $ | $ | $ | ||||||||||||||||||||||
| Variable interests in related parties | ||||||||||||||||||||||||||
| Total Asset Management | $ | $ | $ | $ | ||||||||||||||||||||||
| Insurance Solutions | ||||||||||||||||||||||||||
| Variable interests | $ | $ | $ | $ | ||||||||||||||||||||||
| Variable interests in related parties | ||||||||||||||||||||||||||
| Total Insurance Solutions | $ | $ | $ | $ | ||||||||||||||||||||||
| Total | $ | $ | $ | $ | ||||||||||||||||||||||
F-46
Note 9. Fair value measurements
The following tables summarize the valuation of assets and liabilities measured at fair value by fair value hierarchy. Investments classified as Equity Method for which the FVO has not been elected have been excluded from the table below.
| Fair Value Measurements | ||||||||||||||||||||||||||||||||
| December 31, 2024 | Level 1 | Level 2 | Level 3 | NAV | Total | |||||||||||||||||||||||||||
| Financial assets | ||||||||||||||||||||||||||||||||
| Asset Management | ||||||||||||||||||||||||||||||||
| Equity securities | $ | $ | — | $ | $ | — | $ | |||||||||||||||||||||||||
| Total financial assets — Asset Management | $ | $ | — | $ | $ | — | $ | |||||||||||||||||||||||||
| Insurance Solutions | ||||||||||||||||||||||||||||||||
| Debt securities: | ||||||||||||||||||||||||||||||||
| U.S. government and agency | $ | — | $ | $ | — | $ | — | $ | ||||||||||||||||||||||||
| U.S. state, territories and municipalities | — | — | — | |||||||||||||||||||||||||||||
| Other government and agency | — | — | — | |||||||||||||||||||||||||||||
| Corporate | — | — | — | |||||||||||||||||||||||||||||
| Asset and mortgage-backed securities | — | — | ||||||||||||||||||||||||||||||
| Corporate loans | — | — | — | |||||||||||||||||||||||||||||
| Equity securities | ||||||||||||||||||||||||||||||||
| Other invested assets | — | — | — | |||||||||||||||||||||||||||||
| Total financial assets — Insurance Solutions | $ | $ | $ | $ | $ | |||||||||||||||||||||||||||
| Equity securities of consolidated VIEs | — | — | — | |||||||||||||||||||||||||||||
| Corporate loans of consolidated VIEs | — | — | — | |||||||||||||||||||||||||||||
| Total financial assets including consolidated VIEs | $ | $ | $ | $ | $ | |||||||||||||||||||||||||||
| Total financial assets | $ | $ | $ | $ | $ | |||||||||||||||||||||||||||
| Financial liabilities | ||||||||||||||||||||||||||||||||
| Asset Management | ||||||||||||||||||||||||||||||||
| Debt obligations | $ | — | $ | — | $ | $ | — | $ | ||||||||||||||||||||||||
| Total financial liabilities — Asset Management | $ | — | $ | — | $ | $ | — | $ | ||||||||||||||||||||||||
| Insurance Solutions | ||||||||||||||||||||||||||||||||
| Ceded reinsurance - embedded derivative | $ | — | $ | $ | — | $ | — | $ | ||||||||||||||||||||||||
| Interest rate swaps | — | — | — | |||||||||||||||||||||||||||||
| Total financial liabilities — Insurance Solutions | $ | — | $ | $ | — | $ | — | $ | ||||||||||||||||||||||||
| Total financial liabilities | $ | — | $ | $ | $ | — | $ | |||||||||||||||||||||||||
F-47
| Fair Value Measurements | ||||||||||||||||||||||||||||||||
| December 31, 2023 | Level 1 | Level 2 | Level 3 | NAV | Total | |||||||||||||||||||||||||||
| Financial assets | ||||||||||||||||||||||||||||||||
| Asset Management | ||||||||||||||||||||||||||||||||
| Equity securities | $ | $ | — | $ | $ | — | $ | |||||||||||||||||||||||||
| Total financial assets — Asset Management | $ | $ | — | $ | $ | — | $ | |||||||||||||||||||||||||
| Insurance Solutions | ||||||||||||||||||||||||||||||||
| Debt securities: | ||||||||||||||||||||||||||||||||
| U.S. government and agency | $ | — | $ | $ | — | $ | — | $ | ||||||||||||||||||||||||
| U.S. state, territories and municipalities | — | — | — | |||||||||||||||||||||||||||||
| Other government and agency | — | — | — | |||||||||||||||||||||||||||||
| Corporate | — | — | — | |||||||||||||||||||||||||||||
| Asset and mortgage-backed securities | — | — | ||||||||||||||||||||||||||||||
| Corporate loans | — | — | ||||||||||||||||||||||||||||||
| Equity securities | ||||||||||||||||||||||||||||||||
| Other invested assets | — | — | — | |||||||||||||||||||||||||||||
| Total financial assets — Insurance Solutions | $ | $ | $ | $ | $ | |||||||||||||||||||||||||||
| Corporate loans of consolidated VIEs | — | — | — | |||||||||||||||||||||||||||||
| Total financial assets including consolidated VIEs | ||||||||||||||||||||||||||||||||
| Total financial assets | $ | $ | $ | $ | $ | |||||||||||||||||||||||||||
| Financial liabilities | ||||||||||||||||||||||||||||||||
| Asset Management | ||||||||||||||||||||||||||||||||
| Debt obligations | $ | — | $ | — | $ | $ | — | $ | ||||||||||||||||||||||||
| Total financial liabilities — Asset Management | $ | — | $ | — | $ | $ | — | $ | ||||||||||||||||||||||||
| Insurance Solutions | ||||||||||||||||||||||||||||||||
| Ceded reinsurance - embedded derivative | $ | — | $ | $ | — | $ | — | $ | ||||||||||||||||||||||||
| Total financial liabilities — Insurance Solutions | $ | — | $ | $ | — | $ | — | $ | ||||||||||||||||||||||||
| Total financial liabilities | $ | — | $ | $ | $ | — | $ | |||||||||||||||||||||||||
The availability of observable inputs can vary depending on the financial asset and is affected by a wide variety of factors, including, for example, the type of instrument, whether the instrument has recently been issued, whether the instrument is traded on an active exchange or in the secondary market, and current market conditions. To the extent that valuation is based on models or inputs that are less observable or unobservable in the market, the determination of fair value requires additional judgment. Accordingly, the degree of judgment exercised by the Company in determining fair value is greatest for instruments categorized as Level 3. The variability and availability of the observable inputs affected by the factors described above may cause transfers between Levels 1, 2, and 3, as discussed further below.
F-48
Transfers between level 1 and level 2
The Company records transfers of assets between Level 1 and Level 2 at their fair values at the end of each reporting period. Assets are transferred out of Level 1 when they are no longer transacted with sufficient frequency and volume in an active market. Conversely, assets are transferred from Level 2 to Level 1 when transaction volume and frequency are indicative of an active market. During the year ended December 31, 2024 and December 31, 2023, there were no assets transferred between Level 1 and Level 2.
Transfers between level 1 or 2 and level 3
The Company records transfers of assets between Level 1 or 2 and Level 3 at the end of each reporting period. Assets are transferred into Level 3 when there is a lack of observable valuation inputs.
Conversely, assets are transferred out of Level 3 when valuation inputs become observable. Whether the assets are transferred into Level 1 or 2 will depend on whether the prices are unadjusted and quoted in an active market.
The following tables summarize changes in the Company’s investment portfolio measured and reporting at fair value for which Level 3 inputs were used in determining fair value:
| Net Change in Unrealized Appreciation (Depreciation) | ||||||||||||||||||||||||||||||||||||||||||||||||||||||||||||||||||||
| Year Ended December 31, 2024 | Balance December 31, 2023 | Purchases | Sales and Repayments | Net Realized Gain (Loss) | Included in Income | Included in OCI | Transfer in (1) | Transfer out (1) | Balance December 31, 2024 | Change in Unrealized Gains (Losses) included in Income on Level 3 Assets and Liabilities Still Held | Change in Unrealized Gains (Losses) included in OCI on Level 3 Assets and Liabilities Still Held | |||||||||||||||||||||||||||||||||||||||||||||||||||||||||
| Financial assets | ||||||||||||||||||||||||||||||||||||||||||||||||||||||||||||||||||||
| Asset Management | ||||||||||||||||||||||||||||||||||||||||||||||||||||||||||||||||||||
| Equity securities | $ | $ | — | $ | — | $ | — | $ | ( | $ | — | $ | — | $ | — | $ | $ | ( | $ | — | ||||||||||||||||||||||||||||||||||||||||||||||||
| Total assets - Asset Management | — | — | — | ( | — | — | — | ( | — | |||||||||||||||||||||||||||||||||||||||||||||||||||||||||||
| Insurance Solutions | ||||||||||||||||||||||||||||||||||||||||||||||||||||||||||||||||||||
| Debt securities: | ||||||||||||||||||||||||||||||||||||||||||||||||||||||||||||||||||||
| Corporate | — | — | — | — | — | — | — | — | — | — | — | |||||||||||||||||||||||||||||||||||||||||||||||||||||||||
| Asset and mortgage-backed securities | — | ( | — | ( | ( | — | — | ( | ||||||||||||||||||||||||||||||||||||||||||||||||||||||||||||
| Corporate loans | ( | ( | — | — | ( | — | ||||||||||||||||||||||||||||||||||||||||||||||||||||||||||||||
| Equity securities | — | ( | — | — | — | — | — | |||||||||||||||||||||||||||||||||||||||||||||||||||||||||||||
| Other invested assets | — | ( | ( | ( | — | — | ( | ( | ||||||||||||||||||||||||||||||||||||||||||||||||||||||||||||
| Total assets - Insurance Solutions | ( | ( | ( | — | ( | ( | ||||||||||||||||||||||||||||||||||||||||||||||||||||||||||||||
| Equity securities of consolidated VIEs | — | — | — | — | — | — | — | |||||||||||||||||||||||||||||||||||||||||||||||||||||||||||||
| Corporate loans of consolidated VIEs | ( | ( | — | — | — | ( | — | |||||||||||||||||||||||||||||||||||||||||||||||||||||||||||||
| Total financial assets including consolidated VIEs - Insurance Solutions | ( | ( | ( | — | ( | ( | ||||||||||||||||||||||||||||||||||||||||||||||||||||||||||||||
| Total financial assets | $ | $ | $ | ( | $ | $ | ( | $ | ( | $ | $ | — | $ | $ | ( | $ | ( | |||||||||||||||||||||||||||||||||||||||||||||||||||
| Financial liabilities | ||||||||||||||||||||||||||||||||||||||||||||||||||||||||||||||||||||
| Asset Management | ||||||||||||||||||||||||||||||||||||||||||||||||||||||||||||||||||||
| Debt obligations | $ | $ | — | $ | — | $ | $ | — | $ | — | $ | — | $ | — | $ | $ | ( | $ | — | |||||||||||||||||||||||||||||||||||||||||||||||||
| Total financial liabilities - Asset Management | $ | $ | — | $ | — | $ | $ | — | $ | — | $ | — | $ | — | $ | $ | ( | $ | — | |||||||||||||||||||||||||||||||||||||||||||||||||
______________
(1)Transfers into Level 3 are due to decrease in the quantity and reliability of broker quotes obtained. Transfers out of Level 3 are due to an increase in the quantity and reliability of broker quotes obtained. Transfers are assumed to have occurred at the end of the period.
F-49
| Net Change in Unrealized Appreciation (Depreciation) | ||||||||||||||||||||||||||||||||||||||||||||||||||||||||||||||||||||||||||
| Balance December 31, 2022 | Purchases | Sales and Repayments | Net Realized Gain (Loss) | Included in Income | Included in OCI | Transfer in (1) | Transfer out (1) | Change in Consolidation | Balance December 31, 2023 | Change in Unrealized Gains (Losses) included in Income on Level 3 Assets and Liabilities Still Held | Change in Unrealized Gains (Losses) included in OCI on Level 3 Assets and Liabilities Still Held | |||||||||||||||||||||||||||||||||||||||||||||||||||||||||||||||
| Financial assets | ||||||||||||||||||||||||||||||||||||||||||||||||||||||||||||||||||||||||||
| Asset Management | ||||||||||||||||||||||||||||||||||||||||||||||||||||||||||||||||||||||||||
| Debt securities: | ||||||||||||||||||||||||||||||||||||||||||||||||||||||||||||||||||||||||||
| Corporate | $ | $ | — | $ | — | $ | ( | $ | — | $ | — | $ | — | $ | — | $ | — | $ | — | $ | — | $ | — | |||||||||||||||||||||||||||||||||||||||||||||||||||
| Equity securities | — | — | ( | — | — | — | — | ( | — | |||||||||||||||||||||||||||||||||||||||||||||||||||||||||||||||||
| Total assets - Asset Management | — | ( | ( | — | — | — | — | ( | — | |||||||||||||||||||||||||||||||||||||||||||||||||||||||||||||||||
| Corporate loans of consolidated VIEs | ( | — | ( | — | ( | ( | — | — | — | |||||||||||||||||||||||||||||||||||||||||||||||||||||||||||||||||
| Total financial assets including consolidated VIEs - Asset Management | ( | ( | ( | — | ( | ( | ( | — | ||||||||||||||||||||||||||||||||||||||||||||||||||||||||||||||||||
| Insurance Solutions | ||||||||||||||||||||||||||||||||||||||||||||||||||||||||||||||||||||||||||
| Debt securities: | ||||||||||||||||||||||||||||||||||||||||||||||||||||||||||||||||||||||||||
| Corporate | — | ( | — | — | — | — | — | — | — | |||||||||||||||||||||||||||||||||||||||||||||||||||||||||||||||||
| Asset and mortgage-backed securities | — | ( | — | ( | ( | — | — | ( | ||||||||||||||||||||||||||||||||||||||||||||||||||||||||||||||||||
| Corporate loans | ( | ( | — | — | — | — | ||||||||||||||||||||||||||||||||||||||||||||||||||||||||||||||||||||
| Equity securities | — | — | — | ( | — | — | — | — | ( | — | ||||||||||||||||||||||||||||||||||||||||||||||||||||||||||||||||
| Other invested assets | ( | ( | — | — | — | ( | ||||||||||||||||||||||||||||||||||||||||||||||||||||||||||||||||||||
| Total assets - Insurance Solutions | ( | ( | ( | ( | — | ( | ||||||||||||||||||||||||||||||||||||||||||||||||||||||||||||||||||||
| Corporate loans of consolidated VIEs | ( | — | — | — | — | ( | — | |||||||||||||||||||||||||||||||||||||||||||||||||||||||||||||||||||
| Total financial assets including consolidated VIEs - Insurance Solutions | ( | ( | ( | — | ( | ( | ||||||||||||||||||||||||||||||||||||||||||||||||||||||||||||||||||||
| Total financial assets | $ | $ | $ | ( | $ | ( | $ | $ | ( | $ | $ | ( | $ | ( | $ | $ | ( | $ | ( | |||||||||||||||||||||||||||||||||||||||||||||||||||||||
| Financial liabilities | ||||||||||||||||||||||||||||||||||||||||||||||||||||||||||||||||||||||||||
| Asset Management | ||||||||||||||||||||||||||||||||||||||||||||||||||||||||||||||||||||||||||
| Debt obligations | $ | $ | — | $ | — | $ | — | $ | ( | $ | — | $ | — | $ | — | $ | — | $ | $ | $ | — | |||||||||||||||||||||||||||||||||||||||||||||||||||||
| Contingent value right | — | — | ( | — | — | — | — | — | — | — | — | |||||||||||||||||||||||||||||||||||||||||||||||||||||||||||||||
| Total liabilities - Asset Management | — | — | ( | ( | — | — | — | — | — | |||||||||||||||||||||||||||||||||||||||||||||||||||||||||||||||||
| Notes payable of consolidated VIEs | — | — | — | — | — | — | ( | — | — | — | ||||||||||||||||||||||||||||||||||||||||||||||||||||||||||||||||
| Total financial liabilities - Asset Management | $ | $ | — | $ | — | $ | ( | $ | $ | — | $ | — | $ | — | $ | ( | $ | $ | $ | — | ||||||||||||||||||||||||||||||||||||||||||||||||||||||
______________
F-50
The valuation techniques and significant unobservable inputs used in Level 3 valuations were as follows:
| Quantitative Information about Level 3 Fair Value Measurements | ||||||||||||||||||||||||||
| December 31, 2024 | Fair value | Valuation technique/ methodology | Unobservable input | Range (weighted average) | ||||||||||||||||||||||
| Financial assets | ||||||||||||||||||||||||||
| Asset Management | ||||||||||||||||||||||||||
| Equity securities | $ | Discounted cash flow | Discount rate | |||||||||||||||||||||||
| Equity securities | Enterprise value | Multiple | ||||||||||||||||||||||||
| Total — Asset Management | $ | |||||||||||||||||||||||||
| Insurance Solutions | ||||||||||||||||||||||||||
| Debt securities (1): | ||||||||||||||||||||||||||
| Asset and mortgage-backed securities | $ | Recent transaction | Transaction price | NA | ||||||||||||||||||||||
| Asset and mortgage-backed securities | Discounted cash flow | Discount rate | ||||||||||||||||||||||||
| Corporate loans | Discounted cash flow | Discount rate | ||||||||||||||||||||||||
| Corporate loans | Enterprise value | Multiple | ||||||||||||||||||||||||
| Equity securities | Discounted cash flow | Discount rate | ||||||||||||||||||||||||
| Other invested assets | Discounted cash flow | Discount rate | ||||||||||||||||||||||||
| Total — Insurance Solutions | $ | |||||||||||||||||||||||||
| Equity securities of consolidated VIEs | Discounted cash flow | Discount rate | ||||||||||||||||||||||||
| Corporate loans of consolidated VIEs | Recent transaction | Transaction price | NA | |||||||||||||||||||||||
| Corporate loans of consolidated VIEs | Discounted cash flow | Discount rate | ||||||||||||||||||||||||
| Total assets of consolidated VIEs - Insurance Solutions | ||||||||||||||||||||||||||
| Total financial assets including consolidated VIEs - Insurance Solutions | $ | |||||||||||||||||||||||||
| Total investments | $ | |||||||||||||||||||||||||
| Financial liabilities | ||||||||||||||||||||||||||
| Asset Management | ||||||||||||||||||||||||||
| Debt obligation | $ | Enterprise valuation | Revenue multiple | Not Meaningful (NA) | ||||||||||||||||||||||
| Enterprise valuation | EBITDA | Not Meaningful (NA) | ||||||||||||||||||||||||
| Income Approach | Required rate of return | Not Meaningful (NA) | ||||||||||||||||||||||||
| Total financial liabilities - Asset Management | $ | |||||||||||||||||||||||||
| Total financial liabilities | $ | |||||||||||||||||||||||||
F-51
______________
(1)For debt securities where the recent transaction price does not estimate fair value, the Company determines the fair value utilizing a yield analysis.
| Quantitative Information about Level 3 Fair Value Measurements | ||||||||||||||||||||||||||
| December 31, 2023 | Fair value | Valuation technique/ methodology | Unobservable input | Range (weighted average) | ||||||||||||||||||||||
| Financial assets | ||||||||||||||||||||||||||
| Asset management | ||||||||||||||||||||||||||
| Equity securities | $ | Discounted cash flow | Discount rate | |||||||||||||||||||||||
| Equity securities | Enterprise value | Multiple | ||||||||||||||||||||||||
| Total — Asset Management | $ | |||||||||||||||||||||||||
| Insurance | ||||||||||||||||||||||||||
| Debt securities(1): | ||||||||||||||||||||||||||
| Asset and mortgage-backed securities | $ | Recent transaction | Transaction price | NA | ||||||||||||||||||||||
| Asset and mortgage-backed securities | Discounted cash flow | Discount rate | ||||||||||||||||||||||||
| Corporate loans | Discounted cash flow | Discount rate | ||||||||||||||||||||||||
| Equity securities | Enterprise value | Multiple | ||||||||||||||||||||||||
| Equity securities | Discounted cash flow | Discount rate | ||||||||||||||||||||||||
| Other invested assets | Discounted cash flow | Discount rate | ||||||||||||||||||||||||
| Total — Insurance Solutions | ||||||||||||||||||||||||||
| Corporate loans of consolidated VIEs | Recent transaction | Transaction price | NA | |||||||||||||||||||||||
| Corporate loans of consolidated VIEs | Discounted cash flow | Discount rate | ||||||||||||||||||||||||
| Total assets of consolidated VIEs - Insurance Solutions | ||||||||||||||||||||||||||
| Total financial assets including consolidated VIEs - Insurance Solutions | $ | |||||||||||||||||||||||||
| Total financial assets | $ | |||||||||||||||||||||||||
| Financial liabilities | ||||||||||||||||||||||||||
| Asset Management | ||||||||||||||||||||||||||
| Debt obligations | $ | Enterprise valuation | Revenue multiple | Not Meaningful (NA) | ||||||||||||||||||||||
| Enterprise valuation | EBITDA | Not Meaningful (NA) | ||||||||||||||||||||||||
| Income approach | Required rate of return | Not Meaningful (NA) | ||||||||||||||||||||||||
| Total financial liabilities - Asset Management | ||||||||||||||||||||||||||
| Total financial liabilities | $ | |||||||||||||||||||||||||
______________
(1)For debt securities where the recent transaction price does not estimate fair value, the Company determines the fair value utilizing a yield analysis.
The Company typically determines the fair value of its performing Level 3 debt investments utilizing a yield analysis. In a yield analysis, a price is ascribed for each investment based upon an assessment of current and expected market yields for similar investments and risk profiles. Additional consideration is given to the expected life, portfolio company performance since close, and other terms and risks associated with an investment. Among other factors, a determinant of risk is the amount of leverage used by the portfolio company relative to the total
F-52
enterprise value of the company, and the rights and remedies of the Company’s investment within each portfolio company’s capital structure.
Significant unobservable inputs include an illiquidity spread as well as a credit spread, both of which increase the discount rate. These rates are initially set at a level such that the loan valuation equals the initial purchase cost of the loan and are subsequently adjusted at each valuation date to reflect management’s current assessment of market conditions as well as of loan-specific credit and illiquidity risk. Discount rates are subject to adjustment based on both management’s current assessment of market conditions and the economic performance of individual investments. The significant unobservable inputs used in the fair value measurement of the Company’s Level 3 debt securities primarily include current market yields, including relevant market indices, but may also include quotes from brokers, dealers, and pricing services as indicated by comparable investments.
Financial instruments not carried at fair value
The following tables present carrying amounts and fair values of the Company’s financial assets and liabilities which are not carried at fair value as of December 31, 2024, and 2023:
| Fair Value Hierarchy | ||||||||||||||||||||||||||||||||
| December 31, 2024 | Carrying value | Fair value | Level 1 | Level 2 | Level 3 | |||||||||||||||||||||||||||
| Financial Assets | ||||||||||||||||||||||||||||||||
| Asset Management | ||||||||||||||||||||||||||||||||
| Debt securities: | ||||||||||||||||||||||||||||||||
| Corporate loans | $ | $ | $ | — | $ | — | $ | |||||||||||||||||||||||||
| Total financial assets — Asset Management | $ | $ | $ | — | $ | — | $ | |||||||||||||||||||||||||
| Insurance Solutions | ||||||||||||||||||||||||||||||||
| Mortgage loans | $ | $ | $ | — | $ | — | $ | |||||||||||||||||||||||||
| Other invested assets | — | — | ||||||||||||||||||||||||||||||
| Total financial assets — Insurance Solutions | $ | $ | $ | — | $ | — | $ | |||||||||||||||||||||||||
| Total financial assets | $ | $ | $ | — | $ | — | $ | |||||||||||||||||||||||||
| Financial Liabilities | ||||||||||||||||||||||||||||||||
| Asset Management | ||||||||||||||||||||||||||||||||
| Debt obligations | $ | $ | $ | — | $ | — | $ | |||||||||||||||||||||||||
| Total financial liabilities — Asset Management | $ | $ | $ | — | $ | — | $ | |||||||||||||||||||||||||
| Insurance Solutions | ||||||||||||||||||||||||||||||||
| Debt obligations | $ | $ | $ | — | $ | — | $ | |||||||||||||||||||||||||
| Interest sensitive contract liabilities | — | — | ||||||||||||||||||||||||||||||
| Total financial liabilities —Insurance Solutions | $ | $ | $ | — | $ | $ | ||||||||||||||||||||||||||
| Total financial liabilities | $ | $ | $ | — | $ | $ | ||||||||||||||||||||||||||
| Fair Value Hierarchy | ||||||||||||||||||||||||||||||||
| December 31, 2023 | Carrying value | Fair value | Level 1 | Level 2 | Level 3 | |||||||||||||||||||||||||||
| Financial Assets | ||||||||||||||||||||||||||||||||
| Asset Management | ||||||||||||||||||||||||||||||||
| Debt securities: | ||||||||||||||||||||||||||||||||
| Corporate | $ | $ | $ | — | $ | — | $ | |||||||||||||||||||||||||
| Total financial assets — Asset Management | $ | $ | $ | — | $ | — | $ | |||||||||||||||||||||||||
| Insurance Solutions | ||||||||||||||||||||||||||||||||
| Mortgage loans | $ | $ | $ | — | $ | — | $ | |||||||||||||||||||||||||
| Other invested assets | — | — | ||||||||||||||||||||||||||||||
| Total financial assets — Insurance Solutions | $ | $ | $ | — | $ | — | $ | |||||||||||||||||||||||||
| Total financial assets | $ | $ | $ | — | $ | — | $ | |||||||||||||||||||||||||
F-53
| Financial Liabilities | ||||||||||||||||||||||||||||||||
| Asset Management | ||||||||||||||||||||||||||||||||
| Debt Obligations | $ | $ | $ | — | $ | — | $ | |||||||||||||||||||||||||
| Total financial liabilities — Asset Management | $ | $ | $ | — | $ | — | $ | |||||||||||||||||||||||||
| Insurance Solutions | ||||||||||||||||||||||||||||||||
| Debt Obligations | $ | $ | $ | — | $ | — | $ | |||||||||||||||||||||||||
| Interest sensitive contract liabilities | — | — | ||||||||||||||||||||||||||||||
| Total financial liabilities — Insurance Solutions | $ | $ | $ | — | $ | $ | ||||||||||||||||||||||||||
| Total financial liabilities | $ | $ | $ | — | $ | $ | ||||||||||||||||||||||||||
Fair value option
The following table presents the net realized and unrealized gains (losses) on financial instruments for which the FVO was elected:
| For the years ended December 31, | 2024 | 2023 | ||||||||||||||||||||||||||||||||||||
| Net realized gains (losses) | Net unrealized gains (losses) | Total | Net realized gains (losses) | Net unrealized gains (losses) | Total | |||||||||||||||||||||||||||||||||
| Asset Management | ||||||||||||||||||||||||||||||||||||||
| Debt securities: | ||||||||||||||||||||||||||||||||||||||
| Corporate | $ | — | $ | — | $ | — | $ | ( | $ | — | $ | ( | ||||||||||||||||||||||||||
| Contingent value right | — | — | — | — | ||||||||||||||||||||||||||||||||||
| Debt obligation | — | ( | ( | — | ||||||||||||||||||||||||||||||||||
| Net gains (losses) from investment activities - Asset Management | — | ( | ( | — | ||||||||||||||||||||||||||||||||||
| Investments of consolidated VIEs | — | — | — | ( | ||||||||||||||||||||||||||||||||||
| Notes payable of consolidated VIEs | — | — | — | — | ( | ( | ||||||||||||||||||||||||||||||||
| Net gains (losses) from investment activities - Asset Management including consolidated VIEs | $ | — | $ | ( | $ | ( | $ | ( | $ | ( | $ | ( | ||||||||||||||||||||||||||
| Insurance Solutions | ||||||||||||||||||||||||||||||||||||||
| Debt securities: | ||||||||||||||||||||||||||||||||||||||
| U.S. government and agency | $ | — | $ | — | $ | — | $ | — | $ | — | $ | — | ||||||||||||||||||||||||||
| U.S. state, territories and municipalities | — | ( | ( | — | ||||||||||||||||||||||||||||||||||
| Other government and agency | — | ( | ( | — | ||||||||||||||||||||||||||||||||||
| Corporate | — | ( | ( | |||||||||||||||||||||||||||||||||||
| Asset and mortgage- backed securities | ||||||||||||||||||||||||||||||||||||||
| Corporate loans | ( | ( | ( | |||||||||||||||||||||||||||||||||||
| Mortgage loans | — | — | — | — | — | — | ||||||||||||||||||||||||||||||||
| Equity securities | — | — | — | — | — | — | ||||||||||||||||||||||||||||||||
| Other invested assets | ( | ( | ||||||||||||||||||||||||||||||||||||
| Net gains (losses) from investment activities - Insurance Solutions | $ | $ | ( | $ | ( | $ | ( | $ | $ | |||||||||||||||||||||||||||||
| Investments of consolidated VIEs | ( | ( | ( | ( | ||||||||||||||||||||||||||||||||||
| Net gains (losses) from investment activities - Insurance Solutions including consolidated VIEs | $ | $ | ( | $ | ( | $ | $ | $ | ||||||||||||||||||||||||||||||
F-54
The following table presents information for loans which the Company elected the FVO.
| December 31, 2024 | Unpaid Principal Balance | Mark to Fair Value | Fair Value | |||||||||||||||||
| Insurance Solutions | ||||||||||||||||||||
| Corporate loans | $ | $ | ( | $ | ||||||||||||||||
| Other invested assets | ( | |||||||||||||||||||
| Insurance Solutions | $ | $ | ( | $ | ||||||||||||||||
| Corporate loans of consolidated VIEs | ( | |||||||||||||||||||
| Insurance Solutions including consolidated VIEs | $ | $ | ( | $ | ||||||||||||||||
| December 31, 2023 | Unpaid Principal Balance | Mark to Fair Value | Fair Value | |||||||||||||||||
| Insurance Solutions | ||||||||||||||||||||
| Corporate loans | $ | $ | ( | $ | ||||||||||||||||
| Other invested assets | ( | |||||||||||||||||||
| Insurance Solutions | $ | $ | ( | $ | ||||||||||||||||
| Corporate loans of consolidated VIEs | ( | |||||||||||||||||||
| Insurance Solutions including consolidated VIEs | $ | $ | ( | $ | ||||||||||||||||
As of December 31, 2024 and December 31, 2023, there were no loans accounted for at fair value under the FVO which were 90 days or more past-due or in non-accrual status.
The following table presents the estimated amount of gains (losses) included in earnings attributable to changes in instrument-specific credit risk on corporate loans for which the Company elected the FVO.
| For the years ended December 31, | 2024 | 2023 | ||||||||||||
| Asset Management | ||||||||||||||
| Corporate loans of consolidated VIEs | $ | $ | ( | |||||||||||
| Asset Management including consolidated VIEs | $ | $ | ( | |||||||||||
| Insurance Solutions | ||||||||||||||
| Corporate loans | $ | $ | ||||||||||||
| Other invested assets | ( | |||||||||||||
| Insurance Solutions | ( | |||||||||||||
| Corporate loans of consolidated VIEs | ( | |||||||||||||
| Insurance Solutions including consolidated VIEs | $ | ( | $ | |||||||||||
The portion of gains and losses attributable to changes in instrument-specific credit risk is estimated by identifying loans with changes in credit ratings meeting certain criteria.
Note 10. Revenue from service contracts
The following table summarizes the Company’s revenue from service contracts for Asset Management:
| Year Ended December 31, | 2024 | 2023 | ||||||||||||
| Management fees | $ | $ | ||||||||||||
| Incentive fees | ||||||||||||||
| Servicing fees (expense)(1) | ( | ( | ||||||||||||
| Performance allocation | ||||||||||||||
______________
F-55
Note 11. Goodwill and intangible assets
Goodwill
The changes in the carrying amount of goodwill by reportable segment during the years ended December 31, 2024 and 2023 were as follows:
| December 31, 2024 | December 31, 2023 | |||||||||||||||||||||||||
| Asset Management | Insurance Solutions | Asset Management | Insurance Solutions | |||||||||||||||||||||||
| Balance, beginning of period | $ | $ | $ | $ | ||||||||||||||||||||||
| Ovation acquisition (Note 3) | — | — | — | |||||||||||||||||||||||
| Balance, end of period | $ | $ | $ | |||||||||||||||||||||||
See Note 3 Business combinations for further disclosure regarding the goodwill recorded as a result of the Ovation Merger. The Company performed its annual goodwill impairment assessment in the fourth quarter and did not identify any impairment as of December 31, 2024, and December 31, 2023.
Intangible assets
Intangible assets consist of the following as of December 31, 2024, and December 31, 2023:
| December 31, 2024 | ||||||||||||||||||||||||||
| Gross carrying amount | Accumulated amortization | Accumulated impairment | Net carrying amount | |||||||||||||||||||||||
| Asset Management | ||||||||||||||||||||||||||
| Intangible assets — indefinite life | ||||||||||||||||||||||||||
| Investment management contracts | $ | $ | — | $ | — | $ | ||||||||||||||||||||
| Intangible assets — definite life | ||||||||||||||||||||||||||
| Investment management contracts | ( | ( | ||||||||||||||||||||||||
| Total intangible assets — Asset Management | ( | ( | ||||||||||||||||||||||||
| Insurance Solutions | ||||||||||||||||||||||||||
| Intangible assets — indefinite life | ||||||||||||||||||||||||||
| State insurance licenses | — | — | ||||||||||||||||||||||||
| Total intangible assets — Insurance Solutions | $ | $ | — | $ | — | $ | ||||||||||||||||||||
| December 31, 2023 | ||||||||||||||||||||||||||
| Gross carrying amount | Accumulated amortization | Accumulated impairment | Net carrying amount | |||||||||||||||||||||||
| Asset Management | ||||||||||||||||||||||||||
| Intangible assets — indefinite life | ||||||||||||||||||||||||||
| Investment management contracts | $ | $ | — | $ | — | $ | ||||||||||||||||||||
| Intangible assets — definite life | ||||||||||||||||||||||||||
| Investment management contracts | ( | — | ||||||||||||||||||||||||
| Total intangible assets — Asset Management | ( | |||||||||||||||||||||||||
| Insurance Solutions | ||||||||||||||||||||||||||
| Intangible assets — indefinite life | ||||||||||||||||||||||||||
| State insurance licenses | — | — | ||||||||||||||||||||||||
| Total intangible assets — Insurance Solutions | $ | $ | — | $ | — | $ | ||||||||||||||||||||
F-56
On July 25, 2024, Ovation Fund Management II LLC (“OFM II”), a wholly owned subsidiary of the Company, announced the determination to dissolve and wind up the Ovation Alternative Income Fund LP (“OAIF”) – a fund from which the Company collects management and incentive fees under an investment management agreement (“IMA”). The remaining useful life of the IMA was re-assessed and revised from 9 years down to 4 years in line with the expected wind down time frame of the fund as at October 1, 2024. The Company will continue to earn management fees and potentially incentive fees under the IMA until all assets are sold or liquidated out of OAIF. However, the fee stream will decrease as the fund's net asset value (“NAV”) and net income decreases. Given the expected decrease in NAV from anticipated asset exit dates, the decrease in aggregate fees expected over the remaining useful life of the IMA indicated the intangible asset was impaired. Accordingly, the IMA has been written down to its recoverable amount of $4.5 million.
The remaining useful life of the Ovation IMA remains 4 years as at December 31, 2024, reflecting the period over which future economic benefits will be received by the Company under the IMA. The amortization method will also be prospectively changed from straight line to percentage of net asset value (“NAV”) decline in OAIF to better reflect the pattern in which the IMA’s future economic benefits are expected to be consumed.
The Company performed its annual intangible asset impairment assessment in the fourth quarter. In 2024, the Company identified that the Ovation IMA was impaired and as a result an impairment loss of $1.8 million was recognized in the Consolidated Statements of Operations for the year ended December 31, 2024. There was no impairment recognized during the year ended December 31, 2023.
The following table represents estimated intangible amortization expense as of December 31, 2024:
| As of | December 31, 2024 | |||||||
| 2025 | $ | |||||||
| 2026 | ||||||||
| 2027 | ||||||||
| 2028 | ||||||||
| 2029 and thereafter | ||||||||
| Total | $ | |||||||
Note 12. Debt obligations
Asset Management
MLC US Holdings Credit Facility
On August 20, 2021, MLC US Holdings entered into a credit facility with a large US-based asset manager, as administrative agent and collateral agent for the lenders, whereby MLC US Holdings may borrow up to $25.0 million by December 31, 2021 (the “MLC US Holdings Credit Facility”). On September 19, 2022, MLC US Holdings entered into an amendment to its existing credit agreement to increase the term loan available thereunder by $4.5 million. The primary use of the proceeds from the amendment was to seed Opportunistic Credit Interval Fund (“OCIF”), an interval fund managed by ML Management. On May 2, 2023, MLC US Holdings entered into an amendment to the MLC US Holdings Credit Facility to increase the term loan available thereunder by an additional $4.5 million. The primary use of the proceeds from the most recent amendment was to finance the acquisition of Ovation on July 5, 2023, and other related fees and expenses. On December 17, 2024, MLC US Holdings entered into an amendment to upsize the facility by $13.0 million to support key business initiatives as well as for general corporate purposes and paying related transaction fees and expenses. The MLC US Holdings Credit Facility matures on August 20, 2027.
Amounts drawn under the MLC US Holdings Credit Facility initially bore interest at London Interbank Offer Rate (“LIBOR”) plus a spread of 7.50 %. The benchmark, LIBOR, was replaced by the secured overnight financing rate (“SOFR”) upon the transition from LIBOR on May 2, 2023. Upon the most recent amendment, the credit facility bears interest based on a pricing step-down mechanism as the business continues to perform, which is expected to reduce the Company's cost of debt over time. Payments of principal and interest are made on each
F-57
payment date, with the remaining principal outstanding and accrued but unpaid interest payable on August 20, 2027. The MLC US Holdings Credit Facility is collateralized by assets held by MLC US Holdings. The Company is a guarantor of the MLC US Holdings Credit Facility.
The most recent amendment was treated as a debt modification as the instruments were not substantially different since the present value of the cash flows of the modified debt were less than 10 percent different from the present value of the remaining cash flows of the original debt. Costs paid to the lenders of $0.4 million were capitalized and includes an original issuance discount (“OID”) and are amortized through interest expense. Costs paid to third party providers of $0.3 million were expensed.
The Company was in compliance with all debt covenants.
Seller notes
On July 1, 2021, the Company completed the acquisition of the management contract for the investment company, Logan Ridge Finance Corporation, from Capitala Investment Advisors, LLC (“CIA”), through, in part, the issuance of an unsecured promissory note of $4.0 million, which bears no interest and is payable on July 1, 2025. The repayment amount on the maturity date will be adjusted to reflect the performance of the investment portfolio of Logan Ridge Finance Corporation since closing and shall not be less than $nil or more than $6.0 million. The Company elected to account for this note under the FVO, where the Company marks the note to fair value each reporting period, with changes in fair value recognized in earnings.
On October 29, 2021, the Company completed the Ability Acquisition through in part the issuance of an unsecured promissory note of $15.0 million, which bears interest at 5.0 % per annum and is payable by October 29, 2031.
Promissory note
On October 20, 2022, Lind Bridge L.P. (“Lind Bridge”), a limited partnership controlled by the Company, as borrower, issued a promissory note to a third-party lender (the “Initial Lind Bridge Note”) for $7.5 million. The Initial Lind Bridge Note bears interest at a rate per annum of 7.5 % on the unpaid principal amount and matures on October 20, 2029. On August 14, 2023, Lind Bridge issued an additional promissory note to a third-party lender for $5.0 million (the “Subsequent Lind Bridge Note” and collectively the “Lind Bridge Notes”). The Subsequent Lind Bridge Note bears interest at a rate per annum of 7.5 % on the unpaid principal amount and matures on April 1, 2025. The Company has guaranteed the obligations of Lind Bridge under the Lind Bridge Notes. The proceeds of the Lind Bridge Notes were used to support the reinsurance of additional annuities in Ability and maintain required statutory surplus. During the first quarter of 2024, the Company repaid the indebtedness under the Lind Bridge Notes in full, resulting in prepayments on the Subsequent Lind Bridge Note at an effective interest rate of 16.0 % per annum.
The Lind Bridge Notes were extinguished with consideration at the carrying amount of the financial liabilities, resulting in no gain or loss. The Company raised $18.8 million new debt through the issuance of 18,752 Debenture Units on a non-brokered private placement basis (the “Debenture Unit Offering”). Each Debenture Unit consists of: (i) one 8.85 % paid-in-kind unsecured debenture of the Company in the principal amount of less than $0.1 million maturing on the date that is eight (8 ) years from the issuance thereof, and (ii) 50 common share purchase warrants of the Company, each of which is exercisable to acquire one common share of the Company at a price of C$2.75 Canadian Dollars (“CAD” or “C$”) per share for a period of eight (8 ) years, from the issuance thereof, provided that the warrants are not permitted to be exercised within the first twelve (12 ) months from the issuance thereof.
F-58
Debt obligations consisted of the following as of December 31, 2024 and December 31, 2023:
| As of December 31, 2024 | Maturity date | Stated interest rate | Effective interest rate | Extension options | Total facility | Outstanding balance | ||||||||||||||||||||||||||||||||
| Seller note — Capitala Acquisition(1) | July 2025 | N/A | $ | $ | ||||||||||||||||||||||||||||||||||
| MLC US Holdings Credit Facility (2) | August 2027 | SOFR + | % | N/A | ||||||||||||||||||||||||||||||||||
| Seller note — Ability Acquisition | October 2031 | % | % | N/A | ||||||||||||||||||||||||||||||||||
| Debenture units (3) | January 2032 | % | % | N/A | ||||||||||||||||||||||||||||||||||
| Total debt | $ | $ | ||||||||||||||||||||||||||||||||||||
______________
(1)The Company elected FVO for the Seller note – Capitala Acquisition. The following balance represents the fair value of the note as of December 31, 2024.
(2)The MLC US Holdings Credit Facility is secured by all assets and interests in assets and proceeds owned and acquired by MLC US Holdings.
(3)The warrants issued with the Debenture Units are recorded in equity at fair value upon issuance and therefore are not required to be subsequently remeasured at fair value on an ongoing basis.
| As of December 31, 2023 | Maturity date | Stated interest rate | Effective interest rate | Extension options | Total facility | Outstanding balance | ||||||||||||||||||||||||||||||||
| Subsequent Lind Bridge Note | 45748 | N/A | $ | $ | ||||||||||||||||||||||||||||||||||
| Seller note — Capitala Acquisition(1) | Jul-25 | — | — | N/A | ||||||||||||||||||||||||||||||||||
| MLC US Holdings Credit Facility (2) | Aug-27 | SOFR + | % | N/A | ||||||||||||||||||||||||||||||||||
| Initial Lind Bridge Note | Oct-29 | N/A | ||||||||||||||||||||||||||||||||||||
| Seller note — Ability Acquisition | Oct-31 | % | % | N/A | ||||||||||||||||||||||||||||||||||
| Total debt | $ | $ | ||||||||||||||||||||||||||||||||||||
______________
(1)The Company elected FVO for the Seller note – Capitala Acquisition. The following balance represents the fair value of the note as of December 31, 2023.
(2)The MLC US Holdings Credit Facility is secured by all assets and interests in assets and proceeds owned and acquired by MLC US Holdings.
(3)Payment in kind (“PIK”) interest.
The scheduled principal repayments are as follows:
| As of | December 31, 2024 | |||||||
| 2025 | $ | |||||||
| 2026 | ||||||||
| 2027 | ||||||||
| 2028 | ||||||||
| 2029 and thereafter | ||||||||
| Transaction costs (net of amortization) | ( | |||||||
| Total debt | $ | |||||||
For the year ended December 31, 2024, interest expense, including the amortization of debt issuance costs and PIK interest, was $7.0 million (December 31, 2023 – $6.0 million).
F-59
Insurance Solutions
Debt obligations
Ability has the following surplus notes outstanding as of December 31, 2024 and December 31, 2023:
| As at December 31, 2024 | Date issued | Date of maturity | Interest rate | Par value | Carrying value of note | Interest and/or principal paid during current year (1) | ||||||||||||||||||||||||||||||||
| Sentinel Security Life Insurance Company | 2/25/2013 | Jun-28 | % | $ | $ | $ | ||||||||||||||||||||||||||||||||
| Pavonia Life Insurance Company of Michigan | Aug-23 | 48549 | % | |||||||||||||||||||||||||||||||||||
| Total surplus notes | $ | $ | $ | |||||||||||||||||||||||||||||||||||
| As at December 31, 2023 | Date issued | Date of maturity | Interest rate | Par value | Carrying value of note | Interest and/or principal paid during current year (2) | ||||||||||||||||||||||||||||||||
| Sentinel Security Life Insurance Company | 2/25/2013 | June 2028 | % | $ | $ | $ | ||||||||||||||||||||||||||||||||
| Pavonia Life Insurance Company of Michigan | 8/30/23 | December 2032 | % | |||||||||||||||||||||||||||||||||||
| Total surplus notes | $ | $ | $ | |||||||||||||||||||||||||||||||||||
______________
(1)Reflects interest and/or principal paid for the year ended December 31, 2024.
(2)Reflects interest and/or principal paid for the year ended December 31, 2023.
Refer to Note 9 Fair value measurements for fair value of financial liabilities carried at amortized cost.
The surplus notes are subordinated in right of payment of all indebtedness, policy claims, and other creditor claims. The note issued to Sentinel Security Life Insurance Company had an initial maturity date of June 12, 2023; however, in the second quarter of 2023, Ability renewed the note, extending the date of maturity to June 12, 2028. On August 30, 2023, Ability, completed a private offering of $12.0 million aggregate principal amount of 10.0 % Surplus Notes due December 2032. Payments of interest or principal shall be paid only if Ability has the required levels of statutory surplus and upon prior authorization by the Director of the Nebraska Department of Insurance.
F-60
The following table shows the reconciliation of debt obligations for the Company:
| For the year ended | December 31, 2024 | December 31, 2023 | ||||||||||||
| Asset management | ||||||||||||||
| Balance at the beginning of the period | $ | $ | ||||||||||||
| Cashflows: | ||||||||||||||
| Proceeds from borrowings | ||||||||||||||
| Repayments of borrowings | ( | ( | ||||||||||||
| Financing costs paid and deferred | ( | ( | ||||||||||||
| Non-cash changes: | ||||||||||||||
| Assumption of debt from acquisition of Ovation | ||||||||||||||
| Amortization of deferred financing costs | ||||||||||||||
PIK interest(1) | ||||||||||||||
| Change in fair value of debt obligation | ( | |||||||||||||
| Transaction costs capitalized through the Debenture Units' initial fair value | ( | |||||||||||||
| Initial equity classified warrant value issued with Debenture Units | ( | |||||||||||||
| Balance at the end of the period - Asset Management | $ | $ | ||||||||||||
| Insurance | ||||||||||||||
| Balance at the beginning of the period | $ | $ | ||||||||||||
| Cashflows: | ||||||||||||||
| Proceeds from borrowings | ||||||||||||||
| Repayments of borrowings | ||||||||||||||
| Balance at the end of the period - Insurance Solutions | $ | $ | ||||||||||||
______________
(1)The following PIK balances do not include $4.4 million and $0.6 million of PIK related to Insurance Solutions investments as of December 31, 2024, and 2023, respectively.
Note 13. Deferred acquisition costs
Information regarding total DAC for December 31, 2024, and December 31, 2023:
| Balance at January 1, 2024 | Capitalization | Amortization | Balance at December 31, 2024 | |||||||||||||||||||||||
| DAC: | ||||||||||||||||||||||||||
| MYGA | $ | $ | $ | ( | $ | |||||||||||||||||||||
| Balance at January 1, 2023 | Capitalization | Amortization | Balance at December 31, 2023 | |||||||||||||||||||||||
| DAC: | ||||||||||||||||||||||||||
| MYGA | $ | $ | $ | ( | $ | |||||||||||||||||||||
Significant methodologies and assumptions
The Company amortizes DAC related to long-duration contracts on a straight-line basis, at the individual level over the expected term of the related contract.
F-61
The amortization expense for DAC is included in the Amortization of deferred acquisition costs in the Consolidated Statements of Operations. The estimated future amortization expense related to DAC for the future years is as follows:
| As of | December 31, 2024 | |||||||
| 2025 | $ | |||||||
| 2026 | ||||||||
| 2027 | ||||||||
| 2028 | ||||||||
| 2029 and thereafter | ||||||||
| Total | $ | |||||||
Note 14. Future policy benefits and related reinsurance recoverable
Future policy benefits comprise substantially all obligations to insureds in the Company’s insurance operations. A summary of future policy benefits and reinsurance recoverable are presented below.
| As of | December 31, 2024 | December 31, 2023 | ||||||||||||
| Reinsurance recoverable | ||||||||||||||
| Long term care reinsurance | $ | $ | ||||||||||||
| Other | ||||||||||||||
Modco investments Vista(1) | ( | ( | ||||||||||||
| Total reinsurance recoverable | $ | $ | ||||||||||||
| Future policy benefits | ||||||||||||||
| Long term care insurance | $ | $ | ||||||||||||
| Other | ||||||||||||||
| Total future policy benefits | $ | $ | ||||||||||||
| Funds held under reinsurance contracts | ||||||||||||||
Funds held arrangement Front Street Re(1) | $ | $ | ||||||||||||
______________
F-62
The following tables summarize balances of and changes in future policy benefits reserves:
| Long-term care | December 31, 2024 | December 31, 2023 | ||||||||||||
| Present value of expected net premiums | ||||||||||||||
| Balance, beginning of year | $ | $ | ||||||||||||
| Beginning balance at locked-in discount rate | $ | $ | ||||||||||||
| Effect of changes in cashflow assumptions | ( | |||||||||||||
| Effect of actual variances from expected experience | ( | ( | ||||||||||||
| Adjusted balance, beginning of year | ||||||||||||||
| Interest accrual | ||||||||||||||
| Net premiums collected | ( | ( | ||||||||||||
| Effect of foreign currency | — | — | ||||||||||||
| Ending balance at locked-in discount rate | ||||||||||||||
| Effect of changes in discount rate assumptions | ( | ( | ||||||||||||
| Balance, end of year | $ | $ | ||||||||||||
| Present value of Expected Future Policy Benefits | ||||||||||||||
| Balance, beginning of year | $ | $ | ||||||||||||
| Beginning balance at locked-in discount rate | $ | $ | ||||||||||||
| Effect of changes in cashflow assumptions | ||||||||||||||
| Effect of actual variances from expected experience | ( | |||||||||||||
| Adjusted balance, beginning of year | ||||||||||||||
| Interest accrual | ||||||||||||||
| Benefit payments | ( | ( | ||||||||||||
| Ending balance at locked-in discount rate | $ | $ | ||||||||||||
| Effect of changes in discount rate assumptions | ( | ( | ||||||||||||
| Balance, end of year | $ | $ | ||||||||||||
Net future policy benefit reserves(1) | $ | $ | ||||||||||||
Less: Reinsurance recoverables, net of allowance for credit losses (2) | ( | ( | ||||||||||||
| Net future policy benefit reserves, after reinsurance recoverables | $ | $ | ||||||||||||
______________
(1)Net future policy benefit reserves excludes $4.4 100
(2)Reinsurance recoverables, net of allowance for credit losses excludes $4.4
The 2024 and 2023 annual reviews of future policy benefit reserves cash flow assumptions resulted in charges to net earnings, indicating claims experience was outside of our expectations due to both updates to the inforce policy position of the block (actual policy terminations – mortality, lapse, and benefit reductions – varying from expectations) and changes to expected future claims assumptions based upon actual experience.
F-63
The following tables provides the amount of undiscounted and discounted expected future gross premiums and expected future benefits and expenses for the LTC line of business:
| December 31, 2024 | December 31, 2023 | |||||||||||||||||||||||||
| Long-term care | Undiscounted | Discounted (1) | Undiscounted | Discounted (1) | ||||||||||||||||||||||
| Expected future gross premiums | $ | $ | $ | $ | ||||||||||||||||||||||
| Benefit payments | ||||||||||||||||||||||||||
______________
(1)Discount was determined using the current discount rate as of December 31, 2024, and December 31, 2023.
The following table provides the weighted-average durations of and weighted-average interest rates for the liability for future policy benefits:
| Long-term care | December 31, 2024 | December 31, 2023 | ||||||||||||
| Weighted-average duration of liability (years) @ current rate | ||||||||||||||
| Weighted-average duration of liability (years) @ original rate | ||||||||||||||
| Weighted-average interest rate at current rate | ||||||||||||||
| Weighted-average interest rate at original rate | ||||||||||||||
Note 15. Interest sensitive contract liabilities
The following table shows the outstanding Interest sensitive contract liabilities which represents the policyholder balances for MYGA product line:
| December 31, 2024 | December 31, 2023 | |||||||||||||
| Balance, beginning of year | $ | $ | ||||||||||||
| Deposits | ||||||||||||||
| Product charges | ( | ( | ||||||||||||
| Surrenders and withdrawals | ( | ( | ||||||||||||
| Benefit payments | ( | ( | ||||||||||||
| Interest credited | ||||||||||||||
| Balance, end of year | $ | $ | ||||||||||||
| Weighted-average annual crediting rate | % | % | ||||||||||||
| At period end: | ||||||||||||||
| Cash surrender value | $ | $ | ||||||||||||
| Net amount a risk: | ||||||||||||||
In the event of death (1) | $ | $ | ||||||||||||
______________
(1)For benefits that are payable in the event of death, the net amount at risk is generally defined as the current death benefit in excess of the current account balances at the Consolidated Statements of Financial Position date. It represents the amount of the claim that the Company would incur if death claims were filed on all contracts at the Consolidated Statements of Financial Position date.
MYGA policyholder account balances totaled $334.9 million and $256.6 million, as of December 31, 2024, and 2023, respectively. Changes in policyholder account balances are primarily attributed to deposits associated with new MYGA policies assumed of $72.8 million and $119.9 million and interest credited of $15.0 million and $9.4 million for the years ended December 31, 2024 and December 31, 2023, respectively. These increases were partially offset by surrenders, withdrawals and benefits of $9.5 million and $7.5 million for the years ended December 31, 2024 and December 31, 2023, respectively. Interest on policyholder account balances is generally
F-64
credited at minimum guaranteed rates, primarily between 2 7
Note 16. Reinsurance
The Company enters into reinsurance agreements primarily as a purchaser of reinsurance for its LTC line of business and also as a provider of reinsurance for the LTC and MYGA lines of business. The Company participates in reinsurance activities in order to limit losses, minimize exposure to significant risks and provide additional capacity for future growth.
Under the terms of the reinsurance agreements, the reinsurer agrees to reimburse the Company for the ceded amount in the event a claim is paid. Cessions under reinsurance agreements do not discharge the Company’s obligation as the primary insurer. In the event that reinsurers do not meet their obligations under the terms of the reinsurance agreements, Reinsurance recoverable balances could become uncollectible.
Accounting for reinsurance requires extensive use of assumptions and estimates, particularly related to the future performance of the underlying business and the potential impact of counterparty credit risks.
Reinsurance recoverable
The Company reinsures its business through two reinsurers. The Company monitors ratings and evaluates the financial strength of its reinsurers by analyzing their financial statements. In addition, the reinsurance recoverable balance due from each reinsurer is evaluated as part of the overall monitoring process. Recoverability of reinsurance recoverable balances is evaluated based on these analyses. The Company uses collateral for its reinsurance recoverable with funds withheld accounts. These reinsurance recoverable balances are stated net of allowance for expected credit loss of $0.8 million and $1.2 million at December 31, 2024, and December 31, 2023, respectively. The Company had $450.2 million and $467.9 million of net ceded Reinsurance recoverable at December 31, 2024, and December 31, 2023, respectively. The Company had $31.1 million and $37.9 million of unsecured Reinsurance recoverable balances at December 31, 2024 and December 31, 2023, respectively.
The amounts in the Consolidated Statements of Financial Position include the impact of reinsurance. Information regarding the significant effects of reinsurance was as follows at:
| Long-term care | December 31, 2024 | December 31, 2023 | ||||||||||||
| Reinsurance recoverable | ||||||||||||||
| Reinsurance ceded, net of allowance on for credit losses | $ | $ | ||||||||||||
| Total reinsurance recoverable | $ | $ | ||||||||||||
| Future policy benefits | ||||||||||||||
| Direct | $ | $ | ||||||||||||
| Reinsurance assumed | ||||||||||||||
| Total future policy benefits | $ | $ | ||||||||||||
F-65
The amounts in the Consolidated Statements of Comprehensive Income (Loss) include the impact of reinsurance. Information regarding the significant effects of reinsurance was as follows:
| Long-term care | ||||||||||||||
| For the years ended | December 31, 2024 | December 31, 2023 | ||||||||||||
| Net premiums | ||||||||||||||
| Direct premiums | $ | $ | ||||||||||||
| Reinsurance assumed | ||||||||||||||
| Reinsurance ceded | ( | ( | ||||||||||||
| Total net premiums | $ | ( | $ | ( | ||||||||||
Net policy benefit and claims (remeasurement gain on policy liabilities of $ | ||||||||||||||
| Direct | $ | $ | ||||||||||||
| Reinsurance assumed | ||||||||||||||
Reinsurance ceded, net of provision for credit losses(1) | ( | ( | ||||||||||||
| Total net policyholder benefits and claims | $ | ( | $ | ( | ||||||||||
______________
(1)The provision for credit losses for reinsurance recoverables for the years ended December 31, 2024, and December 31, 2023 is $(0.4 ) million and $0.1 million, respectively.
F-66
Note 17. Other assets and Accrued expenses and other liabilities
Other assets consist of the following:
| As of | December 31, 2024 | December 31, 2023 | ||||||||||||
| Asset Management | ||||||||||||||
| Management fee receivable - related parties | $ | $ | ||||||||||||
| Incentive fee receivable - related parties | ||||||||||||||
| Deferred tax assets | ||||||||||||||
| Prepaid income taxes | ||||||||||||||
| Accrued interest and dividends receivable | ||||||||||||||
| Ovation goodwill | ||||||||||||||
| Operating lease right of use asset | ||||||||||||||
| Deferred offering costs | ||||||||||||||
| Prepaid insurance | ||||||||||||||
| Other | ||||||||||||||
| Total other assets — Asset Management | ||||||||||||||
| Insurance Solutions | ||||||||||||||
| Accrued investment income | ||||||||||||||
Receivable for investments sold (1) | ||||||||||||||
| Guaranty funds on deposit | ||||||||||||||
| Other | ||||||||||||||
| Total other assets — Insurance Solutions | ||||||||||||||
| Interest receivable of consolidated VIEs | ||||||||||||||
| Total other assets —— Insurance Solutions including consolidated VIEs | ||||||||||||||
| Total other assets | $ | $ | ||||||||||||
______________
(1)Represents amounts due from third-parties for investment sales for which a cash settlement has not occurred.
Other liabilities and accrued expenses consist of the following:
| As of | December 31, 2024 | December 31, 2023 | ||||||||||||
| Asset Management | ||||||||||||||
Payable for investments purchased (1) | $ | $ | ||||||||||||
| Operating lease liabilities | ||||||||||||||
| Accounts payable and accrued liabilities | ||||||||||||||
| Total accrued expenses and other liabilities — Asset Management | ||||||||||||||
| Insurance Solutions | ||||||||||||||
Payable for investments purchased (1) | ||||||||||||||
| Other accrued expenses | ||||||||||||||
| Total accrued expenses and other liabilities — Insurance Solutions | ||||||||||||||
| Total accrued expenses and other liabilities | $ | $ | ||||||||||||
______________
(1)Represents amounts owed to third-parties for investment purchases for which a cash settlement has not occurred.
F-67
Note 18. Income taxes
Current tax is the amount of income tax recoverable (payable) in respect of the taxable loss (profit) for a period. Deferred tax is recognized on temporary differences between the carrying amounts of assets and liabilities for accounting and tax purposes. Deferred income tax assets and liabilities are measured at the tax rates expected to apply when temporary differences reverse. Current and deferred taxes are offset only when they are levied by the same tax authority, on the same entity or group of entities, and when there is a legal right to offset.
Income earned through the Company's foreign subsidiaries is generally taxed in the foreign country in which they operate. Canada also taxes the income earned through the Company's controlled foreign subsidiaries and a deduction is allowed for certain foreign taxes paid on such income.
The effective income tax rate reflected in the Consolidated Statements of Operations varies from the Canadian tax rate of 26.50 percent for the year ended December 31, 2024 (December 31, 2023 – 26.50 percent) for the items outlined in the following table.
| Year Ended December 31, | ||||||||||||||
| 2024 | 2023 | |||||||||||||
| Income (loss) before taxes | $ | ( | $ | ( | ||||||||||
| Income tax rate | % | % | ||||||||||||
| Income tax expense at Canadian statutory tax rate | ( | ( | ||||||||||||
| Permanent differences in tax rate on income not subject to tax | ||||||||||||||
| Valuation allowance on deferred tax assets | ( | |||||||||||||
| Foreign rate differentials | ( | |||||||||||||
| Foreign accrual property income impact | ( | |||||||||||||
| Other | ( | |||||||||||||
| Income tax expense (benefit) — Asset Management | $ | $ | ||||||||||||
Deferred tax assets
The details of income (loss) before income taxes by jurisdiction for Asset Management are as follows:
| Year Ended December 31, | ||||||||||||||
| 2024 | 2023 | |||||||||||||
| Canadian | $ | ( | $ | ( | ||||||||||
| Foreign | ( | |||||||||||||
| Income (loss) before taxes | $ | ( | $ | ( | ||||||||||
F-68
The details of the income tax provision by jurisdiction for Asset Management are as follows:
| Year Ended December 31, | ||||||||||||||
| 2024 | 2023 | |||||||||||||
| Current tax | ||||||||||||||
| Canadian | $ | $ | ||||||||||||
| Foreign | ||||||||||||||
| Total current tax | ||||||||||||||
| Deferred tax | ||||||||||||||
| Canadian | ||||||||||||||
| Foreign | ( | |||||||||||||
| Total deferred tax | ( | |||||||||||||
| Income tax expense (benefit) — Asset Management | $ | $ | ||||||||||||
Deferred tax assets and liabilities consists of the following temporary differences:
| Year Ended December 31, | ||||||||||||||
| 2024 | 2023 | |||||||||||||
| Assets | ||||||||||||||
| Tax benefit of loss carryforward | $ | $ | ||||||||||||
| Tax benefit of expenditure pools | ||||||||||||||
| Deferred acquisition costs | ||||||||||||||
| Unrealized losses on remeasurement of investments | ||||||||||||||
| Other assets tax value in excess of book value | ||||||||||||||
| Total deferred tax assets | ||||||||||||||
| Valuation allowance | ( | ( | ||||||||||||
| Total deferred tax assets, net of valuation allowance | $ | $ | ||||||||||||
| Liabilities | ||||||||||||||
| Insurance reserves | $ | ( | $ | ( | ||||||||||
| Other | ( | ( | ||||||||||||
| Total deferred tax liabilities | $ | ( | $ | ( | ||||||||||
| Net deferred tax assets | $ | $ | ||||||||||||
The Company has assessed the realizability of deferred tax assets as recognized by tax jurisdiction and tax paying component. This assessment considered recent history and projections of future taxable income, the ability to carryback tax losses under the local tax law, existing deferred tax liabilities, and prudent and feasible tax planning strategies. Based upon this assessment, the Company has recognized a valuation allowance of $44.6 million. Of this amount, $31.2 million is related to Canadian operations and $13.4 million is related Ability Insurance Company.
Income taxes paid in cash (net of refunds) for the year ended December 31, 2024 were $0.8 million (December 31, 2023 - $0.9 million).
The Company considers its significant tax jurisdictions to include Canada and the United States. The Company remains subject to income tax examination in Canada for years after 2017, and U.S. federal jurisdiction for year after 2020.
F-69
Note 19. Equity
Common shares
The Company is authorized to issue an unlimited number of common shares, without par value, for unlimited consideration. The common shares are not redeemable or convertible. Dividends are declared by the Board at its discretion. Historically, the Board has declared dividends on a quarterly basis and the amount can vary from quarter to quarter.
The Company issued shares of common stock in settlement of vested RSUs, during the year ended December 31, 2024, and December 31, 2023. There were 25,895,612 25,733,735 161,877 shares (net of tax) in respect of vested RSUs (inclusive of Dividend Equivalent Units (“DEUs”)) during the year ended December 31, 2024. The Company issued an aggregate of 357,142 common shares in consideration for the acquisition of a minority interest in Marret Asset Management Inc., and an aggregate of 3,186,398 common shares as partial consideration for the acquisition of Ovation, during the year ended December 31, 2023. There were no other transactions with shareholders for the years ended December 31, 2024 and December 31, 2023.
Preference shares
The Company is authorized to issue an unlimited number of preference shares, without par value, in series, for unlimited consideration. There were no preference shares outstanding as of December 31, 2024, and December 31, 2023.
Dividends
Dividends to the Company's shareholders are recorded on the declaration date. The payment of any cash dividend to shareholders of the Company in the future will be at the discretion of the Board and will depend on, among other things, the financial condition, capital requirements and earnings of the Company, and any other factors that the Board may consider relevant.
The Business Corporations Act (Ontario) (“OBCA”) provides that a corporation may not declare or pay a dividend if there are reasonable grounds for believing that the corporation is, or would be after the payment of the dividend, unable to pay its liabilities as they become due or the realizable value of its assets would thereby be less than the aggregate of its liabilities and stated capital of all classes of shares of its capital. Furthermore, holders of common shares may be subject to the prior dividends rights of holders of preference shares, if any, then outstanding.
The following table reflects the distributions declared on the common shares of the Company during the years ended December 31, 2024, and December 31, 2023:
| Dividend amount per share | Total dividend amount | |||||||||||||||||||||||||||||||||||||
| Declaration Date | Record Date | Payment Date | CAD | USD (1) | CAD | USD (1) | ||||||||||||||||||||||||||||||||
| March 13, 2024 | March 25, 2024 | April 2, 2024 | $ | $ | $ | $ | ||||||||||||||||||||||||||||||||
| May 9, 2024 | May 22, 2024 | May 31, 2024 | ||||||||||||||||||||||||||||||||||||
| August 8, 2024 | August 22, 2024 | August 30, 2024 | ||||||||||||||||||||||||||||||||||||
| November 7, 2024 | November 22, 2024 | November 29, 2024 | ||||||||||||||||||||||||||||||||||||
| $ | $ | |||||||||||||||||||||||||||||||||||||
| March 22, 2023 | April 4, 2023 | April 14, 2023 | $ | $ | $ | $ | ||||||||||||||||||||||||||||||||
| May 10, 2023 | May 18, 2023 | May 31, 2023 | ||||||||||||||||||||||||||||||||||||
| August 9, 2023 | August 22, 2023 | August 31, 2023 | ||||||||||||||||||||||||||||||||||||
| November 8, 2023 | November 20, 2023 | November 30, 2023 | ||||||||||||||||||||||||||||||||||||
| $ | $ | |||||||||||||||||||||||||||||||||||||
______________
(1)Dividends are issued and paid in CAD. For reporting purposes, amounts recorded in equity are translated to USD using the daily exchange rate on the date of declaration.
F-70
Warrants
In connection with the private placement on July 20, 2021, the Company issued an aggregate of 76,923 broker warrants, each of which is exercisable to acquire one common share at any time up to January 20, 2023 at an exercise price of C$3.90 . All broker warrants expired unexercised during 2023. The Company issued to shareholders who made an election to acquire warrants under the Arrangement warrants to acquire an aggregate of 20,468,128 6.16 per common share. The Arrangement Warrants are exercisable at any time up to October 19, 2025. Accordingly, an aggregate of up to 2,558,516 common shares are issuable upon the exercise of the 20,468,128
Separately on January 26, 2024, the Company issued 50 common share purchase warrants for each of the 18,752 Debenture Units (“Debenture Units”) that were issued on a non-brokered private placement (refer to Note 12 Debt obligations for further detail). Each of the debt warrants is exercisable to acquire one common share of the Company at a price of C$2.75 per share for a period of eight (8 ) years, from the issuance thereof, provided that the warrants are not permitted to be exercised within the first twelve (12 ) months from the issuance thereof. Accordingly, an aggregate of up to 937,600 common shares are issuable upon the exercise of the 937,600 outstanding debt warrants as at December 31, 2024.
Accumulated other comprehensive income (loss)
| Unrealized investment gains (losses) on available-for-sale securities | Unrealized gains (losses) on hedging instruments | Remeasurement gains (losses) on future policy benefits related to discount rate | Cumulative translation adjustment | Accumulated other comprehensive income (loss) | ||||||||||||||||||||||||||||
| Balance at December 31, 2023 | $ | ( | $ | $ | $ | ( | $ | |||||||||||||||||||||||||
| Other comprehensive income (loss), before reclassifications | ( | — | ||||||||||||||||||||||||||||||
| Less: reclassification adjustments for gains (losses) realized | ( | — | — | — | ( | |||||||||||||||||||||||||||
| Less: Income tax expense (benefit) | — | — | — | — | ||||||||||||||||||||||||||||
| Balance at December 31, 2024 | $ | ( | $ | ( | $ | $ | ( | $ | ||||||||||||||||||||||||
| Unrealized investment gains (losses) on available-for-sale securities | Unrealized gains (losses) on hedging instruments | Remeasurement gains (losses) on future policy benefits related to discount rate | Cumulative translation adjustment | Accumulated other comprehensive income (loss) | ||||||||||||||||||||||||||||
| Balance at December 31, 2022 | $ | ( | $ | $ | $ | ( | $ | |||||||||||||||||||||||||
| Other comprehensive income (loss), before reclassifications | — | ( | — | ( | ||||||||||||||||||||||||||||
| Less: reclassification adjustments for gains (losses) realized | — | — | — | |||||||||||||||||||||||||||||
| Less: Income tax expense (benefit) | — | — | — | — | ||||||||||||||||||||||||||||
| Balance at December 31, 2023 | $ | ( | $ | $ | $ | ( | $ | |||||||||||||||||||||||||
F-71
Note 20. Equity based compensation
Stock option plan and performance and restricted share unit plan
On May 30, 2019, the Company’s shareholders approved (i) a stock option plan (the “Option Plan”) and (ii) the RSU Plan, which were each re-approved by the shareholders on June 7, 2024. On June 7, 2024, the shareholders approved certain amendments to both the Option Plan and RSU Plan to, among other things, increase the rolling limit thereunder from 10 % to 15 % of the common shares then issued and outstanding.
Option Plan
The Option Plan provides that the administrators may, from time to time, at their discretion, grant to directors, officers, employees and certain other service providers of the Company or its subsidiaries options to purchase common shares of the Company in connection with their employment or position. The aggregate number of common shares that are issuable under the Option Plan upon the exercise of options which have been granted and are outstanding, together with common shares that are issuable pursuant to outstanding awards and grants under any other share compensation arrangement of the Company (including the RSU Plan), shall not at any time exceed 15 % of the common shares then issued and outstanding. The purchase price for any common shares underlying an option shall not be less than the fair market value of a common share on the date the option is granted, being the closing price of the common shares on the NEO Exchange on the last trading day before the date of grant. Options granted under the Option Plan have a maximum term of 10 years from the date of grant.
There were no nil
RSU Plan
The aggregate number of common shares that are issuable under the RSU Plan to pay awards which have been granted and are outstanding under the RSU Plan, together with common shares that are issuable pursuant to outstanding awards or grants under any other share compensation arrangement of the Company (including the Option Plan), shall not exceed at any time 15 % of the common shares then issued and outstanding.
RSU grants are made in the form of equity-settled awards that typically vest one-third annually beginning one year after the grant date (unless approved otherwise by the Board to vest based on specified terms over a specified period), whereby one vested RSU will be exchanged for one common share. The grant date fair value of each equity-settled RSU unit is calculated based on the grant date’s previous day closing price per common share of the Company on Cboe Canada.
The Company awarded 1,435,700 RSUs with a grant date fair value of $2.3 million during the year ended December 31, 2024. No RSUs were awarded in 2023.
The Company recorded equity-based compensation expense related to RSUs awarded from profit sharing arrangements of $0.6 million and $0.3 million, during the years ended December 31, 2024, and December 31, 2023, respectively. There was $2.4 million of total unrecognized equity-based compensation expense related to unvested RSUs, which is expected to be recognized over a weighted-average term of 2.5 years, as of December 31, 2024. The Company has elected to account for forfeitures as they occur. Expense is recognized on a straight line basis over the life of the award.
F-72
A summary of the status of service-vesting awards granted under the RSU Plan for years ended December 31, 2024, and December 31, 2023 is presented below:
| RSUs and DEUs Outstanding | ||||||||||||||||||||||||||||||||
| RSUs | Weighted average grant date fair value | DEUs | Weighted average grant date fair value | Total | ||||||||||||||||||||||||||||
| Unvested balance, January 1, 2023 | $ | $ | $ | $ | $ | |||||||||||||||||||||||||||
| Granted | ||||||||||||||||||||||||||||||||
| Vested | ( | ( | ( | |||||||||||||||||||||||||||||
| Forfeitures | ||||||||||||||||||||||||||||||||
| Unvested balance, December 31, 2023 | $ | $ | $ | $ | $ | |||||||||||||||||||||||||||
| Granted | ||||||||||||||||||||||||||||||||
| Vested | ( | ( | ( | |||||||||||||||||||||||||||||
| Forfeitures | ( | ( | ( | |||||||||||||||||||||||||||||
| Unvested balance, December 31, 2024 | $ | $ | $ | $ | $ | |||||||||||||||||||||||||||
Note 21. Earnings per share
Basic earnings per share is calculated by dividing net income or loss attributable to common shareholders by the weighted average number of common shares outstanding during the period. Diluted earnings per share is calculated in the same manner, with further adjustments made to reflect the dilutive impact of instruments convertible into the Company’s common shares.
The Company has granted RSUs that provide the right to receive, subject to vesting during continued employment, shares of common stock pursuant to the RSU Plan. Any dividend equivalent paid to an employee on RSUs will be returned to the Company upon forfeiture of the award by the employee. Unvested RSUs that are entitled to forfeitable dividend equivalents do not qualify as participating securities and are excluded in the Company’s basic and diluted earnings per share computations. Vested RSUs qualify as participating securities and are included in the Company’s diluted earnings per share computation.
The Company also has issued warrants which are exercisable to acquire one common share at a defined exercise price.
F-73
The following table sets forth the computation of basic and diluted income (loss) per common share for the years ended December 31, 2024, and December 31, 2023:
| For the year ended | December 31, 2024 | December 31 2023 | ||||||||||||
| Basic earnings per share | ||||||||||||||
| Net income (loss) | $ | ( | $ | ( | ||||||||||
| Weighted-average number of common shares outstanding | ||||||||||||||
| Basic earnings per share | $ | ( | $ | ( | ||||||||||
| Diluted earnings per share | ||||||||||||||
| Net income (loss) | $ | ( | $ | ( | ||||||||||
| Weighted-average number of common shares outstanding | ||||||||||||||
| Incremental Common Shares | ||||||||||||||
Assumed exercise of warrants (1) | ||||||||||||||
Common shares potentially issuable (2) | ||||||||||||||
| Weighted-average number of diluted common shares outstanding | ||||||||||||||
| Diluted earnings per share | $ | ( | $ | ( | ||||||||||
_______________
(1)For the year ended December 31, 2024, the Arrangement Warrants are excluded from the calculation of diluted earnings per share given the exercise price is greater than the average market price of the Company's common stock (i.e., they were “out of the money”). The debt warrants are also excluded as they would have been anti-dilutive. For the year ended December 31, 2023, both the Arrangement Warrants and debt warrants are excluded from the calculation of diluted earnings per share given the exercise price on both sets of warrants is greater than the average market price of the Company's common shares, and would also have been anti-dilutive.
(2)For the year ended December 31, 2024, and December 31, 2023, RSUs granted are anti-dilutive and are excluded from the calculation of diluted earnings per share.
The following table summarizes the anti-dilutive securities that are excluded from the computation of diluted income (loss) per share:
| For the year ended | December 31 2024 | December 31 2023 | ||||||||||||
| Anti-dilutive Securities | ||||||||||||||
| Weighted-average number of unexcercised warrants | ||||||||||||||
| Weighted-average number RSUs outstanding, inclusive of DEUs | ||||||||||||||
| Total common shares equivalent | ||||||||||||||
Note 22. Related parties
Servicing Agreement
On November 20, 2018, the Company entered into a servicing agreement (the “Servicing Agreement”) with BC Partners Advisors L.P. (“BCPA”). Under the terms of the Servicing Agreement, BCPA as servicing agent (the “Servicing Agent”) performs (or oversees, or arranges for, the performance of) the administrative services necessary for the operation of the Company, including, without limitation, office facilities, equipment, bookkeeping and recordkeeping services and such other services the Servicing Agent, subject to review by the Board, shall from time to time deem necessary or useful to perform its obligations under this Servicing Agreement. The Servicing Agent is authorized to enter into sub-administration agreements as determined to be necessary in order to carry out the administrative services.
Unless earlier terminated as described below, the Servicing Agreement will remain in effect from year-to-year if approved annually by (i) the vote of the Board and (ii) the vote of a majority of the Company’s directors who are not parties to the Servicing Agreement or a “related party” of the Servicing Agent, or of any of its affiliates. The
F-74
Servicing Agreement may be terminated at any time, without the payment of any penalty, upon 60 days’ written notice by the vote of the Board or by the Servicing Agent.
The Company reimburses BCPA for an allocable portion of compensation paid to the Company’s Chief Financial Officer, associated management personnel (based on a percentage of time such individuals devote, on an estimated basis, to the business affairs of the Company), and out-of-pocket expenses. While the Servicing Agent performs certain administrative functions for the Company, the management functions of the Company are wholly performed by the Company’s management team. For the year ended December 31, 2024, the Company incurred administrative fees of $3.9 million (December 31, 2023 – $3.7 million). As at December 31, 2024, administration fees payable to BCPA was $1.2 million (December 31, 2023–$1.3 million).
Transactions with Affiliates - servicing fees
The Company, through MLC US Holdings, a wholly-owned subsidiary of the Company, provides certain administrative services to SCIM in respect of the management of an investment fund (“ACIF”) in exchange for a servicing fee. Servicing fees are determined quarterly based on an amount equal to the aggregate base management fee and incentive fees received by SCIM from ACIF in respect of such quarter, net of debt servicing expense, a quarterly fee to be retained by SCIM comprised of a specified amount, and an allocable portion of the compensation of SCIM’s investment professionals in connection with their performance of investment advisory services for ACIF (collectively, the “Retained Benefits”). In addition, SCIM is reimbursed by MLC US Holdings quarterly for certain expenses it incurs in connection with the investment advisory services provided to ACIF. Pursuant to this arrangement, the Company receives the net economic benefit derived by SCIM under the ACIF advisory agreement, subject to the holdback of the Retained Benefits and expense reimbursements. For the year ended December 31, 2024, the Company incurred servicing fees of $2.5 million (December 31, 2023 – $0.3 million).
The Company, through MLC US Holdings, a wholly-owned subsidiary of the Company, issued a promissory note to SCIM on October 30, 2020, with a maturity of October 30, 2040. The note’s value is not to exceed $15 M and bears interest at 8.0 % per annum, payable quarterly, for the first 10 years. During the second 10 years outstanding, repayments of the note shall occur in equal quarterly installment payments, bearing interest at 8.0 % per annum, plus an additional 2 % annually on overdue principal. For the year ended December 31, 2024, the total value of the note was $13.6 million (December 31, 2023: $13.6 million). For the year ended December 31, 2024, total interest income was $1.1 million (December 31, 2023: $1.1 million). As at December 31, 2024, the total accrued interest income receivable was $1.9 million (December 31, 2023: $0.8 million).
Potential Conflicts of Interest
The Company's senior management team is comprised of substantially the same personnel as the senior management team of BCPA, and such personnel may serve in similar or other capacities for BCPA or to future investment vehicles affiliated with BC Partners. As a result, such personnel provide investment advisory services to the Company and certain investment vehicles considered affiliates of BC Partners.
Compensation of Key Management Personnel
The Company's key management personnel are those personnel who have the authority and responsibility for planning, directing and controlling the activities of the Company. Directors (both executive and non-executive) are considered key personnel. Certain directors and officers of the Company are affiliated with BCPA. For the year ended December 31, 2024, the Chief Executive Officer (“CEO”) and Co-presidents will receive no cash salary or bonuses of any kind. Instead, their compensation will be 100 % equity-based compensation granted pursuant to the Company's security-based compensation arrangements that vests over time for services rendered. The CEO and Co-presidents had a total of 659,557 Restricted Share Units (“RSUs”), inclusive of DEUs outstanding as at December 31, 2024 (December 31, 2023 - 165,664 ), which vest over to three years . There were 595,000 RSUs and 8,441 DEUs declared and issued to the CEO and Co-presidents during the year ended December 31, 2024 (December 31, 2023 - nil RSUs and 5,313 DEUs). See Note 20 Equity Based Compensation and Note 21 Earnings Per Share for more information. No person or employee of the Servicing Agent or its affiliates that serves as a director of the Company receives any compensation from the Company for his or her services as a director.
F-75
Common shares held by directors and officers of the Company who are affiliated with BCPA at December 31, 2024 were 804,679 (December 31, 2023 – 645,370 ).
Other Transactions with BCPA or their Affiliates
The Servicing Agent may, from time to time, pay amounts owed by the Company to third-party providers of goods or services, and the Company will subsequently reimburse the Servicing Agent for such amounts paid on its behalf. Amounts payable to the Servicing Agent are settled in the normal course of business without any formal payment terms. As at December 31, 2024, operating expenses reimbursable to BCPA for amounts paid on behalf of the Company was $7.4 million (December 31, 2023 – $11.4 million).
The Company may, from time to time, enter into transactions in the normal course of operations with entities that are considered affiliates involved in the credit business of BCPA (“BCPA Credit Affiliates”). At December 31, 2024, Asset Management held investments with affiliates of BCPA Credit Affiliates totaling $20.9 million (December 31, 2023 – $24.7 million), and Insurance Solutions held investments with affiliates of BCPA Credit Affiliates totaling $23.7 million (December 31, 2023 – $24.7 million). On these investments, Asset Management recognized (i) interest income of $1.1 million for the year ended December 31, 2024 (December 31, 2023 - $1.1 million), (ii) earnings on equity method investments of $0.7 million for the year ended December 31, 2024 (December 31, 2023 - $1.1 million), and (iii) dividend income on equity securities of $0.4 million for the year ended December 31, 2024 (December 31, 2023: $0.4 million). On these investments, Insurance Solutions recognized (i) interest income of $2.4 million for the year December 31, 2024 (December 31, 2023 - $1.6 million) and (ii) dividend income of $0.3 million for the year ended December 31, 2024 (December 31, 2023 - $0.2 million).
Further, for the year ended December 31, 2024, the Company incurred expenses of $7.2 million (December 31, 2023 - $7.4 million) to an affiliate, for third party administrative services relating to Ability for administering its long-term care block of business. As at December 31, 2024, there was a payable to this affiliate of $0.6 million (December 31, 2023 – $0.6 million).
Note 23. Segments
The Company conducts its business through two reportable segments: Asset Management and Insurance Solutions. The Company defines operating segments by type of product and business line. The Asset Management segment comprises of a single operating segment encompassing all fee generating activities. The Insurance Solutions segment consists of two product lines within the insurance business, LTC and MYGA, that are a single reportable segment.
Segment information is utilized by the Company’s chief operating decision maker (“CODM”) to assess performance and to allocate resources. The Company’s Chief Executive Officer (“CEO”) is the CODM, who is also solely responsible for decisions related to the allocation of resources on a company-wide basis.
For each segment, the CODM uses the key measure of Segment Income to allocate resources (including employees, financial or capital resources) to that segment in the annual budget and forecasting process. The performance is measured by the Company’s CODM on an unconsolidated basis because the CODM makes operating decisions and assesses the performance of each of the Company’s business segments based on financial and operating metrics and data that exclude the effects of consolidation. Each reportable segment is then responsible for managing its operating results, developing products, defining strategies for services and distributions based on the profile and needs of its business and market.
Segment Income
Segment Income is the key performance measure used by the CODM in evaluating the performance of the asset management and insurance solutions segments. The CODM uses Segment Income to make key operating decisions such as the following:
•decisions related to the allocation of resources such as staffing decisions, including hiring and locations for deployment of the new hires;
F-76
•decisions related to capital deployment such as providing capital to facilitate growth for the business and/or to facilitate expansion into new businesses;
•decisions related to expenses, such as determining annual discretionary bonuses and equity-based compensation awards to its employees and/or service providers.
Segment Income is a measure of profitability and has certain limitations in that it does not take into account certain items included under U.S. GAAP. Segment Income is the sum of (i) Fee Related Earnings and (ii) Spread Related Earnings. Segment Income excludes the effects of the consolidation of each segment, taxes and related payables, and other items unique to deriving each segment’s performance metric as explained respectively below.
Segment Income may not be comparable to similarly titled measures used by other companies and is not a measure of performance calculated in accordance with U.S. GAAP. We use Segment Income as a measure of operating performance, not as a measure of liquidity. Segment Income should not be considered in isolation or as a substitute for net income or other income data prepared in accordance with U.S. GAAP. The use of Segment Income without consideration of related U.S. GAAP measures is not adequate due to the adjustments described above. Management compensates for these limitations by using Segment Income as a supplemental measure to U.S. GAAP results, to provide a more complete understanding of our performance as management measures it. A reconciliation of Segment Income to its most directly comparable U.S. GAAP measure of income (loss) before income tax provision can be found in this footnote.
Fee Related Earnings
Fee Related Earnings (“FRE”) is a component of Segment Income that is used to assess the performance of the Asset Management segment. FRE is the sum of (i) management fees, (ii) performance fees received from certain managed funds (iii) equity investment earnings related to fee generating vehicles, and (iv) interest income attributable to investment management activity, less (a) fee-related compensation, excluding equity-based compensation, and (b) other associated operating expenses, which excludes amortization of acquisition-related intangible assets and interest and other credit facility expenses.
FRE excludes non-fee generating revenues and expenses, transaction-related charges, equity-based compensation costs, the amortization of intangible assets, the operating results of VIEs that are included in the consolidated financial statements, and any other non-recurring income and expenses. In addition, FRE excludes interest and other financing costs related to the Company not attributable to any specific segment, and corporate overhead expenses incurred to support the operations of the business rather than directly fee-related. Management considers these types of costs corporate in nature, and are included only for reconciliation purposes to income (loss) before income tax (provision) benefit.
Spread Related Earnings
Spread Related Earnings (“SRE”) is a component of Segment Income that is used to assess the performance of the Insurance Solutions segment, excluding certain market volatility, which consists of investment gains (losses), other income and certain general, administrative & other expenses. For the Insurance Solutions segment, SRE equals the sum of (i) the net investment earnings on Insurance Solutions segment’s net invested assets (excluding investment earnings on funds held under reinsurance contracts and modified coinsurance agreement), less (ii) cost of funds (as described below), (iii) compensation and benefits, (iv) interest expense and (v) operating expenses.
Cost of funds includes liability costs associated with the crediting cost on MYGA liabilities as well as other liability costs. Other liability costs include DAC amortization, the cost of liabilities associated with LTC, net of reinsurance, which includes change in reserves, premiums, actual claim experience including related expenses and certain product charges related to MYGA.
F-77
The following presents financial data for the Company’s reportable segments and the reconciliation of Segment Income to Income (loss) before taxes reported in the Consolidated Statements of Operations:
| For the year ended | December 31, 2024 | December 31, 2023 | ||||||||||||
| Asset Management | ||||||||||||||
| Management fees | $ | $ | ||||||||||||
| Incentive fees | ||||||||||||||
| Equity investment earnings | ||||||||||||||
Interest income(1) | ||||||||||||||
| Fee-related compensation | ( | ( | ||||||||||||
| Other operating expenses: | ||||||||||||||
| Administration and servicing fees | ( | ( | ||||||||||||
| General, administrative and other | ( | ( | ||||||||||||
| Fee related earnings | ||||||||||||||
| Insurance Solutions | ||||||||||||||
| Net investment income and realized gain (loss), net | ||||||||||||||
| Cost of funds | ( | ( | ||||||||||||
| Compensation and benefits | ( | ( | ||||||||||||
| Interest expense | ( | ( | ||||||||||||
| General, administrative and other | ( | ( | ||||||||||||
| Spread related earnings | ||||||||||||||
| Segment income | $ | $ | ||||||||||||
| Asset Management Adjustments: | ||||||||||||||
| Intersegment management fee eliminations | $ | ( | $ | ( | ||||||||||
Eliminations related to consolidated VIEs(2) | ( | |||||||||||||
Administration and servicing fees(4) | ( | ( | ||||||||||||
| Transaction costs | ( | ( | ||||||||||||
Compensation and benefits(4) | ( | ( | ||||||||||||
Equity-based compensation(4) | ( | ( | ||||||||||||
| Amortization and impairment of intangible assets | ( | ( | ||||||||||||
| Interest and other credit facility expenses | ( | ( | ||||||||||||
General, administrative and other(4) | ( | ( | ||||||||||||
| Net gains (losses) from investment activities | ( | ( | ||||||||||||
| Dividend income | ||||||||||||||
Net revenues of consolidated VIEs(3) | ||||||||||||||
| Other income (loss), net | ||||||||||||||
| Insurance Solutions Adjustments: | ||||||||||||||
Equity-based compensation(4) | ( | ( | ||||||||||||
| Net unrealized gains (losses) from investment activities | ( | ( | ||||||||||||
| Other income | ||||||||||||||
| Intersegment management fee eliminations | ||||||||||||||
General, administrative and other(5) | ( | ( | ||||||||||||
| Income (loss) before taxes | $ | ( | $ | ( | ||||||||||
_______________
(1)Represents interest income on a loan asset related to a fee generating vehicle.
F-78
(2)Represents management fees from consolidated VIEs during the period which are eliminated on consolidation. The VIEs were deconsolidated as at December 31, 2023.
(3)Represents net income of consolidated VIEs for the period during which they were consolidated for the year ended December 31, 2023.
(4)Represents corporate overhead allocated to each segment.
The following presents financial data for the Company’s reportable segments and the reconciliation of Segment Revenue to Total revenue reported in the Consolidated Statements of Operations:
| For the year ended | December 31, 2024 | December 31, 2023 | ||||||||||||
| Segment Revenues | ||||||||||||||
| Asset Management | $ | $ | ||||||||||||
| Insurance Solutions | ||||||||||||||
| Total segment revenues | ||||||||||||||
| Asset Management Adjustments: | ||||||||||||||
| Intersegment management fee eliminations | ( | ( | ||||||||||||
| Interest income | ( | ( | ||||||||||||
Eliminations related to consolidated VIEs(1) | ( | |||||||||||||
| Insurance Solutions Adjustments: | ||||||||||||||
| Net Premiums | ( | ( | ||||||||||||
| Product charges | ||||||||||||||
| Net gains (losses) from investment activities | ( | ( | ||||||||||||
| Other income | ||||||||||||||
| Intersegment management fee eliminations | ||||||||||||||
| Total revenues | $ | $ | ||||||||||||
_______________
(1)Represents management fees from a consolidated VIE during the period which are eliminated in consolidation. The VIE was deconsolidated during the year ended December 31, 2023.
The following presents financial data for the Company’s reportable segments and the reconciliation of the Company’s total reportable segment assets to total assets reported in the Consolidated Statements of Financial Position:
| As of | December 31, 2024 | December 31, 2023 | ||||||||||||
| Segments Assets | ||||||||||||||
| Asset Management | $ | $ | ||||||||||||
| Insurance Solutions | ||||||||||||||
| Total segment assets | ||||||||||||||
| Asset Management Adjustments: | ||||||||||||||
| Intersegment investments | ( | ( | ||||||||||||
| Intersegment receivables | ( | ( | ||||||||||||
| Total assets | $ | $ | ||||||||||||
Note 24. Commitments and contingencies
Investment commitments
In the normal course of business, the Company may enter into commitments to fund investments, which are not reflected in the Consolidated Financial Statements. There were $1.4 million and $43.2 million of outstanding
F-79
investment commitments as of December 31, 2024 for Asset Management and Insurance Solutions, respectively (December 31, 2023 – $1.4 million and $37.2 million).
In connection with the Capitala Acquisition, ML Management issued a promissory note to CIA for $4.0 million, which pursuant to the terms in the agreement, may increase to $6.0 million, based on the maturity date asset values of a predefined list of assets held by Logan Ridge. Refer to Note 12 Debt obligations for the expected cash outflow on this liability based on the fair value as of December 31, 2024.
Service agreements
In connection with the Capitala Acquisition, ML Management entered into a transition services agreement with CIA to provide certain non-investment advisory services upon reasonable request. There were no outstanding service fees as of December 31, 2024 (December 31, 2023 – $0.3 million) given the transition services agreement expired on March 31, 2024.
Contingent liabilities and litigation
The Company may be subject to lawsuits in the normal course of business. Insurance in particular is a highly regulated industry and lawsuits related to claim payments should be expected in the normal course of business. In the Asset Management business certain types of investment vehicles, especially those offered to individual investors, may subject the Company to a variety of risks, including new and greater levels of public and regulatory scrutiny, regulation, risk of litigation and reputation risk, which could materially and adversely affect the Company. Other potential lawsuits include allegations of mis-selling in the Insurance Solutions segment, among others. The Company considers this risk to be less likely given that Ability no longer directly writes insurance policies.
Ability at different times may receive notifications of the insolvency of various insurance companies. It is expected that such insolvencies would result in a Guaranty Fund Assessment against Ability at some future date. At this time, the Company is unable to estimate the possible amounts, if any, of such assessments as no data is available from the National Organization of Life and Health Guaranty Associations in the United States. Accordingly, the Company is unable to determine the impact, if any, that such assessments may have on its financial position or results of operations.
Ability is subject to lawsuits and regulatory actions in the normal course of business that do not arise from or directly relate to claims on insurance policies. This category of business litigation typically involves, among other things, allegations of underwriting errors or misconduct and litigation related to regulatory activity. These nonclaims litigation matters are considered when determining general expense accruals are necessary. As of December 31, 2024, there were no litigation related expense accruals. Potential legal and regulatory actions are subject to inherent uncertainties, and future events could change management’s assessment of the probability or estimated amount of potential losses from pending or threatened legal and regulatory matters. A future adverse ruling by the courts in any pending cases could have a material adverse impact on the financial condition of Ability. Based on management’s best assessment at this time, Ability is adequately reserved for these cases as of December 31, 2024.
Note 25. Capital management and regulatory requirements
The Company’s equity consists of capital and debt. In order to maintain or adjust the capital structure, the Company actively manages its equity as capital and may adjust the amount of debt borrowings, dividends paid to shareholders, return capital to shareholders, issue new shares or sell assets. The Company's capital management framework takes into account the requirements of the Company as a whole as well as the needs and requirements of each of its subsidiaries. The Company’s officers and senior management are responsible for managing the Company’s capital and do so through quarterly portfolio management meetings and regular review of financial information.
As of December 31, 2024, the Company was in compliance with all financial covenants in its debt facilities. These include restrictions on the distribution capacity from MLC US Holdings to the Company.
F-80
Insurance capital requirements
Ability is subject to minimum capital and surplus requirements. Insurance companies typically operate in excess of such requirements. Failure to maintain such minimum capital will result in regulatory actions, including in certain circumstances regulatory takeover of the insurance company.
Ability is subject to risk based capital (“RBC”) standards and other minimum capital and surplus requirements imposed by state laws. Regulatory capital requirements for Ability are determined in accordance with statutory requirements of the Nebraska Department of Insurance. The RBC requirement is a statutory minimum level of capital that is based on multiple factors including: an insurance company's size, and the inherent riskiness of its financial assets, liabilities and operations. That is, the company must hold capital in proportion to its risk. The RBC formula is intended to measure the adequacy of the insurance company’s statutory surplus in relation to the risks inherent in its business. The RBC formula requires higher surplus in relation to items deemed to have higher risk. Regulatory action is triggered beginning at 200% RBC and below. The minimum RBC ratio for Ability is 200% and Ability must have a ratio in excess of 300% to be able to reinsure new business. Ability’s RBC ratio is tested annually at the end of Ability’s financial year and estimated on a quarterly basis. When calculated at December 31, 2024 it was in excess of the minimum requirement. From time to time during a particular financial year, Ability may take steps to increase its RBC ratio to ensure it remains above the minimum requirement or exceeds the ratio required to write new business, which steps may include, among other things, securing additional funding. Ability’s minimum capital requirements do not require a minimum level of cash to be held. Ability does not have to include cash as part of its regulatory capital provided the minimum capital requirements are satisfied.
Insurance subsidiary dividend restrictions
Ability’s statutory statements are presented on the basis of accounting practices determined by the Nebraska Department of Insurance (“NEDOI”). The NEDOI recognizes only permits and/or prescribes certain statutory accounting practices determining and reporting the financial condition and results of operations of an insurance company and for determining its solvency under insurance law. The amount of dividends that Ability may pay in a twelve-month period, without prior approval by Ability, is restricted by the laws of Nebraska.
Under Nebraska law, dividends payable from Ability's unassigned funds during any twelve-month period without prior approval of the state’s Insurance Director are limited to the greater of 10% of Ability’s surplus as shown on the immediately preceding calendar year’s statutory financial statement on file with the NEDOI or 100% net gain from operations for the prior calendar year. Any dividend in excess of such limitation must be approved by the Insurance Director. Based on these restrictions, Ability could not pay any dividends to its parent absent regulatory approval as of each of December 31, 2024 and December 31, 2023.
Note 26. Concentration of Risks
Our current operations subject us to the following concentrations of risk:
Insurance Solutions
Historically, we have had a concentration of revenue from our MYGA product line which is part of our insurance operations, as the MYGA products are assumed solely from two insurance companies, ACL and SSL. We have made a decision to no longer assume business from ACL and SSL as of June 30, 2024; however, the Company is currently looking to expand this business line with other insurance/reinsurance companies. See Note 27 Subsequent Events for information regarding new reinsurance partners.
F-81
Certain concentrations of credit risk related to reinsurance recoverable exist with the insurance organizations listed in the table below:
| As of December 31, 2024 | A.M. Best credit rating | Net reinsurance recoverable (1) | Funds withheld payable | Net reinsurance credit exposure | ||||||||||||||||||||||
| Medico Insurance Company | A | $ | $ | $ | ||||||||||||||||||||||
| Front Street Re | Not Rated | |||||||||||||||||||||||||
| Vista Life and Casualty Reinsurance Co | Not Rated | |||||||||||||||||||||||||
| Total | $ | $ | $ | |||||||||||||||||||||||
| As of December 31, 2023 | A.M. Best credit rating | Net reinsurance recoverable (1) | Funds withheld payable | Net reinsurance credit exposure | ||||||||||||||||||||||
| Medico Insurance Company | A | $ | $ | $ | ||||||||||||||||||||||
| Front Street Re | Not Rated | |||||||||||||||||||||||||
| Vista Life and Casualty Reinsurance Co | Not Rated | |||||||||||||||||||||||||
| Total | $ | $ | $ | |||||||||||||||||||||||
_______________
(1)Includes credit loss allowance of $0.8 million and $1.2 million as of December 31, 2024 and 2023, respectively, held against reinsurance recoverable.
Further, our Insurance Solutions segment has the following investment concentration risk:
| December 31, 2024 | December 31, 2023 | |||||||||||||||||||||||||
| Fair value | % of total | Fair value | % of total | |||||||||||||||||||||||
| Insurance Solutions | ||||||||||||||||||||||||||
| United States | $ | % | $ | % | ||||||||||||||||||||||
| Canada | % | % | ||||||||||||||||||||||||
| Other | % | % | ||||||||||||||||||||||||
| 100 | % | 100 | % | |||||||||||||||||||||||
| Insurance Solutions consolidated VIEs | ||||||||||||||||||||||||||
| United States | % | % | ||||||||||||||||||||||||
| Canada | % | % | ||||||||||||||||||||||||
| Other | % | % | ||||||||||||||||||||||||
| 100 | % | 100 | % | |||||||||||||||||||||||
| $ | $ | |||||||||||||||||||||||||
The asset management segment does not have meaningful investment concentration risk.
Note 27. Subsequent events
Management of the Company has evaluated subsequent events through the date these financial statements were issued. Based upon this evaluation, management has determined there were no items requiring adjustment of the financial statements. Management does note the following:
On January 17, 2025, the Company announced that it had entered into a definitive agreement to combine with 180 Degree Capital Corp. (“180 Degree Capital”) (Nasdaq: TURN) in an all-stock transaction (the “Business Combination”). The surviving entity is expected to be a Delaware corporation operating as Mount Logan Capital Inc. (“New Mount Logan”) listed on Nasdaq under the symbol MLCI. In connection with the Business Combination,
F-82
shareholders of the Company will receive proportionate ownership of New Mount Logan determined by reference to the Company's transaction equity value at signing, subject to certain pre-closing adjustments, relative to 180 Degree Capital's net asset value (“NAV”) at closing.
On January 30, 2025, the Company announced it had successfully completed its previously announced minority investment in Runway Growth Capital LLC (“Runway”), alongside BCPA and certain of the BCPA Credit Affiliates, which are acquiring the remaining outstanding ownership in Runway. On closing, the Company issued to former Runway members an aggregate of 2,693,071 common shares of the Company at a deemed price of C$2.67 , which was determined based on the 20-day volume-weighted average price prior to and including January 27, 2025. Runway will continue to serve as investment adviser to its managed funds, including Runway Growth Finance Corp. (Nasdaq: RWAY), a business development company, and to other private funds.
On January 15, 2025, the Company issued 652,135 restricted share units in accordance with the RSU Plan.
On February 4, 2025, the Company issued 17,315 common shares of the Company in satisfaction of less than $0.1 million of debt obligations owed in connection with the provision of certain consulting services.
On February 18, 2025, the Company issued 60,082 common shares of the Company (net of shares withheld for tax) to settle vested RSUs (inclusive of DEUs).
On January 30, 2025, Portman Ridge Finance Corporation (Nasdaq: PTMN) and Logan Ridge Finance Corporation (Nasdaq: LRFC) announced that they have entered into an agreement under which LRFC will merge with and into PTMN (the “Proposed Merger”), subject to the receipt of certain shareholder approvals and the satisfaction of other closing conditions. Pursuant to the Proposed Merger agreement, Portman Ridge will be the surviving public entity and will continue to trade on the Nasdaq under the symbol “PTMN.” The Company currently earns management fees under an IMA with LRFC. The IMA is recognized as an indefinite life intangible asset under the Asset Management business. Given the Proposed Merger is still subject to approval, there is no impact to the Consolidated Financial Statements.
On March 13, 2025, the Board declared a cash dividend in the amount of C$0.02 per common share to be paid on April 10, 2025 to shareholders of record on April 3, 2025.
On March 31, 2025, Ability issued a surplus note for $3.0 million to Atlantic Coast Life Insurance Company bearing interest at SOFR+6 % per year, payable at maturity on March 31, 2033.
On March 31, 2025, Ability entered a new reinsurance treaty for additional MYGA with National Security Group (“NSG”), further diversifying its reinsurance partners.
F-83
| MOUNT LOGAN CAPITAL INC. | ||||||||||||||||||||
| Schedule I | ||||||||||||||||||||
| Summary of Investments - Other Than Investments in Related Parties | ||||||||||||||||||||
| December 31, 2024 | ||||||||||||||||||||
| (In thousands) | Cost or amortized cost | Fair value | Amount shown on the balance sheet | |||||||||||||||||
| Debt securities: | ||||||||||||||||||||
| U.S. government and agency | $ | $ | $ | |||||||||||||||||
| U.S. state, territories and municipalities | ||||||||||||||||||||
| Other government and agency | ||||||||||||||||||||
| Corporate | ||||||||||||||||||||
| Asset and mortgage-backed securities | ||||||||||||||||||||
| Total debt securities | ||||||||||||||||||||
| Equity securities | ||||||||||||||||||||
| Common stock | ||||||||||||||||||||
| Preferred stock | ||||||||||||||||||||
| Total equity securities | ||||||||||||||||||||
| Loans | ||||||||||||||||||||
| Mortgage loans | ||||||||||||||||||||
| Other invested assets - corporate loans | ||||||||||||||||||||
| Other invested assets | ||||||||||||||||||||
| Total investments — Insurance Solutions | ||||||||||||||||||||
| Corporate loans of consolidated VIEs | ||||||||||||||||||||
| Equity securities of consolidated VIEs | ||||||||||||||||||||
| Total investments - Insurance Solutions, consolidated VIEs | ||||||||||||||||||||
| Total investments - Insurance Solutions, including consolidated VIEs | $ | $ | $ | |||||||||||||||||
F-84
MOUNT LOGAN CAPITAL INC.
CONDENSED CONSOLIDATED STATEMENTS OF FINANCIAL POSITION (UNAUDITED)
| (in thousands, except per share data) | September 30, 2025 | December 31, 2024 | ||||||||||||
| ASSETS | ||||||||||||||
| Asset Management | ||||||||||||||
| Cash and cash equivalents | $ | $ | ||||||||||||
Investments (including related party amounts of $ | ||||||||||||||
| Intangible assets | ||||||||||||||
Other assets (including related party amounts of $ | ||||||||||||||
| Insurance Solutions | ||||||||||||||
| Cash and cash equivalents | ||||||||||||||
| Restricted cash | ||||||||||||||
Investments (including related party amounts of $ | ||||||||||||||
| Derivatives | ||||||||||||||
| Assets of consolidated variable interest entities | ||||||||||||||
| Cash and cash equivalents | ||||||||||||||
| Investments | ||||||||||||||
| Other assets | ||||||||||||||
| Reinsurance recoverable | ||||||||||||||
| Intangible assets | ||||||||||||||
| Deferred acquisition costs | ||||||||||||||
| Goodwill | ||||||||||||||
| Other assets | ||||||||||||||
Total assets | $ | $ | ||||||||||||
| LIABILITIES | ||||||||||||||
| Asset Management | ||||||||||||||
| Due to related parties | $ | $ | ||||||||||||
| Debt obligations | ||||||||||||||
| Accrued expenses and other liabilities | ||||||||||||||
| Insurance Solutions | ||||||||||||||
| Future policy benefits | ||||||||||||||
| Interest sensitive contract liabilities | ||||||||||||||
| Funds held under reinsurance contracts | ||||||||||||||
| Debt obligations | ||||||||||||||
| Derivatives | ||||||||||||||
| Accrued expenses and other liabilities | ||||||||||||||
| Total liabilities | ||||||||||||||
| Commitments and Contingencies (See Note 24) | ||||||||||||||
| EQUITY | ||||||||||||||
Common shares, $ | ||||||||||||||
| Warrants | ||||||||||||||
| Additional paid-in-capital | ||||||||||||||
| Retained earnings (accumulated deficit) | ( | ( | ||||||||||||
| Accumulated other comprehensive income (loss) | ||||||||||||||
Total equity | ||||||||||||||
Total liabilities and equity | $ | $ | ||||||||||||
See accompanying notes to the unaudited condensed consolidated financial statements.
F-85
MOUNT LOGAN CAPITAL INC.
CONDENSED CONSOLIDATED STATEMENTS OF OPERATIONS (UNAUDITED)
| Three Months Ended September 30, | Nine Months Ended September 30, | |||||||||||||||||||||||||
| (in thousands, except per share data) | 2025 | 2024 | 2025 | 2024 | ||||||||||||||||||||||
| REVENUES | ||||||||||||||||||||||||||
| Asset Management | ||||||||||||||||||||||||||
| Management fees | $ | $ | $ | $ | ||||||||||||||||||||||
| Incentive fees | ||||||||||||||||||||||||||
| Equity investment earning | ||||||||||||||||||||||||||
| Insurance Solutions | ||||||||||||||||||||||||||
| Net premiums | ( | ( | ( | ( | ||||||||||||||||||||||
| Product charges | ||||||||||||||||||||||||||
| Net investment income | ||||||||||||||||||||||||||
| Net gains (losses) from investment activities | ||||||||||||||||||||||||||
| Net revenues of consolidated variable interest entities | ||||||||||||||||||||||||||
| Net investment income (loss) on funds withheld | ( | ( | ( | ( | ||||||||||||||||||||||
| Other income | ||||||||||||||||||||||||||
Total revenues | ||||||||||||||||||||||||||
| EXPENSES | ||||||||||||||||||||||||||
| Asset Management | ||||||||||||||||||||||||||
| Administration and servicing fees | ||||||||||||||||||||||||||
| Transaction costs | ||||||||||||||||||||||||||
| Compensation and benefits | ||||||||||||||||||||||||||
| Amortization and impairment of intangible assets | ||||||||||||||||||||||||||
| Interest and other credit facility expenses | ||||||||||||||||||||||||||
| General, administrative and other | ||||||||||||||||||||||||||
| Insurance Solutions | ||||||||||||||||||||||||||
Net policy benefit and claims (remeasurement gain on policy liabilities of $ | ( | ( | ( | ( | ||||||||||||||||||||||
| Interest sensitive contract benefits | ||||||||||||||||||||||||||
| Amortization of deferred acquisition costs | ||||||||||||||||||||||||||
| Compensation and benefits | ||||||||||||||||||||||||||
| Interest expense | ||||||||||||||||||||||||||
General, administrative and other (including related party amounts of $ | ||||||||||||||||||||||||||
Total expenses | ||||||||||||||||||||||||||
| Investment and other income (loss) - Asset Management | ||||||||||||||||||||||||||
| Net gains (losses) from investment activities | ( | |||||||||||||||||||||||||
| Dividend income | ||||||||||||||||||||||||||
| Interest income | ||||||||||||||||||||||||||
| Other income (loss), net | ||||||||||||||||||||||||||
| Gain on acquisition | ||||||||||||||||||||||||||
Total investment and other income (loss) | ||||||||||||||||||||||||||
Income (loss) before taxes | ( | ( | ( | ( | ||||||||||||||||||||||
Income tax (expense) benefit — Asset Management | ( | ( | ( | ( | ||||||||||||||||||||||
Net income (loss) | $ | ( | $ | ( | $ | ( | $ | ( | ||||||||||||||||||
| Earnings per share | ||||||||||||||||||||||||||
| Net income (loss) attributable to common shareholders - Basic | $ | ( | $ | ( | $ | ( | $ | ( | ||||||||||||||||||
| Net income (loss) attributable to common shareholders - Diluted | $ | ( | ( | ( | ( | |||||||||||||||||||||
| Weighted average shares outstanding – Basic | ||||||||||||||||||||||||||
| Weighted average shares outstanding – Diluted | ||||||||||||||||||||||||||
See accompanying notes to the unaudited condensed consolidated financial statements.
F-86
MOUNT LOGAN CAPITAL INC.
CONDENSED CONSOLIDATED STATEMENTS OF COMPREHENSIVE INCOME (LOSS) (UNAUDITED)
| Three Months Ended September 30, | Nine Months Ended September 30, | |||||||||||||||||||||||||
| (in thousands, except per share data) | 2025 | 2024 | 2025 | 2024 | ||||||||||||||||||||||
Net income (loss) | $ | ( | $ | ( | $ | ( | $ | ( | ||||||||||||||||||
| Other comprehensive income (loss), before tax: | ||||||||||||||||||||||||||
| Unrealized investment gains (losses) on available-for-sale securities | ||||||||||||||||||||||||||
| Unrealized gains (losses) on hedging instruments | ||||||||||||||||||||||||||
| Remeasurement gains (losses) on future policy benefits related to discount rate | ( | ( | ( | ( | ||||||||||||||||||||||
| Other comprehensive income (loss), before tax | ( | ( | ( | |||||||||||||||||||||||
| Income tax expense (benefit) related to other comprehensive income (loss) | ||||||||||||||||||||||||||
| Other comprehensive income (loss) | ( | ( | ( | |||||||||||||||||||||||
Comprehensive income (loss) | $ | ( | $ | ( | $ | ( | $ | |||||||||||||||||||
See accompanying notes to the unaudited condensed consolidated financial statements.
F-87
MOUNT LOGAN CAPITAL INC.
CONDENSED CONSOLIDATED STATEMENTS OF CHANGES IN EQUITY (UNAUDITED)
(in thousands, except for number of shares)
| Three and Nine Months Ended September 30, 2025 | Number of Voting Common Shares | Common Shares | Warrants | Additional Paid in Capital | Retained Earnings (Accumulated Deficit) | Accumulated Other Comprehensive Income (loss) | Total Equity | |||||||||||||||||||||||||||||||||||||
Balance at July 1, 2025 | $ | $ | $ | $ | ( | $ | $ | |||||||||||||||||||||||||||||||||||||
| Share issuance for reverse acquisition | — | — | — | |||||||||||||||||||||||||||||||||||||||||
| Share issuance for investment purchase | — | — | — | — | ||||||||||||||||||||||||||||||||||||||||
| Equity based compensation | — | — | — | — | — | |||||||||||||||||||||||||||||||||||||||
| Restricted share units release | — | — | ( | — | — | ( | ||||||||||||||||||||||||||||||||||||||
| Common shares repurchased | ( | — | — | ( | — | — | ( | |||||||||||||||||||||||||||||||||||||
Shareholder dividends ($ | — | — | — | — | ( | — | ( | |||||||||||||||||||||||||||||||||||||
| Net income (loss) | — | — | — | — | ( | — | ( | |||||||||||||||||||||||||||||||||||||
| Other comprehensive income (loss) | — | — | — | — | — | ( | ( | |||||||||||||||||||||||||||||||||||||
Balance at September 30, 2025 | $ | $ | $ | $ | ( | $ | $ | |||||||||||||||||||||||||||||||||||||
Balance at January 1, 2025 | $ | $ | $ | $ | ( | $ | $ | |||||||||||||||||||||||||||||||||||||
| Share issuance for reverse acquisition | — | — | — | |||||||||||||||||||||||||||||||||||||||||
| Share issuance for investment purchase | — | — | — | |||||||||||||||||||||||||||||||||||||||||
| Equity based compensation | — | — | — | — | ||||||||||||||||||||||||||||||||||||||||
| Restricted share units release | — | — | ( | — | — | ( | ||||||||||||||||||||||||||||||||||||||
| Common shares repurchased | ( | — | — | ( | — | — | ( | |||||||||||||||||||||||||||||||||||||
Shareholder dividends ($ | — | — | — | — | ( | — | ( | |||||||||||||||||||||||||||||||||||||
| Net income (loss) | — | — | — | — | ( | — | ( | |||||||||||||||||||||||||||||||||||||
| Other comprehensive income (loss) | — | — | — | — | — | ( | ( | |||||||||||||||||||||||||||||||||||||
Balance at September 30, 2025 | $ | $ | $ | $ | ( | $ | $ | |||||||||||||||||||||||||||||||||||||
| Three and Nine Months Ended September 30, 2024 | Number of Voting Common Shares | Common Shares | Warrants | Additional Paid in Capital | Retained Earnings (Accumulated Deficit) | Accumulated Other Comprehensive Income (Loss) | Total Equity | |||||||||||||||||||||||||||||||||||||
Balance at July 1, 2024 | $ | $ | $ | $ | ( | $ | $ | |||||||||||||||||||||||||||||||||||||
| Issuance of warrants | — | — | — | — | — | — | ||||||||||||||||||||||||||||||||||||||
| Equity based compensation | — | — | — | — | — | |||||||||||||||||||||||||||||||||||||||
| Restricted Share Units release | — | — | — | — | — | — | — | |||||||||||||||||||||||||||||||||||||
Shareholder dividends ($ | — | — | — | — | ( | — | ( | |||||||||||||||||||||||||||||||||||||
| Net income (loss) | — | — | — | — | ( | — | ( | |||||||||||||||||||||||||||||||||||||
| Other comprehensive income (loss) | — | — | — | — | — | ( | ( | |||||||||||||||||||||||||||||||||||||
Balance at September 30, 2024 | $ | $ | $ | $ | ( | $ | $ | |||||||||||||||||||||||||||||||||||||
Balance at January 1, 2024 | $ | $ | $ | $ | ( | $ | $ | |||||||||||||||||||||||||||||||||||||
| Issuance of warrants | — | — | — | — | — | |||||||||||||||||||||||||||||||||||||||
| Equity based compensation | — | — | — | — | — | |||||||||||||||||||||||||||||||||||||||
| Restricted Share Units release | — | — | ( | — | — | ( | ||||||||||||||||||||||||||||||||||||||
Shareholder dividends ($ | — | — | — | — | ( | — | ( | |||||||||||||||||||||||||||||||||||||
| Net income (loss) | — | — | — | — | ( | — | ( | |||||||||||||||||||||||||||||||||||||
| Other comprehensive income (loss) | — | — | — | — | — | |||||||||||||||||||||||||||||||||||||||
Balance at September 30, 2024 | $ | $ | $ | $ | ( | $ | $ | |||||||||||||||||||||||||||||||||||||
See accompanying notes to the unaudited condensed consolidated financial statements.
F-88
MOUNT LOGAN CAPITAL INC.
CONDENSED CONSOLIDATED STATEMENTS OF CASH FLOWS (UNAUDITED)
| Nine Months Ended September 30, | |||||||||||
| (in thousands) | 2025 | 2024 | |||||||||
| Cash Flows from Operating Activities | |||||||||||
| Net income (loss) | $ | ( | $ | ( | |||||||
| Adjustments to reconcile net income (loss) to net cash used in operating activities: | |||||||||||
| Net realized (gains) losses on investments | ( | ||||||||||
| Net realized (gains) losses on foreign currency | ( | ||||||||||
| Net change in unrealized (gains) losses on investments | ( | ( | |||||||||
| Net change in unrealized (gains) losses on foreign currency | |||||||||||
| Change in fair value of debt obligation | ( | ( | |||||||||
| Payment in-kind interest | ( | ||||||||||
| Equity investment earnings | ( | ( | |||||||||
| Amortization of debt issuance costs | |||||||||||
| Amortization of deferred acquisition costs | |||||||||||
| Amortization of intangible assets | |||||||||||
| Impairment of intangible assets | |||||||||||
| Net amortization of premiums and accretion of discounts on investments | ( | ||||||||||
| Equity based compensation | |||||||||||
| Increase (decrease) in estimated credit losses | ( | ||||||||||
| Gain on reverse acquisition of business | ( | ||||||||||
| (Increase) decrease in operating assets: | |||||||||||
| Due from related parties | |||||||||||
| Reinsurance recoverable | ( | ||||||||||
| Change in deferred acquisition costs | ( | ( | |||||||||
| Distributions from equity method investments | |||||||||||
| Other assets | ( | ( | |||||||||
| Other assets of consolidated VIEs | ( | ||||||||||
| Purchases of investments by consolidated VIEs | ( | ( | |||||||||
| Proceeds from sale of investments by consolidated VIEs | |||||||||||
| Increase (decrease) in operating liabilities: | |||||||||||
| Due to related parties | ( | ||||||||||
| Future policy benefits | ( | ( | |||||||||
| Interest sensitive contract liabilities | |||||||||||
| Funds held under reinsurance contracts | |||||||||||
| Accrued expenses and other liabilities | ( | ( | |||||||||
Net cash used in operating activities | $ | ( | $ | ( | |||||||
| Investing Activities | |||||||||||
| Purchases of investments | $ | ( | $ | ( | |||||||
| Proceeds received from reverse acquisition of business | |||||||||||
| Proceeds from sales and repayments of investments | |||||||||||
Net cash provided by (used in) investing activities | $ | $ | ( | ||||||||
| Financing Activities | |||||||||||
| Shareholder dividends | $ | ( | $ | ( | |||||||
| Repurchase of common shares | ( | ||||||||||
| Proceeds from borrowings of asset management business | |||||||||||
| Repayments of borrowings of asset management business | ( | ( | |||||||||
| Proceeds from borrowings of insurance business | |||||||||||
| Deposits on investment-type policies and contracts | |||||||||||
| Withdrawals on investment-type policies and contracts | ( | ( | |||||||||
Net cash provided by (used in) financing activities | $ | $ | |||||||||
F-89
| Nine Months Ended September 30, | |||||||||||
| (in thousands) | 2025 | 2024 | |||||||||
Net increase (decrease) in cash, cash equivalents and restricted cash, and cash and cash equivalents of consolidated VIEs | |||||||||||
Cash, cash equivalents and restricted cash, and cash and cash equivalents of consolidated VIEs, beginning of the period | |||||||||||
Cash, cash equivalents and restricted cash, and cash and cash equivalents of consolidated VIEs, end of period | $ | $ | |||||||||
| Cash, cash equivalents, restricted cash and cash and cash equivalents of consolidated VIEs | |||||||||||
| Asset Management | |||||||||||
| Cash and cash equivalents | |||||||||||
Total Asset Management | |||||||||||
| Insurance Solutions | |||||||||||
| Cash and cash equivalents | |||||||||||
| Restricted cash | |||||||||||
| Cash and cash equivalents of consolidated VIEs | |||||||||||
Total Insurance Solutions | |||||||||||
Total cash, cash equivalents and restricted cash, and cash and cash equivalents of consolidated VIEs | $ | $ | |||||||||
| Supplemental disclosures of cash flow information | |||||||||||
| Interest received | |||||||||||
| Interest paid | |||||||||||
| Dividends received | |||||||||||
| Income taxes paid | |||||||||||
| Supplemental Disclosures of Non-Cash Investing and Financing Activities | |||||||||||
| Cashless repayment on borrowings | |||||||||||
| Issuance of common shares for vested Restricted Share Units | |||||||||||
| Issuance of common shares for investment purchases | |||||||||||
| Issuance of common shares for share based compensation | |||||||||||
See accompanying notes to the unaudited condensed consolidated financial statements.
F-90
MOUNT LOGAN CAPITAL INC.
NOTES TO CONDENSED CONSOLIDATED FINANCIAL STATEMENTS (UNAUDITED)
(All amounts in thousands, except share and per share data, and except where noted)
Note 1. Organization
Unless the context otherwise requires all references to the “Company,” “Mount Logan,” or “we” refer to (i) Mount Logan Capital Inc. (formerly, Yukon New Parent, Inc.), a Delaware corporation on or after September 12, 2025, and (ii) Mount Logan Capital Inc., an insurance company and asset manager organized under the laws of the Province of Ontario (“Legacy Mount Logan”) prior to September 12, 2025.
Mount Logan, together with its consolidated subsidiaries is a diversified alternative asset management and insurance solutions platform. Our mission is to provide our investors access to a diversified and differentiated set of private market investment solutions to address their capital needs. Mount Logan conducts its business primarily in the United States through its two business segments: Asset Management and Insurance Solutions. Our Asset Management segment is conducted by Mount Logan Management LLC (“ML Management”), our SEC-registered investment adviser, manages a significant portion of our Assets Under Management (“AUM”) across our various managed funds supported by permanent and semi-permanent capital bases. Management also directly manages the capital of our wholly-owned insurance company, Ability Insurance Company (“Ability”), for the benefit of policyholders. The Company’s Insurance Solutions segment is conducted by Ability, a Nebraska domiciled insurer, specializes in reinsuring annuity products for the increasing number of individuals seeking to fund retirement needs and represents all of our insurance solutions operations.
On September 12, 2025 (the “Closing Date”), the Company completed a business combination pursuant to an Agreement and Plan of Merger, dated as of January 16, 2025 and amended as of July 6, 2025 and August 17, 2025 (the “Merger Agreement”) among the Company (formerly, Yukon New Parent, Inc.), Legacy Mount Logan, and 180 Degree Capital Corp. (“TURN”), a New York corporation that was registered as a closed-end investment company under the Investment Company Act of 1940, as amended (the “Investment Company Act”), Polar Merger Sub, Inc., a corporation organized under the laws of the State of New York and wholly owned subsidiary of the Company (“TURN Merger Sub”), and Moose Merger Sub, LLC, a limited liability company formed under the laws of the State of Delaware and a wholly owned subsidiary of the Company (“MLC Merger Sub”) wherein (i) TURN Merger Sub. merged with and into TURN, with TURN surviving as a wholly owned subsidiary of the Company, and (ii) MLC Merger Sub merged with and into Legacy Mount Logan, with Legacy Mount Logan surviving as a wholly owned subsidiary of the Company (collectively, the “Business Combination”). Following the completion of the Business Combination, the Company changed its name to “Mount Logan Capital Inc.” and became a Nasdaq-traded public company. The Business Combination was accounted for as a reverse acquisition, with Legacy Mount Logan identified as the accounting acquirer, but the legal acquiree. Accordingly, our condensed consolidated financial statements present the historical results of Legacy Mount Logan prior to September 12, 2025, and those of the combined company subsequent to that date. Refer to Note 3. Business combinations for more information about the reverse acquisition and the financial reporting impacts.
Note 2. Summary of significant accounting policies
Basis of presentation
The accompanying unaudited Condensed Consolidated Financial Statements (“Condensed Consolidated Financial Statements”) have been prepared in accordance with accounting principles generally accepted in the United States of America (“U.S. GAAP”). Certain disclosures included in the annual audited Consolidated Financial Statements have been condensed or omitted as they are not required for interim Condensed Consolidated Financial Statements. The operating results presented for interim periods are not necessarily indicative of the results that may be expected for any other interim period or for the entire year. These Condensed Consolidated Financial Statements should be read in conjunction with the annual audited Consolidated Financial Statements included in the proxy statement/prospectus filed pursuant to Rule 424(b)(3) of the Securities Act of 1933, as amended (File No. 333-286043) on July 11, 2025.
F-91
The Condensed Consolidated Financial Statements reflect all adjustments, both normal and recurring which, in the opinion of management, are necessary for the fair presentation of the Company’s condensed consolidated statements of operations and condensed consolidated statements of financial position for the periods presented.
The results of the Company and its subsidiaries are presented on a consolidated basis. All intercompany transactions and balances are eliminated on consolidation.
The Company's Asset Management and Insurance Solutions segments possess distinct characteristics, and as a result are presented separately from each other. The Company believes that separate presentation provides a more informative view of the Company’s consolidated financial position and results of operations than an aggregated presentation and that reporting insurance solutions separately is appropriate given, among other factors, the relative significance of Ability's policy liabilities, which do not provide recourse to the remaining assets of Mount Logan.
The summary of the significant accounting policies includes a section for common accounting policies and an accounting policy section for each of the two operating segments when a policy is specific to one operating segment and not the other. Unless otherwise specified, the significant accounting policy applies to both segments.
The number of shares issued and outstanding, earnings per share, additional paid-in capital, dividends paid per share and all references to share quantities of the Company have been retrospectively adjusted to reflect the Company’s existing capital structure post merger with TURN. Refer to Note 3. Business combinations for further detail.
Due to rounding, numbers presented throughout these Condensed Consolidated Financial Statements may not add up precisely to the totals provided and percentages may not precisely reflect the absolute figures.
Recently adopted accounting pronouncements
In March 2024, the Financial Accounting Standards Board (“FASB”) issued Accounting Standards Update (“ASU”) 2024-01, Compensation-Stock Compensation (Topic 718): Scope Application of Profits Interest and Similar Awards, which clarifies how an entity determines whether a profits interest or similar award (hereafter a “profits interest award”) is (1) within the scope of FASB ASC 718, Share-Based Payments, or (2) not a share-based payment arrangement and therefore within the scope of other guidance. This ASU is effective for annual periods beginning after December 15, 2024, and interim periods within those annual periods. The Company adopted this accounting standard effective January 1, 2025 and its adoption on a prospective basis did not have an impact on the Condensed Consolidated Financial Statements.
Recently issued accounting pronouncements
In December 2023, the FASB issued ASU 2023-09, Income Taxes (Topic 740): Improvements to Income Tax Disclosures. This ASU requires additional quantitative and qualitative income tax disclosures to allow readers of the financial statements to assess how the Company’s operations, related tax risks and tax planning affect its tax rate and prospects for future cash flows. For public business entities, ASU 2023-09 is effective for annual periods beginning after December 15, 2024. The Company is currently evaluating the impact that the adoption of this ASU will have on its Condensed Consolidated Financial Statements.
In March 2024, the FASB issued ASU 2024-02, Codification Improvements – Amendments to Remove References to the Concepts Statements. This ASU contains amendments to the Codification that remove references to various FASB Concepts Statements. The effort facilitates Codification updates for technical corrections such as conforming amendments, clarifications to guidance, simplifications to wording or the structure of guidance and other minor improvements. While the amendments are not expected to result in significant changes for most entities, the FASB provided transition guidance since some entities could be affected. This ASU will be effective for fiscal years beginning after December 15, 2024, with early adoption permitted. The Company has determined that the ASU will not have a material impact on its Condensed Consolidated Financial Statements.
F-92
In November 2024, the FASB issued ASU 2024-03, Income Statement – Reporting Comprehensive Income – Expense Disaggregation Disclosures. This ASU requires disaggregation of certain expense captions into specified categories in disclosures within the footnotes to the financial statements. The ASU requires presentation in a tabular format of each pertinent expense category on the face of the income statement, such as employee compensation, depreciation, amortization of intangible assets, and other applicable expenses. This ASU will be effective for fiscal years beginning after December 15, 2026, and interim reporting periods beginning after December 15, 2027. Early adoption of the ASU is permitted, including adoption in any interim period for which financial statements have not been issued. The Company is currently evaluating the impact of adopting this ASU on its Condensed Consolidated Financial Statements.
In May 2025, the FASB issued ASU 2025–03, Business Combinations (Topic 805) and Consolidation (Topic 810): Determining the Accounting Acquirer in the Acquisition of a Variable Interest Entity (“ASU 2025–03”). This ASU requires an entity involved in an acquisition transaction effected primarily by exchanging equity interests when the legal acquiree is a variable interest entity (“VIE”) that meets the definition of a business to consider factors to determine which entity is the accounting acquirer. When considering those factors, the reporting entity may determine that a transaction in which the legal acquiree is a VIE represents a reverse acquisition. The update will be effective for annual periods (and interim periods in annual reporting periods) beginning after December 15, 2026. The Company is currently evaluating the impact of adopting this ASU on its Condensed Consolidated Financial Statements.
Note 3. Business combinations
Acquisition of 180 Degree Capital
On the Closing Date, the Company consummated the Business Combination pursuant to the Merger Agreement, by and among the Company, Legacy Mount Logan, TURN, TURN Merger Sub, and MLC Merger Sub. In accordance with the Merger Agreement, the Company was formed as a holding company to effectuate the mergers. TURN Merger Sub merged with and into TURN (the “TURN Merger”), with TURN continuing as the surviving company and a wholly-owned subsidiary of the Company, and MLC Merger Sub merged with and into Legacy Mount Logan, (the “MLC Merger” and, together with the TURN Merger, the “Mergers”), with Legacy Mount Logan continuing as the surviving company and a wholly-owned subsidiary of the Company. As a result of the Business Combination, the Company changed its name from “Yukon New Parent Inc.” to “Mount Logan Capital Inc.” and its common stock commenced trading on Nasdaq Capital Market under the symbol “MLCI” on September 15, 2025.
Prior to the closing of the Business Combination, to facilitate the Mergers, Legacy Mount Logan, completed a domestication process where it redomiciled from Canada to the United States. The domestication did not result in any interruption of business or change in ownership for Legacy Mount Logan’s shareholders.
Following the closing of the Business Combination, former Legacy Mount Logan shareholders and former TURN shareholders and owned approximately 56 % and 44 %, respectively, of the combined company. All outstanding Legacy Mount Logan and TURN shares were converted into the right to receive shares of the Company common stock at fixed exchange ratios, resulting in approximately 13 million shares of the Company’s common stock outstanding, of which approximately 7.3 million shares and 5.7 million shares were issued to former Legacy Mount Logan shareholders and former TURN shareholders, respectively. TURN’s common shares were delisted from Nasdaq Global Market and TURN deregistered under the Investment Company Act. Legacy Mount Logan’s common shares were delisted from Cboe Canada.
The Company amended its certificate of incorporation and bylaws to align with governance and regulatory standards applicable to a United States publicly traded corporation, reflecting its transition from a Canadian public entity. In addition, the Company adopted the Mount Logan Capital Inc. 2025 Omnibus Incentive Plan (as described in Note 20. Equity based compensation). Furthermore, all Legacy Mount Logan warrants outstanding as of the Closing Date were assumed by the Company and became exercisable for Company common stock.
The transaction was accounted for as a reverse acquisition with Legacy Mount Logan, a legal acquiree, as the accounting acquirer. This determination was based on the relative voting rights, board composition, and
F-93
management of the combined company, as well as other relevant factors. Retained earnings, historical operations and accumulated other comprehensive income (loss) reflect those of Legacy Mount Logan for the period prior to the closing of the Business Combination. The Company’s historical common shares outstanding, shareholders’ equity and earnings per share, have been retrospectively adjusted based on the Company’s existing capital structure.
The purchase price of $46.8 million was calculated using Legacy Mount Logan’s share price and the number of shares Legacy Mount Logan would have had to issue in order to give TURN’s former shareholders the percentage ownership of Legacy Mount Logan that they had of the Company as of the Closing Date. The acquired net assets consisted of cash of $36.8 million, investments of $15 million, and liabilities of $0.6 million, all initially recorded at fair value. The investments were predominantly composed of equity securities which are recorded at fair value on a recurring basis with changes in fair value recognized in the consolidated statement of operations. As the fair value of TURN’s identifiable net assets exceeded the purchase price, the Company recognized a gain of $4.5 million in “Gain on acquisition” on the condensed consolidated statements of operations. The Company incurred $10.3 million in transaction-related costs, including legal, advisory, and other professional fees. All transaction costs were recognized as expenses within “Transaction costs” on the consolidated statement of operations. The assets and operations of TURN are included in the Company’s Asset Management segment.
The Company issued $5.7 million shares of its common stock to TURN shareholders in connection with the Business Combination, which represented 44.0 % of the voting interests in the Company upon completion of the Business Combination. In accordance with FASB ASC 805-40-30-2, the purchase price in a reverse acquisition is determined based on the number of equity interests the legal acquiree would have had to issue to give the owners of the legal acquirer the same percentage equity interest in the combined entity that results from the reverse acquisition.
The table below summarizes the hypothetical number of shares as of September 12, 2025 that Legacy Mount Logan would have to issue to give TURN owners the same percentage ownerships in the combined company.
| Hypothetical Legacy Mount Logan Ownership | |||||||||||
| Number of Legacy Mount Logan shares outstanding | Percentage Ownership | ||||||||||
| Legacy Mount Logan shareholders | % | ||||||||||
| TURN shareholders | % | ||||||||||
Total | % | ||||||||||
The purchase price is calculated based on the number of hypothetical shares of Legacy Mount Logan common stock issued to TURN shareholders multiplied by the share price as demonstrated in the table below (dollars in thousands except for the market price per share).
| Number of hypothetical Legacy Mount Logan shares issued to TURN shareholders | |||||
| Legacy Mount Logan market price per share as of September 12, 2025 | $ | ||||
| Purchase price determination of hypothetical Legacy Mount Logan shares issued to TURN shareholders | $ | ||||
| Other deal adjustments for expenses incurred | |||||
Purchase price consideration | $ | ||||
F-94
Note 4. Net gains (losses) from investment activities
The table below summarizes the net gains (losses) from investment activities:
| For the three months ended September 30, | 2025 | 2024 | ||||||||||||||||||||||||||||||||||||||||||||||||
| Net realized gains (losses) | Net unrealized gains (losses) | Credit releases (losses) | Total | Net realized gains (losses) | Net unrealized gains (losses) | Credit releases (losses) | Total | |||||||||||||||||||||||||||||||||||||||||||
| Asset Management | ||||||||||||||||||||||||||||||||||||||||||||||||||
| Equity securities | $ | $ | $ | $ | $ | $ | ( | $ | $ | ( | ||||||||||||||||||||||||||||||||||||||||
| Derivatives | ||||||||||||||||||||||||||||||||||||||||||||||||||
| Debt obligation | ||||||||||||||||||||||||||||||||||||||||||||||||||
Net gains (losses) from investment activities — Asset Management | $ | $ | $ | $ | $ | $ | ( | $ | $ | |||||||||||||||||||||||||||||||||||||||||
| Insurance Solutions | ||||||||||||||||||||||||||||||||||||||||||||||||||
| Debt securities: | ||||||||||||||||||||||||||||||||||||||||||||||||||
| U.S. state, territories and municipalities | $ | $ | $ | $ | $ | $ | $ | $ | ||||||||||||||||||||||||||||||||||||||||||
| Other government and agency | ||||||||||||||||||||||||||||||||||||||||||||||||||
| Corporate | ( | |||||||||||||||||||||||||||||||||||||||||||||||||
| Asset and mortgage- backed securities | ( | ( | ( | ( | ||||||||||||||||||||||||||||||||||||||||||||||
| Corporate loans | ( | ( | ( | ( | ||||||||||||||||||||||||||||||||||||||||||||||
| Mortgage loans | ( | ( | ||||||||||||||||||||||||||||||||||||||||||||||||
| Equity securities | ( | ( | ||||||||||||||||||||||||||||||||||||||||||||||||
| Other invested assets | ||||||||||||||||||||||||||||||||||||||||||||||||||
Net gains (losses) from investment activities — Insurance Solutions | $ | ( | $ | $ | $ | $ | ( | $ | $ | ( | $ | |||||||||||||||||||||||||||||||||||||||
| Investments of consolidated VIEs | ( | ( | ( | ( | ||||||||||||||||||||||||||||||||||||||||||||||
Net gains (losses) from investment activities — Insurance Solutions including consolidated VIEs | $ | ( | $ | $ | $ | $ | $ | $ | ( | $ | ||||||||||||||||||||||||||||||||||||||||
| For the nine months ended September 30, | 2025 | 2024 | ||||||||||||||||||||||||||||||||||||||||||||||||
| Net realized gains (losses) | Net unrealized gains (losses) | Credit releases (losses) | Total | Net realized gains (losses) | Net unrealized gains (losses) | Credit releases (losses) | Total | |||||||||||||||||||||||||||||||||||||||||||
| Asset Management | ||||||||||||||||||||||||||||||||||||||||||||||||||
| Equity securities | $ | $ | $ | $ | $ | $ | ( | $ | $ | ( | ||||||||||||||||||||||||||||||||||||||||
| Derivatives | ||||||||||||||||||||||||||||||||||||||||||||||||||
| Debt obligation | ||||||||||||||||||||||||||||||||||||||||||||||||||
Net gains (losses) from investment activities — Asset Management | $ | $ | $ | $ | $ | $ | ( | $ | $ | ( | ||||||||||||||||||||||||||||||||||||||||
| Insurance Solutions | ||||||||||||||||||||||||||||||||||||||||||||||||||
| Debt securities: | ||||||||||||||||||||||||||||||||||||||||||||||||||
| U.S. state, territories and municipalities | $ | ( | $ | $ | $ | $ | ( | $ | $ | $ | ||||||||||||||||||||||||||||||||||||||||
| Other government and agency | ||||||||||||||||||||||||||||||||||||||||||||||||||
| Corporate | ( | |||||||||||||||||||||||||||||||||||||||||||||||||
| Asset and mortgage- backed securities | ( | ( | ( | |||||||||||||||||||||||||||||||||||||||||||||||
| Corporate loans | ( | ( | ||||||||||||||||||||||||||||||||||||||||||||||||
| Mortgage loans | ( | ( | ||||||||||||||||||||||||||||||||||||||||||||||||
| Equity securities | ( | ( | ( | |||||||||||||||||||||||||||||||||||||||||||||||
| Other invested assets | ( | ( | ||||||||||||||||||||||||||||||||||||||||||||||||
Net gains (losses) from investment activities — Insurance Solutions | $ | ( | $ | $ | $ | $ | $ | $ | ( | $ | ||||||||||||||||||||||||||||||||||||||||
| Investments of consolidated VIEs | ( | ( | ( | ( | ||||||||||||||||||||||||||||||||||||||||||||||
Net gains (losses) from investment activities — Insurance Solutions including consolidated VIEs | $ | ( | $ | $ | $ | $ | $ | $ | ( | $ | ||||||||||||||||||||||||||||||||||||||||
F-95
Note 5. Net investment income
Net investment income for the Insurance Solutions segment is comprised primarily of Interest income and Dividend income from common and preferred stock. The table below summarizes Net investment income:
| Three Months Ended September 30, | Nine Months Ended September 30, | |||||||||||||||||||||||||
| 2025 | 2024 | 2025 | 2024 | |||||||||||||||||||||||
| Debt securities | $ | $ | $ | $ | ||||||||||||||||||||||
| Corporate loans | ||||||||||||||||||||||||||
| Derivatives | ( | |||||||||||||||||||||||||
| Mortgage loans | ||||||||||||||||||||||||||
| Equity securities | ||||||||||||||||||||||||||
| Other | ||||||||||||||||||||||||||
| Gross investment income: | $ | $ | $ | $ | ||||||||||||||||||||||
| Less: | ||||||||||||||||||||||||||
| Investment expenses | ( | ( | ( | ( | ||||||||||||||||||||||
Net investment income | $ | $ | $ | $ | ||||||||||||||||||||||
| Investment income of consolidated VIEs | $ | $ | $ | $ | ||||||||||||||||||||||
Net investment income — Insurance Solutions, including consolidated VIEs | $ | $ | $ | $ | ||||||||||||||||||||||
Note 6. Investments
The following table outlines the carrying value of the Company’s investments:
| As of | September 30, 2025 | December 31, 2024 | ||||||||||||
| Asset Management | ||||||||||||||
| Corporate loans | $ | $ | ||||||||||||
| Equity securities | ||||||||||||||
| Equity method | ||||||||||||||
| Derivatives | ||||||||||||||
| Other invested assets | ||||||||||||||
Total investments - Asset Management | $ | $ | ||||||||||||
| Insurance Solutions | ||||||||||||||
| Debt securities | $ | $ | ||||||||||||
| Corporate loans | ||||||||||||||
| Mortgage loans | ||||||||||||||
| Equity securities | ||||||||||||||
| Other invested assets | ||||||||||||||
Total investments - Insurance Solutions | ||||||||||||||
| Corporate loans of consolidated VIEs | ||||||||||||||
| Equity securities of consolidated VIEs | ||||||||||||||
Total investments - Insurance Solutions, including consolidated VIEs | ||||||||||||||
Total investments | $ | $ | ||||||||||||
F-96
Financial assets
The following tables summarize the measurement categories of financial assets held by the Company as of September 30, 2025, and December 31, 2024:
| As of September 30, 2025 | Fair value | Amortized cost | Fair value option | Total | ||||||||||||||||||||||
| Financial assets | ||||||||||||||||||||||||||
| Asset Management | ||||||||||||||||||||||||||
| Corporate loans | $ | — | $ | $ | — | $ | ||||||||||||||||||||
| Equity securities | — | — | ||||||||||||||||||||||||
| Derivatives | — | |||||||||||||||||||||||||
| Other invested assets | ||||||||||||||||||||||||||
Total financial assets — Asset Management¹ | $ | $ | $ | $ | ||||||||||||||||||||||
| Insurance Solutions | ||||||||||||||||||||||||||
| Debt securities: | ||||||||||||||||||||||||||
| U.S. government and agency | — | — | ||||||||||||||||||||||||
| U.S. state, territories and municipalities | — | |||||||||||||||||||||||||
| Other government and agency | — | — | ||||||||||||||||||||||||
| Corporate | — | |||||||||||||||||||||||||
| Asset and mortgage-backed securities | — | |||||||||||||||||||||||||
| Corporate loans | — | |||||||||||||||||||||||||
| Mortgage loans | — | — | ||||||||||||||||||||||||
| Equity securities | — | — | ||||||||||||||||||||||||
Other invested assets² | ||||||||||||||||||||||||||
| Total financial assets — Insurance Solutions | $ | $ | $ | $ | ||||||||||||||||||||||
| Corporate loans of consolidated VIEs | — | — | ||||||||||||||||||||||||
| Equity securities of consolidated VIEs | — | — | ||||||||||||||||||||||||
| Total financial assets — Insurance Solutions, including consolidated VIEs | ||||||||||||||||||||||||||
| Total financial assets | $ | $ | $ | $ | ||||||||||||||||||||||
_______________
(1)The MLC US Holdings Credit Facility (as hereinafter defined) is collateralized by assets held by MLC US Holdings, including assets totaling $30.1 million as of September 30, 2025.
(2)Other invested assets primarily include structured securities and loan receivables.
F-97
| As of December 31, 2024 | Fair value | Amortized cost | Fair value option | Total | ||||||||||||||||||||||
| Financial assets | ||||||||||||||||||||||||||
| Asset Management | ||||||||||||||||||||||||||
| Corporate loans | $ | — | $ | $ | — | $ | ||||||||||||||||||||
| Equity securities | — | — | ||||||||||||||||||||||||
| Total financial assets — Asset Management¹ | $ | $ | $ | — | $ | |||||||||||||||||||||
| Insurance Solutions | ||||||||||||||||||||||||||
| Debt securities: | ||||||||||||||||||||||||||
| U.S. government and agency | $ | $ | — | $ | — | $ | ||||||||||||||||||||
| U.S. state, territories and municipalities | $ | $ | — | $ | $ | |||||||||||||||||||||
| Other government and agency | — | — | ||||||||||||||||||||||||
| Corporate | — | |||||||||||||||||||||||||
| Asset and mortgage-backed securities | — | |||||||||||||||||||||||||
| Corporate loans | — | — | ||||||||||||||||||||||||
| Mortgage loans | — | — | ||||||||||||||||||||||||
| Equity securities | — | — | ||||||||||||||||||||||||
| Other invested assets² | ||||||||||||||||||||||||||
| Total financial assets — Insurance Solutions | $ | $ | $ | $ | ||||||||||||||||||||||
| Corporate loans of consolidated VIEs | — | — | ||||||||||||||||||||||||
| Equity securities of consolidated VIEs | — | — | ||||||||||||||||||||||||
| Total financial assets — Insurance Solutions, including consolidated VIEs | ||||||||||||||||||||||||||
| Total financial assets | $ | $ | $ | $ | ||||||||||||||||||||||
_______________
(1)The MLC US Holdings Credit Facility (as hereinafter defined) is collateralized by assets held by MLC US Holdings, including assets totaling $31.2 million as of December 31, 2024.
(2)Other invested assets primarily include structured securities and loan receivables.
Available-for-sale – Insurance Solutions
The following table represents the cost or amortized cost, gross unrealized gains, gross unrealized losses, and fair value of available-for-sale (“AFS”) investments by asset type:
| As of September 30, 2025 | Cost or amortized cost | Gross unrealized gains | Gross unrealized losses | Fair value(1) | ||||||||||||||||||||||
| Insurance Solutions | ||||||||||||||||||||||||||
| Debt securities: | ||||||||||||||||||||||||||
| U.S. government and agency | $ | $ | $ | ( | $ | |||||||||||||||||||||
| U.S. state, territories and municipalities | ( | |||||||||||||||||||||||||
| Corporate | ( | |||||||||||||||||||||||||
| Asset and mortgage-backed securities | ( | |||||||||||||||||||||||||
| Other invested assets | ( | |||||||||||||||||||||||||
| Total AFS — Insurance Solutions | $ | $ | $ | ( | $ | |||||||||||||||||||||
F-98
| As of December 31, 2024 | Cost or amortized cost | Gross unrealized gains | Gross unrealized losses | Fair value¹ | ||||||||||||||||||||||
| Insurance Solutions | ||||||||||||||||||||||||||
| Debt securities: | ||||||||||||||||||||||||||
| U.S. government and agency | $ | $ | $ | ( | $ | |||||||||||||||||||||
| U.S. state, territories and municipalities | ( | |||||||||||||||||||||||||
| Corporate | ( | |||||||||||||||||||||||||
| Asset and mortgage-backed securities | ( | |||||||||||||||||||||||||
| Other invested assets | ( | |||||||||||||||||||||||||
| Total AFS — Insurance Solutions | $ | $ | $ | ( | $ | |||||||||||||||||||||
_______________
(1)There is no
The maturity distribution for AFS securities is as follows:
| September 30, 2025 | ||||||||||||||
| Cost or amortized cost | Fair value | |||||||||||||
| Due in one year or less | $ | $ | ||||||||||||
| Due after one year through five years | ||||||||||||||
| Due after five years through ten years | ||||||||||||||
| Due after ten years | ||||||||||||||
| Total AFS securities | $ | $ | ||||||||||||
Actual maturities can differ from contractual maturities as borrowers may have the right to call or prepay obligations with or without call or prepayment penalties.
The following table provides information about AFS securities for which an allowance for credit losses has not been recorded aggregated by category and length of time that securities have been continuously in an unrealized loss position:
| Less than 12 months | 12 months or more | Total | |||||||||||||||||||||||||||
| As of September 30, 2025 | Fair value | Unrealized losses | Fair value | Unrealized losses | Fair value | Unrealized losses | |||||||||||||||||||||||
| Insurance Solutions | |||||||||||||||||||||||||||||
| Debt securities: | |||||||||||||||||||||||||||||
| U.S. government and agency | $ | $ | ( | $ | $ | ( | $ | $ | ( | ||||||||||||||||||||
| U.S. state, territories and municipalities | ( | ( | |||||||||||||||||||||||||||
| Corporate | ( | ( | ( | ||||||||||||||||||||||||||
| Asset and mortgage-backed securities | ( | ( | ( | ||||||||||||||||||||||||||
| Other invested assets | ( | ( | |||||||||||||||||||||||||||
| Total AFS securities in a continuous loss position | $ | $ | ( | $ | $ | ( | $ | $ | ( | ||||||||||||||||||||
F-99
| Less than 12 months | 12 months or more | Total | |||||||||||||||||||||||||||
| As of December 31, 2024 | Fair value | Unrealized losses | Fair value | Unrealized losses | Fair value | Unrealized losses | |||||||||||||||||||||||
| Insurance Solutions | |||||||||||||||||||||||||||||
| Debt securities: | |||||||||||||||||||||||||||||
| U.S. government and agency | $ | $ | ( | $ | $ | ( | $ | $ | ( | ||||||||||||||||||||
| U.S. state, territories and municipalities | ( | ( | |||||||||||||||||||||||||||
| Corporate | ( | ( | ( | ||||||||||||||||||||||||||
| Asset and mortgage-backed securities | ( | ( | ( | ||||||||||||||||||||||||||
| Other invested assets | ( | ( | |||||||||||||||||||||||||||
| Total AFS securities in a continuous loss position | $ | $ | ( | $ | $ | ( | $ | $ | ( | ||||||||||||||||||||
Unrealized gains and losses can arise from changes in interest rates or other factors, including changes in credit spreads. The Company had gross unrealized losses on below investment grade AFS securities of $4.3 million and $4.5 million as of September 30, 2025 and December 31, 2024, respectively. The single largest unrealized loss on AFS securities was $1.3 million and $1.2 million as of September 30, 2025 and December 31, 2024, respectively. The Company had 296 and 359 positions in an unrealized loss position as of September 30, 2025 and December 31, 2024, respectively.
As of September 30, 2025 and December 31, 2024, AFS securities in an unrealized loss position for 12 months or more consisted of 197 and 216 debt securities, respectively. These debt securities primarily relate to Corporate and U.S. state, municipal and political subdivisions securities, which have depressed values due primarily to an increase in interest rates since the purchase of these securities. Unrealized losses were not recognized in net income on these debt securities since the Company neither intends to sell the securities nor does it believe that it is more likely than not that it will be required to sell these securities before recovery of their cost or amortized cost basis. For securities with significant declines in value, individual security level analysis was performed utilizing underlying collateral default expectations, market data, and industry analyst reports.
F-100
Mortgage and corporate loans carried at amortized cost
Mortgage and corporate loans consist of the following:
| September 30, 2025 | December 31, 2024 | |||||||||||||
| Asset Management | ||||||||||||||
| Corporate loans | $ | $ | ||||||||||||
| Total corporate loans | ||||||||||||||
| Allowance for credit losses | ( | ( | ||||||||||||
| Total corporate loans, net of allowance for credit losses | $ | $ | ||||||||||||
| Insurance Solutions | ||||||||||||||
| Commercial real estate mortgage loans | $ | $ | ||||||||||||
| Multi-family mortgage loans | ||||||||||||||
| Other invested assets - corporate loans | ||||||||||||||
| Total mortgage and corporate loans | $ | $ | ||||||||||||
| Allowance for credit losses | ( | ( | ||||||||||||
| Total mortgage and other invested assets - corporate loans, net of allowance for credit losses | $ | $ | ||||||||||||
The maturity distribution for commercial real estate, multi-family mortgage loans and corporate loans were as follows as of September 30, 2025:
| Asset Management | Corporate loans | |||||||
| Remainder of 2025 | $ | |||||||
| 2026 | ||||||||
| 2027 | ||||||||
| 2028 | ||||||||
| 2029 | ||||||||
| 2030 and thereafter | ||||||||
| Total | $ | |||||||
| Insurance Solutions | Commercial real estate mortgage loans | Multi-family mortgage loans | Other invested assets - corporate loans | Total loans | ||||||||||||||||||||||
| Remainder of 2025 | $ | $ | $ | $ | ||||||||||||||||||||||
| 2026 | ||||||||||||||||||||||||||
| 2027 | ||||||||||||||||||||||||||
| 2028 | ||||||||||||||||||||||||||
| 2029 | ||||||||||||||||||||||||||
| 2030 and thereafter | ||||||||||||||||||||||||||
| Total | $ | $ | $ | $ | ||||||||||||||||||||||
Actual maturities could differ from contractual maturities, because borrowers may have the right to prepay (with or without prepayment penalties) and loans may be refinanced.
F-101
The carrying value by credit risk and loan type were as follows:
| Asset Management | ||||||||||||||||||||||||||
| Loans – carrying value by credit risk | September 30, 2025 | December 31, 2024 | ||||||||||||||||||||||||
| Level 1 | $ | % | $ | % | ||||||||||||||||||||||
| Level 2 | — | — | % | — | — | % | ||||||||||||||||||||
| Level 3 | — | — | % | — | — | % | ||||||||||||||||||||
| Level 4 | — | — | % | — | — | % | ||||||||||||||||||||
| Level 5 | — | — | % | — | — | % | ||||||||||||||||||||
| Total by credit risk | $ | 100 | % | $ | 100 | % | ||||||||||||||||||||
| Asset Management | ||||||||||||||||||||||||||
| Loans – carrying value by loan type | September 30, 2025 | December 31, 2024 | ||||||||||||||||||||||||
| Corporate loans | $ | % | $ | % | ||||||||||||||||||||||
| Total by loan type | $ | 100 | % | $ | 100 | % | ||||||||||||||||||||
| Insurance Solutions | ||||||||||||||||||||||||||
| Loans – carrying value by credit risk | September 30, 2025 | December 31, 2024 | ||||||||||||||||||||||||
| Level 1 | $ | % | $ | % | ||||||||||||||||||||||
| Level 2 | % | % | ||||||||||||||||||||||||
| Level 3 | % | % | ||||||||||||||||||||||||
| Level 4 | % | % | ||||||||||||||||||||||||
| Level 5 | % | % | ||||||||||||||||||||||||
| Total by credit risk | $ | 100 | % | $ | 100 | % | ||||||||||||||||||||
| Insurance Solutions | ||||||||||||||||||||||||||
| Loans – carrying value by loan type | September 30, 2025 | December 31, 2024 | ||||||||||||||||||||||||
| Commercial real estate mortgage loans | $ | % | $ | % | ||||||||||||||||||||||
| Multi-family mortgage loans | % | % | ||||||||||||||||||||||||
| Other invested assets - corporate loans | % | % | ||||||||||||||||||||||||
| Total by loan type | $ | 100 | % | $ | 100 | % | ||||||||||||||||||||
The following tables summarizes the activity related to the allowance for credit losses for the nine months ended September 30, 2025 and 2024:
| Asset Management | Corporate loans | Total loans | ||||||||||||
| Balance, December 31, 2024 | $ | $ | ||||||||||||
| Charge-offs | — | |||||||||||||
| Recoveries | — | |||||||||||||
| Provision for credit losses | — | |||||||||||||
| Balance, September 30, 2025 | $ | $ | ||||||||||||
F-102
| Insurance Solutions | Commercial real estate mortgage loans | Multi-family mortgage loans | Corporate loans | Total loans | ||||||||||||||||||||||
| Balance, December 31, 2024 | $ | $ | $ | $ | ||||||||||||||||||||||
| Charge-offs | — | — | — | |||||||||||||||||||||||
| Recoveries | — | — | — | |||||||||||||||||||||||
| Provision for credit losses | ( | ( | ( | |||||||||||||||||||||||
| Balance, September 30, 2025 | $ | $ | $ | $ | ||||||||||||||||||||||
| Asset Management | Corporate loans | Total loans | ||||||||||||
| Balance, December 31, 2023 | $ | $ | ||||||||||||
| Charge-offs | — | |||||||||||||
| Recoveries | — | |||||||||||||
| Provision for credit losses | — | |||||||||||||
| Balance, September 30, 2024 | $ | $ | ||||||||||||
| Insurance Solutions | Commercial real estate mortgage loans | Multi-family mortgage loans | Corporate loans | Total loans | ||||||||||||||||||||||
| Balance, December 31, 2023 | $ | $ | $ | $ | ||||||||||||||||||||||
| Charge-offs | — | — | — | |||||||||||||||||||||||
| Recoveries | — | — | — | |||||||||||||||||||||||
| Provision for credit losses | ( | |||||||||||||||||||||||||
| Balance, September 30, 2024 | $ | $ | $ | $ | ||||||||||||||||||||||
The following tables present an analysis of past-due loans:
| September 30, 2025 | ||||||||||||||||||||||||||||||||||||||
| Asset Management | Loans 30-59 days past due | Loans 60-89 days past due | Loans 90 days or more past due | Nonaccrual loans | Current loans | Total loans | ||||||||||||||||||||||||||||||||
| Corporate loans | $ | — | $ | — | $ | — | $ | $ | $ | |||||||||||||||||||||||||||||
| Total corporate loans | $ | $ | $ | $ | $ | $ | ||||||||||||||||||||||||||||||||
| September 30, 2025 | ||||||||||||||||||||||||||||||||||||||
| Insurance Solutions | Loans 30-59 days past due | Loans 60-89 days past due | Loans 90 days or more past due | Nonaccrual loans | Current loans | Total loans | ||||||||||||||||||||||||||||||||
| Commercial real estate mortgage loans | $ | — | $ | — | $ | — | $ | $ | $ | |||||||||||||||||||||||||||||
| Multi-family mortgage loans | — | — | — | |||||||||||||||||||||||||||||||||||
| Other invested assets - corporate loans | — | — | — | — | ||||||||||||||||||||||||||||||||||
| Total mortgage and other invested assets - corporate loans | $ | $ | $ | $ | $ | $ | ||||||||||||||||||||||||||||||||
F-103
| December 31, 2024 | ||||||||||||||||||||||||||||||||||||||
| Asset Management | Loans 30-59 days past due | Loans 60-89 days past due | Loans 90 days or more past due | Nonaccrual loans | Current loans | Total loans | ||||||||||||||||||||||||||||||||
| Corporate loans | $ | — | $ | — | $ | — | $ | $ | $ | |||||||||||||||||||||||||||||
| Total corporate loans | $ | $ | $ | $ | $ | $ | ||||||||||||||||||||||||||||||||
| December 31, 2024 | ||||||||||||||||||||||||||||||||||||||
| Insurance Solutions | Loans 30-59 days past due | Loans 60-89 days past due | Loans 90 days or more past due | Nonaccrual loans | Current loans | Total loans | ||||||||||||||||||||||||||||||||
| Commercial real estate mortgage loans | $ | — | $ | — | $ | — | $ | $ | $ | |||||||||||||||||||||||||||||
| Multi-family mortgage loans | — | — | — | |||||||||||||||||||||||||||||||||||
| Other invested assets - corporate loans | — | — | — | — | ||||||||||||||||||||||||||||||||||
| Total mortgage and other invested assets - corporate loans | $ | $ | $ | $ | $ | $ | ||||||||||||||||||||||||||||||||
The Company designates individually evaluated loans on nonaccrual status as collateral-dependent loans, as well as other loans that management of the Company designates as having higher risk. Collateral dependent loans are loans for which the repayment is expected to be provided substantially through the operation or sale of the collateral and the borrower is experiencing financial difficulty. These loans do not share common risk characteristics and are not included within the collectively evaluated loans for determining the allowance for credit losses.
The following represents total nonaccrual loans:
| September 30, 2025 | ||||||||||||||||||||
| Insurance Solutions | Nonaccrual loans with no allowance | Nonaccrual loans with an allowance | Total nonaccrual loans | |||||||||||||||||
| Commercial real estate mortgage loans | $ | $ | $ | |||||||||||||||||
| Multi-family mortgage loans | — | |||||||||||||||||||
| Other invested assets - corporate loans | — | — | ||||||||||||||||||
| Total loans | $ | $ | $ | |||||||||||||||||
| December 31, 2024 | ||||||||||||||||||||
| Insurance Solutions | Nonaccrual loans with no allowance | Nonaccrual loans with an allowance | Total nonaccrual loans | |||||||||||||||||
| Commercial real estate mortgage loans | $ | — | $ | $ | ||||||||||||||||
| Multi-family mortgage loans | — | |||||||||||||||||||
| Other invested assets - corporate loans | — | — | ||||||||||||||||||
| Total loans | $ | $ | $ | |||||||||||||||||
F-104
The following represents accrued interest receivables written off:
| As of | September 30, 2025 | December 31, 2024 | ||||||||||||
| Insurance Solutions | ||||||||||||||
| Commercial real estate mortgage loans | $ | $ | ||||||||||||
| Multi-family mortgage loans | ||||||||||||||
| Other invested assets - corporate loans | ||||||||||||||
| Total accrued interest receivables written off | $ | $ | ||||||||||||
The following table represents the portfolio of mortgage and corporate loans by origination year as of September 30, 2025 and December 31, 2024:
| Performance status as of September 30, 2025 | 2025 | 2024 | 2023 | 2022 | 2021 | Prior | Total | |||||||||||||||||||||||||||||||||||||
| Asset Management | ||||||||||||||||||||||||||||||||||||||||||||
| Corporate loans | ||||||||||||||||||||||||||||||||||||||||||||
| Level 1 | $ | — | $ | — | $ | — | $ | — | $ | — | $ | $ | ||||||||||||||||||||||||||||||||
| Level 2 | — | — | — | — | — | — | ||||||||||||||||||||||||||||||||||||||
| Level 3 | — | — | — | — | — | — | ||||||||||||||||||||||||||||||||||||||
| Level 4 | — | — | — | — | — | — | ||||||||||||||||||||||||||||||||||||||
| Level 5 | — | — | — | — | — | — | ||||||||||||||||||||||||||||||||||||||
| Total corporate loans | $ | — | $ | — | $ | — | $ | — | $ | — | $ | $ | ||||||||||||||||||||||||||||||||
| Insurance Solutions | ||||||||||||||||||||||||||||||||||||||||||||
| Commercial real estate loans | ||||||||||||||||||||||||||||||||||||||||||||
| Level 1 | $ | — | $ | — | $ | $ | — | $ | — | $ | — | $ | ||||||||||||||||||||||||||||||||
| Level 2 | — | — | ||||||||||||||||||||||||||||||||||||||||||
| Level 3 | — | — | — | — | — | |||||||||||||||||||||||||||||||||||||||
| Level 4 | — | — | — | — | — | — | ||||||||||||||||||||||||||||||||||||||
| Level 5 | — | — | ||||||||||||||||||||||||||||||||||||||||||
| Total commercial real estate loans | — | |||||||||||||||||||||||||||||||||||||||||||
| Multi-family loans | ||||||||||||||||||||||||||||||||||||||||||||
| Level 1 | — | — | — | — | — | — | ||||||||||||||||||||||||||||||||||||||
| Level 2 | — | — | ||||||||||||||||||||||||||||||||||||||||||
| Level 3 | — | — | — | — | — | |||||||||||||||||||||||||||||||||||||||
| Level 4 | — | — | — | — | — | — | ||||||||||||||||||||||||||||||||||||||
| Level 5 | — | — | — | |||||||||||||||||||||||||||||||||||||||||
| Total multi-family loans | ||||||||||||||||||||||||||||||||||||||||||||
| Other invested assets - corporate loans | ||||||||||||||||||||||||||||||||||||||||||||
| Level 1 | — | |||||||||||||||||||||||||||||||||||||||||||
| Level 2 | — | — | — | — | — | — | ||||||||||||||||||||||||||||||||||||||
| Level 3 | — | — | — | — | — | — | ||||||||||||||||||||||||||||||||||||||
| Level 4 | — | — | — | — | — | — | ||||||||||||||||||||||||||||||||||||||
| Level 5 | — | — | — | — | — | — | ||||||||||||||||||||||||||||||||||||||
| Total other invested assets - corporate loans | — | |||||||||||||||||||||||||||||||||||||||||||
| Total mortgage and corporate loans | $ | $ | $ | $ | $ | $ | $ | |||||||||||||||||||||||||||||||||||||
F-105
| Performance status as of December 31, 2024 | 2024 | 2023 | 2022 | 2021 | 2020 | Prior | Total | |||||||||||||||||||||||||||||||||||||
| Asset Management | ||||||||||||||||||||||||||||||||||||||||||||
| Corporate loans | ||||||||||||||||||||||||||||||||||||||||||||
| Level 1 | $ | — | $ | — | $ | — | $ | — | $ | $ | — | $ | ||||||||||||||||||||||||||||||||
| Level 2 | — | — | — | — | — | — | ||||||||||||||||||||||||||||||||||||||
| Level 3 | — | — | — | — | — | — | ||||||||||||||||||||||||||||||||||||||
| Level 4 | — | — | — | — | — | — | ||||||||||||||||||||||||||||||||||||||
| Level 5 | — | — | — | — | — | — | ||||||||||||||||||||||||||||||||||||||
| Total corporate loans | $ | — | $ | — | $ | — | $ | — | $ | $ | — | $ | ||||||||||||||||||||||||||||||||
| Insurance Solutions | ||||||||||||||||||||||||||||||||||||||||||||
| Commercial real estate loans | ||||||||||||||||||||||||||||||||||||||||||||
| Level 1 | $ | — | $ | $ | — | $ | — | $ | — | $ | — | $ | ||||||||||||||||||||||||||||||||
| Level 2 | — | — | ||||||||||||||||||||||||||||||||||||||||||
| Level 3 | — | — | — | — | — | |||||||||||||||||||||||||||||||||||||||
| Level 4 | — | — | — | — | — | — | ||||||||||||||||||||||||||||||||||||||
| Level 5 | — | — | ||||||||||||||||||||||||||||||||||||||||||
| Total commercial real estate loans | ||||||||||||||||||||||||||||||||||||||||||||
| Multi-family loans | ||||||||||||||||||||||||||||||||||||||||||||
| Level 1 | — | — | — | — | — | — | ||||||||||||||||||||||||||||||||||||||
| Level 2 | — | — | ||||||||||||||||||||||||||||||||||||||||||
| Level 3 | — | — | — | — | — | |||||||||||||||||||||||||||||||||||||||
| Level 4 | — | — | — | — | — | — | ||||||||||||||||||||||||||||||||||||||
| Level 5 | — | — | — | |||||||||||||||||||||||||||||||||||||||||
| Total multi-family loans | ||||||||||||||||||||||||||||||||||||||||||||
| Other invested assets - corporate loans | ||||||||||||||||||||||||||||||||||||||||||||
| Level 1 | — | — | ||||||||||||||||||||||||||||||||||||||||||
| Level 2 | — | — | — | — | — | — | ||||||||||||||||||||||||||||||||||||||
| Level 3 | — | — | — | — | — | — | ||||||||||||||||||||||||||||||||||||||
| Level 4 | — | — | — | — | — | — | ||||||||||||||||||||||||||||||||||||||
| Level 5 | — | — | — | — | — | — | ||||||||||||||||||||||||||||||||||||||
| Total other invested assets - corporate loans | ||||||||||||||||||||||||||||||||||||||||||||
| Total mortgage and corporate loans | $ | $ | $ | $ | $ | $ | $ | |||||||||||||||||||||||||||||||||||||
The following represents the carrying value of collateral-dependent loans of the Company as of September 30, 2025 and December 31, 2024:
| September 30, 2025 | December 31, 2024 | |||||||||||||
| Commercial real estate mortgage loans | $ | $ | ||||||||||||
The Company maintains a separate reserve for credit losses on off-balance sheet credit exposures, including unfunded loan commitments, which is included under the line item entitled “Accrued expenses and other liabilities” on the Condensed Consolidated Statements of Financial Position. The reserve for credit losses on off-balance sheet credit exposures is adjusted as a provision for credit losses in the income statement. The estimate includes consideration of the likelihood that funding will occur and an estimate of expected credit losses on commitments expected to be funded over its estimated life, utilizing the same models and approaches for the Company's other loan portfolio segments described above, as these unfunded commitments share similar risk characteristics as its loan portfolio segments. The unfunded off-balance sheet credit line commitments for corporate loans accounted for as held for investments (“HFI”) was $1.4 million for Asset Management and $3.3 million for Insurance Solutions as of September 30, 2025 (December 31, 2024: $1.4 million and $4.7 million, for Asset Management and Insurance Solutions, respectively)
F-106
The liability for credit losses on off-balance sheet credit exposures for these loans included in Accrued expenses and other liabilities was less than $0.1
Note 7. Derivatives
The Company uses derivative instruments to manage interest rate risk. See Note 9. Fair value measurements for information about the fair value hierarchy for derivatives.
The following table presents the notional amount and fair value of freestanding derivative instruments:
| September 30, 2025 | December 31, 2024 | |||||||||||||||||||||||||||||||||||||
| Notional amount | Assets | Liabilities | Notional amount | Assets | Liabilities | |||||||||||||||||||||||||||||||||
| Derivatives designated as hedges | ||||||||||||||||||||||||||||||||||||||
| Interest rate swaps | $ | $ | $ | — | $ | $ | — | $ | ||||||||||||||||||||||||||||||
Derivatives designated as hedges
Cash flow hedges
The Company uses interest rate swaps to convert floating-rate interest receipts to fixed-rate interest receipts to reduce exposure to interest rate changes. The interest rate swaps will expire by October 2036. During the nine months ended September 30, 2025, the Company reported gain of $0.5 million in Other Comprehensive Income (“OCI”) associated with these hedges. There were no amounts deemed ineffective during the nine months ended September 30, 2025. As of September 30, 2025, less than $0.1 million is expected to be reclassified into income as part of earnings within the next 12 months.
Embedded derivatives
The Company has embedded derivatives which are required to be separated from their host contracts and reported as derivatives. Host contracts include reinsurance agreements structured on a modified coinsurance (“Modco”) or funds withheld basis. The fair value of the embedded derivative liability is $28.3 million and $34.8 million as of September 30, 2025 and December 31, 2024, respectively.
Credit risk
The Company may be exposed to credit-related losses in the event of counterparty nonperformance on derivative financial instruments. Generally, the current credit exposure of the Company’s derivative contracts is the fair value at the reporting date less any collateral received from the counterparty.
The Company manages credit risk related to derivatives by entering into transactions with creditworthy counterparties. Where possible, the Company maintains collateral arrangements and uses master netting agreements that provide for a single net payment from one counterparty to another at each due date and upon termination. The Company has also established counterparty exposure limits, where possible, in order to evaluate if there is sufficient collateral to support the net exposure. Collateral arrangements typically require the posting of collateral in connection with its derivative instruments. Collateral agreements often contain posting thresholds, some of which may vary depending on the posting party’s financial strength ratings.
There is no difference between the current presentation of the fair value of the interest rate swaps and the presentation of fair value of the interest rate swaps after the application of any right of offset, as of September 30, 2025.
F-107
Note 8. Variable interest entities
Consolidated variable interest entities (“VIEs”) include collateralized loan obligations (“CLOs”) managed by the Company. The assets of consolidated VIEs are not available to creditors of the Company, and the investors in these consolidated VIEs have no recourse against the assets of the Company.
Revenues of consolidated VIEs - Insurance Solutions
The following summarizes the Condensed Consolidated Statements of Operations activity of the consolidated VIEs:
| For the Three Months Ended September 30, | 2025 | 2024 | ||||||||||||
| Investment income | $ | $ | ||||||||||||
| Investment expense | ( | ( | ||||||||||||
| Net investment income | ||||||||||||||
| Unrealized gain/(loss) on investments | ( | ( | ||||||||||||
| Realized gain/(loss) on investments | ||||||||||||||
| Net gains (losses) from investment activities | ( | ( | ||||||||||||
| Net revenues of consolidated variable interest entities | $ | $ | ||||||||||||
| For the Nine Months Ended September 30, | 2025 | 2024 | ||||||||||||
| Investment income | $ | $ | ||||||||||||
| Investment expense | ( | ( | ||||||||||||
| Net investment income | ||||||||||||||
| Unrealized gain/(loss) on investments | ( | ( | ||||||||||||
| Realized gain/(loss) on investments | ||||||||||||||
| Net gains (losses) from investment activities | ( | ( | ||||||||||||
| Net revenues of consolidated variable interest entities | $ | $ | ||||||||||||
Unconsolidated VIEs
The Company holds variable interests in certain VIEs for which it is not the primary beneficiary. The Company’s variable interests include equity interests, loans, and beneficial interests in CLOs and other entities, which are recorded within “Investments” in the Condensed Consolidated Statements of Financial Position. The following table presents the Company’s maximum exposure to losses relating to these VIEs for which the Company
F-108
has a variable interest, but is not the primary beneficiary. The Company has exposure beyond the carrying value of its variable interests due to unfunded commitments on loans.
| September 30, 2025 | December 31, 2024 | |||||||||||||||||||||||||
| Carrying amount | Maximum exposure to loss | Carrying amount | Maximum Exposure to Loss | |||||||||||||||||||||||
| Asset Management | ||||||||||||||||||||||||||
| Variable interests | $ | $ | $ | $ | ||||||||||||||||||||||
| Variable interests in related parties | ||||||||||||||||||||||||||
| Total Asset Management | $ | $ | $ | $ | ||||||||||||||||||||||
| Insurance Solutions | ||||||||||||||||||||||||||
| Variable interests | $ | $ | $ | $ | ||||||||||||||||||||||
| Variable interests in related parties | ||||||||||||||||||||||||||
| Total Insurance Solutions | $ | $ | $ | $ | ||||||||||||||||||||||
| Total | $ | $ | $ | $ | ||||||||||||||||||||||
F-109
Note 9. Fair value measurements
The following tables summarize the valuation of assets and liabilities measured at fair value by fair value hierarchy. Investments classified as Equity Method for which the Fair Value Option (“FVO”) has not been elected have been excluded from the table below.
| Fair Value Measurements | ||||||||||||||||||||||||||||||||
| September 30, 2025 | Level 1 | Level 2 | Level 3 | NAV | Total | |||||||||||||||||||||||||||
| Financial assets | ||||||||||||||||||||||||||||||||
| Asset Management | ||||||||||||||||||||||||||||||||
| Equity securities | $ | $ | $ | $ | — | $ | ||||||||||||||||||||||||||
| Derivatives | — | — | — | |||||||||||||||||||||||||||||
| Other invested assets | — | — | — | |||||||||||||||||||||||||||||
| Total financial assets — Asset Management | — | |||||||||||||||||||||||||||||||
| Insurance Solutions | ||||||||||||||||||||||||||||||||
| Debt securities: | ||||||||||||||||||||||||||||||||
| U.S. government and agency | ||||||||||||||||||||||||||||||||
| U.S. state, territories and municipalities | — | — | — | |||||||||||||||||||||||||||||
| Other government and agency | — | — | — | |||||||||||||||||||||||||||||
| Corporate | — | — | ||||||||||||||||||||||||||||||
| Asset and mortgage-backed securities | — | — | ||||||||||||||||||||||||||||||
| Corporate loans | — | — | ||||||||||||||||||||||||||||||
| Equity securities | ||||||||||||||||||||||||||||||||
| Other invested assets | — | — | ||||||||||||||||||||||||||||||
| Total financial assets — Insurance Solutions | ||||||||||||||||||||||||||||||||
| Corporate loans of consolidated VIEs | ||||||||||||||||||||||||||||||||
| Equity of consolidated VIEs | — | — | — | |||||||||||||||||||||||||||||
| Total financial assets including consolidated VIEs | ||||||||||||||||||||||||||||||||
| Derivatives | — | — | — | |||||||||||||||||||||||||||||
| Total financial assets | $ | $ | $ | $ | $ | |||||||||||||||||||||||||||
| Financial liabilities | ||||||||||||||||||||||||||||||||
| Asset Management | ||||||||||||||||||||||||||||||||
| Debt obligations | — | — | — | |||||||||||||||||||||||||||||
| Total financial liabilities — Asset Management | — | — | — | |||||||||||||||||||||||||||||
| Insurance Solutions | ||||||||||||||||||||||||||||||||
| Ceded reinsurance - embedded derivative | — | — | — | |||||||||||||||||||||||||||||
| Interest rate swaps | — | — | — | |||||||||||||||||||||||||||||
| Total financial liabilities — Insurance Solutions | — | — | — | |||||||||||||||||||||||||||||
| Total financial liabilities | $ | — | $ | $ | $ | — | $ | |||||||||||||||||||||||||
F-110
| Fair Value Measurements | ||||||||||||||||||||||||||||||||
| December 31, 2024 | Level 1 | Level 2 | Level 3 | NAV | Total | |||||||||||||||||||||||||||
| Financial assets | ||||||||||||||||||||||||||||||||
| Asset Management | ||||||||||||||||||||||||||||||||
| Equity securities | $ | $ | — | $ | $ | — | $ | |||||||||||||||||||||||||
| Total financial assets — Asset Management | $ | $— | $ | $— | $ | |||||||||||||||||||||||||||
| Insurance Solutions | ||||||||||||||||||||||||||||||||
| Debt securities: | ||||||||||||||||||||||||||||||||
| U.S. government and agency | $— | $ | $— | $— | $ | |||||||||||||||||||||||||||
| U.S. state, territories and municipalities | — | — | — | |||||||||||||||||||||||||||||
| Other government and agency | — | — | — | |||||||||||||||||||||||||||||
| Corporate | — | — | — | |||||||||||||||||||||||||||||
| Asset and mortgage-backed securities | — | — | ||||||||||||||||||||||||||||||
| Corporate loans | — | — | — | |||||||||||||||||||||||||||||
| Equity securities | ||||||||||||||||||||||||||||||||
| Other invested assets | — | — | — | |||||||||||||||||||||||||||||
| Total financial assets — Insurance Solutions | $ | $ | $ | $ | $ | |||||||||||||||||||||||||||
| Corporate loans of consolidated VIEs | — | — | — | |||||||||||||||||||||||||||||
| Equity securities of consolidated VIEs | — | — | — | |||||||||||||||||||||||||||||
| Total financial assets including consolidated VIEs | $ | $ | $ | $ | $ | |||||||||||||||||||||||||||
| Total financial assets | $ | $ | $ | $ | $ | |||||||||||||||||||||||||||
| Financial liabilities | ||||||||||||||||||||||||||||||||
| Asset Management | ||||||||||||||||||||||||||||||||
| Debt obligations | $ | — | $ | — | $ | $ | — | $ | ||||||||||||||||||||||||
| Total financial liabilities — Asset Management | $— | $— | $ | $— | $ | |||||||||||||||||||||||||||
| Insurance Solutions | ||||||||||||||||||||||||||||||||
| Ceded reinsurance - embedded derivative | $ | — | $ | $ | — | $ | — | $ | ||||||||||||||||||||||||
| Interest rate swaps | — | — | — | |||||||||||||||||||||||||||||
| Total financial liabilities — Insurance Solutions | $— | $ | $— | $— | $ | |||||||||||||||||||||||||||
| Total financial liabilities | $ | — | $ | $ | $ | — | $ | |||||||||||||||||||||||||
The availability of observable inputs can vary depending on the financial asset and is affected by a wide variety of factors, including, for example, the type of instrument, whether the instrument has recently been issued, whether the instrument is traded on an active exchange or in the secondary market, and current market conditions. To the extent that valuation is based on models or inputs that are less observable or unobservable in the market, the determination of fair value requires additional judgment. Accordingly, the degree of judgment exercised by the Company in determining fair value is greatest for instruments categorized as Level 3. The variability and availability of the observable inputs affected by the factors described above may cause transfers between Levels 1, 2, and 3, as discussed further below.
Transfers between level 1 and level 2
The Company records transfers of assets between Level 1 and Level 2 at their fair values at the end of each reporting period. Assets are transferred out of Level 1 when they are no longer transacted with sufficient frequency and volume in an active market. Conversely, assets are transferred from Level 2 to Level 1 when transaction volume and frequency are indicative of an active market. During the three and nine months ended September 30, 2025 and September 30, 2024, there were no assets transferred between Level 1 and Level 2.
Transfers between level 1 or 2 and level 3
The Company records transfers of assets between Level 1 or 2 and Level 3 at the end of each reporting period. Assets are transferred into Level 3 when there is a lack of observable valuation inputs.
F-111
Conversely, assets are transferred out of Level 3 when valuation inputs become observable. Whether the assets are transferred into Level 1 or 2 will depend on whether the prices are unadjusted and quoted in an active market.
The following tables summarize changes in the Company’s investment portfolio measured and reporting at fair value for which Level 3 inputs were used in determining fair value:
| Net Change in Unrealized Appreciation (Depreciation) | ||||||||||||||||||||||||||||||||||||||||||||||||||||||||||||||||||||
| Change in unrealized gains (losses) included in income on Level 3 assets and liabilities still held | Change in unrealized gains (losses) included in OCI on Level 3 assets and liabilities still held | |||||||||||||||||||||||||||||||||||||||||||||||||||||||||||||||||||
| Purchases | Sales and repayments | Net realized gain (loss) | Included in income | Included in OCI | Transfer in ¹ | Transfer out ¹ | ||||||||||||||||||||||||||||||||||||||||||||||||||||||||||||||
| Three Months Ended September 30, 2025 | Beginning Balance | Ending Balance | ||||||||||||||||||||||||||||||||||||||||||||||||||||||||||||||||||
| Financial assets | ||||||||||||||||||||||||||||||||||||||||||||||||||||||||||||||||||||
| Asset Management | ||||||||||||||||||||||||||||||||||||||||||||||||||||||||||||||||||||
| Equity securities | $ | $ | $ | ( | $ | — | $ | $ | — | $ | — | $ | — | $ | $ | $ | — | |||||||||||||||||||||||||||||||||||||||||||||||||||
| Derivatives | — | — | — | — | — | — | — | |||||||||||||||||||||||||||||||||||||||||||||||||||||||||||||
| Other invested assets | — | — | — | — | — | — | — | 73 | — | — | ||||||||||||||||||||||||||||||||||||||||||||||||||||||||||
| Total assets — Asset Management | $ | $ | $ | ( | $ | — | $ | $ | — | $ | — | $ | — | $ | $ | $ | — | |||||||||||||||||||||||||||||||||||||||||||||||||||
| Insurance Solutions | ||||||||||||||||||||||||||||||||||||||||||||||||||||||||||||||||||||
| Debt securities: | ||||||||||||||||||||||||||||||||||||||||||||||||||||||||||||||||||||
| Corporate | $ | $ | — | $ | — | $ | — | $ | — | $ | $ | — | $ | — | $ | $ | — | $ | ||||||||||||||||||||||||||||||||||||||||||||||||||
| Asset and mortgage-backed securities | — | ( | — | ( | — | — | ||||||||||||||||||||||||||||||||||||||||||||||||||||||||||||||
| Corporate loans | ( | — | — | — | — | |||||||||||||||||||||||||||||||||||||||||||||||||||||||||||||||
| Equity securities | — | — | — | ( | — | — | ( | — | ||||||||||||||||||||||||||||||||||||||||||||||||||||||||||||
| Other invested assets | — | — | — | — | ||||||||||||||||||||||||||||||||||||||||||||||||||||||||||||||||
| Total assets — Insurance Solutions | ( | — | ||||||||||||||||||||||||||||||||||||||||||||||||||||||||||||||||||
| Equity securities of consolidated VIEs | ( | — | ( | — | — | — | ( | — | ||||||||||||||||||||||||||||||||||||||||||||||||||||||||||||
| Corporate loans of consolidated VIEs | ( | ( | — | — | — | ( | — | |||||||||||||||||||||||||||||||||||||||||||||||||||||||||||||
| Total financial assets including consolidated VIEs - Insurance Solutions | ( | ( | — | ( | ||||||||||||||||||||||||||||||||||||||||||||||||||||||||||||||||
| Total financial assets | $ | $ | $ | ( | $ | $ | $ | $ | $ | — | $ | $ | $ | |||||||||||||||||||||||||||||||||||||||||||||||||||||||
| Financial liabilities | ||||||||||||||||||||||||||||||||||||||||||||||||||||||||||||||||||||
| Asset Management | ||||||||||||||||||||||||||||||||||||||||||||||||||||||||||||||||||||
| Debt obligations | $ | $ | — | $ | — | $ | — | $ | — | $ | — | $ | — | $ | — | $ | $ | — | $ | — | ||||||||||||||||||||||||||||||||||||||||||||||||
| Total financial liabilities — Asset Management | $ | $ | — | $ | — | $ | — | $ | — | $ | — | $ | — | $ | — | $ | $ | — | $ | — | ||||||||||||||||||||||||||||||||||||||||||||||||
F-112
| Net Change in Unrealized Appreciation (Depreciation) | ||||||||||||||||||||||||||||||||||||||||||||||||||||||||||||||||||||
| Change in unrealized gains (losses) included in income on Level 3 assets and liabilities still held | Change in unrealized gains (losses) included in OCI on Level 3 assets and liabilities still held | |||||||||||||||||||||||||||||||||||||||||||||||||||||||||||||||||||
| Purchases | Sales and repayments | Net realized gain (loss) | Included in income | Included in OCI | Transfer in ¹ | Transfer out ¹ | ||||||||||||||||||||||||||||||||||||||||||||||||||||||||||||||
| Nine Months Ended September 30, 2025 | Beginning Balance | Ending Balance | ||||||||||||||||||||||||||||||||||||||||||||||||||||||||||||||||||
| Financial assets | ||||||||||||||||||||||||||||||||||||||||||||||||||||||||||||||||||||
| Asset Management | ||||||||||||||||||||||||||||||||||||||||||||||||||||||||||||||||||||
| Equity securities | $ | $ | $ | ( | $ | — | $ | $ | — | $ | — | $ | — | $ | $ | $ | — | |||||||||||||||||||||||||||||||||||||||||||||||||||
| Derivatives | — | — | — | — | — | — | — | |||||||||||||||||||||||||||||||||||||||||||||||||||||||||||||
| Other invested assets | — | — | — | — | — | — | — | — | — | |||||||||||||||||||||||||||||||||||||||||||||||||||||||||||
| Total assets — Asset Management | ( | — | — | — | — | — | ||||||||||||||||||||||||||||||||||||||||||||||||||||||||||||||
| Insurance Solutions | ||||||||||||||||||||||||||||||||||||||||||||||||||||||||||||||||||||
| Debt securities: | ||||||||||||||||||||||||||||||||||||||||||||||||||||||||||||||||||||
| Corporate | $ | — | $ | — | $ | — | $ | — | $ | — | $ | $ | $ | — | $ | $ | — | $ | ||||||||||||||||||||||||||||||||||||||||||||||||||
| Asset and mortgage-backed securities | — | ( | — | ( | — | — | ||||||||||||||||||||||||||||||||||||||||||||||||||||||||||||||
| Corporate loans | ( | — | — | — | — | |||||||||||||||||||||||||||||||||||||||||||||||||||||||||||||||
| Equity securities | — | — | — | — | — | — | ||||||||||||||||||||||||||||||||||||||||||||||||||||||||||||||
| Other invested assets | — | ( | ( | ( | — | ( | ||||||||||||||||||||||||||||||||||||||||||||||||||||||||||||||
| Total assets — Insurance Solutions | ( | ( | — | |||||||||||||||||||||||||||||||||||||||||||||||||||||||||||||||||
| Equity securities of consolidated VIEs | ( | — | — | — | — | — | ||||||||||||||||||||||||||||||||||||||||||||||||||||||||||||||
| Corporate loans of consolidated VIEs | ( | ( | — | — | — | ( | — | |||||||||||||||||||||||||||||||||||||||||||||||||||||||||||||
| Total financial assets including consolidated VIEs - Insurance Solutions | ( | ( | — | |||||||||||||||||||||||||||||||||||||||||||||||||||||||||||||||||
| Total financial assets | $ | $ | $ | ( | $ | ( | $ | $ | $ | $ | — | $ | $ | $ | ||||||||||||||||||||||||||||||||||||||||||||||||||||||
| Financial liabilities | ||||||||||||||||||||||||||||||||||||||||||||||||||||||||||||||||||||
| Asset Management | ||||||||||||||||||||||||||||||||||||||||||||||||||||||||||||||||||||
| Debt obligations | $ | $ | — | $ | — | $ | — | $ | ( | $ | — | $ | — | $ | — | $ | $ | $ | — | |||||||||||||||||||||||||||||||||||||||||||||||||
| Total financial liabilities — Asset Management | $ | $ | — | $ | — | $ | — | $ | ( | $ | — | $ | — | $ | — | $ | $ | $ | — | |||||||||||||||||||||||||||||||||||||||||||||||||
_______________
(1)Transfers into Level 3 are due to decrease in the quantity and reliability of broker quotes obtained. Transfers out of Level 3 are due to an increase in the quantity and reliability of broker quotes obtained. Transfers are assumed to have occurred at the end of the period.
| Net Change in Unrealized Appreciation (Depreciation) | ||||||||||||||||||||||||||||||||||||||||||||||||||||||||||||||||||||
| Change in unrealized gains (losses) included in income on Level 3 assets and liabilities still held | Change in unrealized gains (losses) included in OCI on Level 3 assets and liabilities still held | |||||||||||||||||||||||||||||||||||||||||||||||||||||||||||||||||||
| Purchases | Sales and repayments | Net realized gain (loss) | Included in income | Included in OCI | Transfer in ¹ | Transfer out ¹ | Change in consolidation | |||||||||||||||||||||||||||||||||||||||||||||||||||||||||||||
| Three Months Ended September 30, 2024 | Beginning Balance | Ending Balance | ||||||||||||||||||||||||||||||||||||||||||||||||||||||||||||||||||
| Financial assets | ||||||||||||||||||||||||||||||||||||||||||||||||||||||||||||||||||||
| Asset Management | ||||||||||||||||||||||||||||||||||||||||||||||||||||||||||||||||||||
| Equity securities | $ | $ | — | $ | — | $ | — | $ | ( | $ | — | $ | — | $ | — | $ | — | $ | $ | ( | $ | — | ||||||||||||||||||||||||||||||||||||||||||||||
| Total assets — Asset Management | — | — | — | ( | — | — | — | — | ( | — | ||||||||||||||||||||||||||||||||||||||||||||||||||||||||||
F-113
| Net Change in Unrealized Appreciation (Depreciation) | ||||||||||||||||||||||||||||||||||||||||||||||||||||||||||||||||||||
| Change in unrealized gains (losses) included in income on Level 3 assets and liabilities still held | Change in unrealized gains (losses) included in OCI on Level 3 assets and liabilities still held | |||||||||||||||||||||||||||||||||||||||||||||||||||||||||||||||||||
| Purchases | Sales and repayments | Net realized gain (loss) | Included in income | Included in OCI | Transfer in ¹ | Transfer out ¹ | Change in consolidation | |||||||||||||||||||||||||||||||||||||||||||||||||||||||||||||
| Three Months Ended September 30, 2024 | Beginning Balance | Ending Balance | ||||||||||||||||||||||||||||||||||||||||||||||||||||||||||||||||||
| Insurance Solutions | ||||||||||||||||||||||||||||||||||||||||||||||||||||||||||||||||||||
| Debt securities: | ||||||||||||||||||||||||||||||||||||||||||||||||||||||||||||||||||||
| Corporate | — | — | — | — | — | — | — | — | — | — | — | — | ||||||||||||||||||||||||||||||||||||||||||||||||||||||||
| Asset and mortgage-backed securities | — | ( | — | ( | — | — | — | |||||||||||||||||||||||||||||||||||||||||||||||||||||||||||||
| Corporate loans | ( | 155 | ( | — | — | — | ( | — | ||||||||||||||||||||||||||||||||||||||||||||||||||||||||||||
| Equity securities | — | — | — | — | — | — | — | |||||||||||||||||||||||||||||||||||||||||||||||||||||||||||||
| Other invested assets | — | ( | ( | — | — | ( | ||||||||||||||||||||||||||||||||||||||||||||||||||||||||||||||
| Total assets — Insurance Solutions | ( | ( | — | — | ( | ( | ||||||||||||||||||||||||||||||||||||||||||||||||||||||||||||||
| Equity securities of consolidated VIEs | — | — | — | — | — | — | ||||||||||||||||||||||||||||||||||||||||||||||||||||||||||||||
| Corporate loans of consolidated VIEs | ( | ( | — | — | — | — | ( | — | ||||||||||||||||||||||||||||||||||||||||||||||||||||||||||||
| Total financial assets including consolidated VIEs - Insurance Solutions | ( | ( | ( | — | — | ( | ( | |||||||||||||||||||||||||||||||||||||||||||||||||||||||||||||
| Total financial assets | $ | $ | $ | ( | $ | $ | ( | $ | ( | $ | $ | — | $ | — | $ | $ | ( | $ | ( | |||||||||||||||||||||||||||||||||||||||||||||||||
| Financial liabilities | ||||||||||||||||||||||||||||||||||||||||||||||||||||||||||||||||||||
| Asset Management | ||||||||||||||||||||||||||||||||||||||||||||||||||||||||||||||||||||
| Debt obligations | $ | $ | — | $ | — | $ | — | $ | ( | $ | — | $ | — | $ | — | $ | — | $ | $ | $ | — | |||||||||||||||||||||||||||||||||||||||||||||||
| Total liabilities — Asset Management | — | — | — | ( | — | — | — | — | — | |||||||||||||||||||||||||||||||||||||||||||||||||||||||||||
| Total financial liabilities — Asset Management | $ | $ | — | $ | — | $ | — | $ | ( | $ | — | $ | — | $ | — | $ | — | $ | $ | $ | — | |||||||||||||||||||||||||||||||||||||||||||||||
F-114
| Net Change in Unrealized Appreciation (Depreciation) | ||||||||||||||||||||||||||||||||||||||||||||||||||||||||||||||||||||
| Change in unrealized gains (losses) included in income on Level 3 assets and liabilities still held | Change in unrealized gains (losses) included in OCI on Level 3 assets and liabilities still held | |||||||||||||||||||||||||||||||||||||||||||||||||||||||||||||||||||
| Purchases | Sales and repayments | Net realized gain (loss) | Included in income | Included in OCI | Transfer in ¹ | Transfer out ¹ | Change in consolidation | |||||||||||||||||||||||||||||||||||||||||||||||||||||||||||||
| Nine Months Ended September 30, 2024 | Beginning Balance | Ending Balance | ||||||||||||||||||||||||||||||||||||||||||||||||||||||||||||||||||
| Financial assets | ||||||||||||||||||||||||||||||||||||||||||||||||||||||||||||||||||||
| Asset Management | ||||||||||||||||||||||||||||||||||||||||||||||||||||||||||||||||||||
| Equity securities | $ | $ | — | $ | — | $ | — | $ | ( | $ | — | $ | — | $ | — | $ | — | $ | $ | ( | $ | — | ||||||||||||||||||||||||||||||||||||||||||||||
| Total assets — Asset Management | — | — | — | ( | — | — | — | — | ( | — | ||||||||||||||||||||||||||||||||||||||||||||||||||||||||||
| Insurance Solutions | ||||||||||||||||||||||||||||||||||||||||||||||||||||||||||||||||||||
| Debt securities: | ||||||||||||||||||||||||||||||||||||||||||||||||||||||||||||||||||||
| Corporate | — | — | — | — | — | — | — | — | — | — | — | — | ||||||||||||||||||||||||||||||||||||||||||||||||||||||||
| Asset and mortgage-backed securities | — | ( | — | ( | — | — | — | |||||||||||||||||||||||||||||||||||||||||||||||||||||||||||||
| Corporate loans | ( | 154 | ( | — | — | — | ( | — | ||||||||||||||||||||||||||||||||||||||||||||||||||||||||||||
| Equity securities | — | ( | — | — | — | — | — | — | ||||||||||||||||||||||||||||||||||||||||||||||||||||||||||||
| Other invested assets | — | ( | ( | — | — | — | ( | ( | ||||||||||||||||||||||||||||||||||||||||||||||||||||||||||||
| Total assets — Insurance Solutions | ( | ( | ( | — | — | ( | ( | |||||||||||||||||||||||||||||||||||||||||||||||||||||||||||||
| Equity securities of consolidated VIEs | — | — | — | — | — | — | ||||||||||||||||||||||||||||||||||||||||||||||||||||||||||||||
| Corporate loans of consolidated VIEs | ( | ( | — | — | — | — | ( | — | ||||||||||||||||||||||||||||||||||||||||||||||||||||||||||||
| Total financial assets including consolidated VIEs - Insurance Solutions | ( | ( | ( | — | — | ( | ( | |||||||||||||||||||||||||||||||||||||||||||||||||||||||||||||
| Total financial assets | $ | $ | $ | ( | $ | $ | ( | $ | ( | $ | $ | — | $ | — | $ | $ | ( | $ | ( | |||||||||||||||||||||||||||||||||||||||||||||||||
| Financial liabilities | ||||||||||||||||||||||||||||||||||||||||||||||||||||||||||||||||||||
| Asset Management | ||||||||||||||||||||||||||||||||||||||||||||||||||||||||||||||||||||
| Debt obligations | $ | $ | — | $ | — | $ | — | $ | ( | $ | — | $ | — | $ | — | $ | — | $ | $ | $ | — | |||||||||||||||||||||||||||||||||||||||||||||||
| Total financial liabilities — Asset Management | $ | $ | — | $ | — | $ | — | $ | ( | $ | — | $ | — | $ | — | $ | — | $ | $ | $ | — | |||||||||||||||||||||||||||||||||||||||||||||||
_______________
(1)Transfers into Level 3 are due to a decrease in the quantity and reliability of broker quotes obtained. Transfers out of Level 3 are due to an increase in the quantity and reliability of broker quotes obtained. Transfers are assumed to have occurred at the end of the period.
F-115
The valuation techniques and significant unobservable inputs used in Level 3 valuations were as follows:
| Quantitative Information about Level 3 Fair Value Measurements | ||||||||||||||||||||||||||
| September 30, 2025 | Fair value | Valuation technique/ methodology | Unobservable input | Range (weighted average) | ||||||||||||||||||||||
| Financial assets | ||||||||||||||||||||||||||
| Asset management | ||||||||||||||||||||||||||
| Equity securities | $ | Enterprise value | Multiple | |||||||||||||||||||||||
| Equity securities | Market approach | Privately quoted price | NA | |||||||||||||||||||||||
| Equity securities | Option pricing model | Volatility | ||||||||||||||||||||||||
| Option pricing model | Years to exercise | |||||||||||||||||||||||||
| Other invested assets | Probability-Weighted Expected Return Method | Independent probabilities | ||||||||||||||||||||||||
| Probability-Weighted Expected Return Method | Dependent probabilities | |||||||||||||||||||||||||
| Probability-Weighted Expected Return Method | Years to cash flows | |||||||||||||||||||||||||
| Total — Asset Management | $ | |||||||||||||||||||||||||
| Insurance | ||||||||||||||||||||||||||
| Debt securities¹: | ||||||||||||||||||||||||||
| Asset and mortgage-backed securities | $ | Recent transaction | Transaction price | NA | ||||||||||||||||||||||
| Asset and mortgage-backed securities | Discounted cash flow | Discount rate | ||||||||||||||||||||||||
| Corporate | Discounted cash flow | Discount rate | ||||||||||||||||||||||||
| Corporate loans | Discounted cash flow | Discount rate | ( | |||||||||||||||||||||||
| Equity securities | Recent transaction | Transaction price | NA | |||||||||||||||||||||||
| Equity securities | Enterprise value | Multiple | ||||||||||||||||||||||||
| Equity securities | Discounted cash flow | Discount rate | ||||||||||||||||||||||||
| Other invested assets | Discounted cash flow | Discount rate | ||||||||||||||||||||||||
| Total — Insurance Solutions | $ | |||||||||||||||||||||||||
| Equity securities of consolidated VIEs | Recent transaction | Transaction price | NA | |||||||||||||||||||||||
| Equity securities of consolidated VIEs | Enterprise value | Multiple | ||||||||||||||||||||||||
| Corporate loans of consolidated VIEs | Recent transaction | Transaction price | NA | |||||||||||||||||||||||
| Corporate loans of consolidated VIEs | Discounted cash flow | Discount rate | ||||||||||||||||||||||||
| Total assets of consolidated VIEs - Insurance Solutions | ||||||||||||||||||||||||||
| Total financial assets including consolidated VIEs - Insurance Solutions | ||||||||||||||||||||||||||
| Total financial assets | ||||||||||||||||||||||||||
| Financial liabilities | ||||||||||||||||||||||||||
| Asset Management | ||||||||||||||||||||||||||
| Debt obligations | $ | Enterprise valuation | Revenue multiple | Not Meaningful (NA) | ||||||||||||||||||||||
| Enterprise valuation | EBITDA | Not Meaningful (NA) | ||||||||||||||||||||||||
| Income approach | Required rate of return | Not Meaningful (NA) | ||||||||||||||||||||||||
| Total financial liabilities - Asset Management | $ | |||||||||||||||||||||||||
| Total financial liabilities | $ | |||||||||||||||||||||||||
_______________
(1)For debt securities where the recent transaction price does not estimate fair value, the Company determines the fair value utilizing a yield analysis.
F-116
| Quantitative Information about Level 3 Fair Value Measurements | ||||||||||||||||||||||||||
| December 31, 2024 | Fair value | Valuation technique/ methodology | Unobservable input | Range (weighted average) | ||||||||||||||||||||||
| Financial assets | ||||||||||||||||||||||||||
| Asset Management | ||||||||||||||||||||||||||
| Equity securities | $ | Discounted cash flow | Discount rate | |||||||||||||||||||||||
| Equity securities | Enterprise value | Multiple | ||||||||||||||||||||||||
| Total — Asset Management | $ | |||||||||||||||||||||||||
| Insurance Solutions | ||||||||||||||||||||||||||
| Debt securities¹: | ||||||||||||||||||||||||||
| Asset and mortgage-backed securities | $ | Recent transaction | Transaction price | NA | ||||||||||||||||||||||
| Asset and mortgage-backed securities | Discounted cash flow | Discount rate | ||||||||||||||||||||||||
| Corporate loans | Discounted cash flow | Discount rate | ||||||||||||||||||||||||
| Corporate loans | Enterprise value | Multiple | ||||||||||||||||||||||||
| Equity securities | Discounted cash flow | Discount rate | ||||||||||||||||||||||||
| Other invested assets | Discounted cash flow | Discount rate | ||||||||||||||||||||||||
| Total — Insurance Solutions | ||||||||||||||||||||||||||
| Equity securities of consolidated VIEs | Discounted cash flow | Discount rate | ||||||||||||||||||||||||
| Corporate loans of consolidated VIEs | Recent transaction | Transaction price | NA | |||||||||||||||||||||||
| Corporate loans of consolidated VIEs | Discounted cash flow | Discount rate | ||||||||||||||||||||||||
| Total assets of consolidated VIEs - Insurance Solutions | $ | |||||||||||||||||||||||||
| Total financial assets including consolidated VIEs - Insurance Solutions | ||||||||||||||||||||||||||
| Total investments | $ | |||||||||||||||||||||||||
| Financial liabilities | ||||||||||||||||||||||||||
| Asset Management | ||||||||||||||||||||||||||
| Debt obligation | $ | Enterprise valuation | Revenue multiple | Not Meaningful (NA) | ||||||||||||||||||||||
| Enterprise valuation | EBITDA | Not Meaningful (NA) | ||||||||||||||||||||||||
| Income Approach | Required rate of return | Not Meaningful (NA) | ||||||||||||||||||||||||
| Total financial liabilities - Asset Management | $ | |||||||||||||||||||||||||
| Total financial liabilities | $ | |||||||||||||||||||||||||
_______________
The Company typically determines the fair value of its performing Level 3 debt investments utilizing a yield analysis. In a yield analysis, a price is ascribed for each investment based upon an assessment of current and expected market yields for similar investments and risk profiles. Additional consideration is given to the expected life, portfolio company performance since close, and other terms and risks associated with an investment. Among other factors, a determinant of risk is the amount of leverage used by the portfolio company relative to the total enterprise value of the company, and the rights and remedies of the Company’s investment within each portfolio company’s capital structure.
Significant unobservable inputs include an illiquidity spread as well as a credit spread, both of which increase the discount rate. These rates are initially set at a level such that the loan valuation equals the initial purchase cost of the loan and are subsequently adjusted at each valuation date to reflect management’s current assessment of market conditions as well as of loan-specific credit and illiquidity risk. Discount rates are subject to adjustment based on both management’s current assessment of market conditions and the economic performance of individual investments. The significant unobservable inputs used in the fair value measurement of the Company’s Level 3 debt securities primarily include current market yields, including relevant market indices, but may also include quotes from brokers, dealers, and pricing services as indicated by comparable investments.
F-117
Financial instruments not carried at fair value
The following tables present carrying amounts and fair values of the Company’s financial assets and liabilities which are not carried at fair value as of September 30, 2025 and December 31, 2024:
| Fair Value Hierarchy | ||||||||||||||||||||||||||||||||
| September 30, 2025 | Carrying value | Fair value | Level 1 | Level 2 | Level 3 | |||||||||||||||||||||||||||
| Financial Assets | ||||||||||||||||||||||||||||||||
| Asset Management | ||||||||||||||||||||||||||||||||
| Corporate loans | $ | $ | $ | — | $ | — | $ | |||||||||||||||||||||||||
| Total financial assets — Asset Management | $ | $ | $ | — | $ | — | $ | |||||||||||||||||||||||||
| Insurance Solutions | ||||||||||||||||||||||||||||||||
| Mortgage loans | $ | $ | $ | — | $ | — | $ | |||||||||||||||||||||||||
| Other invested assets | — | — | ||||||||||||||||||||||||||||||
| Total financial assets — Insurance Solutions | $ | $ | $ | — | $ | — | $ | |||||||||||||||||||||||||
| Total financial assets | $ | $ | $ | — | $ | — | $ | |||||||||||||||||||||||||
| Financial Liabilities | ||||||||||||||||||||||||||||||||
| Asset Management | ||||||||||||||||||||||||||||||||
| Debt obligations | $ | $ | $ | — | $ | — | $ | |||||||||||||||||||||||||
| Total financial liabilities — Asset Management | $ | $ | $ | — | $ | — | $ | |||||||||||||||||||||||||
| Insurance Solutions | ||||||||||||||||||||||||||||||||
| Debt obligations | $ | $ | $ | — | $ | — | $ | |||||||||||||||||||||||||
| Interest sensitive contract liabilities | — | — | ||||||||||||||||||||||||||||||
| Total financial liabilities —Insurance Solutions | $ | $ | $ | — | $ | $ | ||||||||||||||||||||||||||
| Total financial liabilities | $ | $ | $ | — | $ | $ | ||||||||||||||||||||||||||
| Fair Value Hierarchy | ||||||||||||||||||||||||||||||||
| December 31, 2024 | Carrying value | Fair value | Level 1 | Level 2 | Level 3 | |||||||||||||||||||||||||||
| Financial Assets | ||||||||||||||||||||||||||||||||
| Asset Management | ||||||||||||||||||||||||||||||||
| Corporate loans | $ | $ | $ | — | $ | — | $ | |||||||||||||||||||||||||
| Total financial assets — Asset Management | $ | $ | $ | — | $ | — | $ | |||||||||||||||||||||||||
| Insurance Solutions | ||||||||||||||||||||||||||||||||
| Mortgage loans | $ | $ | $ | — | $ | — | $ | |||||||||||||||||||||||||
| Other invested assets | — | — | ||||||||||||||||||||||||||||||
| Total financial assets — Insurance Solutions | $ | $ | $ | — | $ | — | $ | |||||||||||||||||||||||||
| Total financial assets | $ | $ | $ | — | $ | — | $ | |||||||||||||||||||||||||
| Financial Liabilities | ||||||||||||||||||||||||||||||||
| Asset Management | ||||||||||||||||||||||||||||||||
| Debt obligations | $ | $ | $ | — | $ | — | $ | |||||||||||||||||||||||||
| Total financial liabilities — Asset Management | $ | $ | $ | — | $ | — | $ | |||||||||||||||||||||||||
| Insurance Solutions | ||||||||||||||||||||||||||||||||
| Debt obligations | — | — | ||||||||||||||||||||||||||||||
| Interest sensitive contract liabilities | — | — | ||||||||||||||||||||||||||||||
| Total financial liabilities —Insurance Solutions | $ | $ | $ | — | $ | $ | ||||||||||||||||||||||||||
| Total financial liabilities | $ | $ | $ | — | $ | $ | ||||||||||||||||||||||||||
F-118
Fair value option
The following table presents the net realized and unrealized gains (losses) on financial instruments for which the FVO was elected:
| For the Three Months Ended September 30, | 2025 | 2024 | ||||||||||||||||||||||||||||||||||||
| Net realized gains (losses) | Net unrealized gains (losses) | Total | Net realized gains (losses) | Net unrealized gains (losses) | Total | |||||||||||||||||||||||||||||||||
| Asset Management | ||||||||||||||||||||||||||||||||||||||
| Debt obligation | $ | — | $ | $ | $ | — | $ | $ | ||||||||||||||||||||||||||||||
| Net gains (losses) from investment activities — Asset Management | $ | — | $ | $ | $ | — | $ | $ | ||||||||||||||||||||||||||||||
| Insurance Solutions | ||||||||||||||||||||||||||||||||||||||
| Debt securities: | ||||||||||||||||||||||||||||||||||||||
| U.S. government and agency | $ | — | $ | — | $ | — | $ | — | $ | — | $ | — | ||||||||||||||||||||||||||
| U.S. state, territories and municipalities | $ | — | $ | $ | $ | — | $ | $ | ||||||||||||||||||||||||||||||
| Other government and agency | $ | — | $ | $ | $ | — | $ | $ | ||||||||||||||||||||||||||||||
| Corporate | $ | ( | $ | $ | $ | — | $ | $ | ||||||||||||||||||||||||||||||
| Asset and mortgage- backed securities | $ | ( | $ | $ | $ | $ | ( | $ | ( | |||||||||||||||||||||||||||||
| Corporate loans | $ | $ | ( | $ | ( | $ | $ | ( | $ | ( | ||||||||||||||||||||||||||||
| Mortgage loans | $ | — | $ | — | $ | — | $ | — | $ | — | $ | — | ||||||||||||||||||||||||||
| Equity securities | $ | — | $ | — | $ | — | $ | — | $ | — | $ | — | ||||||||||||||||||||||||||
| Other invested assets | $ | — | $ | — | $ | — | $ | $ | $ | |||||||||||||||||||||||||||||
| Net gains (losses) from investment activities — Insurance Solutions | $ | ( | $ | $ | $ | $ | $ | |||||||||||||||||||||||||||||||
| Investments of consolidated VIEs | $ | $ | ( | $ | ( | $ | $ | ( | $ | ( | ||||||||||||||||||||||||||||
| Net gains (losses) from investment activities — Insurance Solutions including consolidated VIEs | $ | ( | $ | $ | $ | $ | $ | |||||||||||||||||||||||||||||||
F-119
| For the Nine Months Ended September 30, | 2025 | 2024 | ||||||||||||||||||||||||||||||||||||
| Net realized gains (losses) | Net unrealized gains (losses) | Total | Net realized gains (losses) | Net unrealized gains (losses) | Total | |||||||||||||||||||||||||||||||||
| Asset Management | ||||||||||||||||||||||||||||||||||||||
| Debt obligation | $ | — | $ | $ | $ | — | $ | $ | ||||||||||||||||||||||||||||||
| Net gains (losses) from investment activities — Asset Management | $ | — | $ | $ | $ | — | $ | $ | ||||||||||||||||||||||||||||||
| Insurance Solutions | ||||||||||||||||||||||||||||||||||||||
| Debt securities: | ||||||||||||||||||||||||||||||||||||||
| U.S. government and agency | $ | — | $ | — | $ | — | $ | — | $ | — | $ | — | ||||||||||||||||||||||||||
| U.S. state, territories and municipalities | $ | — | $ | $ | $ | — | $ | $ | ||||||||||||||||||||||||||||||
| Other government and agency | $ | — | $ | $ | $ | — | $ | $ | ||||||||||||||||||||||||||||||
| Corporate | $ | ( | $ | $ | $ | — | $ | $ | ||||||||||||||||||||||||||||||
| Asset and mortgage- backed securities | $ | ( | $ | $ | ( | $ | $ | $ | ||||||||||||||||||||||||||||||
| Corporate loans | $ | $ | $ | $ | $ | ( | $ | ( | ||||||||||||||||||||||||||||||
| Mortgage loans | $ | — | $ | — | $ | — | $ | — | $ | — | $ | — | ||||||||||||||||||||||||||
| Equity securities | $ | — | $ | — | $ | — | $ | — | $ | — | $ | — | ||||||||||||||||||||||||||
| Other invested assets | $ | ( | $ | $ | $ | $ | ( | $ | ( | |||||||||||||||||||||||||||||
| Net gains (losses) from investment activities — Insurance Solutions | $ | ( | $ | $ | $ | $ | $ | |||||||||||||||||||||||||||||||
| Investments of consolidated VIEs | $ | $ | ( | $ | ( | $ | $ | ( | $ | ( | ||||||||||||||||||||||||||||
| Net gains (losses) from investment activities — Insurance Solutions including consolidated VIEs | $ | ( | $ | $ | $ | $ | $ | |||||||||||||||||||||||||||||||
F-120
The following table presents information for loans which the Company elected the FVO.
| September 30, 2025 | Unpaid Principal Balance | Mark to Fair Value | Fair Value | |||||||||||||||||
| Insurance Solutions | ||||||||||||||||||||
| Corporate loans | $ | $ | ( | $ | ||||||||||||||||
| Other invested assets | ||||||||||||||||||||
| Insurance Solutions | $ | $ | ( | $ | ||||||||||||||||
| Corporate loans of consolidated VIEs | ( | |||||||||||||||||||
| Insurance Solutions including consolidated VIEs | $ | $ | ( | $ | ||||||||||||||||
| December 31, 2024 | Unpaid Principal Balance | Mark to Fair Value | Fair Value | |||||||||||||||||
| Insurance Solutions | ||||||||||||||||||||
| Corporate loans | $ | $ | ( | $ | ||||||||||||||||
| Other invested assets | ( | |||||||||||||||||||
| Insurance Solutions | $ | $ | ( | $ | ||||||||||||||||
| Corporate loans of consolidated VIEs | ( | |||||||||||||||||||
| Insurance Solutions including consolidated VIEs | $ | $ | ( | $ | ||||||||||||||||
As of September 30, 2025 and December 31, 2024, there were no loans accounted for at fair value under the FVO which were 90 days or more past-due or in non-accrual status.
The following table presents the estimated amount of gains (losses) included in earnings attributable to changes in instrument-specific credit risk on corporate loans for which the Company elected the FVO.
| For the Nine Months Ended September 30, | 2025 | 2024 | ||||||||||||
| Insurance Solutions | ||||||||||||||
| Corporate loans | $ | $ | ( | |||||||||||
| Other invested assets | ( | |||||||||||||
| Insurance Solutions | $ | $ | ( | |||||||||||
| Corporate loans of consolidated VIEs | ( | ( | ||||||||||||
| Insurance Solutions including consolidated VIEs | $ | $ | ( | |||||||||||
The portion of gains and losses attributable to changes in instrument-specific credit risk is estimated by identifying loans with changes in credit ratings meeting certain criteria.
Note 10. Revenue from service contracts
The following table summarizes the Company’s revenue from service contracts for Asset Management:
| Three Months Ended September 30, | Nine Months Ended September 30, | ||||||||||||||||||||||
| 2025 | 2024 | 2025 | 2024 | ||||||||||||||||||||
| Management fees | $ | $ | $ | $ | |||||||||||||||||||
| Incentive fees | |||||||||||||||||||||||
Servicing fees (expense)¹ | ( | ( | ( | ( | |||||||||||||||||||
| Performance allocation | |||||||||||||||||||||||
F-121
_______________
Note 11. Goodwill and intangible assets
Goodwill
The carrying amount of goodwill by reportable segment was $1.0 55.7
Intangible assets
Intangible assets consist of the following as of September 30, 2025 and December 31, 2024:
| September 30, 2025 | ||||||||||||||||||||||||||
| Gross carrying amount | Accumulated amortization | Accumulated impairment | Net carrying amount | |||||||||||||||||||||||
| Asset Management | ||||||||||||||||||||||||||
| Intangible assets — indefinite life | ||||||||||||||||||||||||||
| Investment management contracts | $ | $ | — | $ | ( | $ | ||||||||||||||||||||
| Profit sharing interest¹ | $ | $ | — | $ | ||||||||||||||||||||||
| Intangible assets — definite life | ||||||||||||||||||||||||||
| Investment management contracts | ( | — | ||||||||||||||||||||||||
| Total intangible assets — Asset Management | $ | $ | ( | $ | ( | $ | ||||||||||||||||||||
| Insurance Solutions | ||||||||||||||||||||||||||
| Intangible assets — indefinite life | ||||||||||||||||||||||||||
| State insurance licenses | $ | $ | — | $ | — | $ | ||||||||||||||||||||
| Total intangible assets — Insurance Solutions | $ | $ | — | $ | — | $ | ||||||||||||||||||||
_______________
(1)On July 15, 2025, the merging of Logan Ridge Finance Corporation (“Logan Ridge”) into Portman Ridge Finance Corporation (“Portman Ridge” or “Portman”) closed, with the new combined entity renamed to BCP Investment Corporation (“BCIC”). Upon the close of this merger, the Company’s investment management agreement with Logan Ridge was terminated, resulting in an impairment loss for the full carrying amount of the investment management agreement. Upon termination of the investment management agreement with Logan Ridge, the Company acquired a profit-sharing agreement with the owner of Sierra Crest Investment Management (“SCIM”) which is the manager of BCIC, for no cash consideration. The acquisition of the profit-sharing agreement is presented as a gain that offsets the accumulated impairment loss on the Logan Ridge investment management agreement, in “Amortization and impairment of intangible assets” on the Condensed Consolidated Statements of Operations. The profit-sharing agreement was determined to be an indefinte-lived intangible asset given the Company expects SCIM to be the investment manager of BCIC indefinitely, and for the owner of SCIM to hold its equity in SCIM indefnitely.
F-122
| December 31, 2024 | ||||||||||||||||||||||||||
| Gross carrying amount | Accumulated amortization | Accumulated impairment | Net carrying amount | |||||||||||||||||||||||
| Asset Management | ||||||||||||||||||||||||||
| Intangible assets — indefinite life | ||||||||||||||||||||||||||
| Investment management contracts | $ | $ | — | $ | — | $ | ||||||||||||||||||||
| Intangible assets — definite life | ||||||||||||||||||||||||||
| Investment management contracts | ( | ( | ||||||||||||||||||||||||
| Total intangible assets — Asset Management | $ | $ | ( | $ | ( | $ | ||||||||||||||||||||
| Insurance Solutions | ||||||||||||||||||||||||||
| Intangible assets — indefinite life | ||||||||||||||||||||||||||
| State insurance licenses | — | — | ||||||||||||||||||||||||
| Total intangible assets — Insurance Solutions | $ | $ | — | $ | — | $ | ||||||||||||||||||||
The following table represents estimated intangible amortization expense as of September 30, 2025:
| As of | September 30, 2025 | |||||||
| Remainder of 2025 | $ | |||||||
| 2026 | ||||||||
| 2027 | ||||||||
| 2028 | ||||||||
| 2029 | ||||||||
| 2030 and thereafter | ||||||||
| Total | $ | |||||||
Note 12. Debt obligations
Asset Management
MLC US Holdings Credit Facility
On August 20, 2021, MLC US Holdings entered into a credit facility with a large US-based asset manager, as administrative agent and collateral agent for the lenders, whereby MLC US Holdings may borrow up to $25.0 million by December 31, 2021 (the “MLC US Holdings Credit Facility”). On September 19, 2022, MLC US Holdings entered into an amendment to its existing credit agreement to increase the term loan available thereunder by $4.5 million. The primary use of the proceeds from the amendment was to seed Opportunistic Credit Interval Fund (“OCIF”), an interval fund managed by ML Management. On May 2, 2023, MLC US Holdings entered into an amendment to the MLC US Holdings Credit Facility to increase the term loan available thereunder by an additional $4.5 million. The primary use of the proceeds from the May 2023 amendment was to finance the acquisition of Ovation on July 5, 2023, and other related fees and expenses. On December 17, 2024, MLC US Holdings entered into an amendment its existing credit agreement to upsize the facility thereunder by approximately $13.0 million to support key business initiatives as well as for general corporate purposes and paying related transaction fees and expenses. The MLC US Holdings Credit Facility matures on August 20, 2027.
Amounts drawn under the MLC US Holdings Credit Facility initially bore interest at London Interbank Offer Rate (“LIBOR”) plus a spread of 7.50 %. The benchmark, LIBOR, was replaced by the secured overnight financing rate (“SOFR”) upon the transition from LIBOR on May 2, 2023. Upon the most recent amendment to the MLC US Holdings Credit Facility, the credit facility bears interest based on a pricing step-down mechanism as the
F-123
business continues to perform, which is expected to reduce the Company's cost of debt over time. Payments of principal and interest are made on each payment date, with the remaining principal outstanding and accrued but unpaid interest payable on August 20, 2027. The MLC US Holdings Credit Facility is collateralized by assets held by MLC US Holdings. The Company is a guarantor of the MLC US Holdings Credit Facility.
The December 2024 amendment to the MLC US Holdings Credit Facility was treated as a debt modification as the instruments were not substantially different since the present value of the cash flows of the modified debt were less than 10 percent different from the present value of the remaining cash flows of the original debt. In December 2024, costs paid to the lenders of $0.4 million were capitalized and included an original issuance discount (“OID”) and are amortized through interest expense.
On September 12, 2025, MLC US Holdings entered into a Limited Waiver and Amendment No. 5 to its Credit Agreement. The lenders waived a specified event of default arising from MLC US Holdings’ failure to satisfy the Interest Expense Coverage Ratio for the fiscal quarter ended June 30, 2025, and certain terms of the Credit Agreement were amended, including updates to defined terms and covenant calibration (such as schedules for the net leverage and interest coverage ratios and related EBITDA adjustments for the quarter ending September 30, 2025). The amendment also provided for an amendment fee equal to 0.25 % of the aggregate principal amount of loans outstanding immediately prior to effectiveness.
Following the waiver and amendment, the Company remained in compliance with all debt covenants for all periods presented.
Seller notes
On July 1, 2021, the Company completed the acquisition of the management contract for the investment company, Logan Ridge Finance Corporation (“Logan Ridge”), from Capitala Investment Advisors, LLC (“CIA”), through, in part, the issuance of an unsecured promissory note of $4.0 million, which bears no interest and was initially payable by July 1, 2025 but on June 30, 2025 was extended until November 1, 2025. The repayment amount on the maturity date will be adjusted on the initial maturity date to reflect the performance of the investment portfolio of Logan Ridge since closing and shall not be less than $nil or more than $6.0 million. The Company elected to account for this note under the FVO, and remeasures the note to fair value each reporting period, with changes in fair value recognized in earnings.
On October 29, 2021, the Company completed the Ability Acquisition through in part the issuance of an unsecured promissory note of $15.0 million, which bears interest at 5.0 % per annum and is payable by October 29, 2031.
Promissory note
On January 29, 2024, the Company raised $18.8 million of debt through the issuance of 18,752 Debenture Units on a non-brokered private placement basis (the “Debenture Unit Offering”). Each Debenture Unit consists of: (i) one 8.85 % paid-in-kind unsecured debenture of the Company, with a principal amount of $1,000 and a maturity date that is eight (8 ) years from the issuance thereof, and (ii) 50 common share purchase warrants of the Company, each of which was exercisable to acquire one common share of the Company at a price of C$2.75 Canadian Dollars (“CAD” or “C$”) per share for a period of eight (8 ) years, from the issuance thereof, provided that the warrants were not permitted to be exercised within the first twelve (12 ) months from the issuance thereof. Following the completion of the Business Combination with TURN, every 4.22 Debenture Warrants entitled the holder to receive, upon exercise, one share of the Company at a price of C$11.61 per share (as adjusted for the Business Combination in accordance with the provisions of a warrant indenture dated as of January 26, 2024, as supplemented by a supplemental warrant indenture dated September 12, 2025 between the Company, Legacy Mount Logan and Odyssey Trust Company).
F-124
Debt obligations consisted of the following as of September 30, 2025 and December 31, 2024:
| As of September 30, 2025 | Maturity date | Stated interest rate | Effective interest rate | Extension options | Total facility | Outstanding balance | ||||||||||||||||||||||||||||||||
Seller note — Capitala Acquisition¹ | November 2025 | — | — | % | N/A | $ | $ | |||||||||||||||||||||||||||||||
MLC US Holdings Credit Facility² | August 2027 | SOFR + | % | N/A | ||||||||||||||||||||||||||||||||||
| Seller note — Ability Acquisition | October 2031 | % | % | N/A | ||||||||||||||||||||||||||||||||||
Debenture units³ | January 2032 | % | % | N/A | ||||||||||||||||||||||||||||||||||
| Total debt | $ | $ | ||||||||||||||||||||||||||||||||||||
_______________
(1)The Company elected FVO for the Seller note – Capitala Acquisition. The following balance represents the fair value of the note as of September 30, 2025.
(2)The MLC US Holdings Credit Facility is secured by all assets and interests in assets and proceeds owned and acquired by MLC US Holdings.
(3)The warrants issued with the Debenture Units are recorded in equity at fair value upon issuance and therefore are not required to be subsequently remeasured at fair value on an ongoing basis.
| As of December 31, 2024 | Maturity date | Stated interest rate | Effective interest rate | Extension options | Total facility | Outstanding balance | |||||||||||||||||||||||||||||
Seller note — Capitala Acquisition¹ | July 2025 | — | 0 | N/A | $ | $ | |||||||||||||||||||||||||||||
MLC US Holdings Credit Facility² | August 2027 | SOFR + | % | N/A | |||||||||||||||||||||||||||||||
| Seller note — Ability Acquisition | October 2031 | % | % | N/A | |||||||||||||||||||||||||||||||
Debenture units³ | January 2032 | % | % | N/A | |||||||||||||||||||||||||||||||
| Total debt | $ | $ | |||||||||||||||||||||||||||||||||
_______________
(1)The Company elected FVO for the Seller note – Capitala Acquisition. The following balance represents the fair value of the note as of December 31, 2024.
(2)The MLC US Holdings Credit Facility is secured by all assets and interests in assets and proceeds owned and acquired by MLC US Holdings.
(3)The warrants issued with the Debenture Units are recorded in equity at fair value upon issuance and therefore are not required to be subsequently remeasured at fair value on an ongoing basis.
The scheduled principal repayments are as follows:
| As of | September 30, 2025 | |||||||
| Remainder of 2025 | $ | |||||||
| 2026 | ||||||||
| 2027 | ||||||||
| 2028 | ||||||||
| 2029 | ||||||||
| 2030 and thereafter | ||||||||
| Transaction costs (net of amortization) | ( | |||||||
| Total debt | $ | |||||||
F-125
For the three months ended September 30, 2025, interest expense, including the amortization of debt issuance costs and PIK interest, was $2.0 million (September 30, 2024 – $1.7 million), For the nine months ended September 30, 2025, interest expense, including the amortization of debt issuance costs and PIK interest, was $5.9 million (September 30, 2024 – $5.0 million).
Insurance Solutions
Debt obligations
Ability has the following surplus notes outstanding as of September 30, 2025 and December 31, 2024:
| As of September 30, 2025 | Date issued | Date of maturity | Interest rate | Par value | Carrying value of note | |||||||||||||||||||||||||||
| Sentinel Security Life Insurance Company | February 2013 | June 2028 | % | $ | $ | |||||||||||||||||||||||||||
| Pavonia Life Insurance Company of Michigan | August, 2023 | December, 2032 | % | |||||||||||||||||||||||||||||
| Atlantic Coast Life Insurance Company | March, 2025 | March, 2033 | SOFR+ | |||||||||||||||||||||||||||||
| Total surplus notes | $ | $ | ||||||||||||||||||||||||||||||
| As of December 31, 2024 | Date issued | Date of maturity | Interest rate | Par value | Carrying value of note | |||||||||||||||||||||||||||
| Sentinel Security Life Insurance Company | February, 2013 | June, 2028 | % | $ | $ | |||||||||||||||||||||||||||
| Pavonia Life Insurance Company of Michigan | August, 2023 | December, 2032 | % | |||||||||||||||||||||||||||||
| Total surplus notes | $ | $ | ||||||||||||||||||||||||||||||
For the nine months ended September 30, 2025, interest paid was $1.0 million (September 30, 2024 - $1.0 million).
Refer to Note 9. Fair value measurements for fair value of financial liabilities carried at amortized cost.
The surplus notes are subordinated in right of payment of all indebtedness, policy claims, and other creditor claims. The note issued to Sentinel Security Life Insurance Company (“SSL”) had an initial maturity date of June 12, 2023; however, in the second quarter of 2023, Ability renewed the note, extending the date of maturity to June 12, 2028. On August 30, 2023, Ability, completed a private offering of $12.0 million aggregate principal amount of 10.0 % Surplus Notes due December 2032. On March 31, 2025, Ability, completed another private offering for an aggregate of $3.0 million principal amount of SOFR+6 % Surplus Notes with interest and principal due and payable on March 31, 2033. Payments of interest or principal shall be paid only if Ability has the required levels of statutory surplus and upon prior authorization by the Director of the Nebraska Department of Insurance.
F-126
Note 13. Deferred acquisition costs
Information regarding total deferred acquisition costs (“DAC”) for September 30, 2025 and September 30, 2024:
| For the Nine Months Ended September 30, 2025 | ||||||||||||||||||||||||||
| Beginning Balance | Capitalization | Amortization | Ending Balance | |||||||||||||||||||||||
| DAC: | ||||||||||||||||||||||||||
| MYGA | $ | $ | $ | ( | $ | |||||||||||||||||||||
| For the Nine Months Ended September 30, 2024 | ||||||||||||||||||||||||||
| Beginning Balance | Capitalization | Amortization | Ending Balance | |||||||||||||||||||||||
| DAC: | ||||||||||||||||||||||||||
| MYGA | $ | $ | $ | ( | $ | |||||||||||||||||||||
Significant methodologies and assumptions
The Company amortizes DAC related to long-duration contracts on a straight-line basis, at the individual level over the expected term of the related contract.
The amortization expense for DAC is included in the Amortization of deferred acquisition costs in the Condensed Consolidated Statements of Operations. The estimated future amortization expense related to DAC for the future years is as follows:
| As of | September 30, 2025 | |||||||
| Remainder of 2025 | $ | |||||||
| 2026 | ||||||||
| 2027 | ||||||||
| 2028 | ||||||||
| 2029 | ||||||||
| 2030 and thereafter | ||||||||
| Total | $ | |||||||
F-127
Note 14. Future policy benefits and related reinsurance recoverable
Future policy benefits comprise substantially all obligations to insureds in the Company’s insurance operations. A summary of future policy benefits and reinsurance recoverable are presented below.
| As of | September 30, 2025 | December 31, 2024 | ||||||||||||
| Reinsurance recoverable | ||||||||||||||
| Long term care reinsurance | $ | $ | ||||||||||||
| Other | ||||||||||||||
Modco investments Vista¹ | ( | ( | ||||||||||||
| Total reinsurance recoverable | $ | $ | ||||||||||||
| Future policy benefits | ||||||||||||||
| Long term care insurance | $ | $ | ||||||||||||
| Other | ||||||||||||||
| Total future policy benefits | $ | $ | ||||||||||||
| Funds held under reinsurance contracts | ||||||||||||||
Funds held arrangement Front Street Re¹ | $ | $ | ||||||||||||
_______________
(1)The Company has a coinsurance or Modco with funds withheld arrangement with its two reinsurers. The Modco agreement with Vista Re dictates that the assets held as collateral are held with the legal right of offset to the related insurance contract liabilities. Therefore, the collateral held for this agreement is netted against the reserves under this contract. The agreement with Front Street Re does not have the legal right of offset therefore the reserves are not presented net of the collateral held, instead they are in the line item “Funds held under reinsurance contracts” in the Condensed Consolidated Statements of Financial Position.
F-128
The following tables summarize balances of and changes in future policy benefits reserves:
| Nine months ended September 30, | ||||||||||||||
| Long-term care | 2025 | 2024 | ||||||||||||
| Present value of expected net premiums | ||||||||||||||
| Balance, beginning of year | $ | $ | ||||||||||||
| Beginning balance at locked-in discount rate | $ | $ | ||||||||||||
| Change in effect in cashflow assumptions | ||||||||||||||
| Effect of actual variances from expected experience | ( | ( | ||||||||||||
| Adjusted balance | ||||||||||||||
| Interest accrual | ||||||||||||||
| Net premiums collected | ( | ( | ||||||||||||
| Effect of foreign currency | ||||||||||||||
| Ending balance at locked-in discount rate | ||||||||||||||
| Effect of changes in discount rate assumptions | ( | ( | ||||||||||||
| Balance, end of year | $ | $ | ||||||||||||
| Present value of Expected Future Policy Benefits | ||||||||||||||
| Balance, beginning of year | $ | $ | ||||||||||||
| Beginning balance at locked-in discount rate | $ | $ | ||||||||||||
| Change in effect in cashflow assumptions | ||||||||||||||
| Effect of actual variances from expected experience | ||||||||||||||
| Adjusted balance | ||||||||||||||
| Interest accrual | ||||||||||||||
| Benefit payments | ( | ( | ||||||||||||
| Ending balance at locked-in discount rate | $ | $ | ||||||||||||
| Effect of changes in discount rate assumptions | ( | ( | ||||||||||||
| Balance, end of year | $ | $ | ||||||||||||
Net future policy benefit reserves ¹ | $ | $ | ||||||||||||
Less: Reinsurance recoverables, net of allowance for credit losses ² | ( | ( | ||||||||||||
| Net future policy benefit reserves, after reinsurance recoverables | $ | $ | ||||||||||||
_______________
(1)Net future policy benefit reserves excludes $4.4 100
(2)Reinsurance recoverables, net of allowance for credit losses excludes $4.4
In the first nine months of 2025, the underlying cash flow assumptions remained unchanged. The effect of actual variances from expected experience observed a $14 million increase in the liability for future policy benefits, mainly driven by lower than expected future premium receipts and higher claims.
In the first nine months of 2024, the underlying cash flow assumptions remained unchanged. The effect of actual variances from expected experience observed a $10 million increase in the liability for future policy benefits, mainly driven by lower than expected future premium receipts and higher claims.
F-129
The following tables provides the amount of undiscounted and discounted expected future gross premiums and expected future benefits and expenses for the LTC line of business:
| Nine months ended September 30, | 2025 | 2024 | ||||||||||||||||||||||||
| Long-term care | Undiscounted | Discounted¹ | Undiscounted | Discounted¹ | ||||||||||||||||||||||
| Expected future gross premiums | $ | $ | $ | $ | ||||||||||||||||||||||
| Benefit payments | $ | $ | $ | $ | ||||||||||||||||||||||
_______________
(1)Discount was determined using the current discount rate as of September 30, 2025 and September 30, 2024.
The following table provides the weighted-average durations of and weighted-average interest rates for the liability for future policy benefits:
| Nine months ended September 30, | ||||||||||||||
| Long-term care | 2025 | 2024 | ||||||||||||
| Weighted-average duration of liability (years) at current rate | ||||||||||||||
| Weighted-average duration of liability (years) at original rate | ||||||||||||||
| Weighted-average interest rate at current rate | % | % | ||||||||||||
| Weighted-average interest rate at original rate | % | % | ||||||||||||
Note 15. Interest sensitive contract liabilities
The following table shows the outstanding Interest sensitive contract liabilities which represents the policyholder balances for MYGA product line:
| Nine months ended September 30, | ||||||||||||||
| 2025 | 2024 | |||||||||||||
| Balance, beginning of year | $ | $ | ||||||||||||
| Deposits | ||||||||||||||
| Product charges | ( | ( | ||||||||||||
| Surrenders and withdrawals | ( | ( | ||||||||||||
| Benefit payments | ( | ( | ||||||||||||
| Interest credited | ||||||||||||||
| Balance at September 30, | $ | $ | ||||||||||||
| Weighted-average annual crediting rate | % | % | ||||||||||||
| At period end: | ||||||||||||||
| Cash surrender value | $ | $ | ||||||||||||
| Net amount at risk: | ||||||||||||||
In the event of death ¹ | $ | $ | ||||||||||||
_______________
(1)For benefits that are payable in the event of death, the net amount at risk is generally defined as the current death benefit in excess of the current account balances at the Condensed Consolidated Statements of Financial Position date. It represents the amount of the claim that the Company would incur if death claims were filed on all contracts at the Condensed Consolidated Statements of Financial Position date.
MYGA policyholder account balances totaled $363.3 million and $333.4 million, as of September 30, 2025, and 2024, respectively. Changes in policyholder account balances are primarily attributed to deposits associated with new MYGA policies assumed of $43.0 million and $72.8 million and interest credited of $12.0 million and $11.1 million for the nine months ended September 30, 2025 and September 30, 2024, respectively. These increases were partially offset by surrenders, withdrawals, benefits and product charges of $26.6 million and
F-130
$7.1 million for the nine months ended September 30, 2025 and September 30, 2024, respectively. Interest on policyholder account balances is generally credited at minimum guaranteed rates, primarily between 2 7
Note 16. Reinsurance
The Company enters into reinsurance agreements primarily as a purchaser of reinsurance for its LTC line of business and also as a provider of reinsurance for the LTC and MYGA lines of business. The Company participates in reinsurance activities in order to limit losses, minimize exposure to significant risks and provide additional capacity for future growth.
Under the terms of the reinsurance agreements, the reinsurer agrees to reimburse the Company for the ceded amount in the event a claim is paid. Cessions under reinsurance agreements do not discharge the Company’s obligation as the primary insurer. In the event that reinsurers do not meet their obligations under the terms of the reinsurance agreements, Reinsurance recoverable balances could become uncollectible.
Accounting for reinsurance requires extensive use of assumptions and estimates, particularly related to the future performance of the underlying business and the potential impact of counterparty credit risks.
Reinsurance recoverable
The Company reinsures its business through two reinsurers. The Company monitors ratings and evaluates the financial strength of its reinsurers by analyzing their financial statements. In addition, the reinsurance recoverable balance due from each reinsurer is evaluated as part of the overall monitoring process. Recoverability of reinsurance recoverable balances is evaluated based on these analyses. The Company uses collateral for its reinsurance recoverable with funds withheld accounts. These reinsurance recoverable balances are stated net of allowance for expected credit loss of $0.9 million and $0.8 million at September 30, 2025 and December 31, 2024, respectively. The Company had $459.1 million and $450.2 million of net ceded reinsurance recoverable at September 30, 2025 and December 31, 2024, respectively. The Company had $34.9 million and $31.1 million of unsecured Reinsurance recoverable balances at September 30, 2025 and December 31, 2024, respectively.
The amounts in the Condensed Consolidated Statements of Financial Position include the impact of reinsurance. Information regarding the significant effects of reinsurance was as follows at:
| Long-term care | September 30, 2025 | December 31, 2024 | ||||||||||||
| Reinsurance recoverable | ||||||||||||||
| Medico Insurance Company | $ | $ | ||||||||||||
| Front Street Re | ||||||||||||||
| Vista Life and Casualty Reinsurance Co | ||||||||||||||
| Vista Modco Funds Withheld | ( | ( | ||||||||||||
| Total reinsurance recoverable | $ | $ | ||||||||||||
| Future policy benefits | ||||||||||||||
| Direct | $ | $ | ||||||||||||
| Reinsurance assumed | ||||||||||||||
| Total future policy benefits | $ | $ | ||||||||||||
F-131
The amounts in the Condensed Consolidated Statements of Comprehensive Income (Loss) include the impact of reinsurance. Information regarding the significant effects of reinsurance was as follows:
| Long-term care | ||||||||||||||
| For the three months ended September 30, | 2025 | 2024 | ||||||||||||
| Net premiums | ||||||||||||||
| Direct premiums | $ | $ | ||||||||||||
| Reinsurance assumed | ||||||||||||||
| Reinsurance ceded | ( | ( | ||||||||||||
| Total net premiums | $ | ( | $ | ( | ||||||||||
Net policy benefit and claims (remeasurement gain on policy liabilities of | ||||||||||||||
| Direct | $ | $ | ||||||||||||
| Reinsurance assumed | ||||||||||||||
Reinsurance ceded, net of provision for credit losses ¹ | ( | ( | ||||||||||||
| Total net policyholder benefits and claims | $ | ( | $ | ( | ||||||||||
| Long-term care | ||||||||||||||
| For the Nine months ended September 30, | 2025 | 2024 | ||||||||||||
| Net premiums | ||||||||||||||
| Direct premiums | $ | $ | ||||||||||||
| Reinsurance assumed | ||||||||||||||
| Reinsurance ceded | ( | ( | ||||||||||||
| Total net premiums | $ | ( | $ | ( | ||||||||||
Net policy benefit and claims (remeasurement gain on policy liabilities of | ||||||||||||||
| Direct | $ | $ | ||||||||||||
| Reinsurance assumed | ||||||||||||||
Reinsurance ceded, net of provision for credit losses ¹ | ( | ( | ||||||||||||
| Total net policyholder benefits and claims | $ | ( | $ | ( | ||||||||||
_______________
(1)The provision for credit losses for reinsurance recoverables for the three and nine months ended September 30, 2025 and September 30, 2024 is $(0.1 ) million and $0.1 million, and $0.3 million and $(0.3 ) million , respectively.
F-132
Note 17. Other assets and Accrued expenses and other liabilities
Other assets consist of the following:
| As of | September 30, 2025 | December 31, 2024 | ||||||||||||
| Asset Management | ||||||||||||||
| Management fee receivable - related parties | $ | $ | ||||||||||||
| Incentive fee receivable - related parties | ||||||||||||||
| Deferred tax assets | ||||||||||||||
| Prepaid income taxes | ||||||||||||||
| Accrued interest and dividends receivable | ||||||||||||||
Receivable for investments sold ¹ | ||||||||||||||
| Ovation goodwill | ||||||||||||||
| Operating lease right of use asset | ||||||||||||||
| Deferred offering costs | ||||||||||||||
| Prepaid insurance | ||||||||||||||
| Other - related parties | ||||||||||||||
| Other | ||||||||||||||
| Total other assets — Asset Management | ||||||||||||||
| Insurance Solutions | ||||||||||||||
| Accrued investment income | ||||||||||||||
Receivable for investments sold ¹ | ||||||||||||||
| Guaranty funds on deposit | ||||||||||||||
| Other | ||||||||||||||
| Total other assets — Insurance Solutions | ||||||||||||||
| Interest receivable of consolidated VIEs | ||||||||||||||
| Total other assets — Insurance Solutions including consolidated VIEs | ||||||||||||||
| Total other assets | $ | $ | ||||||||||||
_______________
(1)Represents amounts due from third-parties for investment sales for which a cash settlement has not occurred.
Other liabilities and accrued expenses consist of the following:
| As of | September 30, 2025 | December 31, 2024 | ||||||||||||
| Asset Management | ||||||||||||||
| Operating lease liabilities | $ | $ | ||||||||||||
| Accounts payable and accrued liabilities¹ | ||||||||||||||
| Total accrued expenses and other liabilities — Asset Management | ||||||||||||||
| Insurance Solutions | ||||||||||||||
| Payable for investments purchased² | ||||||||||||||
| Other accrued expenses | ||||||||||||||
| Total accrued expenses and other liabilities — Insurance Solutions | ||||||||||||||
| Total accrued expenses and other liabilities | $ | $ | ||||||||||||
_______________
(1)As part of its acquisition of TURN in connection with the Business Combination on September 12, 2025, the Company acquired benefit plans which TURN historically administered which provide medical and dental insurance for retirees and their spouses who, at the time of their retirement, attained certain years of service at a certain age. As of September 30, 2025, the Company had $0.3 million accumulated post-retirement benefit obligation. These plans were terminated prior to the acquisition date and provide medical benefits to former
F-133
employees who are grandfathered under the plan’s former terms. The net periodic post-retirement benefit cost includes service cost and interest cost on the accumulated post-retirement benefit obligation. Unrecognized actuarial gains and losses will be recognized as net periodic benefit cost within general, administrative and other expenses under the Asset Management segment. Unamortized prior service cost was fully amortized prior to the acquisition date. Refer to Note 3. Business combinations for more information on the Company’s acquisition of TURN.
(2)Represents amounts owed to third-parties for investment purchases for which a cash settlement has not occurred.
Note 18. Income taxes
Current tax is the amount of income tax recoverable (payable) in respect of the taxable loss (profit) for a period. Deferred tax is recognized on temporary differences between the carrying amounts of assets and liabilities for accounting and tax purposes. Deferred income tax assets and liabilities are measured at the tax rates expected to apply when temporary differences reverse. Current and deferred taxes are offset only when they are levied by the same tax authority, on the same entity or group of entities, and when there is a legal right to offset.
Income earned through the Company's foreign subsidiaries is generally taxed in the foreign country in which they operate. Prior to the Domestication (as defined below) of Legacy Mount Logan to the United States (US), Legacy Mount Logan was subject to income taxes in Canada, which included taxes on the income earned through Legacy Mount Logan's controlled US subsidiaries, but a deduction was allowed for certain US taxes paid on such income.
The effective income tax rate reflected in the Condensed Consolidated Statements of Operations varies from the United States and Canadian tax rates of 21.0 percent and 26.5 percent for the three and nine months ended September 30, 2025 (September 30, 2024 – 21.0 percent and 26.5 percent) for the items outlined in the following table.
| Three Months Ended September 30, | Nine Months Ended September 30, | |||||||||||||||||||||||||
| 2025 | 2024 | 2025 | 2024 | |||||||||||||||||||||||
| Income (loss) before taxes | $ | ( | $ | ( | $ | ( | $ | ( | ||||||||||||||||||
| Income tax rate ¹ | % | % | % | % | ||||||||||||||||||||||
| Income tax expense at statutory tax rate | ( | ( | ( | ( | ||||||||||||||||||||||
| State and local income tax expense (benefit) | ( | ( | ||||||||||||||||||||||||
| Permanent differences in tax rate on income not subject to tax | ( | ( | ||||||||||||||||||||||||
No benefit recorded on current-year NOL (domestication) ² | ||||||||||||||||||||||||||
| Deferred tax asset not recognized ³ | ||||||||||||||||||||||||||
| Effect of tax rate of foreign jurisdictions | ( | |||||||||||||||||||||||||
| Foreign accrual property income impact | ( | |||||||||||||||||||||||||
| Other | ( | |||||||||||||||||||||||||
| Income tax expense (benefit) | $ | $ | $ | $ | ||||||||||||||||||||||
_______________
(1)On September 12, 2025, pursuant to a Plan of Domestication, immediately prior to the Mergers, (i) Legacy Mount Logan domesticated from the Province of Ontario, Canada to the State of Delaware, (ii) immediately following step (i), Mount Logan converted to a limited liability company, and (iii) immediately following (ii), Mount Logan made an election to be treated as a corporation for U.S. federal income tax purposes (the “Domestication”). As a result of the Domestication and the completion of the Business Combination, the Company is subject to a statutory tax rate of 21% in the U.S. as compared to the 26.5% statutory Canadian corporate income tax rate applicable to Legacy Mount Logan prior to the Domestication. Although not reflected as a separate item above, the income tax expense at the statutory tax rate for the three months ended September 30, 2025 reflects a $0.4 million adjustment for the change in statutory tax rate.
(2)As a result of the Domestication, the NOL generated in Canada is not expected to provide a future tax benefit as the Company does not anticipate future taxable income or tax due in Canada.
(3)A valuation allowance has been established to offset certain deferred tax assets as the Company determined that it is more likely than not that such deferred tax assets will not be realized.
F-134
Deferred tax assets
The details of income (loss) before income taxes by jurisdiction are as follows:
| Three Months Ended September 30, | Nine Months Ended September 30, | |||||||||||||||||||||||||
| 2025 | 2024 | 2025 | 2024 | |||||||||||||||||||||||
| United States | $ | ( | $ | $ | ( | $ | ||||||||||||||||||||
| Foreign | ( | ( | ( | ( | ||||||||||||||||||||||
| Income (loss) before taxes | $ | ( | $ | ( | $ | ( | $ | ( | ||||||||||||||||||
The details of the income tax provision by jurisdiction for Asset Management are as follows:
| Three Months Ended September 30, | Nine Months Ended September 30, | |||||||||||||||||||||||||
| 2025 | 2024 | 2025 | 2024 | |||||||||||||||||||||||
| Current tax | ||||||||||||||||||||||||||
| United States | $ | ( | $ | $ | $ | |||||||||||||||||||||
| Foreign | ||||||||||||||||||||||||||
| Total current tax | ( | |||||||||||||||||||||||||
| Deferred tax | ||||||||||||||||||||||||||
| United States | ( | ( | ||||||||||||||||||||||||
| Foreign | ||||||||||||||||||||||||||
| Total deferred tax | ( | ( | ||||||||||||||||||||||||
| Income tax expense (benefit) — Asset Management | $ | $ | $ | $ | ||||||||||||||||||||||
Deferred tax assets and liabilities consists of the following temporary differences:
| September 30, 2025 | December 31, 2024 | |||||||||||||
| Assets | ||||||||||||||
| Tax benefit of loss carryforward | $ | $ | ||||||||||||
| Tax benefit of expenditure pools | ||||||||||||||
| Deferred acquisition costs | ||||||||||||||
| Unrealized losses on remeasurement of investments | ||||||||||||||
| Other assets tax value in excess of book value | ||||||||||||||
| Total deferred tax assets | ||||||||||||||
| Valuation allowance | ( | ( | ||||||||||||
| Total deferred tax assets, net of valuation allowance | $ | $ | ||||||||||||
| Liabilities | ||||||||||||||
| Insurance reserves | $ | ( | $ | ( | ||||||||||
| Other | ( | ( | ||||||||||||
| Total deferred tax liabilities | $ | ( | $ | ( | ||||||||||
| Net deferred tax assets | $ | $ | ||||||||||||
F-135
The Company considers its significant tax jurisdictions to include the United States and before the acquisition of TURN, Canada. The Company remains subject to income tax examination in Canada for years after 2017, and U.S. federal jurisdiction for years after 2020.
On August 16, 2022, the U.S. enacted the Inflation Reduction Act of 2022 (“IRA”) which is generally effective for years beginning after December 31, 2022. Notably, the bill created a 15% corporate alternative minimum tax (“CAMT”) on corporations with three-year average financial statement income over $1 billion. The Internal Revenue Service has issued proposed regulations and multiple interim notices addressing CAMT computations, status determinations, and administrative relief; final regulations are pending. The Company has made certain interpretations and assumptions to comply with CAMT. The Company’s financial statement income is below $1 billion, therefore it is not expected that the Company would have a CAMT liability. If CAMT is paid in the future, the amount would be indefinitely available as a credit carryforward that would reduce tax in future years and would be treated as a temporary item reflected within deferred taxes.
The Company has reviewed and made an assessment of the potential exposure to Pillar Two income taxes. The review was generally based on the most recent information available from tax filings, country-by-country reporting and financial statements, and takes into account known changes in the group and its operations. Based on the review and assessment the Company has concluded that they do not have any potential exposure to Pillar Two income taxes.
Note 19. Equity
Common shares
The number of shares issued and outstanding, earnings per share, additional paid-in capital, dividends paid per share and all references to share quantities of the Company have been retrospectively adjusted to reflect the Company’s existing capital structure post merger with TURN. Refer to Note 3. Business combinations for further detail.
The Company is authorized to issue 150 million common shares, par value $0.001 per share. The common shares are not redeemable or convertible. Dividends are declared by the Company’s Board of Directors (the “Board”) at its discretion. Historically, the board of directors of Legacy Mount Logan has declared dividends on a quarterly basis and the amount could vary from quarter to quarter.
As of September 30, 2025, there were 12,786,792 6,110,449 382,809 shares (net of tax) in respect of vested RSUs (inclusive of Dividend Equivalent Units (“DEUs”)), 4,101 shares in satisfaction of debt obligations owed in connection with the provision of certain consulting services, 637,880 common shares for the minority investment in Runway Growth Capital LLC (“Runway”), 122,308 common shares for the further investment in a Canadian fixed income manager, and 5,666,700 shares for the reverse acquisition of TURN during the nine months ended September 30, 2025. The issuances of these shares occurred for common stock in the Company both pre- and post-Business Combination. Upon the completion of the Business Combination, the outstanding common shares of Legacy Mount Logan were converted into the common shares of the Company. Subsequent to the Business Combination, the Company repurchased 160,637 common shares. The Company issued 15,160 shares (net of tax) in respect of vested RSUs (inclusive of DEUs) during the nine months ended September 30, 2024. There were no other transactions with shareholders for the three and nine months ended September 30, 2025 and 2024.
Preferred shares
The Company is authorized to issue 50 0.001
Dividends
Dividends to the Company's shareholders are recorded on the declaration date. The payment of any cash dividend to shareholders of the Company in the future will be at the discretion of the Board and will depend on,
F-136
among other things, the financial condition, capital requirements and earnings of the Company, and any other factors that the Board may consider relevant.
The following table reflects the distributions declared on the common shares of the Company during the nine months ended September 30, 2025 and September 30, 2024:
| Dividend amount per share | Total dividend amount | |||||||||||||||||||||||||||||||||||||
| Declaration Date | Record Date | Payment Date | CAD | USD ¹ | CAD | USD ¹ | ||||||||||||||||||||||||||||||||
| March 13, 2025 | April 3, 2025 | April 10, 2025 | $ | $ | $ | $ | ||||||||||||||||||||||||||||||||
| May 15, 2025 | May 27, 2025 | June 2, 2025 | ||||||||||||||||||||||||||||||||||||
| August 7, 2025 | August 19, 2025 | August 25, 2025 | ||||||||||||||||||||||||||||||||||||
| $ | $ | |||||||||||||||||||||||||||||||||||||
| Dividend amount per share | Total dividend amount | |||||||||||||||||||||||||||||||||||||
| Declaration Date | Record Date | Payment Date | CAD | USD ¹ | CAD | USD ¹ | ||||||||||||||||||||||||||||||||
| March 13, 2024 | March 25, 2024 | April 2, 2024 | $ | $ | $ | $ | ||||||||||||||||||||||||||||||||
| May 9, 2024 | May 22, 2024 | May 31, 2024 | ||||||||||||||||||||||||||||||||||||
| August 8, 2024 | November 22, 2024 | November 29, 2024 | ||||||||||||||||||||||||||||||||||||
| $ | $ | |||||||||||||||||||||||||||||||||||||
_______________
(1)Dividends were issued and paid in CAD. For reporting purposes, amounts recorded in equity were translated to USD using the daily exchange rate on the date of declaration. Going forward, the Company expects to declare and pay dividends in USD.
Warrants
On October 19, 2018, Legacy Mount Logan announced the completion of a plan of arrangement under the provisions of the Business Corporations Act (Ontario) pursuant to which, among other things, each common share in the capital of Legacy Mount Logan was exchanged for one common share in the capital of the company created pursuant to the arrangement and pursuant to which Legacy Mount Logan changed its name from Marret Resource Corp. to Mount Logan Capital Inc. (the “Arrangement”). Upon closing of the Arrangement and in accordance with the terms of the Arrangement, Legacy Mount Logan issued to shareholders who made an election to acquire warrants under the Arrangement warrants to acquire an aggregate of 20,468,128 6.16 per common share. On September 12, 2025, the Company completed a business combination pursuant to which the businesses of Legacy Mount Logan and 180 Degree Capital Corp., a corporation organized under the laws of the State of New York (“180 Degree Capital”) were combined, and pursuant to which, among other things, each of 180 Degree Capital and Legacy Mount Logan became direct wholly-owned subsidiaries of the Company and each of the issued and outstanding shares of each of 180 Degree Capital and Legacy Mount Logan were cancelled and (other than with respect to certain excluded shares) converted into the right to receive a certain number of shares of the Company’s common stock (the “Business Combination”). Following the completion of the Business Combination, every 33.78 Arrangement Warrants entitled the holder to receive, upon exercise, one common share of the Company at a price of C$26.01 per share. Accordingly, as at September 30, 2025, an aggregate of up to 606,009 shares of the Company were issuable upon the exercise of the 20,468,128 outstanding Arrangement Warrants. The Arrangement Warrants expired on October 19, 2025
Separately on January 26, 2024, Legacy Mount Logan issued 50 common share purchase warrants (each, a “Debenture Warrant”) for each of the 18,752 debenture units that were issued on a non-brokered private placement (refer to Note 12. Debt obligations for further detail). Each Debenture Warrant was exercisable to acquire one common share of Legacy Mount Logan at a price of C$2.75 per share for a period of eight (8 ) years from the issuance thereof, provided that the Debenture Warrants were not exercisable during the first twelve (12 ) months following the issuance. Following the completion of the Business Combination, every 4.22 Debenture Warrants
F-137
entitled the holder to receive, upon exercise, one share of the Company at a price of C$11.61 per share (as adjusted for the Business Combination in accordance with the provisions of a warrant indenture dated as of January 26, 2024, as supplemented by a supplemental warrant indenture dated September 12, 2025 between the Company, Legacy Mount Logan and Odyssey Trust Company). Accordingly, an aggregate of up to 222,079 shares of the Company are issuable upon the exercise of the 937,600 outstanding Debenture Warrants as of September 30, 2025 (December 31, 2024 - 222,079 ).
Accumulated other comprehensive income (loss)
| Unrealized investment gains (losses) on available-for-sale securities | Unrealized gains (losses) on hedging instruments | Remeasurement gains (losses) on future policy benefits related to discount rate | Cumulative translation adjustment | Accumulated other comprehensive income (loss) | ||||||||||||||||||||||||||||
| Balance at December 31, 2024 | $ | ( | $ | ( | $ | $ | ( | $ | ||||||||||||||||||||||||
| Other comprehensive income (loss), before reclassifications | ( | — | ( | |||||||||||||||||||||||||||||
| Less: reclassification adjustments for gains (losses) realized | ( | ( | — | — | ( | |||||||||||||||||||||||||||
| Less: Income tax expense (benefit) | — | — | — | — | ||||||||||||||||||||||||||||
| Balance at September 30, 2025 | $ | ( | $ | $ | $ | ( | $ | |||||||||||||||||||||||||
| Unrealized investment gains (losses) on available-for-sale securities | Unrealized gains (losses) on hedging instruments | Remeasurement gains (losses) on future policy benefits related to discount rate | Cumulative translation adjustment | Accumulated other comprehensive income (loss) | ||||||||||||||||||||||||||||
| Balance at December 31, 2023 | $ | ( | $ | $ | $ | ( | $ | |||||||||||||||||||||||||
| Other comprehensive income (loss), before reclassifications | ( | — | ||||||||||||||||||||||||||||||
| Less: reclassification adjustments for gains (losses) realized | — | — | — | |||||||||||||||||||||||||||||
| Less: Income tax expense (benefit) | — | — | — | — | ||||||||||||||||||||||||||||
| Balance at September 30, 2024 | $ | ( | $ | $ | $ | ( | $ | |||||||||||||||||||||||||
Note 20. Equity based compensation
On May 30, 2019, the Company’s shareholders approved (i) a stock option plan (the “2019 Option Plan”) and (ii) a restricted share unit plan (the “2019 RSU Plan”), which were amended and re-approved by shareholders of the Company on June 7, 2024 to, among other things, increase the rolling limit thereunder from 10 % to 15 % of the common shares then issued and outstanding. Following the approval of Legacy Mount Logan shareholders on August 22, 2025 and the closing of the Business Combination, on November 5, 2025, the Board approved and ratified the 2025 Omnibus Incentive Plan (the “2025 Plan”). The effective date of the 2025 Plan was September 12, 2025 and upon its effectiveness, the 2019 Option Plan and 2019 RSU Plan were terminated and no further awards will be granted under either the 2019 Option Plan or the 2019 RSU Plan.
As of September 30, 2025, no awards have been granted under the 2025 Plan.
There were no nil
Under the 2019 RSU Plan, RSU grants were made in the form of equity-settled awards that typically vest one-third annually beginning one year after the grant date (unless approved otherwise by the Board to vest based on specified terms over a specified period), whereby one vested RSU will be exchanged for one common share. The
F-138
grant date fair value of each equity-settled RSU unit was calculated based on the grant date’s previous day closing price per common share of the Company on Cboe Canada.
The Company awarded 652,135 RSUs with a grant date fair value of $1.2 million during the nine months ended September 30, 2025. The Company awarded 1,435,700 RSUs with a grant date fair value of $2.1 million during the nine months ended September 30, 2024.
For the three months ended September 30, 2025 and 2024, the Company recorded equity-based compensation expense related to RSUs awarded from profit sharing arrangements of $2.1 million and $0.2 million, respectively. For the nine months ended September 30, 2025 and 2024, the Company recorded equity-based compensation expense related to RSUs awarded from profit sharing arrangements of $2.8 million and $0.3 million, respectively. On September 12, 2025, all unvested RSUs were accelerated and fully vested due to the change in control event upon the closing of the Business Combination. As such, as of September 30, 2025, equity-based compensation expense related to RSUs had been fully recognized. The Company elected to account for forfeitures as they occurred. Expense was recognized on a straight-line basis over the life of the award.
A summary of the status of service-vesting awards granted under the RSU Plan for the nine months ended September 30, 2025 is presented below:
| RSUs and DEUs Outstanding | ||||||||||||||||||||||||||||||||
| RSUs | Weighted average grant date fair value | DEUs | Weighted average grant date fair value | Total | ||||||||||||||||||||||||||||
| Unvested balance, January 1, 2025 | $ | $ | ||||||||||||||||||||||||||||||
| Granted | ||||||||||||||||||||||||||||||||
| Vested | ( | ( | ( | |||||||||||||||||||||||||||||
| Forfeitures | ( | ( | ( | |||||||||||||||||||||||||||||
| Unvested balance, September 30, 2025 | $ | $ | ||||||||||||||||||||||||||||||
Note 21. Earnings per share
Basic earnings per share is calculated by dividing net income or loss attributable to common shareholders by the weighted average number of common shares outstanding during the period. Diluted earnings per share is calculated in the same manner, with further adjustments made to reflect the dilutive impact of instruments convertible into the Company’s common shares.
The Company has granted RSUs that provide the right to receive, subject to vesting during continued employment, shares of common stock pursuant to the RSU Plan. Any dividend equivalent paid to an employee on RSUs will be returned to the Company upon forfeiture of the award by the employee. Unvested RSUs that are entitled to forfeitable dividend equivalents do not qualify as participating securities and are excluded in the Company’s basic and diluted earnings per share computations. Vested RSUs qualify as participating securities and are included in the Company’s diluted earnings per share computation.
The Company also has issued warrants which are exercisable to acquire one common share at a defined exercise price.
F-139
The following table sets forth the computation of basic and diluted income (loss) per common share for the three and nine months ended September 30, 2025 and September 30, 2024:
| Three Months Ended September 30, | Nine Months Ended September 30, | |||||||||||||||||||||||||
| 2025 | 2024 | 2025 | 2024 | |||||||||||||||||||||||
| Basic earnings per share | ||||||||||||||||||||||||||
| Net income (loss) | $ | ( | $ | ( | $ | ( | $ | ( | ||||||||||||||||||
| Weighted-average number of common shares outstanding | ||||||||||||||||||||||||||
| Basic earnings per share | $ | ( | $ | ( | $ | ( | $ | ( | ||||||||||||||||||
| Diluted earnings per share | ||||||||||||||||||||||||||
| Net income (loss) | $ | ( | $ | ( | $ | ( | $ | ( | ||||||||||||||||||
| Weighted-average number of common shares outstanding | ||||||||||||||||||||||||||
| Incremental Common Shares | ||||||||||||||||||||||||||
| Assumed exercise of warrants ¹ | ||||||||||||||||||||||||||
| Common shares potentially issuable ² | ||||||||||||||||||||||||||
| Weighted-average number of diluted common shares outstanding | ||||||||||||||||||||||||||
| Diluted earnings per share | $ | ( | $ | ( | $ | ( | $ | ( | ||||||||||||||||||
________________
(1)For the three and nine months ended September 30, 2025 and 2024, both the Arrangement Warrants and debt warrants were anti-dilutive and are excluded from the calculation of diluted earnings per share.
(2)For the three and nine months ended September 30, 2025 and 2024, RSUs granted were anti-dilutive and are excluded from the calculation of diluted earnings per share.
The following table summarizes the anti-dilutive securities that are excluded from the computation of diluted income (loss) per share:
| Three Months Ended September 30, | Nine Months Ended September 30, | |||||||||||||||||||||||||
| 2025 | 2024 | 2025 | 2024 | |||||||||||||||||||||||
| Anti-dilutive Securities | ||||||||||||||||||||||||||
| Weighted-average number of unexcercised warrants | ||||||||||||||||||||||||||
| Weighted-average number RSUs outstanding, inclusive of DEUs | ||||||||||||||||||||||||||
| Total common shares equivalent | ||||||||||||||||||||||||||
The basic and diluted weighted average number of shares issued, anti-dilutive securities, and earnings per share have been retrospectively adjusted to reflect the equivalent number of shares issued to holders of the Company post merger with TURN.
Note 22. Related parties
Servicing Agreement
On November 20, 2018, the Company entered into a servicing agreement (the “Servicing Agreement”) with BC Partners Advisors L.P. (“BCPA”). Under the terms of the Servicing Agreement, BCPA as servicing agent (the “Servicing Agent”) performs (or oversees, or arranges for, the performance of) the administrative services necessary for the operation of the Company, including, without limitation, office facilities, equipment, bookkeeping and recordkeeping services and such other services the Servicing Agent, subject to review by the Board, shall from time
F-140
to time deem necessary or useful to perform its obligations under this Servicing Agreement. The Servicing Agent is authorized to enter into sub-administration agreements as determined to be necessary in order to carry out the administrative services.
Unless earlier terminated as described below, the Servicing Agreement will remain in effect from year-to-year if approved annually by (i) the vote of the Board and (ii) the vote of a majority of the Company’s directors who are not parties to the Servicing Agreement or a “related party” of the Servicing Agent, or of any of its affiliates. The Servicing Agreement may be terminated at any time, without the payment of any penalty, upon 60 days’ written notice by the vote of the Board or by the Servicing Agent.
The Company reimburses BCPA for an allocable portion of compensation paid to the Company’s Chief Financial Officer, associated management personnel (based on a percentage of time such individuals devote, on an estimated basis, to the business affairs of the Company), and out-of-pocket expenses. While the Servicing Agent performs certain administrative functions for the Company, the management functions of the Company are wholly performed by the Company’s management team. For the three months ended September 30, 2025, the Company incurred administrative fees of $1.5 million (September 30, 2024 – $1.1 million). For the nine months ended September 30, 2025, the Company incurred administrative fees of $3.9 million (September 30, 2024 – $3.0 million). As of September 30, 2025, administrative fees payable to BCPA was $2.2 million (December 31, 2024 – $1.2 million).
Transactions with Affiliates - servicing fees
The Company, through MLC US Holdings, a wholly-owned subsidiary of the Company, provides certain administrative services to SCIM in respect of the management of Alternative Credit Income Fund (“ACIF”) in exchange for a servicing fee. Servicing fees are determined quarterly based on an amount equal to the aggregate base management fee and incentive fees received by SCIM from ACIF in respect of such quarter, net of debt servicing expense, a quarterly fee to be retained by SCIM comprised of a specified amount, and an allocable portion of the compensation of SCIM’s investment professionals in connection with their performance of investment advisory services for ACIF (collectively, the “Retained Benefits”). In addition, SCIM is reimbursed by MLC US Holdings quarterly for certain expenses it incurs in connection with the investment advisory services provided to ACIF. Pursuant to this arrangement, the Company receives the net economic benefit derived by SCIM under the ACIF advisory agreement, subject to the holdback of the Retained Benefits and expense reimbursements. For the three months ended September 30, 2025 the Company incurred servicing fees of $0.4 million (September 30, 2024 – $0.4 million). For the nine months ended September 30, 2025, the Company incurred servicing fees of $1.5 million (September 30, 2024 – $1.9 million).
The Company, through MLC US Holdings, a wholly-owned subsidiary, issued a promissory note to SCIM on October 30, 2020, with a maturity of October 30, 2040. The note’s value is not to exceed $15 M and bears interest at 8.0 % per annum, payable quarterly, for the first 10 years. During the second 10 years outstanding, repayments of the note shall occur in equal quarterly installment payments, bearing interest at 8.0 % per annum, plus an additional 2 % annually on overdue principal. As of September 30, 2025, the outstanding principal value of the note was $13.6 million (December 31, 2024: $13.6 million). For the three months ended September 30, 2025, total interest income was $0.3 million (September 30, 2024: $0.3 million). For the nine months ended September 30, 2025, total interest income was $0.8 million (September 30, 2024: $0.8 million). As of September 30, 2025, the total accrued interest income receivable was $2.7 million (December 31, 2024: $1.9 million).
Transactions with Affiliates - profit sharing interest
On July 15, 2025, Portman Ridge Finance Corporation (“Portman” or “Portman Ridge”) and Logan Ridge, business development companies previously managed by SCIM and ML Management, respectively, completed a merger whereby Logan Ridge merged with and into Portman (the “Portman-Logan Merger”). Pursuant to the Portman-Logan Merger, Portman was the surviving public entity and continues to be advised by SCIM, which the Company holds a minority ownership interest of 24.99 %. The Portman-Logan Merger resulted in the existing IMA between ML Management and Logan Ridge being terminated. In connection with the closing of the Portman-Logan Merger, MLCSC Holdings LLC, our wholly-owned subsidiary (“MLCSC”), entered into a Profit-Sharing
F-141
Agreement with BCPSC Holdings LLC, a wholly-owned subsidiary of BCPA and the majority owner of SCIM (the “Profit-Sharing Agreement”). Pursuant to the Profit-Sharing Agreement, MLCSC is entitled to 16.03 % of BCPA’s distributions from SCIM. The value of the Profit-Sharing Agreement was determined to be $11.2 million and is considered an indefinite lived intangible asset. Income earned as a result of the profit sharing agreement is recorded as “Other income (loss), net” on the condensed consolidated statement of operations. For the three and nine months ended September 30, 2025, income earned on the profit sharing agreement was $0.3 nil ).
Potential Conflicts of Interest
The Company's senior management team is comprised of substantially the same personnel as the senior management team of BCPA, and such personnel may serve in similar or other capacities for BCPA or to future investment vehicles affiliated with BC Partners. As a result, such personnel provide investment advisory services to the Company and certain investment vehicles considered affiliates of BC Partners.
Compensation of Key Management Personnel
The Company's key management personnel are those personnel who have the authority and responsibility for planning, directing and controlling the activities of the Company. Directors (both executive and non-executive) are considered key personnel. Certain directors and officers of the Company are affiliated with BCPA. For the nine months ended September 30, 2025, the Chief Executive Officer (“CEO”) and Co-presidents received no cash salary or bonuses of any kind. Instead, their compensation was 100 % equity-based compensation granted pursuant to the Company's security-based compensation arrangements that vest over time for services rendered. The CEO and Co-presidents had no RSUs, inclusive of DEUs outstanding as of September 30, 2025 (December 31, 2024 - 659,557 ). All remaining RSUs, inclusive of DEUs were accelerated and fully vested upon the closing of the Business Combination on September 12, 2025. There were 16,790 DEUs issued to the CEO and Co-presidents during the nine months ended September 30, 2025 (September 30, 2024 - 3,408 ). See Note 20. Equity based compensation and Note 21. Earnings per share for more information. No person or employee of the Servicing Agent or its affiliates that serves as a director of the Company receives any compensation from the Company for his or her services as a director.
Common shares held by directors and officers of the Company who are affiliated with BCPA at September 30, 2025 were 282,461 (December 31, 2024 – 184,675 ). All outstanding shares of Legacy Mount Logan were converted upon closing of the Business Combination on September 12, 2025 into the Company’s common shares. See Note 3. Business combinations for further details.
Other Transactions with BCPA or their Affiliates
The Servicing Agent may, from time to time, pay amounts owed by the Company to third-party providers of goods or services, and the Company will subsequently reimburse the Servicing Agent for such amounts paid on its behalf. Amounts payable to the Servicing Agent are settled in the normal course of business without any formal payment terms. As of September 30, 2025, operating expenses reimbursable to BC Partners for amounts paid on behalf of the Company was $2.2 million (December 31, 2024 – $7.4 million).
The Company may, from time to time, enter into transactions in the normal course of operations with entities that are considered affiliates involved in the credit business of BCPA (“BCPA Credit Affiliates”). At September 30, 2025, Asset Management held investments with affiliates of BCPA Credit Affiliates totaling $24.7 million (December 31, 2024 – $20.9 million), and Insurance Solutions held investments with affiliates of BCPA Credit Affiliates totaling $21.7 million (December 31, 2024 – $23.7 million). On these investments, Asset Management recognized (i) interest income of $0.3 million and $0.8 million for the three and nine months ended September 30, 2025 (September 30, 2024 - $0.3 million and 0.8 million) respectively, (ii) earnings on equity method investments of $0.5 million and $0.8 million for the three and nine months ended September 30, 2025 (September 30, 2024 - $0.1 million and $0.2 million) respectively, and (iii) dividend income on equity securities of less than $0.1 million and 0.1 million for the three and nine months ended September 30, 2025 (September 30, 2024 – $0.1 million and $0.3 million) respectively. On these investments, Insurance Solutions recognized (i) interest income of $0.9 million for the nine months ended September 30, 2025 (September 30, 2024 - $1.9 million) and (ii) dividend income of $0.2 million for the nine months ended September 30, 2025 (September 30, 2024 - $0.2 million).
F-142
Further, for the nine months ended September 30, 2025, the Company incurred expenses of $5.3 million (September 30, 2024 - $5.4 million) to an affiliate, for third party administrative services relating to Ability for administering its long-term care block of business. As of September 30, 2025, there was a payable to this affiliate of $0.6 million (December 31, 2024 – $0.6 million).
Note 23. Segments
The Company conducts its business through two reportable segments: Asset Management and Insurance Solutions. The Company defines operating segments by type of product and business line. The Asset Management segment comprises all fee generating activities. The Insurance Solutions segment consists of two product lines within the insurance business, LTC and MYGA.
Segment information is utilized by the Company’s chief operating decision maker (“CODM”) to assess performance and to allocate resources. The Company’s Chief Executive Officer (“CEO”) is the CODM, who is also solely responsible for decisions related to the allocation of resources on a Company-wide basis.
For each segment, the CODM uses the key measure of Segment Income to allocate resources (including employees, financial or capital resources) to that segment in the annual budget and forecasting process. The performance is measured by the Company’s CODM on an unconsolidated basis because the CODM makes operating decisions and assesses the performance of each of the Company’s business segments based on financial and operating metrics and data that exclude the effects of consolidation. Each reportable segment is then responsible for managing its operating results, developing products, defining strategies for services and distributions based on the profile and needs of its business and market.
Segment Income
Segment Income is the key performance measure used by the CODM in evaluating the performance of the asset management and insurance solutions segments. The CODM uses Segment Income to make key operating decisions such as the following:
•decisions related to the allocation of resources such as staffing decisions, including hiring and locations for deployment of the new hires;
•decisions related to capital deployment such as providing capital to facilitate growth for the business and/or to facilitate expansion into new businesses; and
•decisions related to expenses, such as determining annual discretionary bonuses and equity-based compensation awards to its employees and/or service providers.
Segment Income is a measure of profitability and has certain limitations in that it does not take into account certain items included under U.S. GAAP. Segment Income is the sum of (i) Fee Related Earnings and (ii) Spread Related Earnings (“SRE”). Segment Income excludes the effects of the consolidation of each segment, taxes and related payables, and other items unique to deriving each segment’s performance metric as explained respectively below.
Segment Income may not be comparable to similarly titled measures used by other companies and is not a measure of performance calculated in accordance with U.S. GAAP. We use Segment Income as a measure of operating performance, not as a measure of liquidity. Segment Income should not be considered in isolation or as a substitute for net income or other income data prepared in accordance with U.S. GAAP. The use of Segment Income without consideration of related U.S. GAAP measures is not adequate due to the adjustments described above. Management compensates for these limitations by using Segment Income as a supplemental measure to U.S. GAAP results, to provide a more complete understanding of our performance as management measures it. A reconciliation of Segment Income to its most directly comparable U.S. GAAP measure of income (loss) before income tax provision can be found in this footnote.
F-143
Fee Related Earnings
Fee Related Earnings (“FRE”) is a component of Segment Income that is used to assess the performance of the Asset Management segment. FRE is the sum of (i) management fees, (ii) performance fees received from certain managed funds (iii) equity investment earnings related to fee generating vehicles, and (iv) interest income attributable to investment management activity, less (a) fee-related compensation, excluding equity-based compensation, and (b) other associated operating expenses, which excludes amortization of acquisition-related intangible assets and interest and other credit facility expenses.
FRE excludes non-fee generating revenues and expenses, transaction-related charges, equity-based compensation costs, the amortization of intangible assets, the operating results of VIEs that are included in the Condensed Consolidated Financial Statements, and any other non-recurring income and expenses. In addition, FRE excludes interest and other financing costs related to the Company not attributable to any specific segment, and corporate overhead expenses incurred to support the operations of the business rather than directly fee-related. Management considers these types of costs corporate in nature, and are included only for reconciliation purposes to income (loss) before income tax (provision) benefit.
Spread Related Earnings
SRE is a component of Segment Income that is used to assess the performance of the Insurance Solutions segment, excluding certain market volatility, which consists of investment gains (losses), other income and certain general, administrative & other expenses. For the Insurance Solutions segment, SRE equals the sum of (i) the net investment earnings on Insurance Solutions segment’s net invested assets (excluding investment earnings on funds held under reinsurance contracts and Modco agreement), less (ii) cost of funds (as described below), (iii) compensation and benefits, (iv) interest expense and (v) operating expenses.
Cost of funds includes liability costs associated with the crediting cost on MYGA liabilities as well as other liability costs. Other liability costs include DAC amortization, the cost of liabilities associated with LTC, net of reinsurance, which includes change in reserves, premiums, actual claim experience including related expenses and certain product charges related to MYGA.
F-144
The following presents financial data for the Company’s reportable segments and the reconciliation of Segment Income to Income (loss) before taxes reported in the Condensed Consolidated Statements of Operations:
| Three Months Ended September 30, | Nine Months Ended September 30, | |||||||||||||||||||||||||
| 2025 | 2024 | 2025 | 2024 | |||||||||||||||||||||||
| Asset Management | ||||||||||||||||||||||||||
| Management fees | $ | $ | $ | $ | ||||||||||||||||||||||
| Incentive fees | ||||||||||||||||||||||||||
| Equity investment earnings | ||||||||||||||||||||||||||
Interest income¹ | ||||||||||||||||||||||||||
| Other fee-related income | ||||||||||||||||||||||||||
| Fee-related compensation | ( | ( | ( | ( | ||||||||||||||||||||||
| Other operating expenses: | ||||||||||||||||||||||||||
| Administration and servicing fees | ( | ( | ( | ( | ||||||||||||||||||||||
| General, administrative and other | ( | ( | ( | ( | ||||||||||||||||||||||
| Fee related earnings | ||||||||||||||||||||||||||
| Insurance Solutions | ||||||||||||||||||||||||||
| Net investment income and realized gain (loss), net | ||||||||||||||||||||||||||
| Cost of funds | ( | ( | ( | ( | ||||||||||||||||||||||
| Compensation and benefits | ( | ( | ( | ( | ||||||||||||||||||||||
| Interest expense | ( | ( | ( | ( | ||||||||||||||||||||||
| General, administrative and other | ( | ( | ( | ( | ||||||||||||||||||||||
| Spread related earnings | ||||||||||||||||||||||||||
| Segment income | $ | $ | $ | $ | ||||||||||||||||||||||
| Asset Management Adjustments: | ||||||||||||||||||||||||||
| Intersegment management fee eliminations | ( | ( | ( | ( | ||||||||||||||||||||||
Administration and servicing fees ² | ( | ( | ( | ( | ||||||||||||||||||||||
| Transaction costs | ( | ( | ( | ( | ||||||||||||||||||||||
Compensation and benefits ² | ( | ( | ( | ( | ||||||||||||||||||||||
| Equity-based compensation | ( | ( | ( | ( | ||||||||||||||||||||||
| Amortization and impairment of intangible assets | ( | ( | ( | ( | ||||||||||||||||||||||
| Interest and other credit facility expenses | ( | ( | ( | ( | ||||||||||||||||||||||
General, administrative and other ² | ( | ( | ( | ( | ||||||||||||||||||||||
| Net gains (losses) from investment activities | ( | |||||||||||||||||||||||||
| Dividend income | ||||||||||||||||||||||||||
| Other income (loss), net | ( | |||||||||||||||||||||||||
| Gain on acquisition | ||||||||||||||||||||||||||
| Insurance Solutions Adjustments: | ||||||||||||||||||||||||||
| Equity-based compensation | ( | ( | ( | ( | ||||||||||||||||||||||
| Net unrealized gains (losses) from investment activities | ( | ( | ( | |||||||||||||||||||||||
| Other income | ||||||||||||||||||||||||||
| Intersegment management fee eliminations | ||||||||||||||||||||||||||
General, administrative and other ³ | ( | ( | ( | ( | ||||||||||||||||||||||
| Income (loss) before taxes | $ | ( | $ | ( | $ | ( | $ | ( | ||||||||||||||||||
_______________
(1)Represents interest income on a loan asset related to a fee generating vehicle.
F-145
(2)Represents corporate overhead allocated to each segment.
(3)Represents costs incurred by the insurance segment for purposes of U.S. GAAP reporting but not the day-to-day operations of the insurance company.
The following presents financial data for the Company’s reportable segments and the reconciliation of Segment Revenue to total revenue reported in the Condensed Consolidated Statements of Operations:
| Three Months Ended September 30, | Nine Months Ended September 30, | |||||||||||||||||||||||||
| 2025 | 2024 | 2025 | 2024 | |||||||||||||||||||||||
| Segment Revenues | ||||||||||||||||||||||||||
| Asset Management | $ | $ | $ | $ | ||||||||||||||||||||||
| Insurance Solutions | $ | $ | $ | $ | ||||||||||||||||||||||
| Total segment revenues | ||||||||||||||||||||||||||
| Asset Management Adjustments: | ||||||||||||||||||||||||||
| Intersegment management fee eliminations | ( | ( | ( | ( | ||||||||||||||||||||||
| Interest income | ( | ( | ( | ( | ||||||||||||||||||||||
| Other fee-related income | ( | ( | ||||||||||||||||||||||||
| Insurance Solutions Adjustments: | — | |||||||||||||||||||||||||
| Net Premiums | ( | ( | ( | ( | ||||||||||||||||||||||
| Product charges | ||||||||||||||||||||||||||
| Net gains (losses) from investment activities | ( | ( | ( | |||||||||||||||||||||||
| Other income | ||||||||||||||||||||||||||
| Intersegment management fee eliminations | ||||||||||||||||||||||||||
| Total revenues | $ | $ | $ | $ | ||||||||||||||||||||||
The following presents financial data for the Company’s reportable segments and the reconciliation of the Company’s total reportable segment assets to total assets reported in the Condensed Consolidated Statements of Financial Position:
| As of | September 30, 2025 | December 31, 2024 | ||||||||||||
| Segments Assets | ||||||||||||||
| Asset Management | $ | $ | ||||||||||||
| Insurance Solutions | ||||||||||||||
| Total segment assets | ||||||||||||||
| Asset Management Adjustments: | ||||||||||||||
| Intersegment investments | ( | ( | ||||||||||||
| Intersegment receivables | ( | ( | ||||||||||||
| Total assets | $ | $ | ||||||||||||
Note 24. Commitments and contingencies
Investment commitments
In the normal course of business, the Company may enter into commitments to fund investments, which are not reflected in the Condensed Consolidated Financial Statements. There were $1.4 million and $47.5 million of outstanding investment commitments as of September 30, 2025 for Asset Management and Insurance Solutions, respectively (December 31, 2024 – $1.4 million and $43.2 million).
F-146
In connection with the Capitala Acquisition, ML Management issued a promissory note to CIA for $4.0 million, which pursuant to the terms in the agreement, may increase to $6.0 million, based on the maturity date asset values of a predefined list of assets held by Logan Ridge. Refer to Note 12. Debt obligations for the expected cash outflow on this liability based on the fair value as of September 30, 2025.
Contingent liabilities and litigation
The Company may be subject to lawsuits in the normal course of business. Insurance in particular is a highly regulated industry and lawsuits related to claim payments should be expected in the normal course of business. In the Asset Management business certain types of investment vehicles, especially those offered to individual investors, may subject the Company to a variety of risks, including new and greater levels of public and regulatory scrutiny, regulation, risk of litigation and reputation risk, which could materially and adversely affect the Company. Other potential lawsuits include allegations of mis-selling in the Insurance Solutions segment, among others. The Company considers this risk to be less likely given that Ability no longer directly writes insurance policies.
Ability at different times may receive notifications of the insolvency of various insurance companies. It is expected that such insolvencies would result in a Guaranty Fund Assessment against Ability at some future date. At this time, the Company is unable to estimate the possible amounts, if any, of such assessments as no data is available from the National Organization of Life and Health Guaranty Associations in the United States. Accordingly, the Company is unable to determine the impact, if any, that such assessments may have on its financial position or results of operations.
Ability is subject to lawsuits and regulatory actions in the normal course of business that do not arise from or directly relate to claims on insurance policies. This category of business litigation typically involves, among other things, allegations of underwriting errors or misconduct and litigation related to regulatory activity. These nonclaims litigation matters are considered when determining general expense accruals are necessary. As of September 30, 2025, there were no litigation related expense accruals. Potential legal and regulatory actions are subject to inherent uncertainties, and future events could change management’s assessment of the probability or estimated amount of potential losses from pending or threatened legal and regulatory matters. A future adverse ruling by the courts in any pending cases could have a material adverse impact on the financial condition of Ability. Based on management’s best assessment at this time, Ability is adequately reserved for these cases as of September 30, 2025.
Note 25. Capital management and regulatory requirements
The Company’s capital structure consists of equity and debt. In order to maintain or adjust the capital structure, the Company actively manages its equity as capital and may adjust the amount of debt borrowings, dividends paid to shareholders, return capital to shareholders, issue new shares or sell assets. The Company's capital management framework takes into account the requirements of the Company as a whole as well as the needs and requirements of each of its subsidiaries. The Company’s officers and senior management are responsible for managing the Company’s capital and do so through quarterly portfolio management meetings and regular review of financial information.
As of September 30, 2025, the Company was in compliance with all financial covenants in its debt facilities. These include restrictions on the distribution capacity from MLC US Holdings to the Company.
Insurance capital requirements
Ability is subject to minimum capital and surplus requirements. Insurance companies typically operate in excess of such requirements. Failure to maintain such minimum capital will result in regulatory actions, including in certain circumstances regulatory takeover of the insurance company.
Ability is subject to risk based capital (“RBC”) standards and other minimum capital and surplus requirements imposed by state laws. Regulatory capital requirements for Ability are determined in accordance with statutory requirements of the Nebraska Department of Insurance. The RBC requirement is a statutory minimum level of capital that is based on multiple factors including: an insurance company's size, and the inherent riskiness of its
F-147
financial assets, liabilities and operations. That is, the company must hold capital in proportion to its risk. The RBC formula is intended to measure the adequacy of the insurance company’s statutory surplus in relation to the risks inherent in its business. The RBC formula requires higher surplus in relation to items deemed to have higher risk. Regulatory action is triggered beginning at 200% RBC and below. The minimum RBC ratio for Ability is 200% and Ability must have a ratio in excess of 300% to be able to reinsure new business. Ability’s RBC ratio is tested annually at the end of Ability’s financial year and estimated on a quarterly basis. When calculated at December 31, 2024 it was 325 % which was in excess of the minimum requirement. From time to time during a particular financial year, Ability may take steps to increase its RBC ratio to ensure it remains above the minimum requirement or exceeds the ratio required to write new business, which steps may include, among other things, securing additional funding. Ability’s minimum capital requirements do not require a minimum level of cash to be held. Ability does not have to include cash as part of its regulatory capital provided the minimum capital requirements are satisfied.
Insurance subsidiary dividend restrictions
Ability’s statutory statements are presented on the basis of accounting practices determined by the Nebraska Department of Insurance (“NEDOI”). The NEDOI recognizes only permits and/or prescribes certain statutory accounting practices determining and reporting the financial condition and results of operations of an insurance company and for determining its solvency under insurance law. The amount of dividends that Ability may pay in a twelve-month period, without prior approval by Ability, is restricted by the laws of Nebraska.
Under Nebraska law, dividends payable from Ability's unassigned funds during any twelve-month period without prior approval of the state’s Insurance Director are limited to the greater of 10% of Ability’s surplus as shown on the immediately preceding calendar year’s statutory financial statement on file with the NEDOI or 100% net gain from operations for the prior calendar year. Any dividend in excess of such limitation must be approved by the Insurance Director. Based on these restrictions, Ability could not pay any dividends to its parent absent regulatory approval as of each of September 30, 2025 and December 31, 2024.
Note 26. Concentration of Risks
Our current operations subject us to the following concentrations of risk:
Insurance Solutions
Historically, we have assumed our MYGA products, which is a part of our insurance operations, from two insurance companies, ACL and SSL. We have made a decision to no longer assume business from ACL and SSL as of June 30, 2024. However, the Company will continue to earn investment income from the cash proceeds of the existing MYGA contracts and the holders will continue to be a diversified base of numerous individuals. Effective March 31, 2025, Ability entered a new reinsurance treaty for additional MYGA with National Security Group (“NSG”), further diversifying its reinsurance partners.
Certain concentrations of credit risk related to reinsurance recoverable exist with the insurance organizations listed in the table below:
F-148
| As at September 30, 2025 | A.M. Best credit rating | Net reinsurance recoverable¹ | Funds withheld payable | Net reinsurance credit exposure | ||||||||||||||||||||||
| Medico Insurance Company | A | $ | $ | $ | ||||||||||||||||||||||
| Front Street Re | Not Rated | |||||||||||||||||||||||||
| Vista Life and Casualty Reinsurance Co | Not Rated | |||||||||||||||||||||||||
| Total | $ | $ | $ | |||||||||||||||||||||||
| As at December 31, 2024 | A.M. Best credit rating | Net reinsurance recoverable¹ | Funds withheld payable | Net reinsurance credit exposure | ||||||||||||||||||||||
| Medico Insurance Company | A | $ | $ | $ | ||||||||||||||||||||||
| Front Street Re | Not Rated | |||||||||||||||||||||||||
| Vista Life and Casualty Reinsurance Co | Not Rated | |||||||||||||||||||||||||
| Total | $ | $ | $ | |||||||||||||||||||||||
_______________
(1)Includes credit loss allowance of $0.9 million and $0.8 million as of September 30, 2025 and December 31, 2024, respectively, held against reinsurance recoverable.
Further, our Insurance Solutions segment has the following investment concentration risk:
| September 30, 2025 | ||||||||||||||
| Fair value | % of total | |||||||||||||
| Insurance Solutions | ||||||||||||||
| United States | $ | % | ||||||||||||
| Cayman Islands | % | |||||||||||||
Other¹ | % | |||||||||||||
| Total insurance solutions | 100 | % | ||||||||||||
| Insurance Solutions consolidated VIEs | ||||||||||||||
| United States | % | |||||||||||||
Other² | % | |||||||||||||
| Total insurance solutions consolidated VIEs | 100 | % | ||||||||||||
| Total | $ | |||||||||||||
_______________
(1)Other consists of nominal investments primarily in Bermuda, Canada, and Cayman Islands.
(2)Other consists of nominal investments primarily in Ireland and Canada.
| December 31, 2024 | ||||||||||||||
| Fair value | % of total | |||||||||||||
| Insurance Solutions | ||||||||||||||
| United States | $ | % | ||||||||||||
| Canada | % | |||||||||||||
Other¹ | % | |||||||||||||
| Total insurance solutions | 100 | % | ||||||||||||
| Insurance Solutions consolidated VIEs | ||||||||||||||
| United States | % | |||||||||||||
| Canada | % | |||||||||||||
| Other | % | |||||||||||||
| Total insurance solutions consolidated VIEs | 100 | % | ||||||||||||
| Total | $ | |||||||||||||
_______________
F-149
The Asset Management segment does not have meaningful investment concentration risk.
Note 27. Subsequent events
Management of the Company has evaluated subsequent events through the date these financial statements were issued. Based upon this evaluation, management has determined there were no items requiring adjustment of the financial statements. Management does note the following:
On October 19, 2025, all 20,468,128 outstanding Arrangement Warrants expired at 4:00 p.m. (Toronto time).
On November 5, 2025, the Board declared a cash dividend in the amount of $0.03 per common share to be paid on December 11, 2025 to shareholders of record on November 25, 2025.
F-150
| MOUNT LOGAN CAPITAL INC. | ||||||||||||||||||||
| Schedule I | ||||||||||||||||||||
| Summary of Investments - Other Than Investments in Related Parties | ||||||||||||||||||||
| September 30, 2025 | ||||||||||||||||||||
| (In thousands) | Cost or amortized cost | Fair value | Amount shown on the balance sheet | |||||||||||||||||
| Debt securities: | ||||||||||||||||||||
| U.S. government and agency | $ | 6,546 | $ | 6,135 | $ | 6,135 | ||||||||||||||
| U.S. state, territories and municipalities | 6,408 | 5,334 | 5,334 | |||||||||||||||||
| Other government and agency | 3,214 | 2,363 | 2,363 | |||||||||||||||||
| Corporate | 267,549 | 221,347 | 221,347 | |||||||||||||||||
| Asset and mortgage-backed securities | 345,168 | 339,019 | 339,019 | |||||||||||||||||
| Total debt securities | 628,885 | 574,197 | 574,197 | |||||||||||||||||
| Equity securities | ||||||||||||||||||||
| Common stock | 366 | 366 | 366 | |||||||||||||||||
| Preferred stock | 5,259 | 5,246 | 5,246 | |||||||||||||||||
| Total equity securities | 5,625 | 5,612 | 5,612 | |||||||||||||||||
| Loans | 164,356 | 162,716 | 162,716 | |||||||||||||||||
| Mortgage loans | 143,662 | 149,882 | 143,662 | |||||||||||||||||
| Other invested assets - corporate loans | 16,910 | 17,062 | 16,910 | |||||||||||||||||
| Other invested assets | 1,190 | 1,190 | 1,190 | |||||||||||||||||
| Total investments — Insurance Solutions | 960,627 | 910,659 | 904,287 | |||||||||||||||||
| Corporate loans of consolidated VIEs | 136,044 | 128,806 | 128,806 | |||||||||||||||||
| Equity securities of consolidated VIEs | 141 | 247 | 247 | |||||||||||||||||
| Total investments - Insurance Solutions, consolidated VIEs | 136,185 | 129,053 | 129,053 | |||||||||||||||||
| Total investments - Insurance Solutions, including consolidated VIEs | $ | 1,096,812 | $ | 1,039,711 | $ | 1,033,339 | ||||||||||||||
F-151
Report of Independent Registered Public Accounting Firm
To the Board of Directors and Shareholders of 180 Degree Capital Corp.
Opinion on the Financial Statements
We have audited the accompanying consolidated statement of assets and liabilities of 180 Degree Capital Corp. (the “Company”), including the consolidated schedule of investments, as of December 31, 2024, and the related consolidated statements of operations and cash flows for the year then ended, and the consolidated statements of changes in net assets and the consolidated financial highlights for each of the years in the two-year period ended December 31, 2024, and the related notes (collectively referred to as the “financial statements”). The consolidated financial highlights for each of the years in the three-year period ended December 31, 2022 were audited by another independent registered public accounting firm whose report, dated February 27, 2023, expressed an unqualified opinion on those consolidated financial highlights. In our opinion, the financial statements present fairly, in all material respects, the consolidated financial position of the Company as of December 31, 2024, and the consolidated results of their operations and their cash flows for the year then ended, the changes in their net assets and financial highlights for each of the years in the two-year period ended December 31, 2024, in conformity with accounting principles generally accepted in the United States of America.
Basis for Opinion
These financial statements are the responsibility of the Company’s management. Our responsibility is to express an opinion on the Company’s financial statements based on our audits. We are a public accounting firm registered with the Public Company Accounting Oversight Board (United States) (“PCAOB”) and are required to be independent with respect to the Company in accordance with the U.S. federal securities laws and the applicable rules and regulations of the Securities and Exchange Commission and the PCAOB. We conducted our audits in accordance with the standards of the PCAOB. Those standards require that we plan and perform the audit to obtain reasonable assurance about whether the financial statements are free of material misstatement, whether due to error or fraud. The Company is not required to have, nor were we engaged to perform, an audit of its internal control over financial reporting. As part of our audits, we are required to obtain an understanding of internal control over financial reporting but not for the purpose of expressing an opinion on the effectiveness of the Company’s internal control over financial reporting. Accordingly, we express no such opinion.
Our audits included performing procedures to assess the risks of material misstatement of the financial statements, whether due to error or fraud, and performing procedures that respond to those risks. Such procedures included examining, on a test basis, evidence regarding the amounts and disclosures in the financial statements. Our procedures included confirmation of securities owned as of December 31, 2024, by correspondence with the custodian, transfer agent and issuers of privately offered securities. Our audits also included evaluating the accounting principles used and significant estimates made by management, as well as evaluating the overall presentation of the financial statements. We believe that our audits provide a reasonable basis for our opinion.
/s/ EisnerAmper LLP
We have served as the Company’s auditor since 2023.
EISNERAMPER LLP
New York, New York
February 13, 2025
F-152
| 180 DEGREE CAPITAL CORP. CONSOLIDATED STATEMENT OF ASSETS AND LIABILITIES | ||
| December 31, 2024 | ||||||||
| ASSETS | ||||||||
| Investments in securities and other financial instruments, at value: | ||||||||
| Unaffiliated publicly traded equity and equity-related securities (cost: $33,568,275) | $ | 29,542,109 | ||||||
| Unaffiliated money market fund securities (cost: $6,000,000) | 6,000,000 | |||||||
| Unaffiliated legacy privately held equity and equity-related securities (cost: $0) | 100,000 | |||||||
| Non-controlled affiliated publicly traded equity and equity-related securities (cost: $26,358,680) | 10,648,264 | |||||||
| Non-controlled affiliated legacy privately held equity and equity-related securities (cost: $6,496,930) | 75,000 | |||||||
| Unaffiliated derivative securities (cost: $224,849) | 351,558 | |||||||
| Non-controlled affiliated derivative securities (cost: $0) | 22,150 | |||||||
| Unaffiliated rights to payments (cost: $0) | 70,456 | |||||||
| Cash | 552,100 | |||||||
| Prepaid expenses | 216,568 | |||||||
| Other assets | 31,855 | |||||||
Total assets | $ | 47,610,060 | ||||||
| LIABILITIES & NET ASSETS | ||||||||
| Accounts payable and accrued liabilities | $ | 905,578 | ||||||
| Post-retirement plan liabilities | 352,480 | |||||||
Total liabilities | $ | 1,258,058 | ||||||
| Commitments and contingencies (Note 10) | ||||||||
Net assets | $ | 46,352,002 | ||||||
| Net assets are comprised of: | ||||||||
| Preferred stock, $0.10 par value, 2,000,000 shares authorized; none issued | $ | 0 | ||||||
| Common stock, $0.03 par value, 15,000,000 shares authorized; 11,541,079 issued | 334,594 | |||||||
| Additional paid in capital | 101,578,029 | |||||||
| Total accumulated distributable loss | (49,299,698) | |||||||
| Treasury stock, at cost 1,540,938 shares | (6,260,923) | |||||||
Net assets | $ | 46,352,002 | ||||||
Shares outstanding | 10,000,141 | |||||||
Net asset value per outstanding share | $ | 4.64 | ||||||
The accompanying notes are an integral part of these consolidated financial statements.
F-153
| 180 DEGREE CAPITAL CORP. CONSOLIDATED STATEMENT OF OPERATIONS | ||
| Year Ended December 31, 2024 | ||||||||
| Income: | ||||||||
| Board fees from portfolio companies | $ | 65,000 | ||||||
| Board fees from portfolio companies - stock grant | 77,040 | |||||||
| Interest-Unaffiliated money market fund securities | 52,773 | |||||||
| Total income | 194,813 | |||||||
| Operating fees and expenses: | ||||||||
| Salaries, bonuses and benefits | 1,933,457 | |||||||
| Professional | 1,345,206 | |||||||
| Administration and operations | 274,379 | |||||||
| Directors | 232,500 | |||||||
| Insurance | 201,240 | |||||||
| Software | 154,526 | |||||||
| Rent | 38,598 | |||||||
| Custody | 28,646 | |||||||
| Other | 5,794 | |||||||
| Total operating expenses | 4,214,346 | |||||||
| Net investment loss before income tax expense | (4,019,533) | |||||||
| Income tax expense | 153 | |||||||
| Net investment loss | (4,019,686) | |||||||
| Net realized (loss) gain from investments: | ||||||||
| Unaffiliated publicly traded equity and equity-related securities | (3,001,664) | |||||||
| Unaffiliated legacy privately held equity and equity-related securities | (808,742) | |||||||
| Non-controlled affiliated publicly traded equity and equity-related securities | (21,759) | |||||||
| Unaffiliated rights to payments | 161,512 | |||||||
| Net realized loss from investments | (3,670,653) | |||||||
| Change in unrealized appreciation (depreciation) on investments: | ||||||||
| Unaffiliated publicly traded equity and equity-related securities | 4,723,425 | |||||||
| Unaffiliated legacy privately held equity and equity-related securities | 748,845 | |||||||
| Non-controlled affiliated publicly traded equity and equity-related securities | (1,385,514) | |||||||
| Non-controlled affiliated legacy privately held equity and equity-related securities | (126,439) | |||||||
| Unaffiliated rights to payments | (136,136) | |||||||
| Net change in unrealized appreciation on investments | 3,824,181 | |||||||
| Net realized loss and change in unrealized appreciation on investments | 153,528 | |||||||
| Net decrease in net assets resulting from operations | $ | (3,866,158) | ||||||
The accompanying notes are an integral part of these consolidated financial statements.
F-154
| 180 DEGREE CAPITAL CORP. CONSOLIDATED STATEMENT OF CASH FLOWS | ||
| Year Ended December 31, 2024 | ||||||||
| Cash flows provided by operating activities: | ||||||||
| Net decrease in net assets resulting from operations | $ | (3,866,158) | ||||||
| Adjustments to reconcile net decrease in net assets resulting from operations to net cash provided by operating activities: | ||||||||
| Net realized loss from investments | 3,670,653 | |||||||
| Net change in unrealized appreciation on investments | (3,824,181) | |||||||
| Board fees from portfolio companies - stock grant | (77,040) | |||||||
| Depreciation of fixed assets | 6,207 | |||||||
| Purchase of unaffiliated publicly traded equity and equity-related securities | (11,366,427) | |||||||
| Purchase of non-controlled affiliated publicly traded equity and equity-related securities | (1,376,748) | |||||||
| Purchase of unaffiliated money market fund securities, net | (5,903,555) | |||||||
| Proceeds from sale of unaffiliated publicly traded equity and equity-related securities | 21,245,986 | |||||||
| Proceeds from sale of unaffiliated legacy privately held equity and equity-related securities | 123,330 | |||||||
| Proceeds from sale of non-controlled affiliated publicly traded and equity-related securities | 5,371 | |||||||
| Distribution from unaffiliated rights to payments | 1,311,311 | |||||||
| Changes in assets and liabilities: | ||||||||
| Decrease in prepaid expenses | 1,521 | |||||||
| Increase in other assets | (21,684) | |||||||
| Decrease in post-retirement plan liabilities | (274,806) | |||||||
| Increase in accounts payable and accrued liabilities | 616,153 | |||||||
| Net cash provided by operating activities | 269,933 | |||||||
| Net increase in cash | 269,933 | |||||||
| Cash at beginning of the year | 282,167 | |||||||
Cash at end of the year* | $ | 552,100 | ||||||
| Supplemental disclosures of cash flow information: | ||||||||
| Income taxes paid | $ | 153 | ||||||
_______________
*The Company had $6,000,000 held in money market securities as of December 31, 2024, that is not treated as cash or a cash equivalent for reporting purposes.
The accompanying notes are an integral part of these consolidated financial statements.
F-155
| 180 DEGREE CAPITAL CORP. CONSOLIDATED STATEMENTS OF CHANGES IN NET ASSETS | ||
| Year Ended December 31, 2024 | Year Ended December 31, 2023 | |||||||||||||
| Changes in net assets from operations: | ||||||||||||||
| Net investment loss | $ | (4,019,686) | $ | (3,711,441) | ||||||||||
| Net realized loss on investments | (3,670,653) | (5,695,394) | ||||||||||||
| Net change in unrealized appreciation (depreciation) on investments | 3,824,181 | (4,264,756) | ||||||||||||
| Net decrease in net assets resulting from operations | (3,866,158) | (13,671,591) | ||||||||||||
| Changes in net assets from capital stock transactions: | ||||||||||||||
| Treasury stock purchase | — | (1,655,398) | ||||||||||||
| Net decrease in net assets resulting from capital stock transactions | — | (1,655,398) | ||||||||||||
| Net decrease in net assets | (3,866,158) | (15,326,989) | ||||||||||||
| Net Assets: | ||||||||||||||
| Beginning of the year | 50,218,160 | 65,545,149 | ||||||||||||
| End of the year | $ | 46,352,002 | $ | 50,218,160 | ||||||||||
The accompanying notes are an integral part of these consolidated financial statements.
F-156
| 180 DEGREE CAPITAL CORP. CONSOLIDATED FINANCIAL HIGHLIGHTS | ||
| Year Ended Dec. 31, 2024 | Year Ended Dec. 31, 2023 | Year Ended Dec. 31, 2022 | Year Ended Dec. 31, 2021 | Year Ended Dec. 31 2020 | ||||||||||||||||||||||||||||
| Per Share Operating Performance: | ||||||||||||||||||||||||||||||||
| Net asset value per share, beginning of the year | $ | 5.02 | $ | 6.32 | $ | 10.66 | $ | 9.28 | $ | 9.18 | ||||||||||||||||||||||
Net investment loss* | (0.40) | (0.38) | (0.25) | (0.33) | (0.05) | |||||||||||||||||||||||||||
Net realized (loss) gain* | (0.37) | (0.56) | 0.21 | 0.20 | (0.11) | |||||||||||||||||||||||||||
Net change in unrealized (depreciation) appreciation on investments and options*(1) | 0.39 | (0.42) | (4.30) | 1.51 | 0.26 | |||||||||||||||||||||||||||
| Total from investment operations* | (0.38) | (1.36) | (4.34) | 1.38 | 0.10 | |||||||||||||||||||||||||||
| Net increase as a result of purchase of treasury stock | 0.00 | 0.06 | 0.00 | 0.00 | — | |||||||||||||||||||||||||||
| Net (decrease) increase in net asset value | (0.38) | (1.30) | (4.34) | 1.38 | 0.10 | |||||||||||||||||||||||||||
| Net asset value per share, end of the year | $ | 4.64 | $ | 5.02 | $ | 6.32 | $ | 10.66 | $ | 9.28 | ||||||||||||||||||||||
| Stock price per share, end of the year | $ | 3.67 | $ | 4.10 | $ | 5.28 | $ | 7.35 | $ | 6.66 | ||||||||||||||||||||||
| Total return based on stock price | (10.49) | % | (22.35) | % | (28.16) | % | 10.36 | % | 3.26 | % | ||||||||||||||||||||||
| Supplemental Data: | ||||||||||||||||||||||||||||||||
| Net assets, end of the year | $ | 46,352,002 | $ | 50,218,160 | $ | 65,545,149 | $ | 110,575,952 | $ | 96,317,794 | ||||||||||||||||||||||
| Ratio of expenses to average net assets | 8.88 | % | 6.39 | % | 3.20 | % | 5.87 | % | 4.61 | % | ||||||||||||||||||||||
| Ratio of net investment loss to average net assets | (8.47) | % | (6.30) | % | (2.88) | % | (3.26) | % | (0.59) | % | ||||||||||||||||||||||
| Portfolio turnover | 26.61 | % | 31.56 | % | 30.95 | % | 44.46 | % | 35.16 | % | ||||||||||||||||||||||
| Number of shares outstanding, end of the year | 10,000,141 | 10,000,141 | 10,373,820 | 10,373,820 | 10,373,820 | |||||||||||||||||||||||||||
_______________
# Reflect a 1-for-3 reverse stock split that became effective on January 4, 2021.
* Based on average shares outstanding.
^ The Company has entered into an expense offsetting arrangement with one of its unaffiliated brokers relating to broker fees paid. The total broker fee charged to the Company was applied as a credit to fees charged by an affiliate of the unaffiliated broker who the Company subscribes to for data services billed during the year. The Company received an offset to expense totaling approximately $20,600, $84,800, and $31,900, with that broker for the years ended December 31, 2022-2020, respectively.
(1) Net unrealized losses include rounding adjustments to reconcile change in net asset value per share.
The accompanying notes are an integral part of these consolidated financial statements.
F-157
| 180 DEGREE CAPITAL CORP. CONSOLIDATED SCHEDULE OF INVESTMENTS AS OF DECEMBER 31, 2024 | ||||||||||||||||||||||||||||||||
| Method of Valuation (1) | Industry | Shares/Units | Cost | Value | ||||||||||||||||||||||||||||
Investments in Unaffiliated Equity and Equity-Related Securities (2) - | ||||||||||||||||||||||||||||||||
| 76.8% of net assets at value | ||||||||||||||||||||||||||||||||
| Unaffiliated Publicly Traded Equity and Equity-Related Securities - | ||||||||||||||||||||||||||||||||
| 63.7% of net assets at value | ||||||||||||||||||||||||||||||||
Arena Group Holdings, Inc. (3) | Interactive Media & Services | |||||||||||||||||||||||||||||||
| Provides a shared digital publishing, advertising and distribution platform | ||||||||||||||||||||||||||||||||
| Common Stock | (L1) | 992,992 | $ | 9,807,981 | $ | 1,330,609 | ||||||||||||||||||||||||||
Ascent Industries Co. (3) | Steel | |||||||||||||||||||||||||||||||
| Manufactures metals and chemicals | ||||||||||||||||||||||||||||||||
| Common Stock | (L1) | 377,750 | 3,949,047 | 4,223,245 | ||||||||||||||||||||||||||||
Brightcove, Inc. (3) | Internet Services & Infrastructure | |||||||||||||||||||||||||||||||
| Provides video hosting and publishing services | ||||||||||||||||||||||||||||||||
| Common Stock | (L1) | 1,053,580 | 2,274,585 | 4,583,073 | ||||||||||||||||||||||||||||
Commercial Vehicle Group, Inc. (3) | Construction Machinery & Heavy Trucks | |||||||||||||||||||||||||||||||
| Supplier of vehicle components | ||||||||||||||||||||||||||||||||
| Common Stock | (L1) | 410,000 | 2,259,403 | 1,016,800 | ||||||||||||||||||||||||||||
Intevac, Inc. (3) | Technology Hardware, Storage & Peripherals | |||||||||||||||||||||||||||||||
| Develops solutions for the application and engineering of thin-films | ||||||||||||||||||||||||||||||||
| Common Stock | (L1) | 1,046,597 | 4,566,798 | 3,558,430 | ||||||||||||||||||||||||||||
Lantronix, Inc. (3) | Communications Equipment | |||||||||||||||||||||||||||||||
| Provides secure data access and management solutions | ||||||||||||||||||||||||||||||||
| Common Stock | (L1) | 656,139 | 2,163,508 | 2,703,293 | ||||||||||||||||||||||||||||
The accompanying notes are an integral part of these consolidated financial statements.
F-158
| 180 DEGREE CAPITAL CORP. CONSOLIDATED SCHEDULE OF INVESTMENTS AS OF DECEMBER 31, 2024 | ||||||||||||||||||||||||||||||||
| Method of Valuation (1) | Industry | Shares/Units | Cost | Value | ||||||||||||||||||||||||||||
Potbelly Corporation (3) | Restaurants | |||||||||||||||||||||||||||||||
| Operates a chain of sandwich shops | ||||||||||||||||||||||||||||||||
| Common Stock | (L1) | 1,091,206 | 5,622,618 | 10,279,161 | ||||||||||||||||||||||||||||
Investments in Unaffiliated Equity and Equity-Related Securities (2) - | ||||||||||||||||||||||||||||||||
| 76.8% of net assets at value (cont.) | ||||||||||||||||||||||||||||||||
| Unaffiliated Publicly Traded Equity and Equity-Related Securities - | ||||||||||||||||||||||||||||||||
| 63.7% of net assets at value (cont.) | ||||||||||||||||||||||||||||||||
RF Industries, Ltd. (3) | Electronic Manufacturing Services | |||||||||||||||||||||||||||||||
| Provides products that enable wired and wireless communications | ||||||||||||||||||||||||||||||||
| Common Stock | (L1) | 472,506 | $ | 2,924,335 | $ | 1,847,498 | ||||||||||||||||||||||||||
| Total Unaffiliated Publicly Traded Equity and Equity-Related Securities (cost: $33,568,275) | $ | 29,542,109 | ||||||||||||||||||||||||||||||
| Unaffiliated Money Market Fund Securities - | ||||||||||||||||||||||||||||||||
| 12.9% of net assets at value | ||||||||||||||||||||||||||||||||
| JPMorgan 100% U.S. Treasury Securities Money Market Fund - Premier | ||||||||||||||||||||||||||||||||
| (Yield 4.10%) | (L1) | 3,000,000 | $ | 3,000,000 | $ | 3,000,000 | ||||||||||||||||||||||||||
| JPMorgan 100% U.S. Treasury Securities Money Market Fund - Capital | ||||||||||||||||||||||||||||||||
| (Yield 4.35%) | (L1) | 3,000,000 | 3,000,000 | 3,000,000 | ||||||||||||||||||||||||||||
| Total Unaffiliated Money Market Fund Securities (cost: $6,000,000) | $ | 6,000,000 | ||||||||||||||||||||||||||||||
| Unaffiliated Legacy Privately Held Equity and Equity-Related Securities - | ||||||||||||||||||||||||||||||||
| 0.2% of net assets at value | ||||||||||||||||||||||||||||||||
The accompanying notes are an integral part of these consolidated financial statements.
F-159
| 180 DEGREE CAPITAL CORP. CONSOLIDATED SCHEDULE OF INVESTMENTS AS OF DECEMBER 31, 2024 | ||||||||||||||||||||||||||||||||
| Method of Valuation (1) | Industry | Shares/Units | Cost | Value | ||||||||||||||||||||||||||||
| AutoTech Ventures Management I, LLC (3)(4)(5) | Asset Management & Custody Banks | |||||||||||||||||||||||||||||||
| Venture capital investing in automotive-related companies | ||||||||||||||||||||||||||||||||
| LLC Interests (acquired 12/1/17) | (M) (L3) | 0 | $ | 0 | $ | 100,000 | ||||||||||||||||||||||||||
| Total Unaffiliated Legacy Privately Held Equity and Equity-Related Securities (cost: $0) | $ | 100,000 | ||||||||||||||||||||||||||||||
| Total Investments in Unaffiliated Equity and Equity-Related Securities (cost: $39,568,275) | $ | 35,642,109 | ||||||||||||||||||||||||||||||
| Investments in Non-Controlled Affiliated Equity and Equity-Related Securities (2) - | ||||||||||||||||||||||||||||||||
| 23.1% of net assets at value | ||||||||||||||||||||||||||||||||
| Non-Controlled Affiliated Publicly Traded Equity and Equity-Related Securities - | ||||||||||||||||||||||||||||||||
| 23.0% of net assets at value | ||||||||||||||||||||||||||||||||
comScore, Inc. (3)(6) | Advertising | |||||||||||||||||||||||||||||||
| Provides technology and services that measure audiences, brands and consumer behavior | ||||||||||||||||||||||||||||||||
| Common Stock | (L1) | 400,451 | $ | 13,348,438 | $ | 2,338,634 | ||||||||||||||||||||||||||
Synchronoss Technologies, Inc. (3)(6) | Application Software | |||||||||||||||||||||||||||||||
| Provides white-label cloud storage, messaging and other digital analytic services | ||||||||||||||||||||||||||||||||
| Common Stock | (L1) | 854,788 | 12,933,202 | 8,205,965 | ||||||||||||||||||||||||||||
Common Stock (4)(7) | (M) (L2) | 12,000 | 77,040 | 103,665 | ||||||||||||||||||||||||||||
| 13,010,242 | 8,309,630 | |||||||||||||||||||||||||||||||
| Total Non-Controlled Affiliated Publicly Traded Equity and Equity-Related Securities (cost: $26,358,680) | $ | 10,648,264 | ||||||||||||||||||||||||||||||
The accompanying notes are an integral part of these consolidated financial statements.
F-160
| 180 DEGREE CAPITAL CORP. CONSOLIDATED SCHEDULE OF INVESTMENTS AS OF DECEMBER 31, 2024 | ||||||||||||||||||||||||||||||||
| Method of Valuation (1) | Industry | Shares/Units | Cost | Value | ||||||||||||||||||||||||||||
| Non-Controlled Affiliated Legacy Privately Held Equity and Equity-Related Securities - | ||||||||||||||||||||||||||||||||
| 0.1% of net assets at value | ||||||||||||||||||||||||||||||||
EchoPixel, Inc. (3)(4)(8) | Health Care Equipment | |||||||||||||||||||||||||||||||
| Develops virtual reality 3-D visualization software for life sciences and health care applications | ||||||||||||||||||||||||||||||||
| Series Seed Convertible Preferred Stock (acquired 6/21/13-6/30/14) | (M) (L3) | 4,194,630 | $ | 1,250,000 | $ | 44,044 | ||||||||||||||||||||||||||
| Series Seed-2 Convertible Preferred Stock (acquired 1/22/16) | (M) (L3) | 1,476,668 | 500,000 | 15,505 | ||||||||||||||||||||||||||||
| Series A-2 Convertible Preferred Stock (acquired 3/23/17) | (M) (L3) | 1,471,577 | 350,000 | 15,451 | ||||||||||||||||||||||||||||
| 2,100,000 | 75,000 | |||||||||||||||||||||||||||||||
HALE.life Corporation (3)(4)(8) | Health Care Technology | |||||||||||||||||||||||||||||||
| Develops a platform to facilitate precision health and medicine | ||||||||||||||||||||||||||||||||
| Common Stock (acquired 3/1/16) | (I) (L3) | 1,000,000 | $ | 10 | $ | 0 | ||||||||||||||||||||||||||
| Series Seed-1 Convertible Preferred Stock (acquired 3/28/17) | (I) (L3) | 11,000,000 | 1,896,920 | 0 | ||||||||||||||||||||||||||||
| Series Seed-2 Convertible Preferred Stock (acquired 12/28/18) | (I) (L3) | 12,083,132 | 2,500,000 | 0 | ||||||||||||||||||||||||||||
| 4,396,930 | 0 | |||||||||||||||||||||||||||||||
| Investments in Non-Controlled Affiliated Equity and Equity-Related Securities (2) - | ||||||||||||||||||||||||||||||||
| 23.1% of net assets at value (cont.) | ||||||||||||||||||||||||||||||||
| Total Non-Controlled Affiliated Legacy Privately Held Equity and Equity-Related Securities (cost: $6,496,930) | $ | 75,000 | ||||||||||||||||||||||||||||||
| Total Investments in Non-Controlled Affiliated Equity and Equity-Related Securities (cost: $32,855,610) | $ | 10,723,264 | ||||||||||||||||||||||||||||||
The accompanying notes are an integral part of these consolidated financial statements.
F-161
| 180 DEGREE CAPITAL CORP. CONSOLIDATED SCHEDULE OF INVESTMENTS AS OF DECEMBER 31, 2024 | ||||||||||||||||||||||||||||||||
| Method of Valuation (1) | Industry | Shares/Units | Cost | Value | ||||||||||||||||||||||||||||
| Total Investments in Publicly Traded Equity and Equity-Related Securities, Money Market Funds, and Legacy Privately Held Equity and Equity-Related Securities (cost: $72,423,885) | $ | 46,365,373 | ||||||||||||||||||||||||||||||
| Derivative Securities - | ||||||||||||||||||||||||||||||||
| 0.8% of net assets at value | ||||||||||||||||||||||||||||||||
Unaffiliated Derivative Securities (2) - | ||||||||||||||||||||||||||||||||
| 0.8% of net assets at value | ||||||||||||||||||||||||||||||||
Potbelly Corporation (3)(6) | Restaurants | |||||||||||||||||||||||||||||||
| Operates a chain of sandwich shops | ||||||||||||||||||||||||||||||||
| Warrants for the Purchase of Common Stock expiring 2/12/26 (acquired 2/10/21) | (I) (L3) | 80,605 | $ | 224,849 | $ | 351,558 | ||||||||||||||||||||||||||
| Total Unaffiliated Derivative Securities (cost: $224,849) | $ | 351,558 | ||||||||||||||||||||||||||||||
Non-Controlled Affiliated Derivative Securities (2) - | ||||||||||||||||||||||||||||||||
| 0.0% of net assets at value | ||||||||||||||||||||||||||||||||
Synchronoss Technologies, Inc. (3)(4)(6)(7) | Application Software | |||||||||||||||||||||||||||||||
| Provides white-label cloud storage, messaging and other digital analytic services | ||||||||||||||||||||||||||||||||
| Stock Options for Common Stock Expiring 12/4/30 (acquired 12/4/23) | (I) (L3) | 3,334 | $ | — | $ | 22,150 | ||||||||||||||||||||||||||
| Total Non-Controlled Affiliated Derivative Securities (cost: $0) | $ | 22,150 | ||||||||||||||||||||||||||||||
| Total Derivative Securities (cost: $224,849) | $ | 373,708 | ||||||||||||||||||||||||||||||
| Total Investments (cost: $72,648,734) | $ | 46,739,081 | ||||||||||||||||||||||||||||||
Other Financial Instruments (9) - | ||||||||||||||||||||||||||||||||
Unaffiliated Rights to Payments (Illiquid) (2) - | ||||||||||||||||||||||||||||||||
The accompanying notes are an integral part of these consolidated financial statements.
F-162
| 180 DEGREE CAPITAL CORP. CONSOLIDATED SCHEDULE OF INVESTMENTS AS OF DECEMBER 31, 2024 | ||||||||||||||||||||||||||||||||
| Method of Valuation (1) | Industry | Shares/Units | Cost | Value | ||||||||||||||||||||||||||||
| 0.2% of net assets at value | ||||||||||||||||||||||||||||||||
Rights to Milestone Payments from Acquisition of TARA Biosystems, Inc. (acquired 4/1/22) (3)(4)(8)(10) | (I) (L3) | Pharmaceuticals | $ | 0 | $ | 0 | $ | 70,456 | ||||||||||||||||||||||||
| Total Unaffiliated Rights to Payments (cost: $0) | $ | 70,456 | ||||||||||||||||||||||||||||||
| Total Investments in Publicly Traded and Privately Held Equity, Money Market Fund and Equity-Related Securities, Derivative Securities and Other Financial Instruments (cost: $72,648,734) | $ | 46,809,537 | ||||||||||||||||||||||||||||||
The accompanying notes are an integral part of these consolidated financial statements.
F-163
180 DEGREE CAPITAL CORP.
NOTES TO CONSOLIDATED SCHEDULE OF INVESTMENTS AS OF DECEMBER 31, 2024
Notes to Consolidated Schedule of Investments
(a)See Note 2. Summary of Significant Accounting Policies: Portfolio Investment Valuation.
(b)Investments in unaffiliated securities consist of investments in which the Company owns less than five percent of the voting shares of the portfolio company. Investments in non-controlled affiliated securities consist of investments in which the Company owns five percent or more, but less than 25 percent, of the voting shares of the portfolio company, or where the Company controls one or more seats on the portfolio company’s board of directors but do not control the company. Investments in controlled affiliated securities consist of investments in which the Company owns 25 percent or more of the outstanding voting rights of the portfolio company or otherwise control the company, including control of a majority of the seats on the board of directors, or more than 25 percent of the seats on the board of directors, with no other entity or person in control of more director seats than us.
(c)Represents a non-income producing investment. Investments that have not paid dividends or interest within the last 12 months or are on non-accrual status for at least 12 consecutive months are considered to be non-income producing.
(d)The Company is subject to legal restrictions on the sale of all or a portion of our investment(s) in this company. The total amount of restricted securities held is $371,271, or 0.8 percent of net assets.
(e)The Company received LLC Interests of 1.25 percent in AutoTech Ventures Management I, LLC (“AutoTech”) pursuant to an Administrative Services Agreement between us and AutoTech and due to us following the termination of a former employee of the Company. These LLC Interests were separate from the compensation received for providing the administrative services under the agreement that were paid in cash. The LLC interests have a capital percentage of 0 percent.
(f)The Company is the Investment Manager of a separately managed account (“SMA”) that owns shares of these portfolio companies. Under our investment management agreement for the SMA, the Company has the right to control the votes of the securities held by the SMA. The Company has voting ownership between 5 percent and 25 percent in these companies directly or when the shares held by us and our SMA are aggregated.
(g)These restricted shares of common stock and stock options for the purchase of common stock were granted to Kevin Rendino in connection with his service as a member of the Board of Directors of Synchronoss Technologies, Inc. Mr. Rendino entered into an assignment and assumption agreement with the Company that transfers all beneficial and voting interest to the Company.
(h)These securities are held by the Company's wholly owned subsidiary, 180 Degree Private Holdings, LLC (“180PH”), which were transferred from the Company to 180PH in the fourth quarter of 2020. The acquisition dates of the securities reflect the dates such securities were obtained by the Company rather than the transfer date.
(i)Other financial instruments are holdings of the Company that do not meet the definition of a security or a derivative.
(j)If all the remaining milestones are met, the Company would receive approximately $2.7 million. There can be no assurance as to how much of the remaining approximately $2.7 million in potential milestone-based payments will ultimately be realized or when they will be realized, if at all.
The accompanying notes are an integral part of these consolidated financial statements.
F-164
180 DEGREE CAPITAL CORP.
NOTES TO CONSOLIDATED FINANCIAL STATEMENTS
NOTE 1. THE COMPANY
180 Degree Capital Corp. (including its wholly owned subsidiaries, the “Company,” “us,” “our” and “we”), withdrew its election to be treated as a business development company on March 30, 2017, and subsequently returned to its prior status as a registered non-diversified closed-end management investment company (“Closed-End Fund” or “CEF”) under the Investment Company Act of 1940 (the “1940 Act”). We operate as an internally managed investment company whereby our officers and employees, under the general supervision of our Board of Directors, conduct our operations. From May 22, 2020 to December 24, 2024, we were also registered with the Securities and Exchange Commission as a Registered Investment Adviser under the Investment Advisers Act of 1940 (the “Advisers Act”).
180 Degree Private Holdings, LLC (“180PH”), is a wholly owned limited liability company that was created in October 2020 to hold certain of the Company's securities of privately held companies. 180PH is consolidated for financial reporting purposes and is a disregarded entity for tax purposes under the Internal Revenue Code (“Code”).
180 Degree Capital BD, LLC (“180BD”) was a 100 percent owned subsidiary of the Company that was sold to an unrelated buyer and the transaction closed in February 2023. 180BD was registered by the Company as a broker-dealer with the Financial Industry Regulatory Authority (“FINRA”) that was formed to provide services to the Company related to fundraising for co-investment funds and not for investment returns. Historically, the Company consolidated 180BD for financial reporting purposes.
The Company was the Managing Member of 180 Degree Capital Management, LLC (“180CM”), a limited liability company formed to facilitate the opportunity for interested investors to co-invest alongside the Company in individual publicly traded portfolio companies. The Company filed a certificate of cancellation for 180CM in November 2024.
As of December 31, 2024, the Company manages approximately $1.9 million in net assets in a separately managed account (“SMA”).
The Company may, in certain cases, receive management fees and carried interest on profits generated on invested capital from any capital under management if and when capital is raised and if and when profits are realized, respectively. The Company did not consolidate the operations of any capital managed in separate series of 180CM, and does not consolidate its separately managed account.
NOTE 2. SUMMARY OF SIGNIFICANT ACCOUNTING POLICIES
The following is a summary of significant accounting policies followed in the preparation of the consolidated financial statements:
Principles of Consolidation. The consolidated financial statements have been prepared in accordance with accounting principles generally accepted in the US (“GAAP”) and Articles 6 and 12 of Regulation S-X of the Securities Exchange Commission (“SEC”) and include the accounts of the Company and its wholly owned subsidiaries. The Company is an investment company following accounting and reporting guidance in Accounting Standards Codification 946. In accordance with GAAP and Regulation S-X under 17 C.F.R. Part 210, the Company may only consolidate its interests in investment company subsidiaries and controlled operating companies whose business consists of providing services to the Company. Prior to February 2023, our wholly owned subsidiary, 180BD, was a controlled operating company that provided services to us and was, therefore, consolidated. 180PH is a controlled operating company that provide services to us and is, therefore, consolidated. All significant intercompany accounts and transactions were eliminated in the consolidated financial statements.
Use of Estimates. The preparation of the consolidated financial statements in conformity with GAAP requires management to make estimates and assumptions that affect the reported amounts of assets and liabilities
F-165
and contingent assets and liabilities and the reported amounts of revenues and expenses. Actual results could differ from these estimates, and the differences could be material. The most significant estimates relate to the fair valuations of our investments.
Portfolio Investment Valuations. Investments are stated at “value” as defined in the 1940 Act and in the applicable regulations of the SEC and in accordance with GAAP. Value, as defined in Section 2(a)(41) of the 1940 Act, is (i) the market price for those securities for which a market quotation is readily available and (ii) the fair value as determined in good faith by, or under the direction of, the Board of Directors for all other assets. The Valuation Committee, comprised of all of the independent Board members, is responsible for determining the valuation of the Company’s assets within the guidelines established by the Board of Directors, pursuant with SEC Rule 2a-5. The Valuation Committee receives information and recommendations from management. The Company may from time to time use an independent valuation firm to review select portfolio company valuations on an as needed basis. The independent valuation firm, when engaged by the Company, does not provide independent valuations. The fair values assigned to these investments are based on available information and do not necessarily represent amounts that might ultimately be realized when that investment is sold, as such amounts depend on future circumstances and cannot reasonably be determined until the individual investments are actually liquidated or become readily marketable. The Valuation Committee values the Company's investment assets as of the end of each calendar quarter and as of any other time requested by the Board of Directors.
Accounting Standards Codification Topic 820, “Fair Value Measurements,” (“ASC 820”) defines fair value as the price that would be received to sell an asset or paid to transfer a liability in an orderly transaction between market participants at the measurement date (exit price). It applies fair value terminology to all valuations whereas the 1940 Act applies market value terminology to readily marketable assets and fair value terminology to other assets.
The main approaches to measuring fair value utilized are the market approach, the income approach and the hybrid approach.
•Market Approach (M): The market approach focuses on inputs and not techniques. The market approach may use quantitative inputs such as prices and other relevant information generated by market transactions involving identical or comparable assets or liabilities and the values of market multiples derived from a set of comparable companies. The market approach may also use qualitative inputs such as progress toward milestones, the long-term potential of the business, current and future financing requirements and the rights and preferences of certain securities versus those of other securities. The selection of the relevant inputs used to derive value under the market approach requires judgment considering factors specific to the significance and relevance of each input to deriving value.
•Income Approach (I): The income approach focuses on techniques and not inputs. The income approach uses valuation techniques to convert future amounts (for example, revenue, cash flows or earnings) to a single present value amount (discounted). The measurement is based on the value indicated by current market expectations about those future amounts. Those valuation techniques include present value techniques; option-pricing models, such as the Black-Scholes-Merton formula (a closed-form model) and a binomial model (a lattice model), which incorporate present value techniques; and the multi-period excess earnings method, which is used to measure the fair value of certain assets.
•Hybrid Approach (H): The hybrid approach uses elements of both the market approach and the income approach. The hybrid approach calculates values using the market and income approach, individually. The resulting values are then distributed among the share classes based on probability of exit outcomes.
ASC Topic 820 classifies the inputs used to measure fair value by these approaches into the following hierarchy:
•Level 1 (L1): Unadjusted quoted prices in active markets for identical assets or liabilities;
•Level 2 (L2): Inputs other than quoted prices included within Level 1 that are observable for the asset or liability, either directly or indirectly. These include quoted prices in active markets for similar assets or
F-166
liabilities, or quoted prices for identical or similar assets or liabilities in markets that are not active, or inputs other than quoted prices that are observable for the asset or liability, either directly or indirectly, for substantially the full term of the financial instrument. Level 2 inputs are in those markets for which there are few transactions, the prices are not current, little public information exists or instances where prices vary substantially over time or among brokered market makers; and
•Level 3 (L3): Inputs to the valuation methodology are unobservable and significant to the fair value measurement. Unobservable inputs are those inputs that reflect our own assumptions that market participants would use to price the asset or liability based upon the best available information.
Financial assets and liabilities are classified in their entirety based on the lowest level of input that is significant to the fair value measurement and are not necessarily an indication of risks associated with the investment.
As of December 31, 2024, our financial statements include investments fair valued by the Board of Directors of $722,829. The fair values were determined in good faith by, or under the direction of, the Board of Directors. The fair value amount includes the values of our investments in legacy privately held companies and rights to future milestone payments, as well as our warrants for the purchase of common stock of Potbelly Corporation, our options for the purchase of common stock of Synchronoss Technologies, Inc., and our restricted common stock of Synchronoss Technologies, Inc.
Cash. Cash includes demand deposits. Cash is carried at cost, which approximates fair value.
Unaffiliated Rights to Payments. At December 31, 2024, the outstanding potential milestone from the acquisition of TARA Biosystems, Inc., by Valo Health, LLC were valued at $70,456. The milestone payments are valued using the probability-adjusted, present value of proceeds from future payments that would be due upon successful completion of certain regulatory milestones. There can be no assurance as to how much of the amounts related to milestone payments that we will ultimately realize or when they will be realized, if at all.
Prepaid Expenses. We include prepaid insurance premiums in “Prepaid expenses.” Prepaid insurance premiums are recognized over the term of the insurance contract and are included in “Insurance” in the Company's Consolidated Statement of Operations.
Property and Equipment. Property and equipment are included in “Other assets” and are carried at $3,592 at December 31, 2024, representing cost of $229,818, less accumulated depreciation of $226,226. Depreciation is provided using the straight-line method over the estimated useful lives of the property and equipment. We estimate the useful lives to be five to ten years for furniture and fixtures, and three years for computer equipment.
Post-Retirement Plan Liabilities. Until it was terminated on April 27, 2017, the Company provided a Retiree Medical Benefit Plan for employees who met certain eligibility requirements. Until it was terminated on May 5, 2011, the Company also provided an Executive Mandatory Retirement Benefit Plan for certain individuals employed by us in a bona fide executive or high policy-making position. The net periodic post-retirement benefit cost includes service cost and interest cost on the accumulated post-retirement benefit obligation. Unrecognized actuarial gains and losses are recognized as net periodic benefit cost, pursuant to the Company's historical accounting policy in “Salaries, bonus and benefits” in the Company's Consolidated Statement of Operations. The impact of plan amendments was amortized over the employee's average service period as a reduction of net periodic benefit cost. Unamortized prior service cost was fully amortized during 2017 as a result of the termination of the Retiree Medical Benefit Plan.
Interest Income Recognition. Interest income, including amortization of premium and accretion of discount, is recorded on an accrual basis. When accrued interest is determined not to be recoverable, the Company ceases accruing interest and writes off any previously accrued interest. Write-offs are netted in interest income. Securities are deemed to be non-income producing if investments have not paid dividends or interest within the last 12 months or are on non-accrual status for at least 12 consecutive months. When the fair value of a security that includes PIK interest is less than the accrued interest, the Company may place the security on non-accrued status.
F-167
Board Fees From Portfolio Companies. The Company recognizes revenues from board fees as those services are provided.
Management Fees and Performance Fees/Carried Interest from Managed Funds. The Company may be entitled to receive management fees and performance fees from clients including separately managed accounts (SMAs) and special purpose vehicles (SPVs). When applicable, the Company accrues management fees on SPVs that are to be paid upon liquidation of the entity regardless of performance. Performance fees or carried interest, if any, is paid annually by SMAs based on a fixed percentage of the increase in net assets during the year. Performance fees on SPVs, if any, are generally paid based on the amount of increase in net assets at the time of any distribution of capital above the amount of initial invested capital plus accrued expenses. The timing and payment terms of management fees and performance fees for future client accounts may be different than those of our current SMAs.
The Company does not include accruals for carried interest in the consolidated financial statements until such carried interest is received and/or the Company concludes that it is probable that a reversal of any accrual will not occur. The Company did not earn or accrue any carried interest in the year ended December 31, 2024.
Other Income. The Company may purchase restricted securities issued by publicly traded companies that include provisions that provide for payment of partial liquidated damages in the event the issuer does not meet obligations specified in the purchase agreement or other ancillary documents associated with the transaction. These obligations most commonly are associated with the filing of registration statements and/or being up to date with the filing of the issuer's financial statements with the SEC.
Put and Call Options. The Company may purchase options on publicly traded securities as an investment and/or with the intention of limiting its downside risk. When the Company purchases an option, an amount equal to the premium paid is recorded in the Consolidated Statement of Assets and Liabilities as an investment. The Company may also purchase an option at one price and write/sell an option at another price in a simultaneous transaction referred to as a spread. The amount of these assets is subsequently marked-to-market to reflect the current value of the options. In the event that the options are exercised, the Company would be required to deliver those shares to the counterparty. When the options expire unexercised, the Company realizes a loss on the premium paid, or the difference between the premium paid and the premium received, as applicable.
Rent Expense. The Company currently leases and runs daily operations in approximately 1,250 square feet of office space in Montclair, New Jersey. Either the Company or the landlord may terminate the lease at any time with two months' written notice to either party. On November 17, 2021, the Company amended its month-to-month lease to a lease with annual pricing through December 31, 2024, at an average price during the three years covered by the amendment of approximately $30 per square foot. On June 11, 2024, the Company extended the lease agreement for an additional year, starting January 1, 2025 through December 31, 2025, at a price of approximately $32 per square foot. All other terms and conditions remain in full force and effect.
Realized Gain or Loss and Unrealized Appreciation or Depreciation of Portfolio Investments. Realized gain or loss is recognized when an investment is disposed of and is computed as the difference between the Company's cost basis in the investment at the disposition date and the net proceeds received from such disposition. Realized gain or loss on investment transactions are determined by specific identification. Unrealized appreciation or depreciation is computed as the difference between the fair value of the investment and the cost basis of such investment.
Income Taxes. As discussed in Note 9. Income Taxes, the Company did not qualify as a regulated investment company (“RIC”) under Subchapter M of the Code in 2024, and will therefore be taxed as a C-Corporation in 2024. The Company did not accrue for any income taxes as of December 31, 2024 as it did not generate ordinary income. The Company has capital loss carryforwards that can be used to offset net realized capital gains. The Company also has operating loss carryforwards that can be used to offset operating income and net realized capital gains in years when it fails to qualify as a RIC. The Company recognizes interest and penalties in income tax expense. See Note 9. Income Taxes for further discussion.
F-168
Foreign Currency Translation. The accounting records of the Company are maintained in U.S. dollars. All assets and liabilities denominated in foreign currencies are translated into U.S. dollars based on the rate of exchange of such currencies against U.S. dollars on the date of valuation. If Company has assets denominated in foreign currencies, it does not isolate the portion of the results of operations that arises from changes in foreign currency rates on investments held on its Consolidated Statement of Operations.
Securities Transactions. Securities transactions are accounted for on the date the transaction for the purchase or sale of the securities is entered into by the Company (i.e., trade date). Securities transactions outside conventional channels, such as private transactions, are recorded as of the date the Company obtains the right to demand the securities purchased or to collect the proceeds from a sale and incurs the obligation to pay for the securities purchased or to deliver the securities sold.
Concentration of Credit Risk. The Company places its cash with financial institutions and, at times, cash held in depository accounts may exceed the Federal Deposit Insurance Corporation's insured limit and is subject to the credit risk of such institutions to the extent it exceeds such limit.
Recent Accounting Pronouncements and Adoptions. On November 4, 2024, the Financial Accounting Standards Board (“FASB”) issued ASU 2024-03, “Income Statement—Reporting Comprehensive Income—Expense Disaggregation Disclosures (Subtopic 220-40): Disaggregation of Income Statement Expenses.” This ASU requires that certain costs to be disclosed in each relevant expense captions. The guidance is effective for fiscal years, including interim periods within those fiscal years, beginning after December 15, 2026, and early adoption is permitted. This ASU is not expected to have a material impact on the Company's consolidated financial statements.
On June 30, 2022, the FASB issued ASU 2022-03, “Fair Value Measurement (Topic 820): Fair Value Measurement of Equity Securities Subject to Contractual Sale Restrictions.” This ASU clarified that a contractual restriction on the sale of an equity security is not considered part of the unit of account of the equity security and, therefore, is not considered in measuring fair value. The guidance was effective for fiscal years, including interim periods within those fiscal years, beginning after December 15, 2023. This ASU was adopted and did not have a material impact on the Company's consolidated financial statements.
NOTE 3. BUSINESS RISKS AND UNCERTAINTIES
Our business activities contain elements of risk. We consider the principal types of market risk to be valuation risk, diversification risk, interest rate risk and foreign currency risk. Although we are risk-seeking rather than risk-averse in our investments, we consider the management of risk to be essential to our business.
Investment Objective
Our investment objective is to generate capital appreciation and current income from investments and investment-related activities such as managed funds and accounts.
Investment Strategy
Our investment strategy on future new investments is focused on generating capital appreciation and current income from investments in what we believe are deeply undervalued, small publicly traded companies where we believe we can positively impact the business and valuation through constructive activism. Historically, our investment strategy was to achieve long-term capital appreciation investing in venture capital investments. While we continue to provide such resources to our existing legacy portfolio companies, we no longer make venture capital investments. We classify our legacy portfolio companies as Legacy Privately Held Equity and Equity-Related Securities.
We believe we combine new perspectives with the historical knowledge and experience of managing the current portfolio. Our investment approach is comprised of a patient examination of available opportunities through due diligence and close involvement with management of our portfolio companies. We invest our capital directly into portfolio companies or through purchases of securities of publicly traded companies directly and through open-market purchases. We may seek to invest our capital alongside capital from other investors through that we control.
F-169
We have discretion in the investment of our capital to achieve our objectives by investing in various types of assets, and we do not currently limit our investments to any security type. Our investments may include, among other asset types: equity, equity-related securities (including warrants and options) and debt with equity features from either private or public issuers; debt obligations of all types having varying terms with respect to security or credit support, subordination, purchase price, interest payments and maturity; foreign securities; and miscellaneous investments.
Investment Policies
Fundamental policies may not be changed without the approval of the holders of a majority of our voting securities, as defined in the 1940 Act. As a matter of fundamental policy, the Company will not:
(a)Issue senior securities, borrow money from banks, brokers or other lenders, or engage in transactions involving the issuance by us of “senior securities” representing indebtedness, except to the extent permitted under the 1940 Act or the rules, regulations or interpretations thereof.
(b)Underwrite securities of other issuers, except insofar as we may be deemed an underwriter under the Securities Act of 1933, as amended (the “Securities Act”), in connection with the disposition of our portfolio securities. We may invest in restricted securities (those that must be registered under the Securities Act before they may be offered or sold to the public) to the extent permitted by the 1940 Act or the rules, regulations or interpretations thereof.
(c)Invest more than 25% of our total assets in the securities of companies or entities engaged in any one industry, or group of industries. This limitation does not apply to investment in the securities of the U.S. Government, its agencies or instrumentalities.
(d)Purchase or sell real estate or interests in real estate (except that we may (a) purchase and sell real estate or interests in real estate in connection with the orderly liquidation of investments, or in connection with foreclosure on collateral, or (b) own the securities of companies that are in the business of buying, selling or developing real estate).
(e)Purchase or sell commodities or commodity contracts, but we may purchase and sell foreign currency and enter into foreign currency forward contracts, and may engage in other transactions in financial instruments, in each case to the extent permitted under the Company's investment policies as in effect from time to time.
(f)Make loans of money or securities to other persons, except through purchasing fixed-income securities or other debt instruments, lending portfolio securities or entering into repurchase agreements in a manner consistent with our investment policies. With respect to these investment restrictions, if a percentage restriction is adhered to at the time of entering into the investment or transaction, a later change in percentage resulting from a change in the values of investments or the value of our total assets, unless otherwise stated or required by law, will not constitute a violation of the restriction or policy.
Valuation Risk
We are currently focused on investing in what we believe are deeply undervalued microcapitalization publicly traded companies. Our publicly traded and public company-related securities account for approximately 100 percent of the value of our portfolio of investments. Although these companies are publicly traded, their stock may not trade at high volumes and/or we may own a significant portion of a company's outstanding stock, which may restrict our ability to sell our positions in an orderly fashion and prices at which sales can be made may be volatile and materially different than the closing prices of such positions at each financial statement date. We may also be subject to restrictions on transfer and/or other lock-up provisions after these companies complete public offerings and/or if we invest in unregistered securities of public companies. Many of our legacy privately held and publicly traded companies tend to not have attained profitability, and many of these companies also lack management depth and have limited or no history of operations. Because of the speculative nature of our
F-170
investments and the lack of a liquid market for and restrictions on transfers of privately held investments, there is greater risk of loss relative to traditional marketable investment securities.
Approximately 2 percent of our portfolio, excluding money market investments, was fair valued and comprised of securities of legacy privately held companies and rights to potential future milestone payments, as well as our warrants of Potbelly Corporation and options and restricted common stock of Synchronoss Technologies, Inc. which are securities of publicly traded companies. Because there is typically no public or readily ascertainable market for our securities of our legacy privately held companies, the valuation of the securities in that portion of our portfolio is determined in good faith by our Valuation Committee, which is comprised of all of the independent members of our Board of Directors. The values are determined in accordance with our Valuation Procedures and are subject to significant estimates and judgments. The fair value of the securities in our portfolio may differ significantly from the values that would be placed on these securities if a ready market for the securities existed. Additionally, inputs may become available after a financial statement date that could result in a material change in value at a future financial statement date from the value reported in the current financial statements. Any changes in valuation are recorded in the Company's Consolidated Statement of Operations as “Change in unrealized appreciation (depreciation) on investments.” Changes in valuation of any of our investments in privately held companies from one period to another may be significant.
Diversification Risk
While we are subject to certain diversification requirements regarding the concentration of investments in any one industry or group of industries at the time of each investment, we do not choose investments based on a strategy of diversification. We also do not rebalance the portfolio should one of our portfolio companies increase in value substantially relative to the rest of the portfolio. Therefore, the value of our portfolio may be more vulnerable to microeconomic events affecting a single sector, industry or portfolio company and to general macroeconomic events that may be unrelated to our portfolio companies. These factors may subject the value of our portfolio to greater volatility than a company that follows a diversification strategy. As of December 31, 2024, our largest 10 investments by value, excluding money market investments, accounted for approximately 98 percent of the value of our investment portfolio. Our largest three investments, by value, excluding money market investments, Potbelly Corporation, Synchronoss Technologies, Inc., and Brightcove, Inc., accounted for approximately 25 percent, 20 percent and 11 percent, respectively, of our investment portfolio at December 31, 2024. Potbelly Corporation, Synchronoss Technologies, Inc. and Brightcove, Inc. are publicly traded companies.
Interest Rate Risk
Interest rate sensitivity refers to the change in earnings that may result from changes in the level of interest rates. We may invest in both short- and long-term U.S. government and agency securities. To the extent that we invest in short- and long-term U.S. government and agency securities, changes in interest rates result in changes in the value of these obligations that result in an increase or decrease of our net asset value. The level of interest rate risk exposure at any given point in time depends on the market environment, the expectations of future price and market movements, and the quantity and duration of long-term U.S. government and agency securities held by the Company, and it will vary from period to period.
In addition, market interest rates for high-yield corporate debt may be an input in determining value of our investments in debt securities of privately held and publicly traded companies. Significant changes in these market rates could affect the value of our debt securities as of the valuation date of measurement of value. While we do not currently have any investments in debt securities with floating interest rates, investment income in such securities should we acquire them in the future could be adversely affected by changes in interest rates.
Foreign Currency Risk
We may from time to time invest in securities that are denominated in foreign currencies. As of December 31, 2024, our investments were not subject to foreign currency risk as they were all denominated in U.S. dollars.
F-171
NOTE 4. FAIR VALUE OF INVESTMENTS
At December 31, 2024, our financial assets valued at fair value were categorized as follows in the fair value hierarchy:
| Fair Value Measurement at Reporting Date Using: | ||||||||||||||||||||||||||
| Description | Unadjusted Quoted Prices in Active Markets for Identical Assets (Level 1) | Significant Other Observable Inputs (Level 2) | Significant Unobservable Inputs (Level 3) | December 31, 2024 | ||||||||||||||||||||||
| Publicly Traded Equity and Equity-Related Securities: | ||||||||||||||||||||||||||
| Common Stock | $ | 40,086,708 | $ | 103,665 | $ | 0 | $ | 40,190,373 | ||||||||||||||||||
| Money Market Mutual Funds - Institutional Class Shares | 6,000,000 | 0 | 0 | 6,000,000 | ||||||||||||||||||||||
| Warrants/Stock Options | 0 | 0 | 373,708 | 373,708 | ||||||||||||||||||||||
| Legacy Privately Held Equity and Equity-Related Securities: | ||||||||||||||||||||||||||
| Preferred Stock | $ | 0 | $ | 0 | $ | 75,000 | $ | 75,000 | ||||||||||||||||||
| Common Stock | 0 | 0 | 0 | 0 | ||||||||||||||||||||||
| LLC Interests | 0 | 0 | 100,000 | 100,000 | ||||||||||||||||||||||
| Total Investments: | $ | 46,086,708 | $ | 103,665 | $ | 548,708 | $ | 46,739,081 | ||||||||||||||||||
| Other Financial Instruments: | ||||||||||||||||||||||||||
| Rights to Milestone Payments | $ | 0 | $ | 0 | $ | 70,456 | $ | 70,456 | ||||||||||||||||||
| Total Financial Assets: | $ | 46,086,708 | $ | 103,665 | $ | 619,164 | $ | 46,809,537 | ||||||||||||||||||
F-172
Significant Unobservable Inputs
The table below presents the valuation technique and quantitative information about the significant unobservable inputs utilized by the Company in the fair value measurements of Level 3 assets. Unobservable inputs are those inputs for which little or no market data exists and, therefore, require an entity to develop its own assumptions.
| Value as of December 31, 2024 | Valuation Approach(es) | Unobservable Input(s) | Range(s) (Weighted Average(a)) | |||||||||||||||||||||||
| Volatility | 43.6% - 79.9% (45.7%) | |||||||||||||||||||||||||
| Warrants / Options | $ | 373,708 | Income Approach | Time to Exit (Years) | 1.1 - 5.9 (1.4) | |||||||||||||||||||||
| Preferred Stock | 0 | Income Approach | Public Comparable Adjustment (Including Non-Performance Risk) | -100.0% (0.0%) | ||||||||||||||||||||||
| Preferred Stock | 75,000 | Market Approach | Bid/Ask | $75,000 ($75,000) | ||||||||||||||||||||||
| Common Stock | 0 | Income Approach | Public Comparable Adjustment (Including Non-Performance Risk) | -100.0% (-100.0%) | ||||||||||||||||||||||
| LLC Profit Interests | 100,000 | Market Approach | Bid/Ask | $100,000 ($100,000) | ||||||||||||||||||||||
| Probability of Achieving Independent Milestones | 5.0% (5.0%) | |||||||||||||||||||||||||
| Probability of Achieving Dependent Milestones | 2.4% - 3.7% (3.1%) | |||||||||||||||||||||||||
| Rights to Payments | 70,456 | Income Approach | Time to Cash Flows (Years) | 2.5 - 4.5 (3.5) | ||||||||||||||||||||||
| Total | $ | 619,164 | ||||||||||||||||||||||||
_______________
(a)Weighted average based on fair value at December 31, 2024.
Valuation Methodologies and Inputs for Level 3 Assets
The following sections describe the valuation techniques and significant unobservable inputs used to measure Level 3 assets.
Preferred Stock, LLC Interests, and Common Stock
Preferred stock, LLC interests, and common stock are valued by either a market, income or hybrid approach using internal models with inputs, most of which are not market observable. Common inputs for valuing Level 3 investments include prices from recently executed private transactions in a company’s securities or unconditional firm offers, revenue multiples of comparable publicly traded companies, merger and acquisition (“M&A”) transactions consummated by comparable companies, discounts for lack of marketability, rights and preferences of the class of securities we own as compared with other classes of securities the portfolio company has issued, particularly related to potential liquidity scenarios of an initial public offering (“IPO”) or an acquisition transaction, estimated time to exit, volatilities of comparable publicly traded companies and management’s best estimate of risk attributable to non-performance risk. Certain securities are valued using the present value of future cash flows. Common inputs for valuing Level 2 investments include adjustment for lack of marketability on
F-173
unregistered securities, and material information released by public companies subsequent to the closing price on date of the valuation.
We may also consider changes in market values for sets of comparable companies when recent private transaction information is not available and/or in consideration of non-performance risk. We define non-performance risk as the risk that the price per share (or implied valuation of a portfolio company) or the effective yield of a debt security of a portfolio company, as applicable, does not appropriately represent the risk that a portfolio company with negative cash flow will be: (a) unable to raise capital, will need to be shut down and will not return our invested capital; or (b) able to raise capital, but at a valuation significantly lower than the implied post-money valuation of the last round of financing. We assess non-performance risk for each private portfolio company quarterly. Our assessment of non-performance risk typically includes an evaluation of the financial condition and operating results of the company, the company's progress towards milestones, and the long-term potential of the business and technology of the company and how this potential may or may not affect the value of the shares owned by us. An increase to the non-performance risk or a decrease in the private offering price of a future round of financing from that of the most recent round would result in a lower fair value measurement and/or a change in the distribution of value among the classes of securities we own.
Option pricing models place a high weighting on liquidation preferences, which means that small differences in how the preferences are structured can have a material effect on the fair value of our securities at the time of valuation and also on future valuations should additional rounds of financing occur with senior preferences. As such, valuations calculated by option pricing models may not increase if 1) rounds of financing occur at higher prices per share, 2) liquidation preferences include multiples on investment, 3) the amount of invested capital is small and/or 4) liquidation preferences are senior to prior rounds of financing. Additionally, an increase in the volatility assumption generally increases the enterprise value calculated in an option pricing model. An increase in the time to exit assumption also generally increases the enterprise value calculated in an option pricing model. Variations in the expected time to exit or expected volatility assumptions have a significant impact on fair value.
Warrants and Stock Options
We use the Black-Scholes-Merton option-pricing model to determine the fair value of warrants and stock options held in our portfolio unless there is a publicly traded active market for such securities or another indication of value such as a sale of the portfolio company or an expectation that we may exercise the security prior to expiration. Option pricing models, including the Black-Scholes-Merton model, require the use of subjective input assumptions, including expected volatility, expected life, expected dividend rate, and expected risk-free rate of return. In the Black-Scholes-Merton model, variations in the expected volatility or expected term assumptions have a significant impact on fair value.
An input to the Black-Scholes-Merton option-pricing model is the value per share of the type of stock for which the warrant is exercisable as of the date of valuation. This input is derived according to the methodologies discussed in “Preferred Stock, Preferred Units, LLC Interests, Common Stock and Common Units.”
Rights to Milestone Payments
Rights to milestone payments are valued using a probability-weighted discounted cash flow model. We are entitled to potential future payments from the acquisition of TARA Biosystems, Inc. by Valo Health, LLC. We assign probabilities to the achievements of the various milestones. Milestones identified as independent milestones can be achieved irrespective of the achievement of other contractual milestones. Dependent milestones are those that can only be achieved after another, or series of other, milestones are achieved. The interest rates used in these models are observable inputs from sources such as the published interest rates for corporate bonds of the acquiring or comparable companies.
Changes in Valuation Approaches
During the year ended December 31, 2024, the valuation approach for EchoPixel, Inc., changed from the Income Approach to the Market Approach owing to the primary input of a bid/ask spread being used as the basis for determining value rather than option pricing models.
F-174
The following chart shows the components of change in the financial assets categorized as Level 3 for the year ended December 31, 2024:
Beginning Balance 1/1/2024 | Total Realized Gains (Loss) Included in Changes in Net Assets | Transfers | Total Unrealized (Depreciation) Appreciation Included in Changes in Net Assets | Investments in Portfolio Companies | Disposals and Settlements | Ending Balance 12/31/2024 | Amount of Total Appreciation (Depreciation) for the Year included in Changes in Net Assets Attributable to the Change in Unrealized Gains or Losses Relating to Assets Still Held at the Reporting Date | |||||||||||||||||||||||||||||||||||||||||||
| Warrants/Stock Options | $ | 480,114 | $ | (112,854) | $ | 0 | $ | 6,448 | $ | 0 | $ | 0 | $ | 373,708 | $ | (106,406) | ||||||||||||||||||||||||||||||||||
| Preferred Stock | 319,975 | (597,307) | 0 | 466,386 | 0 | (114,054) | 75,000 | (126,439) | ||||||||||||||||||||||||||||||||||||||||||
| Common Stock | 15,091 | (108,258) | 0 | 93,167 | 0 | 0 | 0 | 0 | ||||||||||||||||||||||||||||||||||||||||||
| LLC Interests | 150,000 | 0 | 0 | (50,000) | 0 | 0 | 100,000 | (50,000) | ||||||||||||||||||||||||||||||||||||||||||
| Rights to Milestone Payments | 1,356,391 | 161,512 | 0 | (136,136) | 0 | (1,311,311) | 70,456 | (136,137) | ||||||||||||||||||||||||||||||||||||||||||
| Total | $ | 2,321,571 | $ | (656,907) | $ | 0 | $ | 379,865 | $ | 0 | $ | (1,425,365) | $ | 619,164 | $ | (418,982) | ||||||||||||||||||||||||||||||||||
_______________
(a)Represents gross realized gains or gross realized losses.
F-175
NOTE 5. INDUSTRY DIVERSIFICATION
The following table shows the percentage of our net assets invested by industry, other than money market investments, as of December 31, 2024.
| Industry | Value as of December 31, 2024 | % of Net Assets | Value as of December 31, 2024 | % of Net Assets | ||||||||||||||||||||||
| Advertising | $ | 2,338,634 | 5.0% | |||||||||||||||||||||||
| Unaffiliated Portfolio Companies | $ | 0 | 0.0% | |||||||||||||||||||||||
| Non-Controlled Affiliated Portfolio Companies | 2,338,634 | 5.0% | ||||||||||||||||||||||||
| Application Software | 8,331,780 | 18.0% | ||||||||||||||||||||||||
| Unaffiliated Portfolio Companies | 0 | 0.0% | ||||||||||||||||||||||||
| Non-Controlled Affiliated Portfolio Companies | 8,331,780 | 18.0% | ||||||||||||||||||||||||
| Asset Management & Custody Banks | 100,000 | 0.2% | ||||||||||||||||||||||||
| Unaffiliated Portfolio Companies | 100,000 | 0.2% | ||||||||||||||||||||||||
| Non-Controlled Affiliated Portfolio Companies | 0 | 0.0% | ||||||||||||||||||||||||
| Communications Equipment | 2,703,293 | 5.8% | ||||||||||||||||||||||||
| Unaffiliated Portfolio Companies | 2,703,293 | 5.8% | ||||||||||||||||||||||||
| Non-Controlled Affiliated Portfolio Companies | 0 | 0.0% | ||||||||||||||||||||||||
| Construction Machinery & Heavy Trucks | 1,016,800 | 2.2% | ||||||||||||||||||||||||
| Unaffiliated Portfolio Companies | 1,016,800 | 2.2% | ||||||||||||||||||||||||
| Non-Controlled Affiliated Portfolio Companies | 0 | 0.0% | ||||||||||||||||||||||||
| Electronic Manufacturing Services | 1,847,498 | 4.0% | ||||||||||||||||||||||||
| Unaffiliated Portfolio Companies | 1,847,498 | 4.0% | ||||||||||||||||||||||||
| Non-Controlled Affiliated Portfolio Companies | 0 | 0.0% | ||||||||||||||||||||||||
| Health Care Equipment | 75,000 | 0.2% | ||||||||||||||||||||||||
| Unaffiliated Portfolio Companies | 0 | 0.0% | ||||||||||||||||||||||||
| Non-Controlled Affiliated Portfolio Companies | 75,000 | 0.2% | ||||||||||||||||||||||||
| Health Care Technology | 0 | 0.0% | ||||||||||||||||||||||||
| Unaffiliated Portfolio Companies | 0 | 0.0% | ||||||||||||||||||||||||
| Non-Controlled Affiliated Portfolio Companies | 0 | 0.0% | ||||||||||||||||||||||||
| Interactive Media & Services | 1,330,609 | 2.9% | ||||||||||||||||||||||||
| Unaffiliated Portfolio Companies | 1,330,609 | 2.9% | ||||||||||||||||||||||||
| Non-Controlled Affiliated Portfolio Companies | 0 | 0.0% | ||||||||||||||||||||||||
| Internet Services & Infrastructure | 4,583,073 | 9.9% | ||||||||||||||||||||||||
| Unaffiliated Portfolio Companies | 4,583,073 | 9.9% | ||||||||||||||||||||||||
| Non-Controlled Affiliated Portfolio Companies | 0 | 0.0% | ||||||||||||||||||||||||
| Pharmaceuticals | 70,456 | 0.2% | ||||||||||||||||||||||||
| Unaffiliated Portfolio Companies | 70,456 | 0.2% | ||||||||||||||||||||||||
| Non-Controlled Affiliated Portfolio Companies | 0 | 0.0% | ||||||||||||||||||||||||
| Restaurants | 10,630,719 | 22.9% | ||||||||||||||||||||||||
| Unaffiliated Portfolio Companies | 10,630,719 | 22.9% | ||||||||||||||||||||||||
| Non-Controlled Affiliated Portfolio Companies | 0 | 0.0% | ||||||||||||||||||||||||
| Steel | 4,223,245 | 9.1% | ||||||||||||||||||||||||
| Unaffiliated Portfolio Companies | 4,223,245 | 9.1% | ||||||||||||||||||||||||
| Non-Controlled Affiliated Portfolio Companies | 0 | 0.0% | ||||||||||||||||||||||||
| Technology Hardware, Storage & Peripherals | 3,558,430 | 7.7% | ||||||||||||||||||||||||
| Unaffiliated Portfolio Companies | 3,558,430 | 7.7% | ||||||||||||||||||||||||
| Non-Controlled Affiliated Portfolio Companies | 0 | 0.0% | ||||||||||||||||||||||||
| Total | $ | 40,809,537 | $ | 38,962,039 | ||||||||||||||||||||||
F-176
NOTE 6. DERIVATIVES
During the year ended December 31, 2024, the Company did not purchase or sell any derivative securities. The Company was assigned all economic benefit for options for the purchase of Common Stock and restricted stock units of Synchronoss Technologies, Inc., that were issued to Kevin M. Rendino, Chairman, Chief Executive Officer and Portfolio Manager of the Company for his service on the Board of Directors of Synchronoss Technologies.
The following table presents the effect of derivatives held during the year ended December 31, 2024, along with the respective location in the consolidated financial statements.
CONSOLIDATED STATEMENT OF ASSETS AND LIABILITIES:
| Assets | Liabilities | |||||||||||||||||||||||||
| Derivatives | Location | Fair Value | Location | Fair Value | ||||||||||||||||||||||
| Warrants for the purchase of Common Stock of Potbelly Corporation expiring 2/12/26 (acquired 2/10/21) | Investments | $ | 351,558 | -- | -- | |||||||||||||||||||||
| Stock Options for the purchase of Common Stock of Synchronoss Technologies, Inc. expiring 12/4/30 (acquired 12/4/23) | Investments | 22,150 | -- | -- | ||||||||||||||||||||||
CONSOLIDATED STATEMENT OF OPERATIONS:
| Derivatives | Location | Net Realized Gain (Loss) | Net Change in Unrealized Appreciation (Depreciation) | |||||||||||||||||
| Warrants for the purchase of Common Stock of Potbelly Corporation expiring 2/12/26 | Net Realized Gain (Loss) and Unrealized Appreciation (Depreciation) on Investments | $ | 0 | $ | (115,927) | |||||||||||||||
| Warrants for the purchase of Common Stock of Magnolia Neurosciences Corporation expiring 8/3/28 | Net Realized Gain (Loss) and Unrealized Appreciation (Depreciation) on Investments | (112,854) | 112,854 | |||||||||||||||||
| Stock Options for the purchase of Common Stock of Synchronoss Technologies, Inc. expiring 12/4/30 | Net Realized Gain (Loss) and Unrealized Appreciation (Depreciation) on Investments | 0 | 9,521 | |||||||||||||||||
NOTE 7. OFFICERS' AND BOARD OF DIRECTORS' COMPENSATION
The aggregate compensation (salaries, 401(k) employer match, medical and dental benefits) paid by the Company during the year ended December 31, 2024, to its officers amounted to approximately $1.8 million. As of December 31, 2024, there is no accrual for deferred bonuses.
The aggregate compensation paid by the Company to the independent members of its Board of Directors during the year ended December 31, 2024 was $232,500.
Certain officers and directors currently and may in the future serve as members of the board of directors of our portfolio companies, including our controlled portfolio companies. These officers and directors do not receive any compensation for serving in such roles directly from the portfolio companies. Any such cash compensation paid by portfolio companies to members of their respective boards of directors is paid directly to the Company. In the case of securities-based compensation (restricted stock or stock options), the officer or director due such compensation assigns all beneficial interest, including but not limited to economic benefit and voting control, to such securities over to the Company.
F-177
NOTE 8. EMPLOYEE BENEFITS
401(k) Plan
We adopted a 401(k) Plan covering substantially all of our employees. Matching contributions to the plan are at the discretion of the Compensation Committee. For the year ended December 31, 2024, the Compensation Committee approved a 100 percent match, which amounted to approximately $122,333.
Medical Benefit Retirement Plan
We historically administered a plan to provide medical and dental insurance for retirees and their spouses who, at the time of their retirement, attained certain years of service with us and a certain age (the “Medical Benefit Retirement Plan”). On April 27, 2017, the Board of Directors terminated the plan. The termination does not affect benefits accrued by former employees who are grandfathered under the former terms of the plan, and the termination of the plan does not affect benefits accrued by certain former employees who were grandfathered under the amended terms of the plan. The Medical Benefit Retirement Plan was terminated for all other employees. At December 31, 2024, we had $352,480 accrued for accumulated post-retirement benefit obligation for certain of these former employees, which is included in “Post-retirement plan liabilities” on the Company's Consolidated Statement of Assets and Liabilities.
The post-retirement plan is unfunded and has no assets. The following disclosures about changes in the benefit obligation under the plan to provide medical and dental insurance for retirees are as of the measurement date of December 31, 2024:
| 2024 | ||||||||
| Accumulated post-retirement benefit obligation - December 31, 2023 | $ | 494,944 | ||||||
| Interest cost | 22,140 | |||||||
| Actuarial gain | (132,342) | |||||||
| Benefits paid | (32,262) | |||||||
| Accumulated post-retirement benefit obligation - December 31, 2024 | $ | 352,480 | ||||||
In accounting for the plan, the assumption made for the discount rate was 5.37 percent for the year ended December 31, 2024. The discount rate was calculated using the December 31, 2024 FTSE Pension Liability Index. The assumed health care cost trend rates is assumed to be 7.5 percent in 2024 grading down to 6.60 percent uniformly over 3 years and then following the Getzen model thereafter for medical and 5 percent per year for dental.
The following is the net periodic post-retirement benefit cost for the year ended December 31, 2024:
| 2024 | ||||||||
| Interest cost on accumulated post-retirement benefit obligation | $ | 22,140 | ||||||
| Amortization of net gain | (19,978) | |||||||
| Net periodic post-retirement benefit cost | $ | 2,162 | ||||||
The Company estimates the following benefits to be paid in each of the following years:
| 2025 | $ | 23,529 | ||||||
| 2026 | 44,400 | |||||||
| 2027 | 45,098 | |||||||
| 2028 | 25,607 | |||||||
| 2029 | 25,890 | |||||||
| 2030 through 2034 | 125,967 | |||||||
F-178
For the year ended December 31, 2024, net unrecognized actuarial loss of $112,364 resulted primarily from the decrease in the discount rate, which represents $132,342 of actuarial gain arising during the year, and from a reclassification adjustment of $19,978 that decreased the net periodic benefit cost for the year.
Executive Mandatory Retirement Benefit Plan
On May 5, 2011, the Board of Directors terminated the Amended and Restated Executive Mandatory Retirement Benefit Plan. Our former President accrued benefits under this plan prior to his retirement, and the termination of this plan had no impact on his accrued benefits. Following his death in October 2024, the Company has no further liabilities regarding these benefits as of December 31, 2024.
NOTE 9. INCOME TAXES
The Company filed for the 1999 tax year to elect treatment as a RIC under Subchapter M of the Code and qualified for the same treatment for the years 2000 through 2015, as well as 2017 and 2019. The Company did not qualify as a RIC under Subchapter M of the Code in 2016, 2018, 2020, 2021, 2022, 2023 and 2024. The Company did not have net taxable income in any of 2016, 2018, 2020, 2021, 2022, 2023 or 2024, so the failure to qualify as a RIC did not result in a tax liability for the Company. Under the Code, if the Company fails to qualify as a RIC three years in a row, it would be subject to taxation as a C-Corporation on built-in gains should realization of those gains occur within five years of the date of the last annual failure even if the Company qualified as a RIC in a future year.
As of December 31, 2024, the Company did not qualify as a RIC, and will therefore be taxed as a C-Corporation in 2024, as a result of failing certain Diversification Tests. The failure to qualify as a RIC in 2024 will be the fifth year in a row that such qualification was not attained. As of December 31, 2024, the Company did not have any built-in gains that would be subject to taxation as a C-Corporation should the Company qualify as a RIC in a future year. Additionally, should the Company qualify as a RIC in a future year, it would be required to distribute any accumulated and undistributed ordinary income and/or undistributed long-term capital gains. As of December 31, 2024, the Company did not have any undistributed ordinary income and/or undistributed long-term capital gains. As a C-Corporation, the Company is permitted to use historical operating loss carryforwards to offset income and gains for tax purposes. As of December 31, 2024, the Company had approximately $91.4 million in operating loss carryforwards that begin to expire in 2026.
The Company's status as a RIC is irrevocable, but qualification is measured both quarterly and annually. Given the Company's status as a RIC and that the ability or inability to use such operating loss carryforwards depends on qualification metrics measured in each taxable year separate from prior years, the Company does not include a deferred tax asset and valuation allowance on deferred tax asset on its Consolidated Statement of Assets and Liabilities.
Under certain circumstances, even if we qualified for Subchapter M treatment for a given year, we might act in a subsequent year to ensure that we would be taxed in that subsequent year as a C Corporation, rather than as a RIC. We will fail to qualify for RIC tax treatment for a taxable year if we do not satisfy the 90 percent Income Test, the Diversification Tests or Annual Distribution Requirement for such year. In the event we do not satisfy the 90 percent Income Test, Diversification Tests or the Annual Distribution Requirement for any taxable year, we will be subject to federal tax with respect to all our taxable income, whether or not distributed. In addition to the corporate tax that would be paid by the Company, all our distributions to shareholders in that situation generally will be taxable as ordinary dividends and generally subject to up to a 30 percent withholding tax if received by a non-U.S. shareholder, although such dividends may qualify for long-term capital gain treatment as “qualified dividends” for U.S. shareholders meeting certain holding period requirements. If the aggregate values of our non-qualifying assets remain below 50 percent of total assets and no non-qualifying asset represents more than 25 percent of the total assets, we will continue to pass the Diversification Tests. Rather than selling portfolio companies that are performing well in order to pass our RIC Diversification Tests, we may opt instead not to qualify as a RIC. We will choose to take such action only if we believe that the result of the action will benefit the Company and our shareholders.
For federal tax purposes, the Company’s 2021 through 2023 tax years remain open for examination by the tax authorities under the normal three-year statute of limitations. Generally, for New Jersey state tax purposes, the
F-179
Company’s 2020 through 2023 tax years remain open for examination by the tax authorities under a four-year statute of limitations. The Company will file its 2024 federal and state taxes.
For the year ended December 31, 2024, the Company recorded a consolidated expense of $153 in federal, state and local income taxes.
The Company updated certain components of capital accounts on a tax-basis in 2024, to reflect a return of capital statement of position (“ROCSOP”) adjustment. This ROCSOP adjustment includes the reclassification of $4,019,686 of accumulated net operating loss into additional paid in capital. This reclassification results primarily from certain non-deductible expenses and net operating loss. There is no impact to net asset value per share as a result of this ROCSOP adjustment. This adjustment may change in future years if the Company does not qualify as a RIC in a given tax year.
As of December 31, 2024, the Company's net unrealized depreciation of $25,839,197 was comprised of unrealized depreciation of $33,964,151 and unrealized appreciation is $8,124,954. The book cost of investments is $72,648,734. As of December 31, 2024, the Company's net tax unrealized depreciation of $24,878,811 was comprised of tax unrealized depreciation of $33,003,765 and tax unrealized appreciation is $8,124,954. The tax cost of investments is $71,688,348. As of December 31, 2024, the Company was in a loss position and therefore did not have any undistributed ordinary income and/or undistributed long-term capital gains.
As of December 31, 2024, we had loss carryforwards in aggregate of $23,460,501, long term. Capital losses for the year ended December 31, 2024, were $3,670,653. As of December 31, 2024, we had cumulative capital losses, which were derived during years when the Company failed as a RIC, totaling $10,438,040, which may be carried back 3 years or carried forward 5 years. As of December 31, 2024, we had post-enactment cumulative capital losses under the provisions of the Regulated Investment Company Modernization Act of 2010 (the “Act”), which were derived during years when the Company qualified as a RIC, totaling $13,022,461. Post-enactment losses have no expiration date.
On December 22, 2017, the Tax Cuts and Jobs Act of 2017 (the “2017 Act”) was enacted, which among other changes, lowered the tax rates for corporations and how future loss carryforwards can be used against future gains. The change of the federal corporate tax rate from 35 percent to 21 percent in the 2017 Act may impact future decisions regarding the issuance of deemed dividends should the Company failed to qualify as a RIC under Subchapter M of the Code and be in a net taxable gain position on investments.
NOTE 10. COMMITMENTS AND CONTINGENCIES
Portfolio companies may seek additional capital in the future and any decision by the Company to not participate in the round of financing could result in outcomes that negatively impact the value of the Company's securities of those portfolio companies.
On June 11, 2024, the Company signed an extension of its lease to December 31, 2025, under substantially similar terms of its original lease. Upon an event of default, the lease provides that the landlord may terminate the lease and require us to pay all rent that would have been payable during the remainder of the lease or until the date the landlord re-enters the premises.
F-180
NOTE 11. PORTFOLIO PURCHASES AND SALES
During the year ended December 31, 2024:
| Company | Purchases/Cost | Sales Proceeds/Distributions | ||||||||||||
| Arena Group Holdings, Inc. | $ | 1,642 | $ | 0 | ||||||||||
| Ascent Industries Co. | 708,237 | 0 | ||||||||||||
| Aviat Networks, Inc. | 2,639,612 | 2,108,445 | ||||||||||||
| Brightcove, Inc. | 2,402,187 | 1,447,727 | ||||||||||||
| Commercial Vehicle Group, Inc. | 589,174 | 121,404 | ||||||||||||
| comScore, Inc. | 1,200,384 | 5,371 | ||||||||||||
| D-Wave Quantum, Inc. | 0 | 774,036 | ||||||||||||
| Hudson Technologies, Inc. | 639,950 | 570,387 | ||||||||||||
| Intevac, Inc. | 383,020 | 145,984 | ||||||||||||
| Lantronix, Inc. | 2,416,520 | 2,530,071 | ||||||||||||
| Mama's Creations, Inc. | 0 | 3,316,833 | ||||||||||||
| Potbelly Corporation | 940,062 | 4,153,834 | ||||||||||||
| Quantum Corporation | 504,633 | 4,028,108 | ||||||||||||
| Rayonier Advanced Materials, Inc. | 0 | 2,003,300 | ||||||||||||
| RF Industries, Ltd. | 82,684 | 0 | ||||||||||||
Synchronoss Technologies, Inc. (1) | 253,404 | 0 | ||||||||||||
Miscellaneous Common Stocks (2) | 58,706 | 45,857 | ||||||||||||
| Total Publicly Traded Equity and Equity-Related Securities Purchases and Sales Proceeds | $ | 12,820,215 | $ | 21,251,357 | ||||||||||
| Rights to Milestone Payments from Acquisition of TARA Biosystems, Inc. | $ | 0 | $ | 1,311,311 | ||||||||||
| Magnolia Neurosciences Corporation | 0 | 119,416 | ||||||||||||
| AutoTech Ventures Management I, LLC | 0 | 3,914 | ||||||||||||
| Total Legacy Privately Held Equity and Equity-Related Securities Cost and Distributions | $ | 0 | $ | 1,434,641 | ||||||||||
| Total Purchases/Cost and Sales Proceeds/Distributions | $ | 12,820,215 | $ | 22,685,998 | ||||||||||
_______________
(1)During the year ended December 31, 2024, the Company received restricted stock units from Synchronoss Technologies, Inc. (“SNCR”) which were issued to the Company for Kevin Rendino's service on the Board of Directors of SNCR. These restricted stock units had a cost basis of $77,040 on the date the restricted stock units vested. Amounts related to restricted stock units are also presented as “Board fee from portfolio companies - stock grant” on the Company's Consolidated Statement of Cash Flows.
(2)Miscellaneous Common Stocks are unrestricted common stocks of publicly traded companies that the Company has not disclosed publicly.
NOTE 12. SHARE REPURCHASE PROGRAM
On August 5, 2024, our Board reauthorized the repurchase of up to $5 million of the Company's common stock within a six-month period from the date of notice to investors, which notice was mailed on or about August 20, 2024. As of December 31, 2024, no repurchases under this reauthorization have occurred.
NOTE 13. RELATED PARTY TRANSACTIONS
We have historically provided managerial assistance to some of our portfolio companies, including serving as members of the board of directors. In certain cases, we receive fees for providing such assistance. During the year ended December 31, 2024, we received fees totaling $65,000 in cash and $77,040 in stock grant, included in the Company's Consolidated Statement of Operations in “Board fees from portfolio companies.”
F-181
NOTE 14. SUBSEQUENT EVENTS
Management of the Company has evaluated subsequent events through the date these financial statements were issued. Based upon this evaluation, management has determined there were no items requiring adjustment of the financial statements. Management does note the following:
On January 17, 2025, the Company announced that it had entered into a definitive agreement (the “Merger Agreement”) to combine with Mount Logan Capital Inc. (“Mount Logan”) in an all-stock transaction (the “Business Combination”). The surviving entity is expected to be a Delaware corporation operating as Mount Logan Capital Inc. (“New Mount Logan”) listed on Nasdaq under the symbol MLCI. In connection with the Business Combination, 180 Degree Capital shareholders will receive proportionate ownership of New Mount Logan determined by reference to 180 Degree Capital's net asset value at closing relative to a valuation of Mount Logan of approximately $67.4 million at signing, subject to certain pre-closing adjustments. The Business Combination is currently expected to close in mid-2025, subject to regulatory and shareholder approvals. There are no changes to the Company's Investment Policies or Investment Objectives in conjunction with the signing of the definitive agreement for the Business Combination. In conjunction with the signing of the Merger Agreement, the Company paid $500,000 for a fairness opinion to Fenchurch Advisory Partners US, Inc. (“Fenchurch”), a financial advisor retained by the special committee of the Board of Directors of the Company. The Company has agreed to pay Fenchurch a net fee of $1,000,000 should the Business Combination close successfully.
F-182
NOTE 15. INVESTMENTS AND ADVANCES TO AFFILIATES - SCHEDULE 12-14
| Name of Issuer | Title of Issue or Nature of Indebtedness (A) | Amount of Dividends or Interest Credited to Income (B) | Net Realized Gain (Loss) | Value as of December 31, 2023 | Gross Additions (C) | Gross Reductions (D) | Net Change in Unrealized Appreciation (Depreciation) | Value as of December 31, 2024 | ||||||||||||||||||||||||||||||||||||||||||
| NON-CONTROLLED AFFILIATED LEGACY PRIVATELY HELD EQUITY & EQUITY-RELATED SECURITIES(E): | ||||||||||||||||||||||||||||||||||||||||||||||||||
| EchoPixel, Inc. | Series Seed Convertible Preferred Stock | $ | 0 | $ | 0 | $ | 105,304 | $ | 0 | $ | (61,260) | $ | (61,260) | $ | 44,044 | |||||||||||||||||||||||||||||||||||
| Series Seed-2 Convertible Preferred Stock | 0 | 0 | 37,818 | 0 | (22,313) | (22,313) | 15,505 | |||||||||||||||||||||||||||||||||||||||||||
| Series A-2 Convertible Preferred Stock | 0 | 0 | 58,317 | 0 | (42,866) | (42,866) | 15,451 | |||||||||||||||||||||||||||||||||||||||||||
| HALE.life Corporation | Common Stock | $ | 0 | $ | 0 | $ | 0 | $ | 0 | $ | 0 | $ | 0 | $ | 0 | |||||||||||||||||||||||||||||||||||
| Series Seed-1 Convertible Preferred Stock | 0 | 0 | 0 | 0 | 0 | 0 | 0 | |||||||||||||||||||||||||||||||||||||||||||
| Series Seed-2 Convertible Preferred Stock | 0 | 0 | 0 | 0 | 0 | 0 | 0 | |||||||||||||||||||||||||||||||||||||||||||
| Total Non-Controlled Affiliated Legacy Privately Held Equity & Equity-Related Securities | $ | 0 | $ | 0 | $ | 201,439 | $ | 0 | $ | (126,439) | $ | (126,439) | $ | 75,000 | ||||||||||||||||||||||||||||||||||||
| NON-CONTROLLED AFFILIATED PUBLICLY TRADED EQUITY & EQUITY-RELATED SECURITIES(E): | ||||||||||||||||||||||||||||||||||||||||||||||||||
| comScore, Inc. | Common Stock | $ | 0 | $ | (21,759) | $ | 5,481,909 | $ | 0 | $ | (3,143,275) | $ | (4,316,529) | $ | 2,338,634 | |||||||||||||||||||||||||||||||||||
| Synchronoss Technologies, Inc. | Common Stock | $ | 0 | $ | 0 | $ | 5,134,732 | $ | 3,071,233 | $ | 0 | $ | 2,894,869 | $ | 8,205,965 | |||||||||||||||||||||||||||||||||||
| Common Stock - Restricted | 0 | 0 | 0 | 103,665 | 0 | 26,625 | 103,665 | |||||||||||||||||||||||||||||||||||||||||||
| Options for Common Stock | 0 | 0 | 12,629 | 9,521 | 0 | 9,521 | 22,150 | |||||||||||||||||||||||||||||||||||||||||||
| $ | 0 | $ | (21,759) | $ | 10,629,270 | $ | 3,184,419 | $ | (3,143,275) | $ | (1,385,514) | $ | 10,670,414 | |||||||||||||||||||||||||||||||||||||
| Total Non- Controlled Affiliated Publicly Traded Equity & Equity-Related Securities | $ | 0 | $ | (21,759) | $ | 10,830,709 | $ | 3,184,419 | $ | (3,269,714) | $ | (1,511,953) | $ | 10,745,414 | ||||||||||||||||||||||||||||||||||||
_______________
(A)Common stock, warrants, options, membership units and, in some cases, preferred stock are generally non-income producing and restricted. The principal amount of debt and the number of shares of common and preferred stock and number of membership units are shown in the accompanying Consolidated Schedule of Investments as of December 31, 2024.
F-183
(B)Represents the total amount of interest or dividends credited/(debited) to income for the portion of the period an investment was a control or affiliate investment, as appropriate. Amounts credited to preferred or common stock represent accrued bridge note interest related to conversions that occurred during the year ended December 31, 2024.
(C)Gross additions include increases in investments resulting from new portfolio investments, paid-in-kind interest or dividends, the amortization of discounts and fees. Gross additions also include net increases in unrealized appreciation or decreases in unrealized depreciation.
(D)Gross reductions include decreases in investments resulting from principal collections related to investment repayments or sales, the amortization of premiums and acquisition costs. Gross reductions also include net increases in unrealized depreciation or decreases in unrealized appreciation.
(E)“Non-Controlled Affiliated” is defined as ownership of five percent or more, but less than 25 percent, of the voting shares of the portfolio company, or where we hold the right to appoint one or more members to the portfolio company’s board of directors, but less than 25 percent of the members of the board of directors.
F-184
| Line for Schedule of Investments | Method / Level | Primary Industry | # of Shares Purchased/Principal | Cost of TURN's Investment | Valuation | |||||||||||||||||||||||||||
| Non-Controlled Affiliated Publicly Traded Equity and Equity-Related Securities | ||||||||||||||||||||||||||||||||
| comScore, Inc. | Advertising | |||||||||||||||||||||||||||||||
| Common Stock | (L1) | 400,451 | $ | 13,348,438 | $ | 2,338,634 | ||||||||||||||||||||||||||
| Synchronoss Technologies, Inc. | Application Software | |||||||||||||||||||||||||||||||
| Common Stock | (L1) | 854,788 | $ | 12,933,202 | $ | 8,205,965 | ||||||||||||||||||||||||||
| Common Stock - Restricted | (M) (L3) | 12,000 | 77,040 | 103,665 | ||||||||||||||||||||||||||||
| $ | 13,010,242 | $ | 8,309,630 | |||||||||||||||||||||||||||||
| Total Non-Controlled Affiliated Publicly Traded Equity and Equity-Related Securities (23.0%) | $ | 26,358,680 | $ | 10,648,264 | ||||||||||||||||||||||||||||
| Legacy Privately Held Equity and Equity-Related Securities | ||||||||||||||||||||||||||||||||
| EchoPixel, Inc. | Health Care Equipment | |||||||||||||||||||||||||||||||
| Series Seed Convertible Preferred Stock (acquired 6/21/13-6/30/14) | (M) (L3) | 4,194,630 | $ | 1,250,000 | $ | 44,044 | ||||||||||||||||||||||||||
| Series Seed-2 Convertible Preferred Stock (acquired 1/22/16) | (M) (L3) | 1,476,668 | 500,000 | 15,505 | ||||||||||||||||||||||||||||
| Series A-2 Convertible Preferred Stock (acquired 3/23/17) | (M) (L3) | 1,471,577 | 350,000 | 15,451 | ||||||||||||||||||||||||||||
| $ | 2,100,000 | $ | 75,000 | |||||||||||||||||||||||||||||
| HALE.life Corporation | Health Care Technology | |||||||||||||||||||||||||||||||
| Common Stock (acquired 3/1/16) | (I) (L3) | 1,000,000 | $ | 10 | $ | 0 | ||||||||||||||||||||||||||
| Series Seed-1 Convertible Preferred Stock (acquired 3/28/17) | (I) (L3) | 11,000,000 | 1,896,920 | 0 | ||||||||||||||||||||||||||||
| Series Seed-2 Convertible Preferred Stock (acquired 12/28/18) | (I) (L3) | 12,083,132 | 2,500,000 | 0 | ||||||||||||||||||||||||||||
| $ | 4,396,930 | $ | 0 | |||||||||||||||||||||||||||||
| Total Non-Controlled Affiliated Legacy Privately Held Equity and Equity-Related Securities (0.2%) | $ | 6,496,930 | $ | 75,000 | ||||||||||||||||||||||||||||
| Non-Controlled Affiliated Derivative Securities | ||||||||||||||||||||||||||||||||
| Synchronoss Technologies, Inc. | Application Software | |||||||||||||||||||||||||||||||
| Stock Options for Common Stock Expiring 12/4/30 (acquired 12/4/23) | (I) (L3) | 3,334 | $ | 0 | $ | 22,150 | ||||||||||||||||||||||||||
| Total Non-Controlled Affiliated Derivative Securities (0.0%) | $ | 0 | $ | 22,150 | ||||||||||||||||||||||||||||
| Total Non-Controlled Affiliated Securities (23.2%) | $ | 32,855,610 | $ | 10,745,414 | ||||||||||||||||||||||||||||
F-185
Report of Independent Registered Public Accounting Firm
To the Board of Directors and Shareholders of 180 Degree Capital Corp.
Opinion on the Financial Statements
We have audited the accompanying consolidated statement of assets and liabilities of 180 Degree Capital Corp. (the “Company”), including the consolidated schedule of investments as of December 31, 2023, and the related consolidated statements of operations, cash flows, and changes net in assets, and the consolidated financial highlights for the year then ended, and the related notes (collectively referred to as the “financial statements”). The consolidated statement of changes in net assets for the year ended December 31, 2022, and the consolidated financial highlights for each of the years in the four-year period ended December 31, 2022 were audited by another independent registered public accounting firm whose report, dated February 27, 2023, expressed an unqualified opinion on the consolidated statement of changes in net assets and the consolidated financial highlights. In our opinion, the financial statements present fairly, in all material respects, the consolidated financial position of the Company as of December 31, 2023, the consolidated results of its operations and its cash flows, consolidated changes in its net assets and the consolidated financial highlights for the year then ended in conformity with accounting principles generally accepted in the United States of America.
Basis for Opinion
These financial statements are the responsibility of the Company’s management. Our responsibility is to express an opinion on the Company’s financial statements based on our audit. We are a public accounting firm registered with the Public Company Accounting Oversight Board (United States) (“PCAOB”) and are required to be independent with respect to the Company in accordance with the U.S. federal securities laws and the applicable rules and regulations of the Securities and Exchange Commission and the PCAOB. We conducted our audit in accordance with the standards of the PCAOB. Those standards require that we plan and perform the audit to obtain reasonable assurance about whether the financial statements are free of material misstatement, whether due to error or fraud. The Company is not required to have, nor were we engaged to perform, an audit of their internal control over financial reporting. As part of our audit, we are required to obtain an understanding of internal control over financial reporting but not for the purpose of expressing an opinion on the effectiveness of the Company’s internal control over financial reporting. Accordingly, we express no such opinion.
Our audit included performing procedures to assess the risks of material misstatement of the financial statements, whether due to error or fraud, and performing procedures that respond to those risks. Such procedures included examining, on a test basis, evidence regarding the amounts and disclosures in the financial statements. Our procedures included confirmation of securities owned as of December 31, 2023, by correspondence with the custodian, transfer agent and issuers of privately offered securities. Our audit also included evaluating the accounting principles used and significant estimates made by management, as well as evaluating the overall presentation of the financial statements. We believe that our audit provides a reasonable basis for our opinion.
We have served as the Company’s auditor since 2023.
/s/ EisnerAmper LLP
New York, New York
February 20, 2024
F-186
| 180 DEGREE CAPITAL CORP. CONSOLIDATED STATEMENT OF ASSETS AND LIABILITIES | ||
| December 31, 2023 | ||||||||
| ASSETS | ||||||||
| Investments in securities and other financial instruments, at value: | ||||||||
| Unaffiliated publicly traded equity and equity-related securities (cost: $30,544,168) | $ | 21,305,497 | ||||||
| Unaffiliated legacy privately held equity and equity-related securities (cost: $819,619) | 283,627 | |||||||
| Non-controlled affiliated publicly traded equity and equity-related securities (cost: $40,836,951) | 26,894,724 | |||||||
| Non-controlled affiliated legacy privately held equity and equity-related securities (cost: $6,496,930) | 201,439 | |||||||
| Unaffiliated derivative securities (cost: $112,854) | 0 | |||||||
| Non-controlled affiliated derivative securities (cost: $224,849) | 480,114 | |||||||
| Unaffiliated rights to payments (cost: $1,149,799) | 1,356,391 | |||||||
| Unaffiliated money market fund securities (cost: $96,445) | 96,445 | |||||||
| Cash | 282,167 | |||||||
| Prepaid expenses | 218,089 | |||||||
| Lease asset | 36,078 | |||||||
| Other assets | 16,378 | |||||||
Total assets | $ | 51,170,949 | ||||||
| LIABILITIES & NET ASSETS | ||||||||
| Post-retirement plan liabilities | $ | 627,286 | ||||||
| Accounts payable and accrued liabilities | 289,425 | |||||||
| Lease obligation | 36,078 | |||||||
Total liabilities | $ | 952,789 | ||||||
| Commitments and contingencies (Note 10) | ||||||||
Net assets | $ | 50,218,160 | ||||||
| Net assets are comprised of: | ||||||||
| Preferred stock, $0.10 par value, 2,000,000 shares authorized; none issued | $ | 0 | ||||||
| Common stock, $0.03 par value, 15,000,000 shares authorized; 11,541,079 issued | 334,594 | |||||||
| Additional paid in capital | 105,597,715 | |||||||
| Total accumulated distributable loss | (49,453,226) | |||||||
| Treasury stock, at cost 1,540,938 shares | (6,260,923) | |||||||
Net assets | $ | 50,218,160 | ||||||
Shares outstanding | 10,000,141 | |||||||
Net asset value per outstanding share | $ | 5.02 | ||||||
The accompanying notes are an integral part of these consolidated financial statements.
F-187
| 180 DEGREE CAPITAL CORP. CONSOLIDATED STATEMENT OF OPERATIONS | ||
| Year Ended December 31, 2023 | ||||||||
| Income: | ||||||||
| Dividend | $ | 28,156 | ||||||
| Interest-Unaffiliated money market fund securities | 26,837 | |||||||
Total income | 54,993 | |||||||
| Operating fees and expenses: | ||||||||
| Salaries, bonus and benefits | 1,972,850 | |||||||
| Professional | 768,287 | |||||||
| Administration and operations | 255,356 | |||||||
| Directors | 253,517 | |||||||
| Insurance | 231,298 | |||||||
| Software | 207,949 | |||||||
| Rent | 36,245 | |||||||
| Custody | 31,940 | |||||||
| Other | 8,159 | |||||||
Total operating expenses | 3,765,601 | |||||||
Net investment loss before income tax expense | (3,710,608) | |||||||
| Income tax expense | 833 | |||||||
Net investment loss | (3,711,441) | |||||||
| Net realized gain (loss) from investments: | ||||||||
| Unaffiliated publicly traded equity and equity-related securities | 4,919,236 | |||||||
| Unaffiliated legacy privately held equity and equity-related securities | (8,252,168) | |||||||
| Non-controlled affiliated publicly traded equity and equity-related securities | 1,009,539 | |||||||
| Controlled affiliated equity and equity-related securities | (2,923,003) | |||||||
| Unaffiliated rights to payments | (548,998) | |||||||
Net realized loss from investments | (5,795,394) | |||||||
| Sale of equity-180 Degree Capital BD, LLC (Note 2) | 100,000 | |||||||
Net realized loss | (5,695,394) | |||||||
| Change in unrealized (depreciation) appreciation on investments: | ||||||||
| Unaffiliated publicly traded equity and equity-related securities | (5,699,016) | |||||||
| Unaffiliated legacy privately held equity and equity-related securities | 2,060,982 | |||||||
| Non-controlled affiliated publicly traded equity and equity-related securities | (1,570,022) | |||||||
| Non-controlled affiliated legacy privately held equity and equity-related securities | 42,553 | |||||||
| Controlled affiliated equity and equity-related securities | 216,431 | |||||||
| Unaffiliated rights to payments | 684,316 | |||||||
Net change in unrealized depreciation on investments | (4,264,756) | |||||||
Net realized loss and change in unrealized depreciation on investments | (9,960,150) | |||||||
Net decrease in net assets resulting from operations | $ | (13,671,591) | ||||||
The accompanying notes are an integral part of these consolidated financial statements.
F-188
| 180 DEGREE CAPITAL CORP. CONSOLIDATED STATEMENT OF CASH FLOWS | ||
| Year Ended December 31, 2023 | ||||||||
| Cash flows provided by operating activities: | ||||||||
| Net decrease in net assets resulting from operations | $ | (13,671,591) | ||||||
| Adjustments to reconcile net decrease in net assets resulting from operations to net cash provided by operating activities: | ||||||||
| Net realized loss | 5,695,394 | |||||||
| Net change in unrealized depreciation on investments | 4,264,756 | |||||||
| Depreciation of fixed assets | 9,073 | |||||||
| Purchase of unaffiliated publicly traded equity and equity-related securities | (13,494,045) | |||||||
| Purchase of non-controlled affiliated publicly traded equity and equity-related securities | (5,110,813) | |||||||
| Purchase of unaffiliated money market fund securities, net | (96,445) | |||||||
| Proceeds from sale of unaffiliated publicly traded equity and equity-related securities | 19,757,440 | |||||||
| Proceeds from sale of unaffiliated legacy privately held equity and equity-related securities | 37,175 | |||||||
| Proceeds from sale of non-controlled affiliated publicly traded and equity-related securities | 2,296,280 | |||||||
| Distribution from unaffiliated rights to payments | 1,621,741 | |||||||
| Proceeds from sale equity of 180 Degree Capital BD, LLC | 100,000 | |||||||
| Changes in assets and liabilities: | ||||||||
| Decrease in receivable from managed funds | 152,151 | |||||||
| Decrease in receivable from securities sold | 108,512 | |||||||
| Decrease in prepaid expenses | 32,350 | |||||||
| Increase in other assets | (313) | |||||||
| Decrease in other receivables | 2,278 | |||||||
| Decrease in post-retirement plan liabilities | (18,351) | |||||||
| Decrease in accounts payable and accrued liabilities | (218,792) | |||||||
| Decrease in payable for securities purchased | (180,971) | |||||||
| Net cash provided by operating activities | 1,285,829 | |||||||
| Cash flows from investing activities | ||||||||
| Purchase of fixed assets | (3,723) | |||||||
Net cash used in investing activities | (3,723) | |||||||
| Cash flows from financing activities | ||||||||
| Purchase of treasury stock | (1,655,398) | |||||||
Net cash used in financing activities | (1,655,398) | |||||||
Net decrease in cash | (373,292) | |||||||
| Cash at beginning of the year | 655,459 | |||||||
| Cash at end of the year | $ | 282,167 | ||||||
| Supplemental disclosures of cash flow information: | ||||||||
| Income taxes paid | $ | 833 | ||||||
The accompanying notes are an integral part of these consolidated financial statements.
F-189
| 180 DEGREE CAPITAL CORP. CONSOLIDATED STATEMENTS OF CHANGES IN NET ASSETS | ||
| Year Ended December 31, 2023 | Year Ended December 31, 2022 | |||||||||||||
| Changes in net assets from operations: | ||||||||||||||
| Net investment loss | $ | (3,711,441) | $ | (2,583,203) | ||||||||||
| Net realized (loss) gain | (5,695,394) | 2,204,654 | ||||||||||||
| Net change in unrealized depreciation on investments | (4,264,756) | (44,652,254) | ||||||||||||
Net decrease in net assets resulting from operations | (13,671,591) | (45,030,803) | ||||||||||||
| Changes in net assets from capital stock transactions: | ||||||||||||||
| Treasury stock purchase | (1,655,398) | — | ||||||||||||
Net decrease in net assets resulting from capital stock transactions | (1,655,398) | — | ||||||||||||
Net decrease in net assets | (15,326,989) | (45,030,803) | ||||||||||||
| Net Assets: | ||||||||||||||
| Beginning of the year | 65,545,149 | 110,575,952 | ||||||||||||
| End of the year | $ | 50,218,160 | $ | 65,545,149 | ||||||||||
The accompanying notes are an integral part of these consolidated financial statements.
F-190
| 180 DEGREE CAPITAL CORP. CONSOLIDATED FINANCIAL HIGHLIGHTS | ||
| Year Ended Dec. 31, 2023 | Year Ended Dec. 31, 2022 | Year Ended Dec. 31, 2021 | Year Ended Dec. 31 2020# | Year Ended Dec. 31 2019# | |||||||||||||||||||||||||||||||||||||
| Per Share Operating Performance: | |||||||||||||||||||||||||||||||||||||||||
| Net asset value per share, beginning of the year | $ | 6.32 | $ | 10.66 | $ | 9.28 | $ | 9.18 | $ | 7.92 | |||||||||||||||||||||||||||||||
Net investment loss* | (0.38) | (0.25) | (0.33) | (0.05) | (0.48) | ||||||||||||||||||||||||||||||||||||
Net realized (loss) gain* | (0.56) | 0.21 | 0.20 | (0.11) | 0.93 | ||||||||||||||||||||||||||||||||||||
Net change in unrealized (depreciation) appreciation on investments and options*1 | (0.42) | (4.30) | 1.51 | 0.26 | 0.81 | ||||||||||||||||||||||||||||||||||||
| Total from investment operations* | (1.36) | (4.34) | 1.38 | 0.10 | 1.26 | ||||||||||||||||||||||||||||||||||||
| Net increase as a result of purchase of treasury stock | 0.06 | 0.00 | 0.00 | 0.00 | 0.00 | ||||||||||||||||||||||||||||||||||||
| Net (decrease) increase in net asset value | (1.30) | (4.34) | 1.38 | 0.10 | 1.26 | ||||||||||||||||||||||||||||||||||||
| Net asset value per share, end of the year | $ | 5.02 | $ | 6.32 | $ | 10.66 | $ | 9.28 | $ | 9.18 | |||||||||||||||||||||||||||||||
| Stock price per share, end of the year | $ | 4.10 | $ | 5.28 | $ | 7.35 | $ | 6.66 | $ | 6.45 | |||||||||||||||||||||||||||||||
| Total return based on stock price | (22.35) | % | (28.16) | % | 10.36 | % | 3.26 | % | 22.86 | % | |||||||||||||||||||||||||||||||
| Supplemental Data: | |||||||||||||||||||||||||||||||||||||||||
| Net assets, end of the year | $ | 50,218,160 | $ | 65,545,149 | $ | 110,575,952 | $ | 96,317,794 | $ | 95,213,639 | |||||||||||||||||||||||||||||||
| Ratio of expenses to average net assets | 6.39 | % | 3.20 | % | ^ | 5.87 | % | ^ | 4.61 | % | ^ | 6.42 | % | ||||||||||||||||||||||||||||
| Ratio of net investment loss to average net assets | (6.30) | % | (2.88) | % | (3.26) | % | (0.59) | % | (5.42) | % | |||||||||||||||||||||||||||||||
| Portfolio turnover | 31.56 | % | 30.95 | % | 44.46 | % | 35.16 | % | 30.17 | % | |||||||||||||||||||||||||||||||
| Number of shares outstanding, end of the year | 10,000,141 | 10,373,820 | 10,373,820 | 10,373,820 | 10,373,820 | ||||||||||||||||||||||||||||||||||||
______________
# Reflect a 1-for-3 reverse stock split that became effective on January 4, 2021.
* Based on average shares outstanding.
^ The Company has entered into an expense offsetting arrangement with one of its unaffiliated brokers relating to broker fees paid. The total broker fee charged to the Company was applied as a credit to fees charged by an affiliate of the unaffiliated broker who the Company subscribes to for data services billed during the year. The Company received an offset to expense totaling approximately $20,600, $84,800, $31,900, and $15,700, with that broker for the years ended December 31, 2022-2019, respectively.
(1)Net unrealized losses include rounding adjustments to reconcile change in net asset value per share.
The accompanying notes are an integral part of these consolidated financial statements.
F-191
| 180 DEGREE CAPITAL CORP. CONSOLIDATED SCHEDULE OF INVESTMENTS AS OF DECEMBER 31, 2023 | ||
Method of Valuation(1) | Industry | Shares/Units | Cost | Value | ||||||||||||||||||||||||||||
Investments in Unaffiliated Equity and Equity-Related Securities (2) - | ||||||||||||||||||||||||||||||||
| 43.2% of net assets at value | ||||||||||||||||||||||||||||||||
| Unaffiliated Publicly Traded Equity and Equity-Related Securities - | ||||||||||||||||||||||||||||||||
| 42.4% of net assets at value | ||||||||||||||||||||||||||||||||
Ascent Industries Co. (3) | Steel | |||||||||||||||||||||||||||||||
| Manufactures metals and chemicals | ||||||||||||||||||||||||||||||||
| Common Stock | (L1) | 305,380 | $ | 3,240,810 | $ | 2,919,433 | ||||||||||||||||||||||||||
Brightcove, Inc. (3) | Internet Services & Infrastructure | |||||||||||||||||||||||||||||||
| Provides video hosting and publishing services | ||||||||||||||||||||||||||||||||
| Common Stock | (L1) | 319,079 | 1,473,621 | 826,415 | ||||||||||||||||||||||||||||
Commercial Vehicle Group, Inc. (3) | Construction Machinery & Heavy Trucks | |||||||||||||||||||||||||||||||
| Supplier of vehicle components | ||||||||||||||||||||||||||||||||
| Common Stock | (L1) | 322,418 | 1,818,556 | 2,260,150 | ||||||||||||||||||||||||||||
D-Wave Quantum, Inc. (3)(4) | Technology Hardware, Storage & Peripherals | |||||||||||||||||||||||||||||||
| Develops high-performance quantum computing systems | ||||||||||||||||||||||||||||||||
| Common Stock | (L1) | 770,000 | 1,045,355 | 677,677 | ||||||||||||||||||||||||||||
Intevac, Inc. (3) | Technology Hardware, Storage & Peripherals | |||||||||||||||||||||||||||||||
| Develops solutions for the application and engineering of thin-films | ||||||||||||||||||||||||||||||||
| Common Stock | (L1) | 939,337 | 4,356,573 | 4,057,936 | ||||||||||||||||||||||||||||
Lantronix, Inc. (3) | Communications Equipment | |||||||||||||||||||||||||||||||
| Provides secure data access and management solutions | ||||||||||||||||||||||||||||||||
| Common Stock | (L1) | 552,048 | 2,766,859 | 3,235,001 | ||||||||||||||||||||||||||||
Mama's Creations, Inc. (3) | Packaged Foods & Meats | |||||||||||||||||||||||||||||||
| Sells specialty pre-prepared and refigerated foods | ||||||||||||||||||||||||||||||||
| Common Stock | (L1) | 547,900 | 1,423,893 | 2,690,189 | ||||||||||||||||||||||||||||
Investments in Unaffiliated Equity and Equity-Related Securities (2) - | ||||||||||||||||||||||||||||||||
| 43.2% of net assets at value | ||||||||||||||||||||||||||||||||
| Unaffiliated Publicly Traded Equity and Equity-Related Securities - | ||||||||||||||||||||||||||||||||
| 42.4% of net assets at value | ||||||||||||||||||||||||||||||||
The accompanying notes are an integral part of these consolidated financial statements.
F-192
| 180 DEGREE CAPITAL CORP. CONSOLIDATED SCHEDULE OF INVESTMENTS AS OF DECEMBER 31, 2023 | ||
Method of Valuation(1) | Industry | Shares/Units | Cost | Value | ||||||||||||||||||||||||||||
Quantum Corporation (3) | Technology Hardware, Storage & Peripherals | |||||||||||||||||||||||||||||||
| Provides high-density data storage and high-speed data processing solutions | ||||||||||||||||||||||||||||||||
| Common Stock | (L1) | 3,221,192 | $ | 8,787,175 | $ | 1,124,196 | ||||||||||||||||||||||||||
Rayonier Advanced Materials, Inc. (3) | Specialty Chemicals | |||||||||||||||||||||||||||||||
| Produces specialty cellulose fibers | ||||||||||||||||||||||||||||||||
| Common Stock | (L1) | 530,000 | 2,789,675 | 2,146,500 | ||||||||||||||||||||||||||||
RF Industries, Ltd. (3) | Electronic Manufacturing Services | |||||||||||||||||||||||||||||||
| Provides products that enable wired and wireless communications | ||||||||||||||||||||||||||||||||
| Common Stock | (L1) | 450,000 | 2,841,651 | 1,368,000 | ||||||||||||||||||||||||||||
| Total Unaffiliated Publicly Traded Equity and Equity-Related Securities (cost: $30,544,168) | $ | 21,305,497 | ||||||||||||||||||||||||||||||
| Investments in Unaffiliated Equity and Equity-Related Securities (2) - | ||||||||||||||||||||||||||||||||
| 43.2% of net assets at value | ||||||||||||||||||||||||||||||||
| Unaffiliated Money Market Fund Securities - | ||||||||||||||||||||||||||||||||
| 0.2% of net assets at value | ||||||||||||||||||||||||||||||||
| JPMorgan 100% U.S. Treasury Securities Money Market Mutual Fund | ||||||||||||||||||||||||||||||||
| Institutional Class Shares (Yield 5.23%) | (L1) | 96,445 | $ | 96,445 | $ | 96,445 | ||||||||||||||||||||||||||
Total Unaffiliated Money Market Fund Securities (cost: $96,445) | $ | 96,445 | ||||||||||||||||||||||||||||||
Investments in Unaffiliated Equity and Equity-Related Securities (2) - | ||||||||||||||||||||||||||||||||
| 43.2% of net assets at value | ||||||||||||||||||||||||||||||||
| Unaffiliated Legacy Privately Held Equity and Equity-Related Securities - | ||||||||||||||||||||||||||||||||
| 0.6% of net assets at value | ||||||||||||||||||||||||||||||||
AutoTech Ventures Management I, LLC (3)(5)(6) | Asset Management & Custody Banks | |||||||||||||||||||||||||||||||
| Venture capital investing in automotive-related companies | ||||||||||||||||||||||||||||||||
| LLC Interests (acquired 12/1/17) | (M) (L3) | 0 | $ | 0 | $ | 150,000 | ||||||||||||||||||||||||||
Magnolia Neurosciences Corporation (3)(5)(7)(8) | Pharmaceuticals | |||||||||||||||||||||||||||||||
| Develops novel therapeutics for treatment of neurodegeneration | ||||||||||||||||||||||||||||||||
| Series A Convertible Preferred Stock (acquired 8/3/18) | (I) (L3) | 862,872 | 711,361 | 118,536 | ||||||||||||||||||||||||||||
The accompanying notes are an integral part of these consolidated financial statements.
F-193
| 180 DEGREE CAPITAL CORP. CONSOLIDATED SCHEDULE OF INVESTMENTS AS OF DECEMBER 31, 2023 | ||
Method of Valuation(1) | Industry | Shares/Units | Cost | Value | ||||||||||||||||||||||||||||
Ravenna Pharmaceuticals, Inc. (3)(5)(7)(8)(9) | Pharmaceuticals | |||||||||||||||||||||||||||||||
| Holding company for intellectual property in oncology therapeutics | ||||||||||||||||||||||||||||||||
| Common Stock (acquired 5/14/20-8/26/21) | (M) (L3) | 2,785,274 | 108,258 | 15,091 | ||||||||||||||||||||||||||||
| Total Unaffiliated Legacy Privately Held Equity and Equity-Related Securities (cost: $819,619) | $ | 283,627 | ||||||||||||||||||||||||||||||
| Total Investments in Unaffiliated Equity and Equity-Related Securities (cost: $31,460,232) | $ | 21,685,569 | ||||||||||||||||||||||||||||||
Investments in Non-Controlled Affiliated Equity and Equity-Related Securities (2) - | ||||||||||||||||||||||||||||||||
| 53.9% of net assets at value | ||||||||||||||||||||||||||||||||
| Non-Controlled Affiliated Publicly Traded Equity and Equity-Related Securities - | ||||||||||||||||||||||||||||||||
| 53.5% of net assets at value | ||||||||||||||||||||||||||||||||
Arena Group Holdings, Inc. (3)(10) | Interactive Media & Services | |||||||||||||||||||||||||||||||
| Provides a shared digital publishing, advertising and distribution platform | ||||||||||||||||||||||||||||||||
| Common Stock | (L1) | 991,192 | $ | 9,806,339 | $ | 2,359,037 | ||||||||||||||||||||||||||
comScore, Inc. (3)(10) | Advertising | |||||||||||||||||||||||||||||||
| Provides technology and services that measure audiences, brands and consumer behavior | ||||||||||||||||||||||||||||||||
| Common Stock | (L1) | 328,258 | 12,175,182 | 5,481,909 | ||||||||||||||||||||||||||||
Potbelly Corporation (3)(10) | Restaurants | |||||||||||||||||||||||||||||||
| Operates a chain of sandwich shops | ||||||||||||||||||||||||||||||||
| Common Stock | (L1) | 1,335,801 | 6,098,592 | 13,919,046 | ||||||||||||||||||||||||||||
Synchronoss Technologies, Inc. (3)(10) | Application Software | |||||||||||||||||||||||||||||||
| Provides white-label cloud storage, messaging and other digital analytic services | ||||||||||||||||||||||||||||||||
| Common Stock | (L1) | 826,849 | 12,756,838 | 5,134,732 | ||||||||||||||||||||||||||||
| Total Non-Controlled Affiliated Publicly Traded Equity and Equity-Related Securities (cost: $40,836,951) | $ | 26,894,724 | ||||||||||||||||||||||||||||||
Investments in Non-Controlled Affiliated Equity and Equity-Related Securities (2) - | ||||||||||||||||||||||||||||||||
| 53.9% of net assets at value | ||||||||||||||||||||||||||||||||
| Non-Controlled Affiliated Legacy Privately Held Equity and Equity-Related Securities - | ||||||||||||||||||||||||||||||||
| 0.4% of net assets at value | ||||||||||||||||||||||||||||||||
EchoPixel, Inc. (3)(5)(7) | Health Care Equipment | |||||||||||||||||||||||||||||||
The accompanying notes are an integral part of these consolidated financial statements.
F-194
| 180 DEGREE CAPITAL CORP. CONSOLIDATED SCHEDULE OF INVESTMENTS AS OF DECEMBER 31, 2023 | ||
Method of Valuation(1) | Industry | Shares/Units | Cost | Value | ||||||||||||||||||||||||||||
| Develops virtual reality 3-D visualization software for life sciences and health care applications | ||||||||||||||||||||||||||||||||
| Series Seed Convertible Preferred Stock (acquired 6/21/13-6/30/14) | (I) (L3) | 4,194,630 | $ | 1,250,000 | $ | 105,304 | ||||||||||||||||||||||||||
| Series Seed-2 Convertible Preferred Stock (acquired 1/22/16) | (I) (L3) | 1,476,668 | 500,000 | 37,818 | ||||||||||||||||||||||||||||
| Series A-2 Convertible Preferred Stock (acquired 3/23/17) | (I) (L3) | 1,471,577 | 350,000 | 58,317 | ||||||||||||||||||||||||||||
| 2,100,000 | 201,439 | |||||||||||||||||||||||||||||||
HALE.life Corporation (3)(5)(7) | Health Care Technology | |||||||||||||||||||||||||||||||
| Develops a platform to facilitate precision health and medicine | ||||||||||||||||||||||||||||||||
| Common Stock (acquired 3/1/16) | (I) (L3) | 1,000,000 | 10 | 0 | ||||||||||||||||||||||||||||
| Series Seed-1 Convertible Preferred Stock (acquired 3/28/17) | (I) (L3) | 11,000,000 | 1,896,920 | 0 | ||||||||||||||||||||||||||||
| Series Seed-2 Convertible Preferred Stock (acquired 12/28/18) | (I) (L3) | 12,083,132 | 2,500,000 | 0 | ||||||||||||||||||||||||||||
| 4,396,930 | 0 | |||||||||||||||||||||||||||||||
| Total Non-Controlled Affiliated Legacy Privately Held Equity and Equity-Related Securities (cost: $6,496,930) | $ | 201,439 | ||||||||||||||||||||||||||||||
Total Investments in Non-Controlled Affiliated Equity and Equity-Related Securities (cost: $47,333,881) | $ | 27,096,163 | ||||||||||||||||||||||||||||||
Total Investments in Publicly Traded Equity and Equity-Related Securities, Money Market Funds, and Legacy Privately Held Equity and Equity-Related Securities (cost: $78,794,113) | $ | 48,781,732 | ||||||||||||||||||||||||||||||
| Derivative Securities - | ||||||||||||||||||||||||||||||||
| 1.0% of net assets at value | ||||||||||||||||||||||||||||||||
| Unaffiliated Derivative Securities (2) - | ||||||||||||||||||||||||||||||||
| 0.0% of net assets at value | ||||||||||||||||||||||||||||||||
Magnolia Neurosciences Corporation (3)(5)(7)(8) | Pharmaceuticals | |||||||||||||||||||||||||||||||
| Developed neurodegeration therapeutics | ||||||||||||||||||||||||||||||||
| Warrants for the Purchase of Common Stock expiring 8/3/28 (acquired 8/26/21) | (I) (L3) | 138,059 | $ | 112,854 | $ | 0 | ||||||||||||||||||||||||||
Total Unaffiliated Derivative Securities (cost: $112,854) | $ | 0 | ||||||||||||||||||||||||||||||
Non-Controlled Affiliated Derivative Securities (2) - | ||||||||||||||||||||||||||||||||
| 1.0% of net assets at value | ||||||||||||||||||||||||||||||||
Potbelly Corporation (3)(10) | Restaurants | |||||||||||||||||||||||||||||||
| Operates a chain of sandwich shops | ||||||||||||||||||||||||||||||||
| Warrants for the Purchase of Common Stock expiring 2/12/26 (acquired 2/10/21) | (I) (L3) | 80,605 | $ | 224,849 | $ | 467,485 | ||||||||||||||||||||||||||
The accompanying notes are an integral part of these consolidated financial statements.
F-195
| 180 DEGREE CAPITAL CORP. CONSOLIDATED SCHEDULE OF INVESTMENTS AS OF DECEMBER 31, 2023 | ||
Method of Valuation(1) | Industry | Shares/Units | Cost | Value | ||||||||||||||||||||||||||||
Synchronoss Technologies, Inc. (3)(5)(10)(11) | Application Software | |||||||||||||||||||||||||||||||
| Provides white-label cloud storage, messaging and other digital analytic services | ||||||||||||||||||||||||||||||||
| Stock Options for Common Stock Expiring 12/4/30 (acquired 12/4/23) | (I) (L3) | 3,334 | 0 | 12,629 | ||||||||||||||||||||||||||||
Total Non-Controlled Affiliated Derivative Securities (cost: $224,849) | $ | 480,114 | ||||||||||||||||||||||||||||||
Total Derivative Securities (cost: $337,703) | $ | 480,114 | ||||||||||||||||||||||||||||||
Total Investments (cost: $79,131,816) | $ | 49,261,846 | ||||||||||||||||||||||||||||||
Other Financial Instruments (12) - | ||||||||||||||||||||||||||||||||
Unaffiliated Rights to Payments (2) - | ||||||||||||||||||||||||||||||||
| 2.7% of net assets at value | ||||||||||||||||||||||||||||||||
Rights to Milestone Payments from Acquisition of TARA Biosystems, Inc. (acquired 4/1/22) (3)(5)(7)(13) | (I) (L3) | Pharmaceuticals | $ | 1,149,799 | $ | 1,149,799 | $ | 1,356,391 | ||||||||||||||||||||||||
Total Unaffiliated Rights to Payments (cost: $1,149,799) | $ | 1,356,391 | ||||||||||||||||||||||||||||||
Total Investments in Publicly Traded and Privately Held Equity, Money Market Fund and Equity-Related Securities, Derivative Securities and Other Financial Instruments (cost: $80,281,615) | $ | 50,618,237 | ||||||||||||||||||||||||||||||
The accompanying notes are an integral part of these consolidated financial statements.
F-196
180 DEGREE CAPITAL CORP.
NOTES TO CONSOLIDATED SCHEDULE OF INVESTMENTS AS OF DECEMBER 31, 2024
Notes to Consolidated Schedule of Investments
(a)See Note 2. Summary of Significant Accounting Policies: Portfolio Investment Valuation.
(b)Investments in unaffiliated securities consist of investments in which the Company owns less than five percent of the voting shares of the portfolio company. Investments in non-controlled affiliated securities consist of investments in which the Company owns five percent or more, but less than 25 percent, of the voting shares of the portfolio company, or where the Company controls one or more seats on the portfolio company’s board of directors but do not control the company. Investments in controlled affiliated securities consist of investments in which the Company owns 25 percent or more of the outstanding voting rights of the portfolio company or otherwise control the company, including control of a majority of the seats on the board of directors, or more than 25 percent of the seats on the board of directors, with no other entity or person in control of more director seats than us.
(c)Represents a non-income producing investment. Investments that have not paid dividends or interest within the last 12 months or are on non-accrual status for at least 12 consecutive months are considered to be non-income producing.
(d)D-Wave Quantum Inc., (“QBTS”) was formed through the merger of D-Wave Systems, Inc., and DPCM Capital, Inc., a special purpose acquisition company (SPAC). D-Wave Systems, Inc. was a legacy private portfolio holding of the Company. The Company initially invested in D-Wave Systems, Inc. starting in 2008 and through 2014, acquiring various classes of preferred stock. While the shares of QBTS owned by the Company are registered, the Company entered into a lockup agreement with QBTS that prevented the Company from trading or hedging these shares until February 5, 2023. As of that date, the Company's shares of common stock of QBTS are no longer subject to lockup restrictions.
(e)The Company is subject to legal restrictions on the sale of all or a portion of our investment(s) in this company. The total amount of restricted securities held is $1,854,086, or 3.7 percent of net assets.
(f)The Company received LLC Interests of 1.25 percent in AutoTech Ventures Management I, LLC (“AutoTech”) pursuant to an Administrative Services Agreement between us and AutoTech and due to us following the termination of a former employee of the Company. These LLC Interests were separate from the compensation received for providing the administrative services under the agreement that were paid in cash. The LLC interests have a capital percentage of 0 percent.
(g)These securities are held by the Company's wholly owned subsidiary, 180 Degree Private Holdings, LLC (“180PH”), which were transferred from the Company to 180PH in the fourth quarter of 2020. The acquisition dates of the securities reflect the dates such securities were obtained by the Company rather than the transfer date.
(h)Represents a non-operating entity that exists to collect future payments from licenses or other engagements, monetize assets for future distributions to investors and debt holders, or is in the process of shutting down and distributing remaining assets according to a liquidation waterfall.
(i)The Company received shares of Ravenna Pharmaceuticals, Inc., as part of the consideration of the acquisition of Petra Pharma Corporation.
(j)The Company is the Investment Manager of separately managed accounts (“SMAs”) that owns shares of these portfolio companies. Under our investment management agreement for the SMAs, the Company has the right to control the votes of the securities held by the SMAs. The Company has voting ownership between 5 percent and 25 percent in these companies when the shares held by us and our SMAs are aggregated.
(k)These stock options were granted to Kevin Rendino upon his appointment to the Board of Directors of Synchronoss Technologies, Inc. Mr. Rendino entered into an assignment and assumption agreement with the Company that transfers all beneficial and voting interest to the Company.
The accompanying notes are an integral part of these consolidated financial statements.
F-197
180 DEGREE CAPITAL CORP.
NOTES TO CONSOLIDATED SCHEDULE OF INVESTMENTS AS OF DECEMBER 31, 2024
(l)Other financial instruments are holdings of the Company that do not meet the definition of a security or a derivative.
(m)If all the remaining milestones are met and the time-based payments are completed, the Company would receive approximately $4.0 million. Of this amount, approximately $1.3 million is due to be paid to the Company on April 1, 2024. There can be no assurance as to how much of the remaining approximately $2.7 million in potential milestone-based payments will ultimately be realized or when they will be realized, if at all.
The accompanying notes are an integral part of these consolidated financial statements.
F-198
NOTE 1. THE COMPANY
180 Degree Capital Corp. (including its wholly owned subsidiaries, the “Company,” “us,” “our” and “we”), withdrew its election to be treated as a business development company on March 30, 2017, and subsequently returned to its prior status as a registered non-diversified closed-end management investment company ("Closed-End Fund" or “CEF”) under the Investment Company Act of 1940 (the “1940 Act”). We operate as an internally managed investment company whereby our officers and employees, under the general supervision of our Board of Directors, conduct our operations. As of May 22, 2020, we are also registered with the Securities and Exchange Commission as a Registered Investment Adviser under the Investment Advisers Act of 1940 (the “Advisers Act”).
180 Degree Private Holdings, LLC (“180PH”), is a wholly owned limited liability company that was created in October 2020 to hold certain of the Company's securities of privately held companies. 180PH was consolidated for financial reporting purposes and is a disregarded entity for tax purposes under the Internal Revenue Code (“Code”).
180 Degree Capital BD, LLC (“180BD”) was a 100 percent owned subsidiary of the Company that was sold to an unrelated buyer and the transaction closed in February 2023. 180BD was registered by the Company as a broker-dealer with the Financial Industry Regulatory Authority (“FINRA”) that was formed to provide services to the Company related to fundraising for co-investment funds and not for investment returns. Historically, the Company consolidated 180BD for financial reporting purposes.
The Company is the Managing Member of 180 Degree Capital Management, LLC (“180CM”), a limited liability company formed to facilitate the opportunity for interested investors to co-invest alongside the Company in individual publicly traded portfolio companies. As of December 31, 2023, the Company has no capital under management in 180CM.
The Company was the General Partner of 180 Phoenix Fund, L.P., (“180 Phoenix”) a limited partnership formed to facilitate the opportunity to manage capital for investors in a traditional limited partnership structure. The Company did not raise capital into 180 Phoenix. Based on conversations with potential investors that indicated more interest in management of separate accounts rather than a limited partnership structure, in December 2023, the Company elected to file a certificate of cancellation to terminate the existence of the entity.
As of December 31, 2023, the Company manages approximately $10.6 million in net assets in two separately managed accounts (“SMA”).
The Company may, in certain cases, receive management fees and carried interest on profits generated on invested capital from any capital under management if and when capital is raised and if and when profits are realized, respectively. The Company does not consolidate the operations of any capital managed in separate series of 180CM, or in the separately managed accounts.
NOTE 2. SUMMARY OF SIGNIFICANT ACCOUNTING POLICIES
The following is a summary of significant accounting policies followed in the preparation of the consolidated financial statements:
Principles of Consolidation. The consolidated financial statements have been prepared in accordance with accounting principles generally accepted in the US (“GAAP”) and Articles 6 and 12 of Regulation S-X of the Securities Exchange Commission (“SEC”) and include the accounts of the Company and its wholly owned subsidiaries. The Company is an investment company following accounting and reporting guidance in Accounting Standards Codification 946. In accordance with GAAP and Regulation S-X under 17 C.F.R. Part 210, the Company may only consolidate its interests in investment company subsidiaries and controlled operating companies whose business consists of providing services to the Company. Prior to February 2023, our wholly owned subsidiary, 180BD, was a controlled operating company that provided services to us and was, therefore, consolidated. 180PH is a controlled operating company that provide services to us and is, therefore, consolidated. All significant intercompany accounts and transactions were eliminated in the consolidated financial statements.
The accompanying notes are an integral part of these consolidated financial statements.
F-199
Accounting Standards Codification (ASC) Topic 810, “Consolidation,” provides guidance on the consolidation of financial statements when a company has control over another entity. ASC 810-10-40 addresses the accounting for the deconsolidation of a subsidiary and outlines the criteria for determining when to deconsolidate a subsidiary. The Company derecognized 180BD as the Company ceased to have a controlling financial interest of 180BD as of February 2023, following the sale of its equity of 180BD to an unrelated third party. The Company recognized $100,000 in net realized gain on the deconsolidation.
Use of Estimates. The preparation of the consolidated financial statements in conformity with GAAP requires management to make estimates and assumptions that affect the reported amounts of assets and liabilities and contingent assets and liabilities and the reported amounts of revenues and expenses. Actual results could differ from these estimates, and the differences could be material. The most significant estimates relate to the fair valuations of our investments.
Portfolio Investment Valuations. Investments are stated at “value” as defined in the 1940 Act and in the applicable regulations of the SEC and in accordance with GAAP. Value, as defined in Section 2(a)(41) of the 1940 Act, is (i) the market price for those securities for which a market quotation is readily available and (ii) the fair value as determined in good faith by, or under the direction of, the Board of Directors for all other assets. The Valuation Committee, comprised of all of the independent Board members, is responsible for determining the valuation of the Company’s assets within the guidelines established by the Board of Directors, pursuant with SEC Rule 2a-5. The Valuation Committee receives information and recommendations from management. The Company may from time to time use an independent valuation firm to review select portfolio company valuations on an as needed basis. The independent valuation firm, when engaged by the Company, does not provide independent valuations. The fair values assigned to these investments are based on available information and do not necessarily represent amounts that might ultimately be realized when that investment is sold, as such amounts depend on future circumstances and cannot reasonably be determined until the individual investments are actually liquidated or become readily marketable. The Valuation Committee values the Company's investment assets as of the end of each calendar quarter and as of any other time requested by the Board of Directors.
Accounting Standards Codification Topic 820, “Fair Value Measurements,” (“ASC 820”) defines fair value as the price that would be received to sell an asset or paid to transfer a liability in an orderly transaction between market participants at the measurement date (exit price). It applies fair value terminology to all valuations whereas the 1940 Act applies market value terminology to readily marketable assets and fair value terminology to other assets.
The main approaches to measuring fair value utilized are the market approach, the income approach and the hybrid approach.
•Market Approach (M): The market approach focuses on inputs and not techniques. The market approach may use quantitative inputs such as prices and other relevant information generated by market transactions involving identical or comparable assets or liabilities and the values of market multiples derived from a set of comparable companies. The market approach may also use qualitative inputs such as progress toward milestones, the long-term potential of the business, current and future financing requirements and the rights and preferences of certain securities versus those of other securities. The selection of the relevant inputs used to derive value under the market approach requires judgment considering factors specific to the significance and relevance of each input to deriving value.
•Income Approach (I): The income approach focuses on techniques and not inputs. The income approach uses valuation techniques to convert future amounts (for example, revenue, cash flows or earnings) to a single present value amount (discounted). The measurement is based on the value indicated by current market expectations about those future amounts. Those valuation techniques include present value techniques; option-pricing models, such as the Black-Scholes-Merton formula (a closed-form model) and a binomial model (a lattice model), which incorporate present value techniques; and the multi-period excess earnings method, which is used to measure the fair value of certain assets.
The accompanying notes are an integral part of these consolidated financial statements.
F-200
•Hybrid Approach (H): The hybrid approach uses elements of both the market approach and the income approach. The hybrid approach calculates values using the market and income approach, individually. The resulting values are then distributed among the share classes based on probability of exit outcomes.
ASC Topic 820 classifies the inputs used to measure fair value by these approaches into the following hierarchy:
•Level 1 (L1): Unadjusted quoted prices in active markets for identical assets or liabilities;
•Level 2 (L2): Inputs other than quoted prices included within Level 1 that are observable for the asset or liability, either directly or indirectly. These include quoted prices in active markets for similar assets or liabilities, or quoted prices for identical or similar assets or liabilities in markets that are not active, or inputs other than quoted prices that are observable for the asset or liability, either directly or indirectly, for substantially the full term of the financial instrument. Level 2 inputs are in those markets for which there are few transactions, the prices are not current, little public information exists or instances where prices vary substantially over time or among brokered market makers; and
•Level 3 (L3): Inputs to the valuation methodology are unobservable and significant to the fair value measurement. Unobservable inputs are those inputs that reflect our own assumptions that market participants would use to price the asset or liability based upon the best available information.
Financial assets and liabilities are classified in their entirety based on the lowest level of input that is significant to the fair value measurement and are not necessarily an indication of risks associated with the investment.
As of December 31, 2023, our financial statements include investments fair valued by the Board of Directors of $2,321,571. The fair values were determined in good faith by, or under the direction of, the Board of Directors. The fair value amount includes the values of our investments in legacy privately held companies and rights to future milestone payments, as well as our warrants of Potbelly Corporation and Magnolia Neurosciences Corporation, and our stock options for common stock of Synchronoss Technologies, Inc.
Cash. Cash includes demand deposits. Cash is carried at cost, which approximates fair value.
Unaffiliated Rights to Payments. At December 31, 2023, the outstanding potential milestone and time-based payments from the acquisition of TARA Biosystems, Inc., by Valo Health, LLC were valued at $1,356,391. The milestone payments are valued using the probability-adjusted, present value of proceeds from future payments that would be due upon successful completion of certain regulatory milestones. There can be no assurance as to how much of the amounts related to milestone payments that we will ultimately realize or when they will be realized, if at all. The time-based payments are valued using a discount for time-value of money that includes estimated default risk of the acquirer.
Prepaid Expenses. We include prepaid insurance premiums in “Prepaid expenses.” Prepaid insurance premiums are recognized over the term of the insurance contract and are included in "Insurance" in the Company's Consolidated Statement of Operations.
Property and Equipment. Property and equipment are included in “Other assets” and are carried at $9,799 at December 31, 2023, representing cost of $229,818, less accumulated depreciation of $220,019. Depreciation is provided using the straight-line method over the estimated useful lives of the property and equipment. We estimate the useful lives to be five to ten years for furniture and fixtures, and three years for computer equipment.
Post-Retirement Plan Liabilities. Until it was terminated on April 27, 2017, the Company provided a Retiree Medical Benefit Plan for employees who met certain eligibility requirements. Until it was terminated on May 5, 2011, the Company also provided an Executive Mandatory Retirement Benefit Plan for certain individuals employed by us in a bona fide executive or high policy-making position. The net periodic post-retirement benefit cost includes service cost and interest cost on the accumulated post-retirement benefit obligation. Unrecognized actuarial gains and losses are recognized as net periodic benefit cost, pursuant to the Company's historical
The accompanying notes are an integral part of these consolidated financial statements.
F-201
accounting policy in “Salaries, bonus and benefits” in the Company's Consolidated Statement of Operations. The impact of plan amendments was amortized over the employee's average service period as a reduction of net periodic benefit cost. Unamortized prior service cost was fully amortized during 2017 as a result of the termination of the Retiree Medical Benefit Plan.
Interest Income Recognition. Interest income, including amortization of premium and accretion of discount, is recorded on an accrual basis. When accrued interest is determined not to be recoverable, the Company ceases accruing interest and writes off any previously accrued interest. Write-offs are netted in interest income. Securities are deemed to be non-income producing if investments have not paid dividends or interest within the last 12 months or are on non-accrual status for at least 12 consecutive months. When the fair value of a security that includes PIK interest is less than the accrued interest, the Company may place the security on non-accrued status.
Board Fees From Portfolio Companies. The Company recognizes revenues from fee income from board fees as those services are provided.
Management Fees and Performance Fees/Carried Interest from Managed Funds. As a Registered Investment Adviser under the Advisers Act, the Company may be entitled to receive management fees and performance fees from clients including separately managed accounts (SMAs) and special purpose vehicles (SPVs). When applicable, the Company accrues management fees on SPVs that are to be paid upon liquidation of the entity regardless of performance. Performance fees or carried interest, if any, is paid annually by SMAs based on a fixed percentage of the increase in net assets during the year. Performance fees on SPVs, if any, are generally paid based on the amount of increase in net assets at the time of any distribution of capital above the amount of initial invested capital plus accrued expenses. The timing and payment terms of management fees and performance fees for future client accounts may be different than those of our current SMAs.
The Company does not include accruals for carried interest in the consolidated financial statements until such carried interest is received and/or the Company concludes that it is probable that a reversal of any accrual will not occur. The Company did not earn or accrue any carried interest in the year ended December 31, 2023.
Other Income. The Company may purchase restricted securities issued by publicly traded companies that include provisions that provide for payment of partial liquidated damages in the event the issuer does not meet obligations specified in the purchase agreement or other ancillary documents associated with the transaction. These obligations most commonly are associated with the filing of registration statements and/or being up to date with the filing of the issuer's financial statements with the SEC.
Put and Call Options. The Company may purchase options on publicly traded securities as an investment and/or with the intention of limiting its downside risk. When the Company purchases an option, an amount equal to the premium paid is recorded in the Consolidated Statement of Assets and Liabilities as an investment. The Company may also purchase an option at one price and write/sell an option at another price in a simultaneous transaction referred to as a spread. The amount of these assets is subsequently marked-to-market to reflect the current value of the options. In the event that the options are exercised, the Company would be required to deliver those shares to the counterparty. When the options expire unexercised, the Company realizes a loss on the premium paid, or the difference between the premium paid and the premium received, as applicable.
Rent Expense. The Company currently leases and runs daily operations in approximately 1,250 square feet of office space in Montclair, New Jersey. Prior to November 17, 2021, the Company leased this space on a month-to-month basis at a base rent of approximately $26 per square foot per year. On November 17, 2021, the Company entered into a three-year lease extension that set the average base rent beginning January 1, 2022, at approximately $30 per square foot over the term of the extension. Either the Company or the landlord may terminate the lease at any time with two months' written notice to either party. As of December 31, 2023, the present value of the future lease payments (lease liability) is recorded as an asset and a liability in the Company's Consolidated Statement of Assets and Liabilities. The amount is calculated using weighted average discount rate of 1.32 percent and weighted based on the terms of the lease agreement. As of December 31, 2023, the remaining commitment on the lease is less than $40,000.
The accompanying notes are an integral part of these consolidated financial statements.
F-202
Realized Gain or Loss and Unrealized Appreciation or Depreciation of Portfolio Investments. Realized gain or loss is recognized when an investment is disposed of and is computed as the difference between the Company's cost basis in the investment at the disposition date and the net proceeds received from such disposition. Realized gain or loss on investment transactions are determined by specific identification. Unrealized appreciation or depreciation is computed as the difference between the fair value of the investment and the cost basis of such investment.
Income Taxes. As discussed in Note 9. Income Taxes, the Company did not qualify as a regulated investment company (“RIC”) under Subchapter M of the Code in 2023, and will therefore be taxed as a C-Corporation in 2023. The Company did not accrue for any income taxes as of December 31, 2023 as it did not generate ordinary income. The Company has capital loss carryforwards that can be used to offset net realized capital gains. The Company also has operating loss carryforwards that can be used to offset operating income and net realized capital gains in years when it fails to qualify as a RIC. The Company recognizes interest and penalties in income tax expense. See Note 9. Income Taxes for further discussion.
Foreign Currency Translation. The accounting records of the Company are maintained in U.S. dollars. All assets and liabilities denominated in foreign currencies are translated into U.S. dollars based on the rate of exchange of such currencies against U.S. dollars on the date of valuation. If Company has assets denominated in foreign currencies, it does not isolate the portion of the results of operations that arises from changes in foreign currency rates on investments held on its Consolidated Statement of Operations.
Securities Transactions. Securities transactions are accounted for on the date the transaction for the purchase or sale of the securities is entered into by the Company (i.e., trade date). Securities transactions outside conventional channels, such as private transactions, are recorded as of the date the Company obtains the right to demand the securities purchased or to collect the proceeds from a sale and incurs the obligation to pay for the securities purchased or to deliver the securities sold.
Concentration of Credit Risk. The Company places its cash with financial institutions and, at times, cash held in depository accounts may exceed the Federal Deposit Insurance Corporation's insured limit and is subject to the credit risk of such institutions to the extent it exceeds such limit.
Recent Accounting Pronouncements and Adoptions. On December 14, 2023, the Financial Accounting Standards Board (“FASB”) issued ASU 2023-09, “Income Taxes (Topic 740): Improvements to Income Tax Disclosures.” This ASU requires additional disaggregation of the reconciliation between the statutory and effective tax rate for an entity and of income taxes paid, both of which are disclosures required by current GAAP. The amendments improve the transparency of income tax disclosures by requiring (1) consistent categories and greater disaggregation of information in the rate reconciliation and (2) income taxes paid disaggregated by jurisdiction. The guidance is effective for fiscal years, including interim periods within those fiscal years, beginning after December 15, 2024, and early adoption is permitted. This ASU is not expected to have a material impact on the Company's consolidated financial statements as the Company does not have tax liabilities in foreign jurisdictions.
On October 9, 2023, the FASB issued ASU 2023-06, “Disclosure Improvements: Codification Amendments in Response to the SEC's Disclosure Update and Simplification Initiative.” This ASU amends the disclosure or presentation requirements related to various subtopics in the FASB Accounting Standards Codification (the “Codification”). This ASU was issued in response to the SEC’s August 2018 Final Rule 2 that updated and simplified disclosure requirements that the SEC believed were “redundant, duplicative, overlapping, outdated, or superseded.” The effective date for each amendment will be the date on which the SEC’s removal of that related disclosure requirement from Regulation S-X or Regulation S-K becomes effective, with early adoption prohibited. The new guidance is intended to align GAAP requirements with those of the SEC and to facilitate the application of GAAP for all entities. This ASU is not expected to have a material impact on the Company's consolidated financial statements.
The accompanying notes are an integral part of these consolidated financial statements.
F-203
NOTE 3. BUSINESS RISKS AND UNCERTAINTIES
Our business activities contain elements of risk. We consider the principal types of market risk to be valuation risk, diversification risk, interest rate risk and foreign currency risk. Although we are risk-seeking rather than risk-averse in our investments, we consider the management of risk to be essential to our business.
Investment Objective
Our investment objective is to generate capital appreciation and current income from investments and investment-related activities such as managed funds and accounts.
Investment Strategy
Our investment strategy on future new investments is focused on generating capital appreciation and current income from investments in what we believe are deeply undervalued, small publicly traded companies where we believe we can positively impact the business and valuation through constructive activism. Historically, our investment strategy was to achieve long-term capital appreciation investing in venture capital investments. While we continue to provide such resources to our existing legacy portfolio companies, we no longer make venture capital investments. We classify our legacy portfolio companies as Legacy Privately Held Equity and Equity-Related Securities.
We believe we combine new perspectives with the historical knowledge and experience of managing the current portfolio. Our investment approach is comprised of a patient examination of available opportunities through due diligence and close involvement with management of our portfolio companies. We invest our capital directly into portfolio companies or through purchases of securities of publicly traded companies directly and through open-market purchases. We may seek to invest our capital alongside capital from other investors through that we control.
We have discretion in the investment of our capital to achieve our objectives by investing in various types of assets, and we do not currently limit our investments to any security type. Our investments may include, among other asset types: equity, equity-related securities (including warrants and options) and debt with equity features from either private or public issuers; debt obligations of all types having varying terms with respect to security or credit support, subordination, purchase price, interest payments and maturity; foreign securities; and miscellaneous investments.
Investment Policies
Fundamental policies may not be changed without the approval of the holders of a majority of our voting securities, as defined in the 1940 Act. As a matter of fundamental policy, the Company will not:
(a)Issue senior securities, borrow money from banks, brokers or other lenders, or engage in transactions involving the issuance by us of “senior securities” representing indebtedness, except to the extent permitted under the 1940 Act or the rules, regulations or interpretations thereof.
(b)Underwrite securities of other issuers, except insofar as we may be deemed an underwriter under the Securities Act of 1933, as amended (the “Securities Act”), in connection with the disposition of our portfolio securities. We may invest in restricted securities (those that must be registered under the Securities Act before they may be offered or sold to the public) to the extent permitted by the 1940 Act or the rules, regulations or interpretations thereof.
(c)Invest more than 25% of our total assets in the securities of companies or entities engaged in any one industry, or group of industries. This limitation does not apply to investment in the securities of the U.S. Government, its agencies or instrumentalities.
(d)Purchase or sell real estate or interests in real estate (except that we may (a) purchase and sell real estate or interests in real estate in connection with the orderly liquidation of investments, or in connection with foreclosure on collateral, or (b) own the securities of companies that are in the business of buying, selling or developing real estate).
The accompanying notes are an integral part of these consolidated financial statements.
F-204
(e)Purchase or sell commodities or commodity contracts, but we may purchase and sell foreign currency and enter into foreign currency forward contracts, and may engage in other transactions in financial instruments, in each case to the extent permitted under the Company's investment policies as in effect from time to time.
(f)Make loans of money or securities to other persons, except through purchasing fixed-income securities or other debt instruments, lending portfolio securities or entering into repurchase agreements in a manner consistent with our investment policies. With respect to these investment restrictions, if a percentage restriction is adhered to at the time of entering into the investment or transaction, a later change in percentage resulting from a change in the values of investments or the value of our total assets, unless otherwise stated or required by law, will not constitute a violation of the restriction or policy.
Valuation Risk
We historically invested in privately held companies, the securities of which are inherently illiquid. We are currently focused on investing in what we believe are deeply undervalued microcapitalization publicly traded companies. Our publicly traded and public company-related securities account for approximately 96 percent of the value of our portfolio of investments. Although these companies are publicly traded, their stock may not trade at high volumes and/or we may own a significant portion of a company's outstanding stock, which may restrict our ability to sell our positions in an orderly fashion and prices at which sales can be made may be volatile and materially different than the closing prices of such positions at each financial statement date. We may also be subject to restrictions on transfer and/or other lock-up provisions after these companies complete public offerings and/or if we invest in unregistered securities of public companies. Many of our legacy privately held and publicly traded companies tend to not have attained profitability, and many of these companies also lack management depth and have limited or no history of operations. Because of the speculative nature of our investments and the lack of a liquid market for and restrictions on transfers of privately held investments, there is greater risk of loss relative to traditional marketable investment securities.
Approximately 5 percent of our portfolio was fair valued and comprised of securities of legacy privately held companies and rights to potential future milestone payments, as well as our warrants of Potbelly Corporation and options of Synchronoss Technologies, Inc. (Level 3 investments) which are securities of publicly traded companies. Because there is typically no public or readily ascertainable market for our securities of our legacy privately held companies, the valuation of the securities in that portion of our portfolio is determined in good faith by our Valuation Committee, which is comprised of all of the independent members of our Board of Directors. The values are determined in accordance with our Valuation Procedures and are subject to significant estimates and judgments. The fair value of the securities in our portfolio may differ significantly from the values that would be placed on these securities if a ready market for the securities existed. Additionally, inputs may become available after a financial statement date that could result in a material change in value at a future financial statement date from the value reported in the current financial statements. Any changes in valuation are recorded in the Company's Consolidated Statement of Operations as “Change in unrealized appreciation (depreciation) on investments.” Changes in valuation of any of our investments in privately held companies from one period to another may be significant.
Diversification Risk
While we are subject to certain diversification requirements regarding the concentration of investments in any one industry or group of industries at the time of each investment, we do not choose investments based on a strategy of diversification. We also do not rebalance the portfolio should one of our portfolio companies increase in value substantially relative to the rest of the portfolio. Therefore, the value of our portfolio may be more vulnerable to microeconomic events affecting a single sector, industry or portfolio company and to general macroeconomic events that may be unrelated to our portfolio companies. These factors may subject the value of our portfolio to greater volatility than a company that follows a diversification strategy. As of December 31, 2023, our largest 10 investments by value accounted for approximately 87 percent of the value of our investment portfolio. Our largest three investments, by value, Potbelly Corporation, comScore, Inc., and Synchronoss Technologies, Inc., accounted
The accompanying notes are an integral part of these consolidated financial statements.
F-205
for approximately 27 percent, 11 percent and 10 percent, respectively, of our investment portfolio at December 31, 2023. Potbelly Corporation, comScore, Inc. and Synchronoss Technologies, Inc. are publicly traded companies.
Interest Rate Risk
Interest rate sensitivity refers to the change in earnings that may result from changes in the level of interest rates. We may invest in both short- and long-term U.S. government and agency securities. To the extent that we invest in short- and long-term U.S. government and agency securities, changes in interest rates result in changes in the value of these obligations that result in an increase or decrease of our net asset value. The level of interest rate risk exposure at any given point in time depends on the market environment, the expectations of future price and market movements, and the quantity and duration of long-term U.S. government and agency securities held by the Company, and it will vary from period to period.
In addition, market interest rates for high-yield corporate debt may be an input in determining value of our investments in debt securities of privately held and publicly traded companies. Significant changes in these market rates could affect the value of our debt securities as of the valuation date of measurement of value. While we do not currently have any investments in debt securities with floating interest rates, investment income in such securities should we acquire them in the future could be adversely affected by changes in interest rates.
Foreign Currency Risk
Our investments are not subject to foreign currency risk as they are all denominated in U.S. dollars. We have one investment in a company based in Canada, D-Wave Quantum, Inc., however the price per share and terms of those shares are denominated in U.S. dollars.
NOTE 4. FAIR VALUE OF INVESTMENTS
At December 31, 2023, our financial assets valued at fair value were categorized as follows in the fair value hierarchy:
The accompanying notes are an integral part of these consolidated financial statements.
F-206
| Fair Value Measurement at Reporting Date Using: | ||||||||||||||||||||||||||
| Description | Unadjusted Quoted Prices in Active Markets for Identical Assets (Level 1) | Significant Other Observable Inputs (Level 2) | Significant Unobservable Inputs (Level 3) | December 31, 2023 | ||||||||||||||||||||||
| Legacy Privately Held Equity and Equity-Related Securities: | ||||||||||||||||||||||||||
| Preferred Stock | $ | — | $ | — | $ | 319,975 | $ | 319,975 | ||||||||||||||||||
| Common Stock | — | — | 15,091 | 15,091 | ||||||||||||||||||||||
| Warrants | — | — | — | — | ||||||||||||||||||||||
| LLC Interests | — | — | 150,000 | 150,000 | ||||||||||||||||||||||
| Publicly Traded Equity and Equity-Related Securities: | ||||||||||||||||||||||||||
| Common Stock | $ | 48,200,221 | $ | — | $ | — | $ | 48,200,221 | ||||||||||||||||||
| Money Market Mutual Fund - Institutional Class Shares | 96,445 | — | — | 96,445 | ||||||||||||||||||||||
| Warrants/Stock Options | — | — | 480,114 | 480,114 | ||||||||||||||||||||||
Total Investments: | $ | 48,296,666 | $ | — | $ | 965,180 | $ | 49,261,846 | ||||||||||||||||||
| Other Financial Instruments: | ||||||||||||||||||||||||||
| Rights to Milestone Payments | $ | — | $ | — | $ | 1,356,391 | $ | 1,356,391 | ||||||||||||||||||
Total Financial Assets: | $ | 48,296,666 | $ | — | $ | 2,321,571 | $ | 50,618,237 | ||||||||||||||||||
Significant Unobservable Inputs
The table below presents the valuation technique and quantitative information about the significant unobservable inputs utilized by the Company in the fair value measurements of Level 3 assets. Unobservable inputs are those inputs for which little or no market data exists and, therefore, require an entity to develop its own assumptions.
The accompanying notes are an integral part of these consolidated financial statements.
F-207
| Value as of December 31, 2023 | Valuation Approach(es) | Unobservable Input(s) | Range(s) (Weighted Average(a)) | |||||||||||||||||||||||
| Price Per Share | $0.14 - $0.30 ($0.24) | |||||||||||||||||||||||||
| Public Comparable Adjustment (Including Non-Performance Risk) | -100.0% - -88.1% (-88.1%) | |||||||||||||||||||||||||
| Volatility | 111.3% (111.3%) | |||||||||||||||||||||||||
| Preferred Stock | $ | 319,975 | Income Approach | Time to Exit / Cash Flows (Years) | 5.0 (5.0) | |||||||||||||||||||||
| Common Stock | 15,091 | Market Approach | Price Per Share | $0.01 ($0.01) | ||||||||||||||||||||||
| Price Per Share | $0.00 ($0.00) | |||||||||||||||||||||||||
| Volatility | 48.4% - 78.3% (49.2%) | |||||||||||||||||||||||||
| Warrants/Stock Options | 480,114 | Income Approach | Time to Exit (Years) | 2.1 - 6.9 (2.2) | ||||||||||||||||||||||
| LLC Interests | 150,000 | Market Approach | Price Per Profit Interest Percent | $120,000 ($120,000) | ||||||||||||||||||||||
| Probability of Achieving Independent Milestones | 5.0% - 100.0% (99.2%) | |||||||||||||||||||||||||
| Probability of Achieving Dependent Milestones | 2.4% - 3.7% (3.1%) | |||||||||||||||||||||||||
| Rights to Milestone Payments | 1,356,391 | Income Approach | Time to Cash Flows (Years) | 0.3 - 4.5 (0.4) | ||||||||||||||||||||||
Total | $ | 2,321,571 | ||||||||||||||||||||||||
______________
(1)Weighted average based on fair value at December 31, 2023.
Valuation Methodologies and Inputs for Level 3 Assets
The following sections describe the valuation techniques and significant unobservable inputs used to measure Level 3 assets.
Preferred Stock, LLC Interests, and Common Stock
Preferred stock, LLC interests, and common stock are valued by either a market, income or hybrid approach using internal models with inputs, most of which are not market observable. Common inputs for valuing Level 3 investments include prices from recently executed private transactions in a company’s securities or unconditional firm offers, revenue multiples of comparable publicly traded companies, merger and acquisition (“M&A”) transactions consummated by comparable companies, discounts for lack of marketability, rights and preferences of the class of securities we own as compared with other classes of securities the portfolio company has issued, particularly related to potential liquidity scenarios of an initial public offering (“IPO”) or an acquisition transaction, estimated time to exit, volatilities of comparable publicly traded companies and management’s best estimate of risk attributable to non-performance risk. Certain securities are valued using the present value of future cash flows.
We may also consider changes in market values for sets of comparable companies when recent private transaction information is not available and/or in consideration of non-performance risk. We define non-performance risk as the risk that the price per share (or implied valuation of a portfolio company) or the effective yield of a debt security of a portfolio company, as applicable, does not appropriately represent the risk that a portfolio company with negative cash flow will be: (a) unable to raise capital, will need to be shut down and will not return our invested capital; or (b) able to raise capital, but at a valuation significantly lower than the implied post-
The accompanying notes are an integral part of these consolidated financial statements.
F-208
money valuation of the last round of financing. We assess non-performance risk for each private portfolio company quarterly. Our assessment of non-performance risk typically includes an evaluation of the financial condition and operating results of the company, the company's progress towards milestones, and the long-term potential of the business and technology of the company and how this potential may or may not affect the value of the shares owned by us. An increase to the non-performance risk or a decrease in the private offering price of a future round of financing from that of the most recent round would result in a lower fair value measurement and/or a change in the distribution of value among the classes of securities we own.
Option pricing models place a high weighting on liquidation preferences, which means that small differences in how the preferences are structured can have a material effect on the fair value of our securities at the time of valuation and also on future valuations should additional rounds of financing occur with senior preferences. As such, valuations calculated by option pricing models may not increase if 1) rounds of financing occur at higher prices per share, 2) liquidation preferences include multiples on investment, 3) the amount of invested capital is small and/or 4) liquidation preferences are senior to prior rounds of financing. Additionally, an increase in the volatility assumption generally increases the enterprise value calculated in an option pricing model. An increase in the time to exit assumption also generally increases the enterprise value calculated in an option pricing model. Variations in the expected time to exit or expected volatility assumptions have a significant impact on fair value.
Warrants and Stock Options
We use the Black-Scholes-Merton option-pricing model to determine the fair value of warrants and stock options held in our portfolio unless there is a publicly traded active market for such securities or another indication of value such as a sale of the portfolio company or an expectation that we may exercise the security prior to expiration. Option pricing models, including the Black-Scholes-Merton model, require the use of subjective input assumptions, including expected volatility, expected life, expected dividend rate, and expected risk-free rate of return. In the Black-Scholes-Merton model, variations in the expected volatility or expected term assumptions have a significant impact on fair value.
An input to the Black-Scholes-Merton option-pricing model is the value per share of the type of stock for which the warrant is exercisable as of the date of valuation. This input is derived according to the methodologies discussed in “Preferred Stock, Preferred Units, LLC Interests, Common Stock and Common Units.”
Rights to Milestone Payments
Rights to milestone payments are valued using a probability-weighted discounted cash flow model. We are entitled to potential future payments from the acquisition of TARA Biosystems, Inc. by Valo Health, LLC. We assign probabilities to the achievements of the various milestones. Milestones identified as independent milestones can be achieved irrespective of the achievement of other contractual milestones. Dependent milestones are those that can only be achieved after another, or series of other, milestones are achieved. The interest rates used in these models are observable inputs from sources such as the published interest rates for corporate bonds of the acquiring or comparable companies.
Changes in Valuation Approaches
There were no changes in valuation approaches during the year ended December 31, 2023.
The accompanying notes are an integral part of these consolidated financial statements.
F-209
The following chart shows the components of change in the financial assets categorized as Level 3 for the year ended December 31, 2023:
Beginning Balance 1/1/2023 | Total Realized Gains (Loss) Included in Changes in Net Assets | Transfers | Total Unrealized (Depreciation) Appreciation Included in Changes in Net Assets | Investments in Portfolio Companies | Disposals and Settlements | Ending Balance 12/31/2023 | Amount of Total Appreciation (Depreciation) for the Year included in Changes in Net Assets Attributable to the Change in Unrealized Gains or Losses Relating to Assets Still Held at the Reporting Date | ||||||||||||||||||||||||||||||||||||||||||||||
| Preferred Stock/Units | $ | 6,435,925 | $ | (8,252,168) | (1) | $ | — | $ | 2,173,393 | $ | — | $ | (37,175) | $ | 319,975 | $ | 76,688 | ||||||||||||||||||||||||||||||||||||
| Common Stock/Membership Units | 2,722,986 | (2,923,003) | (1) | — | 215,108 | — | — | 15,091 | (1,323) | ||||||||||||||||||||||||||||||||||||||||||||
| Warrants/Stock Options | 215,631 | (785) | (1) | — | 265,268 | — | — | 480,114 | 264,483 | ||||||||||||||||||||||||||||||||||||||||||||
| LLC Interests | 218,534 | — | — | (68,534) | — | — | 150,000 | (68,534) | |||||||||||||||||||||||||||||||||||||||||||||
| Rights to Milestone Payments | 2,842,814 | (548,998) | 1 | — | 684,316 | — | (1,621,741) | 1,356,391 | 135,318 | ||||||||||||||||||||||||||||||||||||||||||||
Total | $ | 12,435,890 | $ | (11,724,954) | $ | — | $ | 3,269,551 | $ | — | $ | (1,658,916) | $ | 2,321,571 | $ | 406,632 | |||||||||||||||||||||||||||||||||||||
______________
(1)Represents gross realized losses.
NOTE 5. INDUSTRY DIVERSIFICATION
The following table shows the percentage of our net assets invested by industry as of December 31, 2023.
| Industry | Value as of December 31, 2023 | % of Net Assets | Value as of December 31, 2023 | % of Net Assets | ||||||||||||||||||||||
| Advertising | $ | 5,481,909 | 10.9% | |||||||||||||||||||||||
| Unaffiliated Portfolio Companies | $ | — | — | % | ||||||||||||||||||||||
| Non-Controlled Affiliated Portfolio Companies | 5,481,909 | 10.9 | % | |||||||||||||||||||||||
| Application Software | 5,147,361 | 10.2 | % | |||||||||||||||||||||||
| Unaffiliated Portfolio Companies | — | — | % | |||||||||||||||||||||||
| Non-Controlled Affiliated Portfolio Companies | 5,147,361 | 10.2 | % | |||||||||||||||||||||||
| Asset Management & Custody Banks | 150,000 | 0.3 | % | |||||||||||||||||||||||
| Unaffiliated Portfolio Companies | 150,000 | 0.3 | % | |||||||||||||||||||||||
| Non-Controlled Affiliated Portfolio Companies | — | — | % | |||||||||||||||||||||||
| Communications Equipment | 3,235,001 | 6.4 | % | |||||||||||||||||||||||
| Unaffiliated Portfolio Companies | 3,235,001 | 6.4 | % | |||||||||||||||||||||||
| Non-Controlled Affiliated Portfolio Companies | — | — | % | |||||||||||||||||||||||
The accompanying notes are an integral part of these consolidated financial statements.
F-210
| Industry | Value as of December 31, 2023 | % of Net Assets | Value as of December 31, 2023 | % of Net Assets | ||||||||||||||||||||||
| Construction Machinery & Heavy Trucks | 2,260,150 | 4.5 | % | |||||||||||||||||||||||
| Unaffiliated Portfolio Companies | 2,260,150 | 4.5 | % | |||||||||||||||||||||||
| Non-Controlled Affiliated Portfolio Companies | — | — | % | |||||||||||||||||||||||
| Electronic Manufacturing Services | ||||||||||||||||||||||||||
| Unaffiliated Portfolio Companies | 1,368,000 | 2.7 | % | 1,368,000 | 2.7 | % | ||||||||||||||||||||
| Non-Controlled Affiliated Portfolio Companies | — | — | % | |||||||||||||||||||||||
| Health Care Equipment | 201,439 | 0.4 | % | |||||||||||||||||||||||
| Unaffiliated Portfolio Companies | — | — | % | |||||||||||||||||||||||
| Non-Controlled Affiliated Portfolio Companies | 201,439 | 0.4 | % | |||||||||||||||||||||||
| Health Care Technology | — | — | % | |||||||||||||||||||||||
| Unaffiliated Portfolio Companies | — | — | % | |||||||||||||||||||||||
| Non-Controlled Affiliated Portfolio Companies | — | — | % | |||||||||||||||||||||||
| Interactive Media & Services | 2,359,037 | 4.7 | % | |||||||||||||||||||||||
| Unaffiliated Portfolio Companies | — | — | % | |||||||||||||||||||||||
| Non-Controlled Affiliated Portfolio Companies | 2,359,037 | 4.7 | % | |||||||||||||||||||||||
| Internet Services & Infrastructure | 826,415 | 1.6 | % | |||||||||||||||||||||||
| Unaffiliated Portfolio Companies | 826,415 | 1.6 | % | |||||||||||||||||||||||
| Non-Controlled Affiliated Portfolio Companies | — | — | % | |||||||||||||||||||||||
| Packaged Foods & Meats | 2,690,189 | 5.4 | % | |||||||||||||||||||||||
| Unaffiliated Portfolio Companies | 2,690,189 | 5.4 | % | |||||||||||||||||||||||
| Non-Controlled Affiliated Portfolio Companies | — | — | % | |||||||||||||||||||||||
| Pharmaceuticals | 1,490,018 | 3.0 | % | |||||||||||||||||||||||
| Unaffiliated Portfolio Companies | 1,490,018 | 3.0 | % | |||||||||||||||||||||||
| Non-Controlled Affiliated Portfolio Companies | — | — | % | |||||||||||||||||||||||
| Restaurants | 14,386,531 | 28.6 | % | |||||||||||||||||||||||
| Unaffiliated Portfolio Companies | — | — | % | |||||||||||||||||||||||
| Non-Controlled Affiliated Portfolio Companies | 14,386,531 | 28.6 | % | |||||||||||||||||||||||
| Specialty Chemicals | 2,146,500 | 4.3 | % | |||||||||||||||||||||||
| Unaffiliated Portfolio Companies | 2,146,500 | 4.3 | % | |||||||||||||||||||||||
| Non-Controlled Affiliated Portfolio Companies | — | — | % | |||||||||||||||||||||||
| Steel | $ | 2,919,433 | 5.8% | |||||||||||||||||||||||
| Unaffiliated Portfolio Companies | $ | 2,919,433 | 5.8% | |||||||||||||||||||||||
| Non-Controlled Affiliated Portfolio Companies | — | —% | ||||||||||||||||||||||||
| Technology Hardware, Storage & Peripherals | 5,859,809 | 11.7% | ||||||||||||||||||||||||
The accompanying notes are an integral part of these consolidated financial statements.
F-211
| Industry | Value as of December 31, 2023 | % of Net Assets | Value as of December 31, 2023 | % of Net Assets | ||||||||||||||||||||||
| Unaffiliated Portfolio Companies | 5,859,809 | 11.7% | ||||||||||||||||||||||||
| Non-Controlled Affiliated Portfolio Companies | — | —% | ||||||||||||||||||||||||
Total | $ | 50,521,792 | $ | 50,521,792 | ||||||||||||||||||||||
NOTE 6. DERIVATIVES
During the year ended December 31, 2023, the Company did not purchase or sell any derivative securities. The Company abandoned warrants for the purchase of common stock of OpGen, Inc. and was assigned all economic benefit for options for the purchase of Common Stock of Synchronoss Technologies, Inc., that were issued to Kevin M. Rendino, Chairman, Chief Executive Officer and Portfolio Manager of the Company of the Company for his service on the Board of Directors of Synchronoss Technologies.
The following table presents the effect of derivatives held during the year ended December 31, 2023, along with the respective location in the consolidated financial statements.
CONSOLIDATED STATEMENT OF ASSETS AND LIABILITIES:
| Assets | Liabilities | |||||||||||||||||||||||||
| Derivatives | Location | Fair Value | Location | Fair Value | ||||||||||||||||||||||
| Warrants for the purchase of Common Stock of Potbelly Corporation expiring 2/12/26 (acquired 2/10/21) | Investments | $ | 467,485 | — | — | |||||||||||||||||||||
| Warrants for the purchase of Common Stock of Magnolia Neurosciences Corporation expiring 8/3/28 (acquired 8/26/21) | Investments | — | — | — | ||||||||||||||||||||||
| Stock Options for the purchase of Common Stock of Synchronoss Technologies, Inc. expiring 12/4/30 (acquired 12/4/23) | Investments | 12,629 | — | — | ||||||||||||||||||||||
The accompanying notes are an integral part of these consolidated financial statements.
F-212
CONSOLIDATED STATEMENT OF OPERATIONS:
| Derivatives | Location | Net Realized Gain (Loss) | Net Change in Unrealized Appreciation (Depreciation) | |||||||||||||||||
| Warrants for the purchase of Common Stock of Potbelly Corporation expiring 2/12/26 | Net Realized Gain (Loss) and Unrealized Appreciation (Depreciation) on Investments | $ | — | $ | 251,854 | |||||||||||||||
| Warrants for the purchase of Common Stock of Magnolia Neurosciences Corporation expiring 8/3/28 | Net Realized Gain (Loss) and Unrealized Appreciation (Depreciation) on Investments | — | — | |||||||||||||||||
| Warrants for the purchase of Common Stock of OpGen, Inc. expiring 2/17/25 (abandoned 12/21/23) | Net Realized Gain (Loss) and Unrealized Appreciation (Depreciation) on Investments | (785) | 785 | |||||||||||||||||
| Stock Options for the purchase of Common Stock of Synchronoss Technologies, Inc. expiring 12/4/30 | Net Realized Gain (Loss) and Unrealized Appreciation (Depreciation) on Investments | — | 12,629 | |||||||||||||||||
NOTE 7. OFFICERS' AND BOARD OF DIRECTORS' COMPENSATION
The aggregate compensation (salaries, 401(k) employer match, medical and dental benefits) paid by the Company during the year ended December 31, 2023, to its officers amounted to approximately $1.4 million. As of December 31, 2023, there is no accrual for deferred bonuses for time-elapsed portion as in prior years.
The aggregate compensation paid by the Company to the independent members of its Board of Directors during the year ended December 31, 2023 was $253,104.
Certain officers and directors currently and may in the future serve as members of the board of directors of our portfolio companies, including our controlled portfolio companies. These officers and directors do not receive any compensation for serving in such roles directly from the portfolio companies. Any such cash compensation paid by portfolio companies to members of their respective boards of directors is paid directly to the Company. In the case of securities-based compensation (restricted stock or stock options), the officer or director due such compensation assigns all beneficial interest, including but not limited to economic benefit and voting control, to such securities over to the Company.
NOTE 8. EMPLOYEE BENEFITS
401(k) Plan
We adopted a 401(k) Plan covering substantially all of our employees. Matching contributions to the plan are at the discretion of the Compensation Committee. For the year ended December 31, 2023, the Compensation Committee approved a 100 percent match, which amounted to $127,500.
Medical Benefit Retirement Plan
We historically administered a plan to provide medical and dental insurance for retirees and their spouses who, at the time of their retirement, attained certain years of service with us and a certain age (the “Medical Benefit Retirement Plan”). On April 27, 2017, the Board of Directors terminated the plan. The termination does not affect benefits accrued by former employees who are grandfathered under the former terms of the plan, and the termination of the plan does not affect benefits accrued by certain former employees who were grandfathered under the amended terms of the plan. The Medical Benefit Retirement Plan was terminated for all other employees. At December 31,
The accompanying notes are an integral part of these consolidated financial statements.
F-213
2023, we had $494,944 accrued for accumulated post-retirement benefit obligation for certain of these former employees, which is included in “Post-retirement plan liabilities” on the Company's Consolidated Statement of Assets and Liabilities.
Executive Mandatory Retirement Benefit Plan
On May 5, 2011, the Board of Directors terminated the Amended and Restated Executive Mandatory Retirement Benefit Plan. Our former President accrued benefits under this plan prior to his retirement, and the termination of this plan has no impact on his accrued benefits. At December 31, 2023, we had $132,342 accrued for benefits for this former employee under the plan, which is included in “Post-retirement plan liabilities” on the Company's Consolidated Statement of Assets and Liabilities.
The plan is unfunded and has no assets. The following disclosures about changes in the benefit obligation under the plan to provide medical and dental insurance for retirees are as of the measurement date of December 31, 2023:
| 2023 | ||||||||
| Accumulated post-retirement benefit obligation - December 31, 2022 | $ | 507,563 | ||||||
| Interest cost | 23,782 | |||||||
| Actuarial loss | 8,225 | |||||||
| Benefits paid | (44,626) | |||||||
| Accumulated post-retirement benefit obligation - December 31, 2023 | $ | 494,944 | ||||||
In accounting for the plan, the assumption made for the discount rate was 4.70 percent for the year ended December 31, 2023. The discount rate was calculated using the December 31, 2023 FTSE Pension Liability Index. The assumed health care cost trend rates is assumed to be 7 percent in 2023 grading down to 5.60 percent uniformly over 3 years and then following the Getzen model thereafter for medical and 5 percent per year for dental.
The following is the net periodic post-retirement benefit cost for the year ended December 31, 2023:
| 2023 | ||||||||
| Interest cost on accumulated post-retirement benefit obligation | $ | 23,782 | ||||||
| Amortization of net gain | (21,182) | |||||||
| Net periodic post-retirement benefit cost | $ | 2,600 | ||||||
The Company estimates the following benefits to be paid in each of the following years:
| 2024 | $ | 47,755 | ||||||
| 2025 | 60,906 | |||||||
| 2026 | 57,479 | |||||||
| 2027 | 58,048 | |||||||
| 2028 | 32,710 | |||||||
| 2029 through 2033 | 153,490 | |||||||
For the year ended December 31, 2023, net unrecognized actuarial loss of $29,407 resulted primarily from the decrease in the discount rate, which represents $8,225 of actuarial loss arising during the year, and from a reclassification adjustment of $21,182 that decreased the net periodic benefit cost for the year.
NOTE 9. INCOME TAXES
The Company filed for the 1999 tax year to elect treatment as a RIC under Subchapter M of the Code and qualified for the same treatment for the years 2000 through 2015, as well as 2017 and 2019. The Company did not qualify as a RIC under Subchapter M of the Code in 2016, 2018, 2020, 2021, 2022 and 2023. The Company did not
The accompanying notes are an integral part of these consolidated financial statements.
F-214
have net taxable income in any of 2016, 2018, 2020, 2021, 2022 or 2023, so the failure to qualify as a RIC did not result in a tax liability for the Company. Under the Code, if the Company fails to qualify as a RIC three years in a row, it would be subject to taxation as a C-Corporation on built-in gains should realization of those gains occur within five years of the date of the last annual failure even if the Company qualified as a RIC in a future year.
As of December 31, 2023, the Company did not qualify as a RIC, and will therefore be taxed as a C-Corporation in 2023, as a result of failing certain Diversification Tests. The failure to qualify as a RIC in 2023 is the fourth year in a row that such qualification was not attained. As of December 31, 2023, the Company did not have any built-in gains that would be subject to taxation as a C-Corporation should the Company qualify as a RIC in a future year. Additionally, should the Company qualify as a RIC in a future year, it would be required to distribute any accumulated and undistributed ordinary income and/or undistributed long-term capital gains. As of December 31, 2023, the Company did not have any undistributed ordinary income and/or undistributed long-term capital gains. As a C-Corporation, the Company is permitted to use historical operating loss carryforwards to offset income and gains for tax purposes. As of December 31, 2023, the Company had approximately $87.0 million in operating loss carryforwards that begin to expire in 2026.
The Company's status as a RIC is irrevocable, but qualification is measured both quarterly and annually. Given the Company's status as a RIC and that the ability or inability to use such operating loss carryforwards depends on qualification metrics measured in each taxable year separate from prior years, the Company does not include a deferred tax asset and valuation allowance on deferred tax asset on its Consolidated Statement of Assets and Liabilities.
Under certain circumstances, even if we qualified for Subchapter M treatment for a given year, we might act in a subsequent year to ensure that we would be taxed in that subsequent year as a C Corporation, rather than as a RIC. We will fail to qualify for RIC tax treatment for a taxable year if we do not satisfy the 90 percent Income Test, the Diversification Tests or Annual Distribution Requirement for such year. In the event we do not satisfy the 90 percent Income Test, Diversification Tests or the Annual Distribution Requirement for any taxable year, we will be subject to federal tax with respect to all our taxable income, whether or not distributed. In addition to the corporate tax that would be paid by the Company, all our distributions to shareholders in that situation generally will be taxable as ordinary dividends and generally subject to up to a 30 percent withholding tax if received by a non-U.S. shareholder, although such dividends may qualify for long-term capital gain treatment as “qualified dividends” for U.S. shareholders meeting certain holding period requirements. If the aggregate values of our non-qualifying assets remain below 50 percent of total assets and no non-qualifying asset represents more than 25 percent of the total assets, we will continue to pass the Diversification Tests. Rather than selling portfolio companies that are performing well in order to pass our RIC Diversification Tests, we may opt instead not to qualify as a RIC. We will choose to take such action only if we believe that the result of the action will benefit the Company and our shareholders.
For U.S. federal tax purposes, the Company’s 2020 through 2022 tax years remain open for examination by the tax authorities under the normal three-year statute of limitations. Generally, for New Jersey state tax purposes, the Company’s 2019 through 2022 tax years remain open for examination by the tax authorities under a four-year statute of limitations. The Company will file its 2023 federal and state taxes.
For the year ended December 31, 2023, the Company recorded a consolidated expense of $833 in federal, state and local income taxes.
The Company updated certain components of capital accounts on a tax-basis in 2023, to reflect a return of capital statement of position (“ROCSOP”) adjustment. This ROCSOP adjustment includes the reclassification of $3,816,683 of accumulated net operating loss and $6,272,740 of accumulated net realized loss into additional paid in capital. This reclassification results primarily from certain non-deductible expenses and net operating loss. There is no impact to net asset value per share as a result of this ROCSOP adjustment. This adjustment may change in future years if the Company does not qualify as a RIC in a given tax year.
As of December 31, 2023, the Company's net unrealized depreciation of $29,663,378 was comprised of unrealized depreciation of $40,271,721 and unrealized appreciation is $10,608,343. The book cost of investments is
The accompanying notes are an integral part of these consolidated financial statements.
F-215
$80,281,615. As of December 31, 2023, the Company's net tax unrealized depreciation of $28,702,992 was comprised of tax unrealized depreciation of $39,311,335 and tax unrealized appreciation is $10,608,343. The tax cost of investments is $79,321,229. As of December 31, 2023, the Company was in a loss position and therefore did not have any undistributed ordinary income and/or undistributed long-term capital gains.
As of December 31, 2023, we had post-enactment loss carryforwards under the provisions of the Regulated Investment Company Modernization Act of 2010 (the “Act”) in aggregate of $19,789,848, long term. Capital losses for the year ended December 31, 2023, were $5,695,394. As of December 31, 2023, we had cumulative capital losses, which were derived during years when the Company failed as a RIC, totaling $6,767,387, which may be carried back 3 years or carried forward 5 years. Capital losses when the Company failed as a RIC of $1,919,139 was expired in 2023. As of December 31, 2023, we had cumulative capital losses, which were derived during years when the Company qualified as a RIC, totaling $13,022,461. Post-enactment losses have no expiration date in years where we qualify as a RIC.
On December 22, 2017, the Tax Cuts and Jobs Act of 2017 (the “2017 Act”) was enacted, which among other changes, lowered the tax rates for corporations and how future loss carryforwards can be used against future gains. The change of the federal corporate tax rate from 35 percent to 21 percent in the 2017 Act may impact future decisions regarding the issuance of deemed dividends should the Company failed to qualify as a RIC under Subchapter M of the Code and be in a net taxable gain position on investments.
NOTE 10. COMMITMENTS AND CONTINGENCIES
Portfolio companies may seek additional capital in the future and any decision by the Company to not participate in the round of financing could result in outcomes that negatively impact the value of the Company's securities of those portfolio companies.
On November 17, 2021, the Company signed a lease extension through December 31, 2024. Upon an event of default, the lease provides that the landlord may terminate the lease and require us to pay all rent that would have been payable during the remainder of the lease or until the date the landlord re-enters the premises.
The accompanying notes are an integral part of these consolidated financial statements.
F-216
NOTE 11. PORTFOLIO PURCHASES AND SALES
During the year ended December 31, 2023:
| Company | Purchases/Cost | Sales Proceeds/Distributions | ||||||||||||
| Alta Equipment Group, Inc. | $ | 1,454,352 | $ | 9,205,266 | ||||||||||
| Arena Group Holdings, Inc. | 970,266 | 0 | ||||||||||||
| Ascent Industries Co. | 250,671 | 0 | ||||||||||||
| Brightcove, Inc. | 1,513,410 | 27,420 | ||||||||||||
| Commercial Vehicle Group, Inc. | 50,292 | 2,242,644 | ||||||||||||
| comScore, Inc. | 2,597,286 | 10 | ||||||||||||
| D-Wave Quantum, Inc. | 0 | 170,995 | ||||||||||||
| Intevac, Inc. | 935,279 | 2,860,163 | ||||||||||||
| Lantronix, Inc. | 918,737 | 1,082,399 | ||||||||||||
| Mama's Creations, Inc. | 1,630,161 | 339,549 | ||||||||||||
| Potbelly Corporation | 157,162 | 2,247,270 | ||||||||||||
| Quantum Corporation | 267,201 | 197,173 | ||||||||||||
| Rayonier Advanced Materials, Inc. | 3,715,858 | 536,401 | ||||||||||||
| RF Industries, Ltd. | 507,912 | 0 | ||||||||||||
| Synchronoss Technologies, Inc. | 1,386,099 | 49,000 | ||||||||||||
| VSE Corporation | 1,786,884 | 2,082,314 | ||||||||||||
Miscellaneous Common Stocks(1) | 463,288 | 1,013,116 | ||||||||||||
Total Publicly Traded Equity and Equity-Related Securities Purchases and Sales Proceeds | $ | 18,604,858 | $ | 22,053,720 | ||||||||||
| Rights to Milestone Payments from Acquisition of TARA Biosystems, Inc. | $ | 0 | $ | 1,621,741 | ||||||||||
| Magnolia Neurosciences Corporation | 0 | 37,175 | ||||||||||||
Total Legacy Privately Held Equity and Equity-Related Securities Cost and Distributions | $ | 0 | $ | 1,658,916 | ||||||||||
Total Purchases/Cost and Sales Proceeds/Distributions | $ | 18,604,858 | $ | 23,712,636 | ||||||||||
______________
(1)Miscellaneous Common Stocks are unrestricted common stocks of publicly traded companies that the Company has not disclosed publicly.
NOTE 12. SHARE REPURCHASE PROGRAM
On February 24, 2023, our Board reauthorized the repurchase of up to $2.5 million of the Company's common stock within a six-month period from the date of notice to investors. On May 10, 2023, the Company noted in a press release it had repurchased 373,679 shares of its common stock at a price per share of $4.43 including brokerage commissions.
On May 11, 2023, our Board reauthorized the repurchase of up to $5 million of the Company's common stock. As of December 31, 2023, no additional repurchases under this reauthorization have occurred. On July 28, 2023, our Board reauthorized the repurchase of up to $5 million of the Company's common stock within a six-month period from the date of notice to investors, which was mailed on or about August 14, 2023. On February 16, 2024, our Board reauthorized the repurchase of up to $5 million of the Company's common stock within a six-month period from the date of notice to investors, which notice will be mailed on or about February 24, 2024.
The accompanying notes are an integral part of these consolidated financial statements.
F-217
NOTE 13. SUBSEQUENT EVENTS
Management of the Company has evaluated subsequent events through the date these financial statements were issued. Based upon this evaluation, management has determined there were no items requiring adjustment of the financial statements or additional disclosure.
The accompanying notes are an integral part of these consolidated financial statements.
F-218
| Line for Schedule of Investments | Method / Level | Primary Industry | # of Shares Purchased/Principal | Cost of TURN's Investment | Valuation | |||||||||||||||||||||||||||
| Non-Controlled Affiliated Publicly Traded Equity and Equity-Related Securities | ||||||||||||||||||||||||||||||||
| Arena Group Holdings, Inc. | Interactive Media & Services | |||||||||||||||||||||||||||||||
| Common Stock | (L1) | 991,192 | $ | 9,806,339 | $ | 2,359,037 | ||||||||||||||||||||||||||
| comScore, Inc. | Advertising | |||||||||||||||||||||||||||||||
| Common Stock | (L1) | 328,258 | $ | 12,175,182 | $ | 5,481,909 | ||||||||||||||||||||||||||
| Potbelly Corporation | Restaurants | |||||||||||||||||||||||||||||||
| Common Stock | (L1) | 1,335,801 | $ | 6,098,592 | $ | 13,919,046 | ||||||||||||||||||||||||||
| Synchronoss Technologies, Inc. | Application Software | |||||||||||||||||||||||||||||||
| Common Stock | (L1) | 826,849 | $ | 12,756,838 | $ | 5,134,732 | ||||||||||||||||||||||||||
Total Non-Controlled Affiliated Publicly Traded Equity and Equity-Related Securities (53.5%) | $ | 40,836,951 | $ | 26,894,724 | ||||||||||||||||||||||||||||
| Legacy Privately Held Equity and Equity-Related Securities | ||||||||||||||||||||||||||||||||
| EchoPixel, Inc. | Health Care Equipment | |||||||||||||||||||||||||||||||
| Series Seed Convertible Preferred Stock (acquired 6/21/13-6/30/14) | (I) (L3) | 4,194,630 | $ | 1,250,000 | $ | 105,304 | ||||||||||||||||||||||||||
| Series Seed-2 Convertible Preferred Stock (acquired 1/22/16) | (I) (L3) | 1,476,668 | 500,000 | 37,818 | ||||||||||||||||||||||||||||
| Series A-2 Convertible Preferred Stock (acquired 3/23/17) | (I) (L3) | 1,471,577 | 350,000 | 58,317 | ||||||||||||||||||||||||||||
| $ | 2,100,000 | $ | 201,439 | |||||||||||||||||||||||||||||
| HALE.life Corporation | Health Care Technology | |||||||||||||||||||||||||||||||
| Common Stock (acquired 3/1/16) | (I) (L3) | 1,000,000 | $ | 10 | $ | 0 | ||||||||||||||||||||||||||
| Series Seed-1 Convertible Preferred Stock (acquired 3/28/17) | (I) (L3) | 11,000,000 | 1,896,920 | 0 | ||||||||||||||||||||||||||||
| Series Seed-2 Convertible Preferred Stock (acquired 12/28/18) | (I) (L3) | 12,083,132 | 2,500,000 | 0 | ||||||||||||||||||||||||||||
| $ | 4,396,930 | $ | 0 | |||||||||||||||||||||||||||||
Total Non-Controlled Affiliated Legacy Privately Held Equity and Equity-Related Securities (0.4%) | $ | 6,496,930 | $ | 201,439 | ||||||||||||||||||||||||||||
| Non-Controlled Affiliated Derivative Securities | ||||||||||||||||||||||||||||||||
| Potbelly Corporation | Restaurants | |||||||||||||||||||||||||||||||
| Warrants for the Purchase of Common Stock expiring 2/12/26 (acquired 2/10/21) | (I) (L3) | 80,605 | $ | 224,849 | $ | 467,485 | ||||||||||||||||||||||||||
| Synchronoss Technologies, Inc. (Options) | Application Software | |||||||||||||||||||||||||||||||
| Stock Options for Common Stock Expiring 12/4/30 (acquired 12/4/23) | (I) (L3) | 3,334 | 0 | 12,629 | ||||||||||||||||||||||||||||
Total Non-Controlled Affiliated Derivative Securities (1.0%) | $ | 224,849 | $ | 480,114 | ||||||||||||||||||||||||||||
Total Non-Controlled Affiliated Securities (54.9%) | $ | 47,558,730 | $ | 27,576,277 | ||||||||||||||||||||||||||||
Total Controlled Non-Controlled Affiliated Equity and Equity-Related Securities (54.9%) | $ | 47,558,730 | $ | 27,576,277 | ||||||||||||||||||||||||||||
The accompanying notes are an integral part of these consolidated financial statements.
F-219
NOTE 14. INVESTMENTS AND ADVANCES TO AFFILIATES - SCHEDULE 12-14
| Name of Issuer | Title of Issue or Nature of Indebtedness (A) | Amount of Dividends or Interest Credited to Income (B) | Net Realized Gain (Loss) | Value as of December 31, 2022 | Gross Additions (C) | Gross Reductions (D) | Net Change in Unrealized Appreciation (Depreciation) | Value as of December 31, 2023 | ||||||||||||||||||||||||||||||||||||||||||
CONTROLLED AFFILIATED EQUITY & EQUITY-RELATED SECURITIES(E): | ||||||||||||||||||||||||||||||||||||||||||||||||||
| Parabellum Acquisition Partners, LLC | Membership Units | $ | 0 | $ | (2,923,003) | $ | 2,706,572 | $ | 0 | $ | (2,706,572) | $ | 216,431 | $ | 0 | |||||||||||||||||||||||||||||||||||
Total Controlled Affiliated Equity & Equity-Related Securities | $ | 0 | $ | (2,923,003) | $ | 2,706,572 | $ | 0 | $ | (2,706,572) | $ | 216,431 | $ | 0 | ||||||||||||||||||||||||||||||||||||
NON-CONTROLLED AFFILIATED LEGACY PRIVATELY HELD EQUITY & EQUITY-RELATED SECURITIES(F): | ||||||||||||||||||||||||||||||||||||||||||||||||||
EchoPixel, Inc. | Series Seed Convertible Preferred Stock | $ | 0 | $ | 0 | $ | 78,993 | $ | 26,311 | $ | 0 | $ | 26,311 | $ | 105,304 | |||||||||||||||||||||||||||||||||||
| Series Seed-2 Convertible Preferred Stock | 0 | 0 | 28,553 | 9,265 | 0 | 9,265 | 37,818 | |||||||||||||||||||||||||||||||||||||||||||
| Series A-2 Convertible Preferred Stock | 0 | 0 | 51,340 | 6,977 | 0 | 6,977 | 58,317 | |||||||||||||||||||||||||||||||||||||||||||
HALE.life Corporation | Common Stock | $ | 0 | $ | 0 | $ | 0 | $ | 0 | $ | 0 | $ | 0 | $ | 0 | |||||||||||||||||||||||||||||||||||
| Series Seed-1 Convertible Preferred Stock | 0 | 0 | 0 | 0 | 0 | 0 | 0 | |||||||||||||||||||||||||||||||||||||||||||
| Series Seed-2 Convertible Preferred Stock | 0 | 0 | 0 | 0 | 0 | 0 | 0 | |||||||||||||||||||||||||||||||||||||||||||
Total Non-Controlled Affiliated Legacy Privately Held Equity & Equity-Related Securities | $ | 0 | $ | 0 | $ | 158,886 | $ | 42,553 | $ | 0 | $ | 42,553 | $ | 201,439 | ||||||||||||||||||||||||||||||||||||
| NON-CONTROLLED AFFILIATED PUBLICLY TRADED EQUITY & EQUITY-RELATED SECURITIES(F): | ||||||||||||||||||||||||||||||||||||||||||||||||||
Arena Group Holdings, Inc. | Common Stock | $ | 0 | $ | 0 | $ | 8,147,090 | $ | 0 | $ | (5,788,053) | $ | (6,758,319) | $ | 2,359,037 | |||||||||||||||||||||||||||||||||||
comScore, Inc. | Common Stock | $ | 0 | $ | 8 | $ | 4,534,991 | $ | 946,918 | $ | 0 | $ | (1,650,366) | $ | 5,481,909 | |||||||||||||||||||||||||||||||||||
Potbelly Corporation | Common Stock | $ | 0 | $ | 1,118,151 | $ | 8,843,873 | $ | 5,075,173 | $ | 0 | $ | 6,047,130 | $ | 13,919,046 | |||||||||||||||||||||||||||||||||||
| Warrants for Common Stock | 0 | 0 | 215,631 | 251,854 | 0 | 251,854 | 467,485 | |||||||||||||||||||||||||||||||||||||||||||
| NON-CONTROLLED AFFILIATED PUBLICLY TRADED EQUITY & EQUITY-RELATED SECURITIES(F): | ||||||||||||||||||||||||||||||||||||||||||||||||||
Synchronoss Technologies, Inc. | Common Stock | $ | 0 | $ | (108,620) | $ | 3,379,203 | $ | 1,755,529 | $ | 0 | $ | 527,050 | $ | 5,134,732 | |||||||||||||||||||||||||||||||||||
| Options for Common Stock | 0 | 0 | 0 | 12,629 | 0 | 12,629 | 12,629 | |||||||||||||||||||||||||||||||||||||||||||
Total Non- Controlled Affiliated Publicly Traded Equity & Equity-Related Securities | $ | 0 | $ | 1,009,539 | $ | 25,120,788 | $ | 8,042,103 | $ | (5,788,053) | $ | (1,570,022) | $ | 27,374,838 | ||||||||||||||||||||||||||||||||||||
Total Controlled and Non- Controlled Affiliated Equity & Equity-Related Securities | $ | 0 | $ | (1,913,464) | $ | 27,986,246 | $ | 8,084,656 | $ | (8,494,625) | $ | (1,311,038) | $ | 27,576,277 | ||||||||||||||||||||||||||||||||||||
______________
(A)Common stock, warrants, options, membership units and, in some cases, preferred stock are generally non-income producing and restricted. The principal amount of debt and the number of shares of common and preferred stock and number of membership units are shown in the accompanying Consolidated Schedule of Investments as of December 31, 2023.
(B)Represents the total amount of interest or dividends credited/(debited) to income for the portion of the period an investment was a control or affiliate investment, as appropriate. Amounts credited to preferred or common stock represent accrued bridge note interest related to conversions that occurred during the year ended December 31, 2023.
(C)Gross additions include increases in investments resulting from new portfolio investments, paid-in-kind interest or dividends, the amortization of discounts and fees. Gross additions also include net increases in unrealized appreciation or decreases in unrealized depreciation.
(D)Gross reductions include decreases in investments resulting from principal collections related to investment repayments or sales, the amortization of premiums and acquisition costs. Gross reductions also include net increases in unrealized depreciation or decreases in unrealized appreciation.
The accompanying notes are an integral part of these consolidated financial statements.
F-220
(E)“Controlled Affiliated” is defined as investments in which we own 25 percent or more of the outstanding voting rights of the portfolio company or otherwise control the company, including control of a majority of the seats on the board of directors, or more than 25 percent of the seats on the board of directors, with no other entity or person in control of more director seats than us.
(F)“Non-Controlled Affiliated” is defined as ownership of five percent or more, but less than 25 percent, of the voting shares of the portfolio company, or where we hold the right to appoint one or more members to the portfolio company’s board of directors, but less than 25 percent of the members of the board of directors.
The accompanying notes are an integral part of these consolidated financial statements.
F-221
| 180 DEGREE CAPITAL CORP. CONSOLIDATED STATEMENT OF ASSETS AND LIABILITIES (UNAUDITED) | ||
| June 30, 2025 | ||||||||
| ASSETS | ||||||||
| Investments in securities and other financial instruments, at value: | ||||||||
| Unaffiliated publicly traded equity and equity-related securities (cost: $24,815,009) | $ | 29,431,877 | ||||||
| Unaffiliated money market fund securities (cost: $12,000,000) | 12,000,000 | |||||||
| Non-controlled affiliated publicly traded equity and equity-related securities (cost: $26,451,633) | 7,935,034 | |||||||
| Non-controlled affiliated legacy privately held equity and equity-related securities (cost: $6,496,930) | 75,000 | |||||||
| Unaffiliated derivative securities (cost: $224,849) | 548,114 | |||||||
| Non-controlled affiliated derivative securities (cost: $0) | 15,065 | |||||||
| Unaffiliated rights to milestone payments (cost: $0) | 71,757 | |||||||
| Cash | 577,300 | |||||||
| Prepaid expenses | 117,323 | |||||||
| Other assets | 105,352 | |||||||
Total assets | $ | 50,876,822 | ||||||
| LIABILITIES & NET ASSETS | ||||||||
| Professional fees payable | $ | 2,285,227 | ||||||
| Accounts payable and accrued liabilities | 227,189 | |||||||
| Post-retirement plan liabilities | 337,674 | |||||||
Total liabilities | $ | 2,850,090 | ||||||
| Commitments and contingencies (Note 10) | ||||||||
Net assets | $ | 48,026,732 | ||||||
| Net assets are comprised of: | ||||||||
| Preferred stock, $0.10 par value, 2,000,000 shares authorized; none issued | $ | 0 | ||||||
| Common stock, $0.03 par value, 15,000,000 shares authorized; 11,541,079 issued | 334,594 | |||||||
| Additional paid in capital | 101,578,029 | |||||||
| Total accumulated distributable loss | (47,624,968) | |||||||
| Treasury stock, at cost 1,540,938 shares | (6,260,923) | |||||||
Net assets | $ | 48,026,732 | ||||||
Shares outstanding | 10,000,141 | |||||||
Net asset value per outstanding share | $ | 4.80 | ||||||
The accompanying notes are an integral part of these consolidated financial statements.
F-222
| 180 DEGREE CAPITAL CORP. CONSOLIDATED STATEMENT OF OPERATIONS (UNAUDITED) | ||
| Six Months Ended June 30, 2025 | ||||||||
| Income: | ||||||||
| Interest - unaffiliated money market fund securities | $ | 181,290 | ||||||
| Dividend income | 110,006 | |||||||
| Board fees from portfolio companies | 32,500 | |||||||
| Board fees from portfolio companies - stock grant | 92,953 | |||||||
Total income | 416,749 | |||||||
| Operating fees and expenses: | ||||||||
| Professional | 4,324,271 | |||||||
| Salaries, bonuses and benefits | 1,146,089 | |||||||
| Software | 151,851 | |||||||
| Directors | 133,542 | |||||||
| Insurance | 104,805 | |||||||
| Administration and operations | 55,779 | |||||||
| Rent | 19,975 | |||||||
| Custody | 9,984 | |||||||
| Other | 1,442 | |||||||
Total operating expenses | 5,947,738 | |||||||
Net investment loss | (5,530,989) | |||||||
| Net realized gain from investments: | ||||||||
| Unaffiliated publicly traded equity and equity-related securities | 1,178,096 | |||||||
| Unaffiliated legacy privately held equity and equity-related securities | 100,000 | |||||||
Net realized gain from investments | 1,278,096 | |||||||
| Change in unrealized appreciation (depreciation) on investments: | ||||||||
| Unaffiliated publicly traded equity and equity-related securities | 8,839,590 | |||||||
| Unaffiliated legacy privately held equity and equity-related securities | (100,000) | |||||||
| Non-controlled affiliated publicly traded equity and equity-related securities | (2,813,268) | |||||||
| Unaffiliated rights to milestone payments | 1,301 | |||||||
Net change in unrealized appreciation on investments | 5,927,623 | |||||||
Net realized gain and change in unrealized appreciation on investments | 7,205,719 | |||||||
Net increase in net assets resulting from operations | $ | 1,674,730 | ||||||
The accompanying notes are an integral part of these consolidated financial statements.
F-223
| 180 DEGREE CAPITAL CORP. CONSOLIDATED STATEMENT OF CASH FLOWS (UNAUDITED) | ||
| Six Months Ended June 30, 2025 | ||||||||
| Cash flows provided by operating activities: | ||||||||
| Net increase in net assets resulting from operations | $ | 1,674,730 | ||||||
| Adjustments to reconcile net decrease in net assets resulting from operations to net cash provided by operating activities: | ||||||||
| Net realized gain from investments | (1,278,096) | |||||||
| Net change in unrealized appreciation on investments | (5,927,623) | |||||||
| Board fees from portfolio companies - stock grant | (92,953) | |||||||
| Depreciation of fixed assets | 1,442 | |||||||
| Purchase of unaffiliated publicly traded equity and equity-related securities | (1,969,210) | |||||||
| Purchase of unaffiliated money market fund securities, net | (6,000,000) | |||||||
| Proceeds from sale of unaffiliated publicly traded equity and equity-related securities | 11,900,572 | |||||||
| Proceeds from sale of unaffiliated legacy privately held equity and equity-related securities | 100,000 | |||||||
| Changes in assets and liabilities: | ||||||||
| Decrease in prepaid expenses | 99,245 | |||||||
| Increase in other assets | (74,939) | |||||||
| Increase in professional fees payables | 2,285,227 | |||||||
| Decrease in accounts payable and accrued liabilities | (678,389) | |||||||
| Decrease in post-retirement plan liabilities | (14,806) | |||||||
| Net cash provided by operating activities | 25,200 | |||||||
Net increase in cash | 25,200 | |||||||
| Cash at beginning of the year/period | 552,100 | |||||||
Cash at end of the period* | $ | 577,300 | ||||||
_______________
*The Company had $12,000,000 held in money market securities as of June 30, 2025, that is not treated as cash or a cash equivalent for reporting purposes.
The accompanying notes are an integral part of these consolidated financial statements.
F-224
| 180 DEGREE CAPITAL CORP. CONSOLIDATED STATEMENTS OF CHANGES IN NET ASSETS | ||
| Period Ended June 30, 2025 | Year Ended December 31, 2024 | |||||||||||||
| (UNAUDITED) | (AUDITED) | |||||||||||||
| Changes in net assets from operations: | ||||||||||||||
| Net investment loss | $ | (5,530,989) | $ | (4,019,686) | ||||||||||
| Net realized gain (loss) on investments | 1,278,096 | (3,670,653) | ||||||||||||
| Net change in unrealized appreciation on investments | 5,927,623 | 3,824,181 | ||||||||||||
Net increase (decrease) in net assets resulting from operations | 1,674,730 | (3,866,158) | ||||||||||||
Net increase (decrease) in net assets | 1,674,730 | (3,866,158) | ||||||||||||
| Net Assets: | ||||||||||||||
| Beginning of the period/year | 46,352,002 | 50,218,160 | ||||||||||||
| End of the period/year | $ | 48,026,732 | $ | 46,352,002 | ||||||||||
The accompanying notes are an integral part of these consolidated financial statements.
F-225
| 180 DEGREE CAPITAL CORP. CONSOLIDATED FINANCIAL HIGHLIGHTS | ||
| Six Months Ended Jun 30, 2025 | Year Ended Dec. 31, 2024 | Year Ended Dec. 31, 2023 | Year Ended Dec. 31, 2022 | Year Ended Dec. 31, 2021 | Year Ended Dec. 31 2020# | ||||||||||||||||||||||||||||||||||||
| (UNAUDITED) | (AUDITED) | (AUDITED) | (AUDITED) | (AUDITED) | (AUDITED) | ||||||||||||||||||||||||||||||||||||
| Per Share Operating Performance: | |||||||||||||||||||||||||||||||||||||||||
| Net asset value per share, beginning of the period/year | $ | 4.64 | $ | 5.02 | $ | 6.32 | $ | 10.66 | $ | 9.28 | $ | 9.18 | |||||||||||||||||||||||||||||
Net investment loss* | (0.55) | (0.40) | (0.38) | (0.25) | (0.33) | (0.05) | |||||||||||||||||||||||||||||||||||
Net realized gain (loss)* | 0.12 | (0.37) | (0.56) | 0.21 | 0.20 | (0.11) | |||||||||||||||||||||||||||||||||||
Net change in unrealized appreciation (depreciation) on investments and options*1 | 0.59 | 0.39 | (0.42) | (4.30) | 1.51 | 0.26 | |||||||||||||||||||||||||||||||||||
| Total from investment operations* | 0.16 | (0.38) | (1.36) | (4.34) | 1.38 | 0.10 | |||||||||||||||||||||||||||||||||||
| Net increase as a result of purchase of treasury stock | 0.00 | 0.00 | 0.06 | 0.00 | 0.00 | 0.00 | |||||||||||||||||||||||||||||||||||
| Net increase (decrease) in net asset value | 0.16 | (0.38) | (1.30) | (4.34) | 1.38 | 0.10 | |||||||||||||||||||||||||||||||||||
| Net asset value per share, end of the period/year | $ | 4.80 | $ | 4.64 | $ | 5.02 | $ | 6.32 | $ | 10.66 | $ | 9.28 | |||||||||||||||||||||||||||||
| Stock price per share, end of the period/year | $ | 3.974 | $ | 3.67 | $ | 4.10 | $ | 5.28 | $ | 7.35 | $ | 6.66 | |||||||||||||||||||||||||||||
| Total return based on stock price | 8.28 | % | (10.49) | % | (22.35) | % | (28.16) | % | 10.36 | % | 3.26 | % | |||||||||||||||||||||||||||||
| Supplemental Data: | |||||||||||||||||||||||||||||||||||||||||
| Net assets, end of the period/year | $ | 48,026,732 | $ | 46,352,002 | $ | 50,218,160 | $ | 65,545,149 | $ | 110,575,952 | $ | 96,317,794 | |||||||||||||||||||||||||||||
| Ratio of expenses to average net assets | 12.91 | % | 8.88 | % | 6.39 | % | 3.20 | % | ^ | 5.87 | % | ^ | 4.61 | % | ^ | ||||||||||||||||||||||||||
| Ratio of net investment loss to average net assets | (11.97) | % | (8.47) | % | (6.30) | % | (2.88) | % | (3.26) | % | (0.59) | % | |||||||||||||||||||||||||||||
| Portfolio turnover | 4.27 | % | 26.61 | % | 31.56 | % | 30.95 | % | 44.46 | % | 35.16 | % | |||||||||||||||||||||||||||||
| Number of shares outstanding, end of the period/year | 10,000,141 | 10,000,141 | 10,000,141 | 10,373,820 | 10,373,820 | 10,373,820 | |||||||||||||||||||||||||||||||||||
_______________
# Reflect a 1-for-3 reverse stock split that became effective on January 4, 2021.
* Based on average shares outstanding.
^ The Company has entered into an expense offsetting arrangement with one of its unaffiliated brokers relating to broker fees paid. The total broker fee charged to the Company was applied as a credit to fees charged by an affiliate of the unaffiliated broker who the Company
The accompanying notes are an integral part of these consolidated financial statements.
F-226
subscribes to for data services billed during the year. The Company received an offset to expense totaling approximately $20,600, $84,800, and $31,900, with that broker for the years ended December 31, 2022-2020, respectively.
(1)Net unrealized losses include rounding adjustments to reconcile change in net asset value per share.
The accompanying notes are an integral part of these consolidated financial statements.
F-227
| 180 DEGREE CAPITAL CORP. CONSOLIDATED SCHEDULE OF INVESTMENTS AS OF JUNE 30, 2025 (UNAUDITED) | ||||||||||||||||||||||||||||||||
| (UNAUDITED) | ||||||||||||||||||||||||||||||||
| Method of Valuation (1) | Industry | Shares/Units | Cost | Value | ||||||||||||||||||||||||||||
Investments in Unaffiliated Equity and Equity-Related Securities (2) - | ||||||||||||||||||||||||||||||||
| 86.3% of net assets at value | ||||||||||||||||||||||||||||||||
| Unaffiliated Publicly Traded Equity and Equity-Related Securities - | ||||||||||||||||||||||||||||||||
| 61.3% of net assets at value | ||||||||||||||||||||||||||||||||
Arena Group Holdings, Inc. (3) | Interactive Media & Services | |||||||||||||||||||||||||||||||
| Provides a shared digital publishing, advertising and distribution platform | ||||||||||||||||||||||||||||||||
| Common Stock | (L1) | 750,000 | $ | 6,985,914 | $ | 4,650,000 | ||||||||||||||||||||||||||
Ascent Industries Co. (3) | Specialty Chemicals | |||||||||||||||||||||||||||||||
| Manufactures chemicals | ||||||||||||||||||||||||||||||||
| Common Stock | (L1) | 366,860 | 3,841,387 | 4,626,105 | ||||||||||||||||||||||||||||
Aviat Networks, Inc. (3) | Communications Equipment | |||||||||||||||||||||||||||||||
| Provides IP solutions to wireless public and private telecommunication operators. | ||||||||||||||||||||||||||||||||
| Common Stock | (L1) | 9,600 | 198,157 | 230,880 | ||||||||||||||||||||||||||||
Commercial Vehicle Group, Inc. (3) | Construction Machinery & Heavy Trucks | |||||||||||||||||||||||||||||||
| Supplier of vehicle components | ||||||||||||||||||||||||||||||||
| Common Stock | (L1) | 410,000 | 2,259,403 | 680,600 | ||||||||||||||||||||||||||||
Hudson Technologies, Inc. (3) | Trading Companies & Distributors | |||||||||||||||||||||||||||||||
| Provides HVAC-related products and services | ||||||||||||||||||||||||||||||||
| Common Stock | (L1) | 37,708 | 246,327 | 306,189 | ||||||||||||||||||||||||||||
Lantronix, Inc. (3) | Communications Equipment | |||||||||||||||||||||||||||||||
| Provides secure data access and management solutions | ||||||||||||||||||||||||||||||||
The accompanying notes are an integral part of these consolidated financial statements.
F-228
| 180 DEGREE CAPITAL CORP. CONSOLIDATED SCHEDULE OF INVESTMENTS AS OF JUNE 30, 2025 (UNAUDITED) | ||||||||||||||||||||||||||||||||
| (UNAUDITED) | ||||||||||||||||||||||||||||||||
| Method of Valuation (1) | Industry | Shares/Units | Cost | Value | ||||||||||||||||||||||||||||
| Common Stock | (L1) | 668,711 | 2,198,457 | 1,919,201 | ||||||||||||||||||||||||||||
Mama's Creations, Inc. (3) | Packaged Foods & Meats | |||||||||||||||||||||||||||||||
| Provides packaged food products | ||||||||||||||||||||||||||||||||
| Common Stock | (L1) | 42,245 | 264,247 | 350,634 | ||||||||||||||||||||||||||||
Investments in Unaffiliated Equity and Equity-Related Securities (2) - | ||||||||||||||||||||||||||||||||
| 86.3% of net assets at value (cont.) | ||||||||||||||||||||||||||||||||
| Unaffiliated Publicly Traded Equity and Equity-Related Securities - | ||||||||||||||||||||||||||||||||
| 61.3% of net assets at value (cont.) | ||||||||||||||||||||||||||||||||
Potbelly Corporation (3) | Restaurants | |||||||||||||||||||||||||||||||
| Operates a chain of sandwich shops | ||||||||||||||||||||||||||||||||
| Common Stock | (L1) | 1,091,206 | $ | 5,622,618 | $ | 13,367,274 | ||||||||||||||||||||||||||
RF Industries, Ltd. (3) | Electronic Manufacturing Services | |||||||||||||||||||||||||||||||
| Provides products that enable wired and wireless communications | ||||||||||||||||||||||||||||||||
| Common Stock | (L1) | 472,506 | 2,924,335 | 3,057,114 | ||||||||||||||||||||||||||||
Miscellaneous Holdings (3)(4) | ||||||||||||||||||||||||||||||||
| Common Stock | (L1) | 274,164 | 243,880 | |||||||||||||||||||||||||||||
| Total Unaffiliated Publicly Traded Equity and Equity-Related Securities (cost: $24,815,009) | $ | 29,431,877 | ||||||||||||||||||||||||||||||
| Unaffiliated Money Market Fund Securities - | ||||||||||||||||||||||||||||||||
| 25.0% of net assets at value | ||||||||||||||||||||||||||||||||
| JPMorgan 100% U.S. Treasury Securities Money Market Fund - Premier | ||||||||||||||||||||||||||||||||
| (Yield 3.89%) | (L1) | 6,000,000 | $ | 6,000,000 | $ | 6,000,000 | ||||||||||||||||||||||||||
| JPMorgan 100% U.S. Treasury Securities Money Market Fund - Capital | ||||||||||||||||||||||||||||||||
| (Yield 4.14%) | (L1) | 6,000,000 | 6,000,000 | 6,000,000 | ||||||||||||||||||||||||||||
The accompanying notes are an integral part of these consolidated financial statements.
F-229
| 180 DEGREE CAPITAL CORP. CONSOLIDATED SCHEDULE OF INVESTMENTS AS OF JUNE 30, 2025 (UNAUDITED) | ||||||||||||||||||||||||||||||||
| (UNAUDITED) | ||||||||||||||||||||||||||||||||
| Method of Valuation (1) | Industry | Shares/Units | Cost | Value | ||||||||||||||||||||||||||||
| Total Unaffiliated Money Market Fund Securities (cost: $12,000,000) | $ | 12,000,000 | ||||||||||||||||||||||||||||||
| Total Investments in Unaffiliated Equity and Equity-Related Securities (cost: $36,815,009) | $ | 41,431,877 | ||||||||||||||||||||||||||||||
Investments in Non-Controlled Affiliated Equity and Equity-Related Securities (2) - | ||||||||||||||||||||||||||||||||
| 16.7% of net assets at value | ||||||||||||||||||||||||||||||||
| Non-Controlled Affiliated Publicly Traded Equity and Equity-Related Securities - | ||||||||||||||||||||||||||||||||
| 16.5% of net assets at value | ||||||||||||||||||||||||||||||||
comScore, Inc. (3)(5) | Advertising | |||||||||||||||||||||||||||||||
| Provides technology and services that measure audiences, brands and consumer behavior | ||||||||||||||||||||||||||||||||
| Common Stock | (L1) | 400,451 | $ | 13,348,438 | $ | 1,930,174 | ||||||||||||||||||||||||||
Synchronoss Technologies, Inc. (3)(5) | Application Software | |||||||||||||||||||||||||||||||
| Provides white-label cloud storage, messaging and other digital analytic services | ||||||||||||||||||||||||||||||||
| Common Stock | (L1) | 866,788 | 13,010,242 | 5,937,498 | ||||||||||||||||||||||||||||
Common Stock (6)(7) | (M) (L2) | 12,000 | 92,953 | 67,362 | ||||||||||||||||||||||||||||
| 13,103,195 | 6,004,860 | |||||||||||||||||||||||||||||||
| Total Non-Controlled Affiliated Publicly Traded Equity and Equity-Related Securities (cost: $26,451,633) | $ | 7,935,034 | ||||||||||||||||||||||||||||||
| Non-Controlled Affiliated Legacy Privately Held Equity and Equity-Related Securities - | ||||||||||||||||||||||||||||||||
| 0.2% of net assets at value | ||||||||||||||||||||||||||||||||
EchoPixel, Inc. (3)(6)(8) | Health Care Equipment | |||||||||||||||||||||||||||||||
| Develops virtual reality 3-D visualization software for life sciences and health care applications | ||||||||||||||||||||||||||||||||
The accompanying notes are an integral part of these consolidated financial statements.
F-230
| 180 DEGREE CAPITAL CORP. CONSOLIDATED SCHEDULE OF INVESTMENTS AS OF JUNE 30, 2025 (UNAUDITED) | ||||||||||||||||||||||||||||||||
| (UNAUDITED) | ||||||||||||||||||||||||||||||||
| Method of Valuation (1) | Industry | Shares/Units | Cost | Value | ||||||||||||||||||||||||||||
| Series Seed Convertible Preferred Stock (acquired 6/21/13-6/30/14) | (M) (L3) | 4,194,630 | $ | 1,250,000 | $ | 44,044 | ||||||||||||||||||||||||||
| Series Seed-2 Convertible Preferred Stock (acquired 1/22/16) | (M) (L3) | 1,476,668 | 500,000 | 15,505 | ||||||||||||||||||||||||||||
| Series A-2 Convertible Preferred Stock (acquired 3/23/17) | (M) (L3) | 1,471,577 | 350,000 | 15,451 | ||||||||||||||||||||||||||||
| 2,100,000 | 75,000 | |||||||||||||||||||||||||||||||
HALE.life Corporation (3)(6)(8) | Health Care Technology | |||||||||||||||||||||||||||||||
| Develops a platform to facilitate precision health and medicine | ||||||||||||||||||||||||||||||||
| Common Stock (acquired 3/1/16) | (I) (L3) | 1,000,000 | 10 | 0 | ||||||||||||||||||||||||||||
| Series Seed-1 Convertible Preferred Stock (acquired 3/28/17) | (I) (L3) | 11,000,000 | 1,896,920 | 0 | ||||||||||||||||||||||||||||
| Series Seed-2 Convertible Preferred Stock (acquired 12/28/18) | (I) (L3) | 12,083,132 | 2,500,000 | 0 | ||||||||||||||||||||||||||||
| 4,396,930 | 0 | |||||||||||||||||||||||||||||||
| Total Non-Controlled Affiliated Legacy Privately Held Equity and Equity-Related Securities (cost: $6,496,930) | $ | 75,000 | ||||||||||||||||||||||||||||||
| Total Investments in Non-Controlled Affiliated Equity and Equity-Related Securities (cost: $32,948,563) | $ | 8,010,034 | ||||||||||||||||||||||||||||||
| Total Investments in Publicly Traded Equity and Equity-Related Securities, Money Market Funds, and Legacy Privately Held Equity and Equity-Related Securities (cost: $69,763,572) | $ | 49,441,911 | ||||||||||||||||||||||||||||||
| Derivative Securities - | ||||||||||||||||||||||||||||||||
| 1.2% of net assets at value | ||||||||||||||||||||||||||||||||
Unaffiliated Derivative Securities (2) - | ||||||||||||||||||||||||||||||||
| 1.2% of net assets at value | ||||||||||||||||||||||||||||||||
Potbelly Corporation (3) | Restaurants | |||||||||||||||||||||||||||||||
| Operates a chain of sandwich shops | ||||||||||||||||||||||||||||||||
| Warrants for the Purchase of Common Stock expiring 2/12/26 (acquired 2/10/21) | (M) (L2) | 80,605 | $ | 224,849 | $ | 548,114 | ||||||||||||||||||||||||||
| Total Unaffiliated Derivative Securities (cost: $224,849) | $ | 548,114 | ||||||||||||||||||||||||||||||
The accompanying notes are an integral part of these consolidated financial statements.
F-231
| 180 DEGREE CAPITAL CORP. CONSOLIDATED SCHEDULE OF INVESTMENTS AS OF JUNE 30, 2025 (UNAUDITED) | ||||||||||||||||||||||||||||||||
| (UNAUDITED) | ||||||||||||||||||||||||||||||||
| Method of Valuation (1) | Industry | Shares/Units | Cost | Value | ||||||||||||||||||||||||||||
Non-Controlled Affiliated Derivative Securities (2) - | ||||||||||||||||||||||||||||||||
| 0.0% of net assets at value | ||||||||||||||||||||||||||||||||
Synchronoss Technologies, Inc. (3)(5)(6)(7) | Application Software | |||||||||||||||||||||||||||||||
| Provides white-label cloud storage, messaging and other digital analytic services | ||||||||||||||||||||||||||||||||
| Stock Options for Common Stock Expiring 12/4/30 (acquired 12/4/23) | (I) (L3) | 3,334 | $ | 0 | $ | 15,065 | ||||||||||||||||||||||||||
| Total Non-Controlled Affiliated Derivative Securities (cost: $0) | $ | 15,065 | ||||||||||||||||||||||||||||||
| Total Derivative Securities (cost: $224,849) | $ | 563,179 | ||||||||||||||||||||||||||||||
| Total Investments (cost: $69,988,421) | $ | 50,005,090 | ||||||||||||||||||||||||||||||
Other Financial Instruments (9) - | ||||||||||||||||||||||||||||||||
Unaffiliated Rights to Payments (Illiquid) (2) - | ||||||||||||||||||||||||||||||||
| 0.2% of net assets at value | ||||||||||||||||||||||||||||||||
Rights to Milestone Payments from Acquisition of TARA Biosystems, Inc. (acquired 4/1/22) (3)(6)(8)(10) | (I) (L3) | Pharmaceuticals | $ | 0 | $ | 0 | $ | 71,757 | ||||||||||||||||||||||||
| Total Unaffiliated Rights to Payments (cost: $0) | $ | 71,757 | ||||||||||||||||||||||||||||||
| Total Investments in Publicly Traded and Privately Held Equity, Money Market Fund and Equity-Related Securities, Derivative Securities and Other Financial Instruments (cost: $69,988,421) | $ | 50,076,847 | ||||||||||||||||||||||||||||||
The accompanying notes are an integral part of these consolidated financial statements.
F-232
Notes to Consolidated Schedule of Investments
(a)See Note 2. Summary of Significant Accounting Policies: Portfolio Investment Valuation.
(b)Investments in unaffiliated securities consist of investments in which the Company owns less than five percent of the voting shares of the portfolio company. Investments in non-controlled affiliated securities consist of investments in which the Company owns five percent or more, but less than 25 percent, of the voting shares of the portfolio company, or where the Company controls one or more seats on the portfolio company’s board of directors but does not control the company. Investments in controlled affiliated securities consist of investments in which the Company owns 25 percent or more of the outstanding voting rights of the portfolio company or otherwise controls the company, including control of a majority of the seats on the board of directors, or more than 25 percent of the seats on the board of directors, with no other entity or person in control of more director seats than us.
(c)Represents a non-income producing investment. Investments that have not paid dividends or interest within the last 12 months or are on non-accrual status for at least 12 consecutive months are considered to be non-income producing.
(d)The identity/identities of these investments have been concealed while the Company completes a purchase or selling program for these securities.
(e)The Company is the investment manager of a separately managed account (“SMA”) that owns shares of these portfolio companies. Under our investment management agreement for the SMA, the Company has the right to control the votes of the securities held by the SMA. The Company has voting ownership between 5 percent and 25 percent in these companies directly or when the shares held by us and our SMA are aggregated.
(f)The Company is subject to legal restrictions on the sale of all or a portion of our investment(s) in this company. The total amount of restricted securities held is $229,184, or 0.5 percent of net assets.
(g)These restricted shares of common stock and stock options for the purchase of common stock were granted to Kevin Rendino in connection with his service as a member of the board of directors of Synchronoss Technologies, Inc. Mr. Rendino entered into an assignment and assumption agreement with the Company that transfers all beneficial and voting interest to the Company.
(h)These securities are held by the Company's wholly owned subsidiary, 180 Degree Private Holdings, LLC (“180PH”), and were transferred from the Company to 180PH in the fourth quarter of 2020. The acquisition dates of the securities reflect the dates such securities were obtained by the Company rather than the transfer date.
(i)Other financial instruments are holdings of the Company that do not meet the definition of a security or a derivative.
(j)If all the remaining milestones are met, the Company would receive approximately $2.7 million. There can be no assurance as to how much of the remaining approximately $2.7 million in potential milestone-based payments will ultimately be realized or when they will be realized, if at all.
The accompanying notes are an integral part of these consolidated financial statements.
F-233
NOTE 1. THE COMPANY
180 Degree Capital Corp. (including its wholly owned subsidiaries, the “Company,” “us,” “our” and “we”), withdrew its election to be treated as a business development company on March 30, 2017, and subsequently returned to its prior status as a registered non-diversified closed-end management investment company (“Closed-End Fund” or “CEF”) under the Investment Company Act of 1940, as amended (the “1940 Act”). We operate as an internally managed investment company whereby our officers and employees, under the general supervision of our Board of Directors, conduct our operations. From May 22, 2020 to December 24, 2024, we were also registered with the Securities and Exchange Commission (“SEC”) as a Registered Investment Adviser under the Investment Advisers Act of 1940, as amended (the “Advisers Act”).
180 Degree Private Holdings, LLC (“180PH”), is a wholly owned limited liability company that was created in October 2020 to hold certain of the Company's securities of privately held companies. 180PH is consolidated for financial reporting purposes and is a disregarded entity for tax purposes under the Internal Revenue Code (“Code”).
As of June 30, 2025, the Company manages approximately $0.8 million in net assets in a separately managed account (“SMA”).
The Company may, in certain cases, receive management fees and carried interest on profits generated on invested capital from any capital under management, if and when capital is raised and if and when profits are realized, respectively. The Company does not consolidate its separately managed account.
NOTE 2. SUMMARY OF SIGNIFICANT ACCOUNTING POLICIES
The following is a summary of significant accounting policies followed in the preparation of the consolidated financial statements:
Principles of Consolidation. The consolidated financial statements have been prepared in accordance with accounting principles generally accepted in the US (“GAAP”) and Articles 6 and 12 of Regulation S-X of the SEC and include the accounts of the Company and its wholly owned subsidiaries. The Company is an investment company following accounting and reporting guidance in Accounting Standards Codification 946. In accordance with GAAP and Regulation S-X under 17 C.F.R. Part 210, the Company may only consolidate its interests in investment company subsidiaries and controlled operating companies whose business consists of providing services to the Company. 180PH is a controlled operating company that provides services to us and is, therefore, consolidated. All significant intercompany accounts and transactions were eliminated in the consolidated financial statements.
Use of Estimates. The preparation of the consolidated financial statements in conformity with GAAP requires management to make estimates and assumptions that affect the reported amounts of assets and liabilities and contingent assets and liabilities and the reported amounts of revenues and expenses. Actual results could differ from these estimates, and the differences could be material. The most significant estimates relate to the fair valuations of our investments.
Portfolio Investment Valuations. Investments are stated at “value” as defined in the 1940 Act and in the applicable regulations of the SEC and in accordance with GAAP. Value, as defined in Section 2(a)(41) of the 1940 Act, is (i) the market price for those securities for which a market quotation is readily available and (ii) the fair value as determined in good faith by, or under the direction of, the Board of Directors for all other assets. The Valuation Committee, comprised of all of the independent Board members, is responsible for determining the valuation of the Company’s assets within the guidelines established by the Board of Directors, pursuant with SEC Rule 2a-5. The Valuation Committee receives information and recommendations from management. The Company may from time to time use an independent valuation firm to review select portfolio company valuations on an as needed basis. The independent valuation firm, when engaged by the Company, does not provide independent valuations. The fair values assigned to these investments are based on available information and do not necessarily represent amounts that might ultimately be realized when that investment is sold, as such amounts depend on future circumstances and cannot reasonably be determined until the individual investments are actually liquidated or become readily
F-234
marketable. The Valuation Committee values the Company's investment assets as of the end of each calendar quarter and as of any other time requested by the Board of Directors.
Accounting Standards Codification Topic 820, “Fair Value Measurements,” (“ASC 820”) defines fair value as the price that would be received to sell an asset or paid to transfer a liability in an orderly transaction between market participants at the measurement date (exit price). It applies fair value terminology to all valuations whereas the 1940 Act applies market value terminology to readily marketable assets and fair value terminology to other assets.
The main approaches to measuring fair value utilized are the market approach, the income approach and the hybrid approach.
•Market Approach (M): The market approach focuses on inputs and not techniques. The market approach may use quantitative inputs such as prices and other relevant information generated by market transactions involving identical or comparable assets or liabilities and the values of market multiples derived from a set of comparable companies. The market approach may also use qualitative inputs such as progress toward milestones, the long-term potential of the business, current and future financing requirements and the rights and preferences of certain securities versus those of other securities. The selection of the relevant inputs used to derive value under the market approach requires judgment considering factors specific to the significance and relevance of each input to deriving value.
•Income Approach (I): The income approach focuses on techniques and not inputs. The income approach uses valuation techniques to convert future amounts (for example, revenue, cash flows or earnings) to a single present value amount (discounted). The measurement is based on the value indicated by current market expectations about those future amounts. Those valuation techniques include present value techniques; option-pricing models, such as the Black-Scholes-Merton formula (a closed-form model) and a binomial model (a lattice model), which incorporate present value techniques; and the multi-period excess earnings method, which is used to measure the fair value of certain assets.
•Hybrid Approach (H): The hybrid approach uses elements of both the market approach and the income approach. The hybrid approach calculates values using the market and income approach, individually. The resulting values are then distributed among the share classes based on probability of exit outcomes.
ASC Topic 820 classifies the inputs used to measure fair value by these approaches into the following hierarchy:
•Level 1 (L1): Unadjusted quoted prices in active markets for identical assets or liabilities;
•Level 2 (L2): Inputs other than quoted prices included within Level 1 that are observable for the asset or liability, either directly or indirectly. These include quoted prices in active markets for similar assets or liabilities, or quoted prices for identical or similar assets or liabilities in markets that are not active, or inputs other than quoted prices that are observable for the asset or liability, either directly or indirectly, for substantially the full term of the financial instrument. Level 2 inputs are in those markets for which there are few transactions, the prices are not current, little public information exists or instances where prices vary substantially over time or among brokered market makers; and
•Level 3 (L3): Inputs to the valuation methodology are unobservable and significant to the fair value measurement. Unobservable inputs are those inputs that reflect our own assumptions that market participants would use to price the asset or liability based upon the best available information.
Financial assets and liabilities are classified in their entirety based on the lowest level of input that is significant to the fair value measurement and are not necessarily an indication of risks associated with the investment.
As of June 30, 2025, our financial statements include investments fair valued by the Board of Directors of $777,298. The fair values were determined in good faith by, or under the direction of, the Board of Directors. The
F-235
fair value amount includes the values of our investments in legacy privately held companies and rights to future milestone payments, as well as our warrants for the purchase of common stock of Potbelly Corporation, our options for the purchase of common stock of Synchronoss Technologies, Inc., and our restricted common stock of Synchronoss Technologies, Inc.
Cash. Cash includes demand deposits. Cash is carried at cost, which approximates fair value.
Unaffiliated Rights to Payments. At June 30, 2025, the outstanding potential milestone from the acquisition of TARA Biosystems, Inc., by Valo Health, LLC was valued at $71,757. The milestone payments are valued using the probability-adjusted, present value of proceeds from future payments that would be due upon successful completion of certain regulatory milestones. There can be no assurance as to how much of the amounts related to milestone payments that we will ultimately realize or when they will be realized, if at all.
Prepaid Expenses. We include prepaid insurance premiums in “Prepaid expenses.” Prepaid insurance premiums are recognized over the term of the insurance contract and are included in “Insurance” in the Company's Consolidated Statement of Operations.
Property and Equipment. Property and equipment are included in “Other assets” and were carried at $2,871 at June 30, 2025, representing cost of $229,818, less accumulated depreciation of $226,947. Depreciation is provided using the straight-line method over the estimated useful lives of the property and equipment. We estimate the useful lives to be five to ten years for furniture and fixtures, and three years for computer equipment.
Post-Retirement Plan Liabilities. Until it was terminated on April 27, 2017, the Company provided a Retiree Medical Benefit Plan for employees who met certain eligibility requirements. Until it was terminated on May 5, 2011, the Company also provided an Executive Mandatory Retirement Benefit Plan for certain individuals employed by us in a bona fide executive or high policy-making position. The net periodic post-retirement benefit cost includes service cost and interest cost on the accumulated post-retirement benefit obligation. Unrecognized actuarial gains and losses are recognized as net periodic benefit cost, pursuant to the Company's historical accounting policy in “Salaries, bonus and benefits” in the Company's Consolidated Statement of Operations. The impact of plan amendments was amortized over the employee's average service period as a reduction of net periodic benefit cost. Unamortized prior service cost was fully amortized during 2017 as a result of the termination of the Retiree Medical Benefit Plan.
Interest Income Recognition. Interest income, including amortization of premium and accretion of discount, is recorded on an accrual basis. When accrued interest is determined not to be recoverable, the Company ceases accruing interest and writes off any previously accrued interest. Write-offs are netted in interest income. Securities are deemed to be non-income producing if investments have not paid dividends or interest within the last 12 months or are on non-accrual status for at least 12 consecutive months. When the fair value of a security that includes PIK interest is less than the accrued interest, the Company may place the security on non-accrued status.
Board Fees From Portfolio Companies. The Company recognizes revenues from board fees as those services are provided.
Management Fees and Performance Fees/Carried Interest from Managed Funds. The Company may be entitled to receive management fees and performance fees from clients including separately managed accounts (SMAs) and special purpose vehicles (SPVs). When applicable, the Company accrues management fees on SPVs that are to be paid upon liquidation of the entity regardless of performance. Performance fees or carried interest, if any, is paid annually by SMAs based on a fixed percentage of the increase in net assets during the year. Performance fees on SPVs, if any, are generally paid based on the amount of increase in net assets at the time of any distribution of capital above the amount of initial invested capital plus accrued expenses. The timing and payment terms of management fees and performance fees for future client accounts may be different than those of our current SMAs.
The Company does not include accruals for carried interest in the consolidated financial statements until such carried interest is received and/or the Company concludes that it is probable that a reversal of any accrual will not occur. The Company did not earn or accrue any carried interest in the period ended June 30, 2025.
F-236
Other Income. The Company may purchase restricted securities issued by publicly traded companies that include provisions that provide for payment of partial liquidated damages in the event the issuer does not meet obligations specified in the purchase agreement or other ancillary documents associated with the transaction. These obligations most commonly are associated with the filing of registration statements and/or being up to date with the filing of the issuer's financial statements with the SEC.
Put and Call Options. The Company may purchase options on publicly traded securities as an investment and/or with the intention of limiting its downside risk. When the Company purchases an option, an amount equal to the premium paid is recorded in the Consolidated Statement of Assets and Liabilities as an investment. The Company may also purchase an option at one price and write/sell an option at another price in a simultaneous transaction referred to as a spread. The amount of these assets is subsequently marked-to-market to reflect the current value of the options. In the event that the options are exercised, the Company would be required to deliver those shares to the counterparty. When the options expire unexercised, the Company realizes a loss on the premium paid, or the difference between the premium paid and the premium received, as applicable.
Rent Expense. The Company currently leases and runs daily operations in approximately 1,250 square feet of office space in Montclair, New Jersey. Either the Company or the landlord may terminate the lease at any time with two months' written notice to either party. On November 17, 2021, the Company amended its month-to-month lease to a lease with annual pricing through December 31, 2024, at an average price during the three years covered by the amendment of approximately $30 per square foot. On June 11, 2024, the Company extended the lease agreement for an additional year, starting January 1, 2025 through December 31, 2025, at a price of approximately $32 per square foot. All other terms and conditions remain in full force and effect.
Realized Gain or Loss and Unrealized Appreciation or Depreciation of Portfolio Investments. Realized gain or loss is recognized when an investment is disposed of and is computed as the difference between the Company's cost basis in the investment at the disposition date and the net proceeds received from such disposition. Realized gain or loss on investment transactions are determined by specific identification. Unrealized appreciation or depreciation is computed as the difference between the fair value of the investment and the cost basis of such investment.
Income Taxes. As discussed in Note 9. Income Taxes, the Company did not qualify as a regulated investment company (“RIC”) under Subchapter M of the Code in 2024, and will therefore be taxed as a C-Corporation in 2024. As of June 30, 2025, the Company did not qualify as a RIC, and will therefore be taxed as a C-Corporation in 2025. The Company did not accrue for any income taxes as of June 30, 2025 as it did not generate ordinary income. The Company has capital loss carryforwards that can be used to offset net realized capital gains. The Company also has operating loss carryforwards that can be used to offset operating income and net realized capital gains in years when it fails to qualify as a RIC. The Company recognizes interest and penalties in income tax expense. See Note 9. Income Taxes for further discussion.
Foreign Currency Translation. The accounting records of the Company are maintained in U.S. dollars. All assets and liabilities denominated in foreign currencies are translated into U.S. dollars based on the rate of exchange of such currencies against U.S. dollars on the date of valuation. If Company has assets denominated in foreign currencies, it does not isolate the portion of the results of operations that arises from changes in foreign currency rates on investments held on its Consolidated Statement of Operations.
Securities Transactions. Securities transactions are accounted for on the date the transaction for the purchase or sale of the securities is entered into by the Company (i.e., trade date). Securities transactions outside conventional channels, such as private transactions, are recorded as of the date the Company obtains the right to demand the securities purchased or to collect the proceeds from a sale and incurs the obligation to pay for the securities purchased or to deliver the securities sold.
Concentration of Credit Risk. The Company places its cash with financial institutions and, at times, cash held in depository accounts may exceed the Federal Deposit Insurance Corporation's insured limit and is subject to the credit risk of such institutions to the extent it exceeds such limit.
F-237
Recent Accounting Pronouncements and Adoptions. On November 4, 2024, the Financial Accounting Standards Board (“FASB”) issued ASU 2024-03, “Income Statement—Reporting Comprehensive Income—Expense Disaggregation Disclosures (Subtopic 220-40): Disaggregation of Income Statement Expenses”. This ASU requires that certain costs to be disclosed in each relevant expense captions. The guidance is effective for fiscal years, including interim periods within those fiscal years, beginning after December 15, 2026, and early adoption is permitted. This ASU is not expected to have a material impact on the Company's consolidated financial statements.
NOTE 3. BUSINESS RISKS AND UNCERTAINTIES
Our business activities contain elements of risk. We consider the principal types of market risk to be valuation risk, diversification risk, interest rate risk and foreign currency risk. Although we are risk-seeking rather than risk-averse in our investments, we consider the management of risk to be essential to our business.
Investment Objective
Our investment objective is to generate capital appreciation and current income from investments and investment-related activities such as managed funds and accounts.
Investment Strategy
Our investment strategy on future new investments is focused on generating capital appreciation and current income from investments in what we believe are deeply undervalued, small publicly traded companies where we believe we can positively impact the business and valuation through constructive activism. Historically, our investment strategy was to achieve long-term capital appreciation investing in venture capital investments. While we continue to provide such resources to our existing legacy portfolio companies, we no longer make venture capital investments. We classify our legacy portfolio companies as Legacy Privately Held Equity and Equity-Related Securities.
We believe we combine new perspectives with the historical knowledge and experience of managing the current portfolio. Our investment approach is comprised of a patient examination of available opportunities through due diligence and close involvement with management of our portfolio companies. We invest our capital directly into portfolio companies or through purchases of securities of publicly traded companies directly and through open-market purchases. We may seek to invest our capital alongside capital from other investors through that we control.
We have discretion in the investment of our capital to achieve our objectives by investing in various types of assets, and we do not currently limit our investments to any security type. Our investments may include, among other asset types: equity, equity-related securities (including warrants and options) and debt with equity features from either private or public issuers; debt obligations of all types having varying terms with respect to security or credit support, subordination, purchase price, interest payments and maturity; foreign securities; and miscellaneous investments.
Investment Policies
Fundamental policies may not be changed without the approval of the holders of a majority of our voting securities, as defined in the 1940 Act. As a matter of fundamental policy, the Company will not:
(a)Issue senior securities, borrow money from banks, brokers or other lenders, or engage in transactions involving the issuance by us of “senior securities” representing indebtedness, except to the extent permitted under the 1940 Act or the rules, regulations or interpretations thereof.
(b)Underwrite securities of other issuers, except insofar as we may be deemed an underwriter under the Securities Act of 1933, as amended (the “Securities Act”), in connection with the disposition of our portfolio securities. We may invest in restricted securities (those that must be registered under the Securities Act before they may be offered or sold to the public) to the extent permitted by the 1940 Act or the rules, regulations or interpretations thereof.
F-238
(c)Invest more than 25% of our total assets in the securities of companies or entities engaged in any one industry, or group of industries. This limitation does not apply to investment in the securities of the U.S. Government, its agencies or instrumentalities.
(d)Purchase or sell real estate or interests in real estate (except that we may (a) purchase and sell real estate or interests in real estate in connection with the orderly liquidation of investments, or in connection with foreclosure on collateral, or (b) own the securities of companies that are in the business of buying, selling or developing real estate).
(e)Purchase or sell commodities or commodity contracts, but we may purchase and sell foreign currency and enter into foreign currency forward contracts, and may engage in other transactions in financial instruments, in each case to the extent permitted under the Company's investment policies as in effect from time to time.
(f)Make loans of money or securities to other persons, except through purchasing fixed-income securities or other debt instruments, lending portfolio securities or entering into repurchase agreements in a manner consistent with our investment policies. With respect to these investment restrictions, if a percentage restriction is adhered to at the time of entering into the investment or transaction, a later change in percentage resulting from a change in the values of investments or the value of our total assets, unless otherwise stated or required by law, will not constitute a violation of the restriction or policy.
Valuation Risk
We are currently focused on investing in what we believe are deeply undervalued microcapitalization publicly traded companies. Our publicly traded and public company-related securities account for approximately 100 percent of the value of our portfolio of investments. Although these companies are publicly traded, their stock may not trade at high volumes and/or we may own a significant portion of a company's outstanding stock, which may restrict our ability to sell our positions in an orderly fashion and prices at which sales can be made may be volatile and materially different than the closing prices of such positions at each financial statement date. We may also be subject to restrictions on transfer and/or other lock-up provisions after these companies complete public offerings and/or if we invest in unregistered securities of public companies. Many of our legacy privately held and publicly traded companies tend to not have attained profitability, and many of these companies also lack management depth and have limited or no history of operations. Because of the speculative nature of our investments and the lack of a liquid market for and restrictions on transfers of privately held investments, there is greater risk of loss relative to traditional marketable investment securities.
Approximately 2 percent of our portfolio, excluding money market investments, was fair valued and comprised of securities of legacy privately held companies and rights to potential future milestone payments, as well as our warrants of Potbelly Corporation and options and restricted common stock of Synchronoss Technologies, Inc. which are securities of publicly traded companies. Because there is typically no public or readily ascertainable market for our securities of our legacy privately held companies, the valuation of the securities in that portion of our portfolio is determined in good faith by our Valuation Committee, which is comprised of all of the independent members of our Board of Directors. The values are determined in accordance with our Valuation Procedures and are subject to significant estimates and judgments. The fair value of the securities in our portfolio may differ significantly from the values that would be placed on these securities if a ready market for the securities existed. Additionally, inputs may become available after a financial statement date that could result in a material change in value at a future financial statement date from the value reported in the current financial statements. Any changes in valuation are recorded in the Company's Consolidated Statement of Operations as “Change in unrealized appreciation (depreciation) on investments.” Changes in valuation of any of our investments in privately held companies from one period to another may be significant.
Diversification Risk
While we are subject to certain diversification requirements regarding the concentration of investments in any one industry or group of industries at the time of each investment, we do not choose investments based on a strategy of diversification. We also do not rebalance the portfolio should one of our portfolio companies increase in
F-239
value substantially relative to the rest of the portfolio. Therefore, the value of our portfolio may be more vulnerable to microeconomic events affecting a single sector, industry or portfolio company and to general macroeconomic events that may be unrelated to our portfolio companies. These factors may subject the value of our portfolio to greater volatility than a company that follows a diversification strategy. As of June 30, 2025, our largest 10 investments by value, excluding money market investments, accounted for approximately 84 percent of the value of our investment portfolio. Our largest three investments, by value, excluding money market investments, Potbelly Corporation, Synchronoss Technologies, Inc., and Arena Group Holdings, Inc., accounted for approximately 35 percent, 16 percent and 12 percent, respectively, of our investment portfolio at June 30, 2025. Potbelly Corporation, Synchronoss Technologies, Inc. and Arena Group Holdings, Inc. are publicly traded companies.
Interest Rate Risk
Interest rate sensitivity refers to the change in earnings that may result from changes in the level of interest rates. We may invest in both short- and long-term U.S. government and agency securities. To the extent that we invest in short- and long-term U.S. government and agency securities, changes in interest rates result in changes in the value of these obligations that result in an increase or decrease of our net asset value. The level of interest rate risk exposure at any given point in time depends on the market environment, the expectations of future price and market movements, and the quantity and duration of long-term U.S. government and agency securities held by the Company, and it will vary from period to period.
In addition, market interest rates for high-yield corporate debt may be an input in determining the value of our investments in debt securities of privately held and publicly traded companies. Significant changes in these market rates could affect the value of our debt securities as of the valuation date or measurement of value. While we do not currently have any investments in debt securities with floating interest rates, investment income in such securities should we acquire them in the future could be adversely affected by changes in interest rates.
Foreign Currency Risk
We may from time to time invest in securities that are denominated in foreign currencies. As of June 30, 2025, our investments were not subject to foreign currency risk as they were all denominated in U.S. dollars.
NOTE 4. FAIR VALUE OF INVESTMENTS
At June 30, 2025, our financial assets valued at fair value were categorized as follows in the fair value
F-240
hierarchy:
| Fair Value Measurement at Reporting Date Using: | ||||||||||||||||||||||||||
| Description | Unadjusted Quoted Prices in Active Markets for Identical Assets (Level 1) | Significant Other Observable Inputs (Level 2) | Significant Unobservable Inputs (Level 3) | June 30, 2025 | ||||||||||||||||||||||
| Publicly Traded Equity and Equity-Related Securities: | ||||||||||||||||||||||||||
| Common Stock | $ | 37,299,549 | $ | 67,362 | $ | 0 | $ | 37,366,911 | ||||||||||||||||||
| Money Market Mutual Fund - Institutional Class Shares | 12,000,000 | 0 | 0 | 12,000,000 | ||||||||||||||||||||||
| Warrants/Options | 0 | 548,114 | 15,065 | 563,179 | ||||||||||||||||||||||
| Legacy Privately Held Equity and Equity-Related Securities: | ||||||||||||||||||||||||||
| Preferred Stock | $ | 0 | $ | 0 | $ | 75,000 | $ | 75,000 | ||||||||||||||||||
| Common Stock | 0 | 0 | 0 | 0 | ||||||||||||||||||||||
| Total Investments: | $ | 49,299,549 | $ | 615,476 | $ | 90,065 | $ | 50,005,090 | ||||||||||||||||||
| Other Financial Instruments: | ||||||||||||||||||||||||||
| Rights to Milestone Payments | $ | 0 | $ | 0 | $ | 71,757 | $ | 71,757 | ||||||||||||||||||
| Total Financial Assets: | $ | 49,299,549 | $ | 615,476 | $ | 161,822 | $ | 50,076,847 | ||||||||||||||||||
F-241
Significant Unobservable Inputs
The table below presents the valuation technique and quantitative information about the significant unobservable inputs utilized by the Company in the fair value measurements of Level 3 assets. Unobservable inputs are those inputs for which little or no market data exists and, therefore, require an entity to develop its own assumptions.
| Value as of June 30, 2025 | Valuation Approach(es) | Unobservable Input(s) | Range(s) (Weighted Average(a)) | |||||||||||||||||||||||
| Volatility | 80.6% (80.6%) | |||||||||||||||||||||||||
| Warrants/Options | $ | 15,065 | Income Approach | Time to Exit (Years) | 5.4 (5.4) | |||||||||||||||||||||
| Preferred Stock | 0 | Income Approach | Public Comparable Adjustment (Including Non-Performance Risk) | -100.0% (0.0%) | ||||||||||||||||||||||
| Preferred Stock | 75,000 | Market Approach | Price Per Share | $0.00 ($0.00) | ||||||||||||||||||||||
| Common Stock | 0 | Income Approach | Public Comparable Adjustment (Including Non-Performance Risk) | -100.0% (-100.0%) | ||||||||||||||||||||||
| Probability of Achieving Independent Milestones | 5.0% (5.0%) | |||||||||||||||||||||||||
| Probability of Achieving Dependent Milestones | 2.4% - 3.7% (3.1%) | |||||||||||||||||||||||||
| Rights to Payments | 71,757 | Income Approach | Time to Cash Flows (Years) | 2.5 - 4.5 (3.5) | ||||||||||||||||||||||
| Total | $ | 161,822 | ||||||||||||||||||||||||
_________________
(a)Weighted average based on fair value at June 30, 2025.
Valuation Methodologies and Inputs for Level 3 Assets
The following sections describe the valuation techniques and significant unobservable inputs used to measure Level 3 assets.
Preferred Stock, LLC Interests, and Common Stock
Preferred stock, LLC interests, and common stock are valued by either a market, income or hybrid approach using internal models with inputs, most of which are not market observable. Common inputs for valuing Level 3 investments include prices from recently executed private transactions in a company’s securities or unconditional firm offers, revenue multiples of comparable publicly traded companies, merger and acquisition (“M&A”) transactions consummated by comparable companies, discounts for lack of marketability, rights and preferences of the class of securities we own as compared with other classes of securities the portfolio company has issued, particularly related to potential liquidity scenarios of an initial public offering (“IPO”) or an acquisition transaction, estimated time to exit, volatilities of comparable publicly traded companies and management’s best estimate of risk attributable to non-performance risk. Certain securities are valued using the present value of future cash flows. Common inputs for valuing Level 2 investments include adjustment for lack of marketability on unregistered securities, and material information released by public companies subsequent to the closing price on date of the valuation.
We may also consider changes in market values for sets of comparable companies when recent private transaction information is not available and/or in consideration of non-performance risk. We define non-performance risk as the risk that the price per share (or implied valuation of a portfolio company) or the effective yield of a debt security of a portfolio company, as applicable, does not appropriately represent the risk that a portfolio company with negative cash flow will be: (a) unable to raise capital, will need to be shut down and will not return our invested capital; or (b) able to raise capital, but at a valuation significantly lower than the implied post-money valuation of the last round of financing. We assess non-performance risk for each private portfolio company
F-242
quarterly. Our assessment of non-performance risk typically includes an evaluation of the financial condition and operating results of the company, the company's progress towards milestones, and the long-term potential of the business and technology of the company and how this potential may or may not affect the value of the shares owned by us. An increase to the non-performance risk or a decrease in the private offering price of a future round of financing from that of the most recent round would result in a lower fair value measurement and/or a change in the distribution of value among the classes of securities we own.
Option pricing models place a high weighting on liquidation preferences, which means that small differences in how the preferences are structured can have a material effect on the fair value of our securities at the time of valuation and also on future valuations should additional rounds of financing occur with senior preferences. As such, valuations calculated by option pricing models may not increase if 1) rounds of financing occur at higher prices per share, 2) liquidation preferences include multiples on investment, 3) the amount of invested capital is small and/or 4) liquidation preferences are senior to prior rounds of financing. Additionally, an increase in the volatility assumption generally increases the enterprise value calculated in an option pricing model. An increase in the time to exit assumption also generally increases the enterprise value calculated in an option pricing model. Variations in the expected time to exit or expected volatility assumptions have a significant impact on fair value.
Warrants and Stock Options
We use the Black-Scholes-Merton option-pricing model to determine the fair value of warrants and stock options held in our portfolio unless there is a publicly traded active market for such securities or another indication of value such as a sale of the portfolio company or an expectation that we may exercise the security prior to expiration. Option pricing models, including the Black-Scholes-Merton model, require the use of subjective input assumptions, including expected volatility, expected life, expected dividend rate, and expected risk-free rate of return. In the Black-Scholes-Merton model, variations in the expected volatility or expected term assumptions have a significant impact on fair value.
An input to the Black-Scholes-Merton option-pricing model is the value per share of the type of stock for which the warrant is exercisable as of the date of valuation. This input is derived according to the methodologies discussed in “Preferred Stock, Preferred Units, LLC Interests, Common Stock and Common Units.”
Rights to Milestone Payments
Rights to milestone payments are valued using a probability-weighted discounted cash flow model. We are entitled to potential future payments from the acquisition of TARA Biosystems, Inc. by Valo Health, LLC. We assign probabilities to the achievements of the various milestones. Milestones identified as independent milestones can be achieved irrespective of the achievement of other contractual milestones. Dependent milestones are those that can only be achieved after another, or series of other, milestones are achieved. The interest rates used in these models are observable inputs from sources such as the published interest rates for corporate bonds of the acquiring or comparable companies.
Changes in Valuation Approaches
During the period ended June 30, 2025, the valuation approach for our warrants for the purchase of common stock of Potbelly Corporation changed from the Income Approach to the Market Approach owing to the expiration date being less than one year from the date of valuation and the valuation being based on intrinsic value versus Black-Scholes option models.
F-243
The following chart shows the components of change in the financial assets categorized as Level 3 for the period ended June 30, 2025:
| Beginning Balance 12/31/2024 | Total Realized Gains (Loss) Included in Changes in Net Assets | Transfers | Total Unrealized (Depreciation) Appreciation Included in Changes in Net Assets | Investments in Portfolio Companies | Disposals and Settlements | Ending Balance 6/30/2025 | Amount of Total Appreciation (Depreciation) for the Period included in Changes in Net Assets Attributable to the Change in Unrealized Gains or Losses Relating to Assets Still Held at the Reporting Date | |||||||||||||||||||||||||||||||||||||||||||
| Warrants/Stock Options | $ | 373,708 | $ | 0 | $ | (351,558) | $ | (7,085) | $ | 0 | $ | 0 | $ | 15,065 | $ | (7,085) | ||||||||||||||||||||||||||||||||||
| Preferred Stock | 75,000 | 0 | 0 | 0 | 0 | 0 | 75,000 | 0 | ||||||||||||||||||||||||||||||||||||||||||
| Common Stock | 0 | 0 | 0 | 0 | 0 | 0 | 0 | 0 | ||||||||||||||||||||||||||||||||||||||||||
| LLC Interests | 100,000 | 100,000 | 1 | 0 | (100,000) | 0 | (100,000) | 0 | 0 | |||||||||||||||||||||||||||||||||||||||||
| Rights to Milestone Payments | 70,456 | 0 | 0 | 1,301 | 0 | 0 | 71,757 | 1,301 | ||||||||||||||||||||||||||||||||||||||||||
| Total | $ | 619,164 | $ | 100,000 | $ | (351,558) | $ | (105,784) | $ | 0 | $ | (100,000) | $ | 161,822 | $ | (5,784) | ||||||||||||||||||||||||||||||||||
_______________
(1)Represents gross realized gains.
We elected to use the beginning of period values to recognize transfers in and out of Level 3 investments.
NOTE 5. INDUSTRY DIVERSIFICATION
The following table shows the percentage of our net assets invested by industry, other than money market investments, as of June 30, 2025.
| Industry | Value as of June 30, 2025 | % of Net Assets | Value as of June 30, 2025 | % of Net Assets | ||||||||||||||||||||||
| Advertising | $ | 1,930,174 | 4.0% | |||||||||||||||||||||||
| Unaffiliated Portfolio Companies | $ | 0 | 0.0% | |||||||||||||||||||||||
| Non-Controlled Affiliated Portfolio Companies | 1,930,174 | 4.0% | ||||||||||||||||||||||||
| Application Software | 6,019,925 | 12.5% | ||||||||||||||||||||||||
| Unaffiliated Portfolio Companies | 0 | 0.0% | ||||||||||||||||||||||||
| Non-Controlled Affiliated Portfolio Companies | 6,019,925 | 12.5% | ||||||||||||||||||||||||
| Communications Equipment | 2,150,081 | 4.5% | ||||||||||||||||||||||||
| Unaffiliated Portfolio Companies | 2,150,081 | 4.5% | ||||||||||||||||||||||||
| Non-Controlled Affiliated Portfolio Companies | 0 | 0.0% | ||||||||||||||||||||||||
| Construction Machinery & Heavy Trucks | 680,600 | 1.4% | ||||||||||||||||||||||||
| Unaffiliated Portfolio Companies | 680,600 | 1.4% | ||||||||||||||||||||||||
| Non-Controlled Affiliated Portfolio Companies | 0 | 0.0% | ||||||||||||||||||||||||
| Electronic Manufacturing Services | 3,057,114 | 6.4% | ||||||||||||||||||||||||
| Unaffiliated Portfolio Companies | 3,057,114 | 6.4% | ||||||||||||||||||||||||
| Non-Controlled Affiliated Portfolio Companies | 0 | 0.0% | ||||||||||||||||||||||||
| Health Care Equipment | 75,000 | 0.2% | ||||||||||||||||||||||||
F-244
| Industry | Value as of June 30, 2025 | % of Net Assets | Value as of June 30, 2025 | % of Net Assets | ||||||||||||||||||||||
| Unaffiliated Portfolio Companies | 0 | 0.0% | ||||||||||||||||||||||||
| Non-Controlled Affiliated Portfolio Companies | 75,000 | 0.2% | ||||||||||||||||||||||||
| Health Care Technology | 0 | 0.0% | ||||||||||||||||||||||||
| Unaffiliated Portfolio Companies | 0 | 0.0% | ||||||||||||||||||||||||
| Non-Controlled Affiliated Portfolio Companies | 0 | 0.0% | ||||||||||||||||||||||||
| Interactive Media & Services | 4,650,000 | 9.7% | ||||||||||||||||||||||||
| Unaffiliated Portfolio Companies | 4,650,000 | 9.7% | ||||||||||||||||||||||||
| Non-Controlled Affiliated Portfolio Companies | 0 | 0.0% | ||||||||||||||||||||||||
| Miscellaneous Holdings | 243,880 | 0.5% | ||||||||||||||||||||||||
| Unaffiliated Portfolio Companies | 243,880 | 0.5% | ||||||||||||||||||||||||
| Non-Controlled Affiliated Portfolio Companies | 0 | 0.0% | ||||||||||||||||||||||||
| Packaged Foods & Meats | 350,634 | 0.7% | ||||||||||||||||||||||||
| Unaffiliated Portfolio Companies | 350,634 | 0.7% | ||||||||||||||||||||||||
| Non-Controlled Affiliated Portfolio Companies | 0 | 0.0% | ||||||||||||||||||||||||
| Pharmaceuticals | 71,757 | 0.2% | ||||||||||||||||||||||||
| Unaffiliated Portfolio Companies | 71,757 | 0.2% | ||||||||||||||||||||||||
| Non-Controlled Affiliated Portfolio Companies | 0 | 0.0% | ||||||||||||||||||||||||
| Restaurants | 13,915,388 | 29.0% | ||||||||||||||||||||||||
| Unaffiliated Portfolio Companies | 13,915,388 | 29.0% | ||||||||||||||||||||||||
| Non-Controlled Affiliated Portfolio Companies | 0 | 0.0% | ||||||||||||||||||||||||
| Specialty Chemicals | 4,626,105 | 9.6% | ||||||||||||||||||||||||
| Unaffiliated Portfolio Companies | 4,626,105 | 9.6% | ||||||||||||||||||||||||
| Non-Controlled Affiliated Portfolio Companies | 0 | 0.0% | ||||||||||||||||||||||||
| Trading Companies & Distributors | 306,189 | 0.6% | ||||||||||||||||||||||||
| Unaffiliated Portfolio Companies | 306,189 | 0.6% | ||||||||||||||||||||||||
| Non-Controlled Affiliated Portfolio Companies | 0 | 0.0% | ||||||||||||||||||||||||
| Total | $ | 38,076,847 | $ | 38,076,847 | ||||||||||||||||||||||
NOTE 6. DERIVATIVES
During the period ended June 30, 2025, the Company did not purchase or sell any derivative securities. The Company was assigned all economic benefit for options for the purchase of Common Stock and restricted stock units of Synchronoss Technologies, Inc., that were issued to Kevin M. Rendino, Chairman, Chief Executive Officer and Portfolio Manager of the Company for his service on the Board of Directors of Synchronoss Technologies.
The following table presents the effect of derivatives held during the period ended June 30, 2025, along with the respective location in the consolidated financial statements.
CONSOLIDATED STATEMENT OF ASSETS AND LIABILITIES:
| Assets | Liabilities | |||||||||||||||||||||||||
| Derivatives | Location | Fair Value | Location | Fair Value | ||||||||||||||||||||||
| Warrants for the purchase of Common Stock of Potbelly Corporation expiring 2/12/26 (acquired 2/10/21) | Investments | $ | 548,114 | -- | -- | |||||||||||||||||||||
| Stock Options for the purchase of Common Stock of Synchronoss Technologies, Inc. expiring 12/4/30 (acquired 12/4/23) | Investments | 15,065 | -- | -- | ||||||||||||||||||||||
F-245
CONSOLIDATED STATEMENT OF OPERATIONS:
| Derivatives | Location | Net Realized Gain (Loss) | Net Change in Unrealized Appreciation (Depreciation) | |||||||||||||||||
| Warrants for the purchase of Common Stock of Potbelly Corporation expiring 2/12/26 | Net Realized Gain (Loss) and Unrealized Appreciation (Depreciation) on Investments | $ | 0 | $ | 196,556 | |||||||||||||||
| Stock Options for the purchase of Common Stock of Synchronoss Technologies, Inc. expiring 12/4/30 | Net Realized Gain (Loss) and Unrealized Appreciation (Depreciation) on Investments | 0 | (7,085) | |||||||||||||||||
NOTE 7. OFFICERS' AND BOARD OF DIRECTORS' COMPENSATION
The aggregate compensation (salaries, bonuses, 401(k) employer match, medical and dental benefits) paid by the Company during the period ended June 30, 2025, to its officers amounted to approximately $1.1 million.
The aggregate compensation paid by the Company to the independent members of its Board of Directors during the period ended June 30, 2025 was $133,542.
Certain officers and directors currently and may in the future serve as members of the board of directors of our portfolio companies, including our controlled portfolio companies. These officers and directors do not receive any compensation for serving in such roles directly from the portfolio companies. Any such cash compensation paid by portfolio companies to members of their respective boards of directors is paid directly to the Company. In the case of securities-based compensation (restricted stock or stock options), the officer or director due such compensation assigns all beneficial interest, including but not limited to economic benefit and voting control, to such securities over to the Company.
NOTE 8. EMPLOYEE BENEFITS
401(k) Plan
We adopted a 401(k) Plan covering substantially all of our employees. Matching contributions to the plan are at the discretion of the Compensation Committee. For the period ended June 30, 2025, the Compensation Committee approved a 100 percent match, which amounted to approximately $54,500.
Medical Benefit Retirement Plan
We historically administered a plan to provide medical and dental insurance for retirees and their spouses who, at the time of their retirement, attained certain years of service with us and a certain age (the “Medical Benefit Retirement Plan”). On April 27, 2017, the Board of Directors terminated the plan. The termination does not affect benefits accrued by former employees who are grandfathered under the former terms of the plan, and the termination of the plan does not affect benefits accrued by certain former employees who were grandfathered under the amended terms of the plan. The Medical Benefit Retirement Plan was terminated for all other employees. At June 30, 2025, we had $337,674 accrued for accumulated post-retirement benefit obligation for certain of these former employees, which is included in “Post-retirement plan liabilities” on the Company's Consolidated Statement of Assets and Liabilities.
NOTE 9. INCOME TAXES
The Company filed for the 1999 tax year to elect treatment as a RIC under Subchapter M of the Code and qualified for the same treatment for the years 2000 through 2015, as well as 2017 and 2019. The Company did not qualify as a RIC under Subchapter M of the Code in 2016, 2018, 2020, 2021, 2022, 2023 and 2024. The Company did not have net taxable income in any of 2016, 2018, 2020, 2021, 2022, 2023 or 2024, so the failure to qualify as a
F-246
RIC did not result in a tax liability for the Company. Under the Code, if the Company fails to qualify as a RIC three years in a row, it would be subject to taxation as a C-Corporation on built-in gains should realization of those gains occur within five years of the date of the last annual failure even if the Company qualified as a RIC in a future year.
As of June 30, 2025, the Company did not qualify as a RIC, and will therefore be taxed as a C-Corporation in 2025, as a result of failing certain Diversification Tests. The failure to qualify as a RIC in 2025 will be the sixth year in a row that such qualification was not attained. As of June 30, 2025, the Company did not have any built-in gains that would be subject to taxation as a C-Corporation should the Company qualify as a RIC in a future year. Additionally, should the Company qualify as a RIC in a future year, it would be required to distribute any accumulated and undistributed ordinary income and/or undistributed long-term capital gains. As of June 30, 2025, the Company did not have any undistributed ordinary income and/or undistributed long-term capital gains. As a C-Corporation, the Company is permitted to use historical operating loss carryforwards to offset income and gains for tax purposes.
The Company's status as a RIC is irrevocable, but qualification is measured both quarterly and annually. Given the Company's status as a RIC and that the ability or inability to use such operating loss carryforwards depends on qualification metrics measured in each taxable year separate from prior years, the Company does not include a deferred tax asset and valuation allowance on deferred tax asset on its Consolidated Statement of Assets and Liabilities.
Under certain circumstances, even if we qualified for Subchapter M treatment for a given year, we might act in a subsequent year to ensure that we would be taxed in that subsequent year as a C Corporation, rather than as a RIC. We will fail to qualify for RIC tax treatment for a taxable year if we do not satisfy the 90 percent Income Test, the Diversification Tests or Annual Distribution Requirement for such year. In the event we do not satisfy the 90 percent Income Test, Diversification Tests or the Annual Distribution Requirement for any taxable year, we will be subject to federal tax with respect to all our taxable income, whether or not distributed. In addition to the corporate tax that would be paid by the Company, all our distributions to shareholders in that situation generally will be taxable as ordinary dividends and generally subject to up to a 30 percent withholding tax if received by a non-U.S. shareholder, although such dividends may qualify for long-term capital gain treatment as “qualified dividends” for U.S. shareholders meeting certain holding period requirements. If the aggregate values of our non-qualifying assets remain below 50 percent of total assets and no non-qualifying asset represents more than 25 percent of the total assets, we will continue to pass the Diversification Tests. Rather than selling portfolio companies that are performing well in order to pass our RIC Diversification Tests, we may opt instead not to qualify as a RIC. We will choose to take such action only if we believe that the result of the action will benefit the Company and our shareholders.
For federal tax purposes, the Company’s 2021 through 2023 tax years remain open for examination by the tax authorities under the normal three-year statute of limitations. Generally, for New Jersey state tax purposes, the Company’s 2020 through 2023 tax years remain open for examination by the tax authorities under a four-year statute of limitations. The Company will file its 2024 federal and state taxes.
As of June 30, 2025, the Company's net unrealized depreciation of $19,911,574 was comprised of unrealized depreciation of $29,163,670 and unrealized appreciation is $9,252,096. The book cost of investments is $69,988,421. As of June 30, 2025, the Company was in a loss position and therefore did not have any undistributed ordinary income and/or undistributed long-term capital gains.
As of December 31, 2024, we had loss carryforwards in aggregate of $23,460,501, long term. Capital losses for the year ended December 31, 2024, were $3,670,653. As of December 31, 2024, we had cumulative capital losses, which were derived during years when the Company failed as a RIC, totaling $10,438,040, which may be carried back 3 years or carried forward 5 years. As of December 31, 2024, we had post-enactment cumulative capital losses under the provisions of the Regulated Investment Company Modernization Act of 2010 (the “Act”), which were derived during years when the Company qualified as a RIC, totaling $13,022,461. Post-enactment losses have no expiration date.
F-247
On December 22, 2017, the Tax Cuts and Jobs Act of 2017 (the “2017 Act”) was enacted, which among other changes, lowered the tax rates for corporations and how future loss carryforwards can be used against future gains. The change of the federal corporate tax rate from 35 percent to 21 percent in the 2017 Act may impact future decisions regarding the issuance of deemed dividends should the Company failed to qualify as a RIC under Subchapter M of the Code and be in a net taxable gain position on investments.
NOTE 10. COMMITMENTS AND CONTINGENCIES
Portfolio companies may seek additional capital in the future and any decision by the Company to not participate in the round of financing could result in outcomes that negatively impact the value of the Company's securities of those portfolio companies.
On January 17, 2025, the Company announced that it had entered into a definitive agreement (the “Merger Agreement”) to combine with Mount Logan Capital Inc. (“Mount Logan”) in an all-stock transaction (the “Business Combination”). The surviving entity is expected to be a Delaware corporation operating as Mount Logan Capital Inc. (“New Mount Logan”) listed on Nasdaq under the symbol MLCI. In connection with the Business Combination, 180 Degree Capital shareholders will receive proportionate ownership of New Mount Logan determined by reference to 180 Degree Capital's net asset value at closing relative to a valuation of Mount Logan of approximately $67.4 million at signing, subject to certain pre-closing adjustments. The Business Combination is currently expected to close in mid-2025, subject to regulatory and shareholder approvals. There are no changes to the Company's Investment Policies or Investment Objectives in conjunction with the signing of the definitive agreement for the Business Combination. In conjunction with the signing of the Merger Agreement, the Company paid $500,000 for a fairness opinion to Fenchurch Advisory Partners US, Inc. (“Fenchurch”), a financial advisor retained by the special committee of the Board of Directors of the Company. The Company has agreed to pay Fenchurch a net fee of $1,000,000 should the Business Combination close successfully.
On June 11, 2024, the Company signed an extension of its lease to December 31, 2025, under substantially similar terms of its original lease. Upon an event of default, the lease provides that the landlord may terminate the lease and require us to pay all rent that would have been payable during the remainder of the lease or until the date the landlord re-enters the premises.
F-248
NOTE 11. PORTFOLIO PURCHASES AND SALES
During the period ended June 30, 2025:
| Company | Purchases/Cost | Sales Proceeds/Distributions | ||||||||||||
| Arena Group Holdings, Inc. | $ | 0 | $ | 1,811,093 | ||||||||||
| Ascent Industries Co. | 0 | 133,731 | ||||||||||||
| Aviat Networks, Inc. | 210,768 | 12,663 | ||||||||||||
| Brightcove, Inc. | 0 | 4,688,431 | ||||||||||||
| Hudson Technologies, Inc. | 246,327 | 0 | ||||||||||||
| Intevac, Inc. | 0 | 4,186,388 | ||||||||||||
| Lantronix, Inc. | 34,949 | 0 | ||||||||||||
| Mama's Creations, Inc. | 264,247 | 0 | ||||||||||||
Synchronoss Technologies, Inc. (1) | 92,953 | 0 | ||||||||||||
Miscellaneous Common Stocks (2) | 1,212,919 | 1,068,266 | ||||||||||||
Total Publicly Traded Equity and Equity-Related Securities Purchases and Sales Proceeds | $ | 2,062,163 | $ | 11,900,572 | ||||||||||
| AutoTech Ventures Management I, LLC | $ | 0 | $ | 100,000 | ||||||||||
Total Legacy Privately Held Equity and Equity-Related Securities Cost and Sales Proceeds | $ | 0 | $ | 100,000 | ||||||||||
Total Purchases/Cost and Sales Proceeds | $ | 2,062,163 | $ | 12,000,572 | ||||||||||
_______________
(1)During the period ended June 30, 2025, the Company received restricted stock units from Synchronoss Technologies, Inc. (“SNCR”) which were issued to the Company for Kevin Rendino's service on the board of directors of SNCR. These restricted stock units had a cost basis of $92,953 on the date the restricted stock units vested. Amounts related to restricted stock units are also presented as “Board fee from portfolio companies - stock grant” on the Company's Consolidated Statement of Cash Flows.
(2)Miscellaneous Common Stocks are unrestricted common stocks of publicly traded companies that the Company has not disclosed publicly.
NOTE 12. SHARE REPURCHASE PROGRAM
As of June 30, 2025, no repurchases under this reauthorization have occurred. The Board did not renew the buyback authorization in 2025 owing to the pending Business Combination with Mount Logan Capital.
NOTE 13. RELATED PARTY TRANSACTIONS
We have historically provided managerial assistance to some of our portfolio companies, including serving as members of the board of directors. In certain cases, we receive fees for providing such assistance. During the year ended June 30, 2025, we received fees totaling $32,500 in cash and $92,953 in stock grant, included in the Company's Consolidated Statement of Operations in “Board fees from portfolio companies.”
NOTE 14. SUBSEQUENT EVENTS
Management of the Company has evaluated subsequent events through the date these financial statements were issued. Based upon this evaluation, management has determined there were no items requiring adjustment of the financial statements. Management does note the following:
On August 22, 2025, 180 Degree Capital held a special meeting of shareholders to approve the proposed merger with Mount Logan Capital Inc., and at this meeting received the required votes in favor of all proposals related to the merger. 180 Degree Capital currently expects to close the merger in September 2025.
F-249
NOTE 15. INVESTMENTS AND ADVANCES TO AFFILIATES - SCHEDULE 12-14 (UNAUDITED)
| Name of Issuer | Title of Issue or Nature of Indebtedness (A) | Amount of Dividends or Interest Credited to Income (B) | Net Realized Gain (Loss) | Value as of December 31, 2024 | Gross Additions (C) | Gross Reductions (D) | Net Change in Unrealized Appreciation (Depreciation) | Value as of June 30, 2025 | ||||||||||||||||||||||||||||||||||||||||||
| NON-CONTROLLED AFFILIATED LEGACY PRIVATELY HELD EQUITY & EQUITY-RELATED SECURITIES(E): | ||||||||||||||||||||||||||||||||||||||||||||||||||
| EchoPixel, Inc. | Series Seed Convertible Preferred Stock | $ | 0 | $ | 0 | $ | 44,044 | $ | 0 | $ | 0 | $ | 0 | $ | 44,044 | |||||||||||||||||||||||||||||||||||
| Series Seed-2 Convertible Preferred Stock | 0 | 0 | 15,505 | 0 | 0 | 0 | 15,505 | |||||||||||||||||||||||||||||||||||||||||||
| Series A-2 Convertible Preferred Stock | 0 | 0 | 15,451 | 0 | 0 | 0 | 15,451 | |||||||||||||||||||||||||||||||||||||||||||
| HALE.life Corporation | Common Stock | $ | 0 | $ | 0 | $ | 0 | $ | 0 | $ | 0 | $ | 0 | $ | 0 | |||||||||||||||||||||||||||||||||||
| Series Seed-1 Convertible Preferred Stock | 0 | 0 | 0 | 0 | 0 | 0 | 0 | |||||||||||||||||||||||||||||||||||||||||||
| Series Seed-2 Convertible Preferred Stock | 0 | 0 | 0 | 0 | 0 | 0 | 0 | |||||||||||||||||||||||||||||||||||||||||||
| Total Non-Controlled Affiliated Legacy Privately Held Equity & Equity-Related Securities | $ | 0 | $ | 0 | $ | 75,000 | $ | 0 | $ | 0 | $ | 0 | $ | 75,000 | ||||||||||||||||||||||||||||||||||||
| NON-CONTROLLED AFFILIATED PUBLICLY TRADED EQUITY & EQUITY-RELATED SECURITIES(E): | ||||||||||||||||||||||||||||||||||||||||||||||||||
| Comscore, Inc. | Common Stock | $ | 0 | $ | 0 | $ | 2,338,634 | $ | 0 | $ | (408,460) | $ | (408,460) | $ | 1,930,174 | |||||||||||||||||||||||||||||||||||
| Synchronoss Technologies, Inc. | Common Stock | $ | 0 | $ | 0 | $ | 8,205,965 | $ | 0 | $ | (2,268,467) | $ | (2,345,507) | $ | 5,937,498 | |||||||||||||||||||||||||||||||||||
| Common Stock - Restricted | 0 | 0 | 103,665 | 0 | (36,303) | (52,216) | 67,362 | |||||||||||||||||||||||||||||||||||||||||||
| Options for Common Stock | 0 | 0 | 22,150 | 0 | (7,085) | (7,085) | 15,065 | |||||||||||||||||||||||||||||||||||||||||||
F-250
| Name of Issuer | Title of Issue or Nature of Indebtedness (A) | Amount of Dividends or Interest Credited to Income (B) | Net Realized Gain (Loss) | Value as of December 31, 2024 | Gross Additions (C) | Gross Reductions (D) | Net Change in Unrealized Appreciation (Depreciation) | Value as of June 30, 2025 | ||||||||||||||||||||||||||||||||||||||||||
| $ | 0 | $ | 0 | $ | 10,670,414 | $ | 0 | $ | (2,720,315) | $ | (2,813,268) | $ | 7,950,099 | |||||||||||||||||||||||||||||||||||||
| Total Non- Controlled Affiliated Publicly Traded Equity & Equity-Related Securities | $ | 0 | $ | 0 | $ | 10,745,414 | $ | 0 | $ | (2,720,315) | $ | (2,813,268) | $ | 8,025,099 | ||||||||||||||||||||||||||||||||||||
_______________
(A)Common stock, warrants, options, membership units and, in some cases, preferred stock are generally non-income producing and restricted. The principal amount of debt and the number of shares of common and preferred stock and number of membership units are shown in the accompanying Consolidated Schedule of Investments as of June 30, 2025.
(B)Represents the total amount of interest or dividends credited/(debited) to income for the portion of the period an investment was a control or affiliate investment, as appropriate. Amounts credited to preferred or common stock represent accrued bridge note interest related to conversions that occurred during the period ended June 30, 2025.
(C)Gross additions include increases in investments resulting from new portfolio investments, paid-in-kind interest or dividends, the amortization of discounts and fees. Gross additions also include net increases in unrealized appreciation or decreases in unrealized depreciation.
(D)Gross reductions include decreases in investments resulting from principal collections related to investment repayments or sales, the amortization of premiums and acquisition costs. Gross reductions also include net increases in unrealized depreciation or decreases in unrealized appreciation.
(E)“Non-Controlled Affiliated” is defined as ownership of five percent or more, but less than 25 percent, of the voting shares of the portfolio company, or where we hold the right to appoint one or more members to the portfolio company’s board of directors, but less than 25 percent of the members of the board of directors.
F-251
| Line for Schedule of Investments | Method / Level | Primary Industry | # of Shares Purchased/Principal | Cost of TURN's Investment | Valuation | |||||||||||||||||||||||||||
| Non-Controlled Affiliated Publicly Traded Equity and Equity-Related Securities | ||||||||||||||||||||||||||||||||
| comScore, Inc. | Advertising | |||||||||||||||||||||||||||||||
| Common Stock | (L1) | 400,451 | $ | 13,348,438 | $ | 1,930,174 | ||||||||||||||||||||||||||
| Synchronoss Technologies, Inc. | Application Software | |||||||||||||||||||||||||||||||
| Common Stock | (L1) | 866,788 | $ | 13,010,242 | $ | 5,937,498 | ||||||||||||||||||||||||||
| Common Stock - Restricted | (M) (L2) | 12,000 | 92,953 | 67,362 | ||||||||||||||||||||||||||||
| $ | 13,103,195 | $ | 6,004,860 | |||||||||||||||||||||||||||||
| Total Non-Controlled Affiliated Publicly Traded Equity and Equity-Related Securities (16.5%) | $ | 26,451,633 | $ | 7,935,034 | ||||||||||||||||||||||||||||
| Legacy Privately Held Equity and Equity-Related Securities | ||||||||||||||||||||||||||||||||
| EchoPixel, Inc. | Health Care Equipment | |||||||||||||||||||||||||||||||
| Series Seed Convertible Preferred Stock (acquired 6/21/13-6/30/14) | (M) (L3) | 4,194,630 | $ | 1,250,000 | $ | 44,044 | ||||||||||||||||||||||||||
| Series Seed-2 Convertible Preferred Stock (acquired 1/22/16) | (M) (L3) | 1,476,668 | 500,000 | 15,505 | ||||||||||||||||||||||||||||
| Series A-2 Convertible Preferred Stock (acquired 3/23/17) | (M) (L3) | 1,471,577 | 350,000 | 15,451 | ||||||||||||||||||||||||||||
| $ | 2,100,000 | $ | 75,000 | |||||||||||||||||||||||||||||
| HALE.life Corporation | Health Care Technology | |||||||||||||||||||||||||||||||
| Common Stock (acquired 3/1/16) | (I) (L3) | 1,000,000 | $ | 10 | $ | 0 | ||||||||||||||||||||||||||
| Series Seed-1 Convertible Preferred Stock (acquired 3/28/17) | (I) (L3) | 11,000,000 | 1,896,920 | 0 | ||||||||||||||||||||||||||||
| Series Seed-2 Convertible Preferred Stock (acquired 12/28/18) | (I) (L3) | 12,083,132 | 2,500,000 | 0 | ||||||||||||||||||||||||||||
| $ | 4,396,930 | $ | 0 | |||||||||||||||||||||||||||||
| Total Non-Controlled Affiliated Legacy Privately Held Equity and Equity-Related Securities (0.2%) | $ | 6,496,930 | $ | 75,000 | ||||||||||||||||||||||||||||
| Non-Controlled Affiliated Derivative Securities | ||||||||||||||||||||||||||||||||
| Synchronoss Technologies, Inc. | Application Software | |||||||||||||||||||||||||||||||
| Stock Options for Common Stock Expiring 12/4/30 (acquired 12/4/23) | (I) (L3) | 3,334 | $ | 0 | $ | 15,065 | ||||||||||||||||||||||||||
| Total Non-Controlled Affiliated Derivative Securities (0.0%) | $ | 0 | $ | 15,065 | ||||||||||||||||||||||||||||
| Total Non-Controlled Affiliated Securities (16.7%) | $ | 32,948,563 | $ | 8,025,099 | ||||||||||||||||||||||||||||
F-252
REPORT OF INDEPENDENT REGISTERED PUBLIC ACCOUNTING FIRM
To the Board of Directors and Stockholder of Yukon New Parent, Inc.
Opinion on the Financial Statements
We have audited the accompanying consolidated balance sheet of Yukon New Parent, Inc. (the “Company”) as of June 30, 2025, and the related consolidated statement of changes in stockholder’s equity from January 7, 2025 to June 30, 2025, and the related notes (collectively referred to as the “financial statements”). In our opinion, the financial statements present fairly, in all material respects, the financial position of the Company as of June 30, 2025 in conformity with accounting principles generally accepted in the United States of America.
Going Concern
The accompanying financial statements have been prepared assuming that the Company will continue as a going concern. As discussed in Note 1 to the financial statements, the Company noted that it had no cash or sources of funding that raise substantial doubt about its ability to continue as a going concern. The financial statements do not include any adjustments that might result from the outcome of this uncertainty.
Basis for Opinion
These financial statements are the responsibility of the Company’s management. Our responsibility is to express an opinion on the Company’s financial statements based on our audit. We are a public accounting firm registered with the Public Company Accounting Oversight Board (United States) (“PCAOB”) and are required to be independent with respect to the Company in accordance with the U.S. federal securities laws and the applicable rules and regulations of the Securities and Exchange Commission and the PCAOB.
We conducted our audit in accordance with the standards of the PCAOB. Those standards require that we plan and perform the audit to obtain reasonable assurance about whether the financial statements are free of material misstatement, whether due to error or fraud. The Company is not required to have, nor were we engaged to perform, an audit of its internal control over financial reporting. As part of our audit, we are required to obtain an understanding of internal control over financial reporting but not for the purpose of expressing an opinion on the effectiveness of the Company’s internal control over financial reporting. Accordingly, we express no such opinion.
Our audit included performing procedures to assess the risks of material misstatement of the financial statements, whether due to error or fraud, and performing procedures that respond to those risks. Such procedures included examining, on a test basis, evidence regarding the amounts and disclosures in the financial statements. Our audit also included evaluating the accounting principles used and significant estimates made by management, as well as evaluating the overall presentation of the financial statements. We believe that our audit provides a reasonable basis for our opinion.
/s/ EisnerAmper LLP
We have served as the Company’s auditor since 2025. We have served as the auditor for 180 Degree Capital Corp., the parent company of Yukon New Parent, Inc. since 2023.
EISNERAMPER LLP
New York, New York
August 25, 2025
F-253
PART I. FINANCIAL INFORMATION
ITEM 1. CONSOLIDATED FINANCIAL STATEMENTS AND NOTES
YUKON NEW PARENT, INC.
CONSOLIDATED BALANCE SHEET
| June 30, 2025 | ||||||||
| ASSETS | ||||||||
Total assets | $ | |||||||
TOTAL ASSETS | $ | |||||||
LIABILITIES AND STOCKHOLDER’S EQUITY | ||||||||
Total liabilities | $ | |||||||
TOTAL LIABILITIES | $ | |||||||
STOCKHOLDER’S EQUITY | ||||||||
Common Stock, par value $ | $ | |||||||
Stock subscription receivable (Note 3) | ( | |||||||
Total stockholder’s equity | ||||||||
TOTAL LIABILITIES AND STOCKHOLDER’S EQUITY | $ | |||||||
F-254
YUKON NEW PARENT, INC.
CONSOLIDATED STATEMENT OF CHANGES IN STOCKHOLDER’S EQUITY
For the period from January 7, 2025 (inception) to June 30, 2025
Common Stock | Stock Subscription Receivable | Accumulated Equity | Total Stockholder’s Equity | |||||||||||||||||||||||||||||
Balance, January 7, 2025 (inception) | $ | $ | $ | $ | ||||||||||||||||||||||||||||
Shares issued to related party | ( | |||||||||||||||||||||||||||||||
Balance, June 30, 2025 | $ | $ | ( | $ | $ | |||||||||||||||||||||||||||
F-255
YUKON NEW PARENT, INC.
NOTES TO CONSOLIDATED FINANCIAL STATEMENTS
For the period from January 7, 2025 (inception) to June 30, 2025
Note 1. Organization
Description of Business
Yukon New Parent, Inc. (“New Parent” and the “Company”) was incorporated in Delaware on January 7, 2025. New Parent was formed as a wholly-owned subsidiary of 180 Degree Capital Corp. (“180 Degree Capital”) to facilitate the Business Combination as discussed below. We currently anticipate that the Business Combination will be completed in late Q3 2025 or early Q4 2025, subject to regulatory and shareholder approvals.
Polar Merger Sub, Inc. (“TURN Merger Sub”) was incorporated in New York on January 8, 2025. TURN Merger Sub was formed as a wholly-owned subsidiary of New Parent to facilitate the Business Combination as discussed below.
Moose Merger Sub, LLC (“MLC Merger Sub”) was formed as a limited liability company in Delaware on January 14, 2025. MLC Merger Sub was formed as a wholly-owned subsidiary of New Parent to facilitate the Business Combination as discussed below.
Proposed Business Combination
On January 16, 2025, 180 Degree Capital entered into an Agreement and Plan of Merger (the “Merger Agreement”) with New Parent, Mount Logan Capital Inc. (“MLC”), a corporation organized under the Laws of the Province of Ontario, Canada, Polar Merger Sub, Inc., and Moose Merger Sub, LLC (the “Business Combination”). Pursuant to the Merger Agreement, and subject to the terms and conditions contained therein, (a) TURN Merger Sub shall merge with and into 180 Degree Capital (the “TURN Merger”), and 180 Degree Capital shall be the surviving company and shall continue its existence as a corporation under the Laws of the State of New York and as a wholly owned subsidiary of New Parent and (b) MLC Merger Sub shall merge with and into MLC (the “MLC Merger,” and with the TURN Merger, the “Mergers”), the separate existence of MLC Merger Sub shall cease, and MLC shall be the surviving company in the MLC Merger and shall continue its existence as a limited liability company under the Laws of the State of Delaware and as a wholly-owned subsidiary of New Parent. As a result of the Mergers, New Parent will become a new publicly-traded company and the shareholders of 180 Degree Capital and MLC, respectively, will exchange their shares of each entity for shares of New Parent.
Risks and Uncertainties
New Parent was formed to be the surviving publicly-traded company in connection with the Mergers. New Parent has no prior operating activities and no material assets. Completion of the Mergers may be adversely affected by various factors that could cause economic uncertainty and volatility in the financial markets, many of which are beyond New Parent’s control. Plans to consummate the proposed mergers could be impacted by, among other things, downturns in the financial markets or in economic conditions, inflation, increases in interest rates, declines in consumer confidence and spending and geopolitical instability. New Parent cannot at this time fully predict the likelihood of one or more of the above events, their duration or magnitude or the extent to which they may negatively impact our business and the ability to complete the Mergers.
Liquidity, Capital Resources and Going Concern
As of June 30, 2025, New Parent had no cash, and no sources of funding other than funds that may be obtained from 180 Degree Capital.
These conditions raise substantial doubt about New Parent’s ability to continue as a going concern one year from the date that these consolidated financial statements are issued.
F-256
As of the date of these financial statements, 180 Degree Capital has engaged and paid for any and all services related to the Company. The Company or its subsidiaries do not expect to incur any direct expenses prior to the completion of the Business Combination.
Note 2. Summary of Significant Accounting Policies
Basis of Presentation
The accompanying consolidated financial statements are presented in U.S. dollars and have been prepared in accordance with accounting principles generally accepted in the United States of America (“GAAP”).
Principles of Consolidation
The accompanying consolidated financial statements include the accounts of New Parent and its wholly-owned subsidiaries. All intercompany transactions have been eliminated in the consolidated financial statements.
Emerging Growth Company
New Parent is an “emerging growth company,” as defined in Section 2(a) of the Securities Act, as modified by the Jumpstart Our Business Startups Act of 2012 (the “JOBS Act”), and it may take advantage of certain exemptions from various reporting requirements that are applicable to other public companies that are not emerging growth companies including, but not limited to, not being required to comply with the independent registered public accounting firm attestation requirements of Section 404 of the Sarbanes-Oxley Act of 2002, reduced disclosure obligations regarding executive compensation in its periodic reports and proxy statements, and exemptions from the requirements of holding a nonbinding advisory vote on executive compensation and shareholder approval of any golden parachute payments not previously approved.
Further, Section 102(b)(1) of the JOBS Act exempts emerging growth companies from being required to comply with new or revised financial accounting standards until private companies (that is, those that have not had a Securities Act registration statement declared effective or do not have a class of securities registered under the Exchange Act) are required to comply with the new or revised financial accounting standards. The JOBS Act provides that an emerging growth company can elect to opt out of the extended transition period and comply with the requirements that apply to non-emerging growth companies but any such election to opt out is irrevocable. New Parent has elected not to opt out of such extended transition period, which means that when a standard is issued or revised and it has different application dates for public or private companies, New Parent, as an emerging growth company, can adopt the new or revised standard at the time private companies adopt the new or revised standard. This may make comparison of New Parent’s financial statements with another public company which is neither an emerging growth company nor an emerging growth company which has opted out of using the extended transition period difficult or impossible because of the potential differences in accounting standards used.
Use of Estimates
The preparation of consolidated financial statements in conformity with GAAP requires New Parent’s management to make estimates and assumptions that affect the reported amounts of assets and liabilities and disclosure of contingent assets and liabilities at the date of the consolidated financial statements and the reported amounts of revenues and expenses during the reporting period.
Making estimates requires management to exercise significant judgment. It is at least reasonably possible that the estimate is the effect of a condition, situation or set of circumstances that existed at the date of the consolidated financial statements, which management considers in formulating its estimate, could change in the near term due to one or more future confirming events. Accordingly, the actual results could differ significantly from those estimates.
F-257
Income Taxes
New Parent and TURN Merger Sub, each are currently not expected have federal income tax return filing requirements as they are not expected to have any trade or business activity prior to completion of the Business Combination.
As of June 30, 2025, there were no uncertain tax positions related to New Parent or its subsidiaries.
Recently Issued Accounting Pronouncements
New Parent has reviewed recently issued accounting pronouncements and plans to adopt those that are applicable to it. New Parent does not expect the adoption of any recently issued pronouncements to have a material impact on its results of operations or financial position.
Note 3. Related Party Transactions
New Parent’s parent company, 180 Degree Capital, has entered into a stock subscription agreement for the acquisition of the shares of common stock issued to 180 Degree Capital. As such, at June 30, 2025, 180 Degree Capital owes $1 to New Parent for the payment of New Parents’s common stock and is reflected as a stock subscription receivable in the Consolidated Balance Sheet.
Note 4. Stockholder’s Equity
Common stock
New Parent is authorized to issue 1,000 shares of common stock with par value of $0.001 each. As of June 30, 2025 there were 1,000 one vote.
Note 5. Commitments and Contingencies
In the normal course of business New Parent may enter into agreements that could result in future commitments and contingencies related to its business. There were no commitments or contingencies as of June 30, 2025.
Note 6. Subsequent Events
New Parent has evaluated subsequent events through the date these financial statements were issued. Based upon this evaluation, management has determined there were no items requiring adjustment of the financial statements.
Management does note the following:
On August 22, 2025, 180 Degree Capital held a special meeting of shareholders to approve the proposed merger with Mount Logan Capital Inc., and at this meeting received the required votes in favor of all proposals related to the merger. 180 Degree Capital currently expects to close the merger in early September 2025.
F-258
Mount Logan Capital Inc.
$40,000,000
% Notes Due 2031
PRELIMINARY PROSPECTUS
Until (25 days after the date of the prospectus), all dealers that effect transactions in these securities, whether or not participating in this offering, may be required to deliver a prospectus. This is in addition to the dealers' obligation to deliver a prospectus when acting as underwriters and with respect to their unsold allotment or subscriptions.
Joint Book-Running Managers
Lucid Capital Markets | Piper Sandler | BC Partners Securities | ||||||
Co-Managers
Canaccord Genuity | William Blair | Wedbush Securities | ||||||
The date of this prospectus is , 2026
PART II
INFORMATION NOT REQUIRED IN PROSPECTUS
ITEM 13. OTHER EXPENSES OF ISSUANCE AND DISTRIBUTION
The following table sets forth the expenses payable by Mount Logan expected to be incurred in connection with the issuance and distribution of the Notes being registered hereby (other than underwriting discounts and commissions). All of such expenses are estimates, other than the filing and listing fees payable to the Securities and Exchange Commission and the Financial Industry Regulatory Authority, Inc.
Filing Fee – Securities and Exchange Commission | $ | |||||||
Fee – Financial Industry Regulatory Authority, Inc. | ||||||||
Listing Fee – The Nasdaq Global Market | ||||||||
Fees and Expenses of Counsel | ||||||||
Reimbursement of Fees and Expenses of Underwriters | ||||||||
Printing Expenses | ||||||||
Fees and Expenses of Accountants | ||||||||
Trustee, Transfer Agent and Registrar’s Fees | ||||||||
Miscellaneous Expenses | $ | |||||||
Total | $ | |||||||
ITEM 14. INDEMNIFICATION OF OFFICERS AND DIRECTORS
Section 145 of the Delaware General Corporation Law (“DGCL”) authorizes a corporation to indemnify any person who was or is a party or is threatened to be made a party to any threatened, pending or completed action, suit or proceeding, whether civil, criminal, administrative or investigative (other than an action by or in the right of such corporation) by reason of the fact that such person is or was a director, officer, employee or agent of such corporation, or is or was serving at the request of such corporation as a director, officer, employee or agent of another corporation, partnership, joint venture, trust or other enterprise. The indemnification may include expenses (including attorneys’ fees), judgments, fines and amounts paid in settlement actually and reasonably incurred by such person in connection with such action, suit or proceeding, provided such person acted in good faith and in a manner he or she reasonably believed to be in or not opposed to the corporation’s best interests and, with respect to any criminal action or proceeding, had no reasonable cause to believe that his or her conduct was unlawful. Section 145 also provides that a Delaware corporation may indemnify any person who was or is a party or is threatened to be made a party to any threatened, pending or completed action or suit by or in the right of such corporation, under the same conditions, except that such indemnification is limited to expenses (including attorneys’ fees) actually and reasonably incurred by such person, and except that no indemnification is permitted without judicial approval if such person is adjudged to be liable to such corporation. Where an officer or director of a corporation is successful, on the merits or otherwise, in the defense of any action, suit or proceeding referred to above, or any claim, issue or matter therein, the corporation must indemnify that person against the expenses (including attorneys’ fees) which such officer or director actually and reasonably incurred in connection therewith. In addition, Section 145 provides that a corporation has the power to purchase and maintain insurance on behalf of any person who is or was a director, officer, employee or agent of the corporation, or is or was serving at the request of the corporation as a director, officer, employee or agent of another corporation, partnership, joint venture, trust or other enterprise, against any liability asserted against such person and incurred by such person in any such capacity, or arising out of such person’s status as such, whether or not the corporation would have the power to indemnify the director or officer against such liability under Section 145.
Mount Logan has adopted provisions in its amended and restated certificate of incorporation and amended and restated bylaws that will indemnify to the fullest extent permitted by the DGCL, as it now exists or may in the future be amended, any person made or threatened to be made a party to an action or proceeding, whether criminal, civil, administrative or investigative, by reason of the fact that he, his testator or intestate is or was a director, officer
II-1
or employee of Mount Logan or any predecessor of Mount Logan, or serves or served at any other corporation, partnership, joint venture, trust or other enterprise as a director, officer, employee or agent at the request of Mount Logan or any predecessor of Mount Logan. Pursuant to Section 102(b)(7) of the DGCL, a corporation may eliminate the personal liability of a director or officer to the corporation or its stockholders for monetary damages for breach of fiduciary duty as a director or officer, except for liabilities arising (i) from any breach of the director’s or officer’s duty of loyalty to the corporation or its stockholders, (ii) from acts or omissions not in good faith or which involve intentional misconduct or a knowing violation of law, (iii) for a director under Section 174 of the DGCL, (iv) from any transaction from which the director or officer derived an improper personal benefit, or (v) for an officer in any action by or in the right of the corporation. These provisions may be held not to be enforceable for certain violations of the federal securities laws of the United States and do not affect the availability of equitable remedies such as an injunction or rescission.
Mount Logan’s amended and restated bylaws provide that Mount Logan will advance all expenses, including attorneys’ fees, to its directors and officers and persons serving at the request of Mount Logan as a director (or equivalent position) or officer of another corporation, partnership, entity, joint venture, trust or other enterprise, in connection with legal proceedings relating to their service for or on behalf of Mount Logan or such other entity, subject to certain limitations.
Mount Logan has entered into indemnification agreements with each of its directors and executive officers. These agreements provide that Mount Logan will indemnify each of its directors, executive officers and, at times, their affiliates to the fullest extent permitted by the DGCL. Mount Logan will advance expenses, including attorneys’ fees (but excluding judgments, fines and settlement amounts), to each indemnified director, executive officer or affiliate in connection with any proceeding in which indemnification is available and Mount Logan will indemnify its directors and officers for any action or proceeding arising out of that person’s services as a director or officer brought on behalf of Mount Logan or in furtherance of Mount Logan’s rights. Additionally, certain of Mount Logan’s directors or officers may have certain rights to indemnification, advancement of expenses or insurance provided by their affiliates or other third parties, which indemnification relates to and might apply to the same proceedings arising out of such director’s or officer’s services as a director referenced herein. Nonetheless, Mount Logan expects to agree in the indemnification agreements that Mount Logan’s obligations to those same directors or officers are primary and any obligation of such affiliates or other third parties to advance expenses or to provide indemnification for the expenses or liabilities incurred by those directors are secondary.
Mount Logan also maintains general liability insurance which covers certain liabilities of its directors and officers arising out of claims based on acts or omissions in their capacities as directors or officers, including liabilities under the Securities Act.
Under the Merger Agreement, from the effective time of the Business Combination through the sixth (6th) anniversary of the date of the Mergers, Mount Logan has agreed to maintain the exculpation, indemnification and advancement of expenses provisions in the respective organizational documents of each of Legacy MLC and 180 Degree Capital, to indemnify and hold harmless each person who was, as of January 16, 2025, the signing date of the Merger Agreement, or had been at any time prior, or who becomes, prior to the effective time of the Mergers, a director or officer of any corporation, partnership, joint venture, trust, employee benefit plan or other enterprise at the request of either Legacy MLC or 180 Degree Capital, against all claims, losses, liabilities, damages, judgments, fines and reasonable fees, costs and expenses pertaining to claims arising out of the fact that such person was a director or officer of Legacy MLC or 180 Degree Capital, at or prior to the effective time of the Merger, to the fullest extent permitted under such organizational documents. In addition, Mount Logan has agreed not to amend, repeal or otherwise modify the exculpation, indemnification and advancement of expenses provisions in the organizational documents of Mount Logan, Legacy MLC or 180 Degree Capital (or any successor entities) in a manner which would adversely affect the rights of any indemnified period thereunder during such six (6) year period.
The Merger Agreement also provides that Legacy MLC and 180 Degree Capital shall each purchase a “tail” insurance policy providing for the extension of their respective directors’ and officers’ liability coverage, which will remain in effect for a period of six (6) years from the effective time of the Mergers. The “tail insurance policies” shall provide terms and conditions that are no less advantageous to the insureds as the current directors’ and officers’
II-2
liability insurance policies maintained by each of Legacy MLC and 180 Degree Capital, respectively, with respect to coverage and amounts covered thereunder of matters existing or occurring prior to the effective time of the Mergers.
The proposed form of underwriting agreement to be filed as Exhibit 1.1. hereto provides for indemnification to such directors and officers by the underwriters against certain liabilities.
ITEM 15. RECENT SALES OF UNREGISTERED SECURITIES.
None.
ITEM 16. EXHIBITS AND FINANCIAL STATEMENT SCHEDULES
| Exhibit Number | Description | |||||||
1.1* | ||||||||
| 2.1 | Agreement and Plan of Merger, dated as of January 16, 2025, by and among Legacy MLC, Mount Logan Capital Inc., 180 Degree Capital Corp., Yukon New Parent, Inc., Polar Merger Sub, Inc., and Moose Merger Sub, LLC (incorporated by reference to Exhibit 2.1 to the registrant’s Current Report on Form 8-K (File No. 001-42813; Accession No. 0002051820-25-000124) filed on September 16, 2025) | |||||||
| 2.2 | Amendment to Agreement and Plan of Merger, dated as of July 6, 2025, by and among Legacy MLC, Mount Logan Capital Inc., 180 Degree Capital Corp., Polar Merger Sub, Inc. and Moose Merger Sub, LLC (incorporated by reference to Exhibit 2.2 to the registrant’s Current Report on Form 8-K (File No. 001-42813; Accession No. 0002051820-25-000124) filed on September 16, 2025) | |||||||
| 2.3 | Amendment No. 2 to Agreement and Plan of Merger, dated as of August 17, 2025, by and among Legacy MLC, Mount Logan Capital Inc., 180 Degree Capital Corp., Polar Merger Sub, Inc. and Moose Merger Sub, LLC (incorporated by reference to Exhibit 2.3 to the registrant’s Current Report on Form 8-K (File No. 001-42813; Accession No. 0002051820-25-000124) filed on September 16, 2025) | |||||||
| 3.1 | Amended and Restated Certificate of Incorporation of Mount Logan Capital Inc. (incorporated by reference to Exhibit 3.1 to the registrant’s Current Report on Form 8-K (File No. 001-42813; Accession No. 0002051820-25-000124) filed on September 16, 2025) | |||||||
| 3.2 | Amended and Restated Bylaws of Mount Logan Capital Inc. (incorporated by reference to Exhibit 3.2 to the registrant’s Current Report on Form 8-K (File No. 001-42813; Accession No. 0002051820-25-000124) filed on September 16, 2025) | |||||||
4.1* | ||||||||
4.2* | ||||||||
| 4.3 | Warrant Indenture, dated as of October 19, 2018, between Legacy MLC and Computershare Trust Company of Canada (incorporated by reference to Exhibit 4.1 to the registrant’s Current Report on Form 8-K (File No. 001-42813; Accession No. 0002051820-25-000124) filed on September 16, 2025) | |||||||
| 4.4 | Warrant Indenture, dated as of January 26, 2024, between Legacy MLC and Odyssey Trust Company (incorporated by reference to Exhibit 4.2 to the registrant’s Current Report on Form 8-K (File No. 001-42813; Accession No. 0002051820-25-000124) filed on September 16, 2025) | |||||||
| 4.5 | Supplemental Warrant Indenture, dated as of September 12, 2025, among Legacy MLC, Computershare Trust Company of Canada and the registrant (incorporated by reference to Exhibit 4.3 to the registrant’s Current Report on Form 8-K (File No. 001-42813; Accession No. 0002051820-25-000124) filed on September 16, 2025) | |||||||
| 4.6 | Supplemental Warrant Indenture, dated as of September 12, 2025, among Legacy MLC, Odyssey Trust Company and the registrant (incorporated by reference to Exhibit 4.4 to the registrant’s Current Report on Form 8-K (File No. 001-42813; Accession No. 0002051820-25-000124) filed on September 16, 2025) | |||||||
5.1* | ||||||||
| 10.1 | Staffing and Resource Agreement by and among Mount Logan Capital Inc. and BC Partners Advisors L.P. (incorporated by reference to Exhibit 10.1 to the registrant’s Current Report on Form 8-K (File No. 333-286043; Accession No. 0002051820-25-000145) filed on November 19, 2025) | |||||||
| 10.2 | Third Amended and Restated Servicing Agreement between Mount Logan Capital Inc. and BC Partners Advisors L.P. (incorporated by reference to Exhibit 10.4 to the registrant’s Registration Statement on Form S-4 (File No. 333-286043; Accession No. 0002051820-25-000045) filed on June 12, 2025) | |||||||
II-3
| 10.3 | 2025 Omnibus Equity Incentive Plan (incorporated by reference to Annex E to the registrant’s Registration Statement on Form S-4 (File No. 333-286043; Accession No. 0002051820-25-000064) filed on July 9, 2025) | |||||||
| 10.4 | Investment Advisory Agreement between Opportunistic Credit Interval Fund and Mount Logan Management LLC (incorporated by reference to Exhibit 10.6 to the registrant’s Registration Statement on Form S-4 (File No. 333-286043; Accession No. 0002051820-25-000045) filed on June 12, 2025) | |||||||
10.6† | Form of Subscription Agreement for Debenture Units of Mount Logan Capital Inc. (incorporated by reference to Exhibit 10.8 to the registrant’s Registration Statement on Form S-4 (File No. 333-286043; Accession No. 0002051820-25-000045) filed on June 12, 2025) | |||||||
| 10.7 | Incremental Amendment No. 4 to Credit Agreement, by and among MLC US Holdings LLC, the financial institutions party thereto, the Lenders party thereto, and the Agent party thereto (incorporated by reference to Exhibit 10.9 to the registrant’s Registration Statement on Form S-4 (File No. 333-286043; Accession No. 0002051820-25-000045) filed on June 12, 2025) | |||||||
| 10.8 | Amended and Restated Promissory Note from Sierra Crest Investment Management LLC to MLC US Holdings LLC (incorporated by reference to Exhibit 10.10 to the registrant’s Registration Statement on Form S-4 (File No. 333-286043; Accession No. 0002051820-25-000045) filed on June 12, 2025) | |||||||
| 10.9 | Amended and Restated Master Services Agreement between MLC US Holdings LLC and Sierra Crest Investment Management LLC (incorporated by reference to Exhibit 10.11 to the registrant’s Registration Statement on Form S-4 (File No. 333-286043; Accession No. 0002051820-25-000045) filed on June 12, 2025) | |||||||
| 10.10 | Amended and Restated Membership Interest and Asset Purchase Agreement by and among OFM II Ovation Management LLC, Ovation Partners, LP and Mount Logan Capital Inc. (incorporated by reference to Exhibit 10.13 to the registrant’s Registration Statement on Form S-4 (File No. 333-286043; Accession No. 0002051820-25-000045) filed on June 12, 2025) | |||||||
21.1* | ||||||||
23.1* | ||||||||
23.2* | ||||||||
23.3* | ||||||||
23.4* | ||||||||
24.1* | ||||||||
25.1* | ||||||||
99.9† | Schedule of Debenture Units Investors (incorporated by reference to Exhibit 99.9 to the registrant’s Registration Statement on Form S-4 (File No. 333-286043; Accession No. 0002051820-25-000045) filed on June 12, 2025) | |||||||
107* | ||||||||
101.SCH | XBRL Taxonomy Extension Schema Document | |||||||
101.CAL | XBRL Taxonomy Extension Calculation Linkbase Document | |||||||
101.DEF | XBRL Taxonomy Extension Definition Linkbase Document | |||||||
101.LAB | XBRL Taxonomy Extension Label Linkbase Document | |||||||
101.PRE | XBRL Taxonomy Extension Presentation Linkbase Document | |||||||
_________________
* Filed herewith.
^ To be filed by amendment.
† The Subscription Agreements are substantially identical in all material respects to the form of Subscription Agreement filed as Exhibit 10.6 hereto, except as to the identity of each Debenture Units Investor, the number of Debenture Units subscribed for by each Debenture Units Investor and the purchase price to be paid by each Debenture Units Investor. Pursuant to Instruction 2 to Item 601 of Regulation S-K, we have omitted filing copies of each such Subscription Agreement as exhibits to this Registration Statement on Form S-1 and have filed a schedule as Exhibit 99.9 hereto identifying each Debenture Units Investor, the number of Debenture Units subscribed for by each Debenture Units Investor and the purchase price to be paid by each Debenture Units Investor.
II-4
Item 17. Undertakings
(a)The registrant hereby undertakes:
(a)For purposes of determining any liability under the Securities Act of 1933, the information omitted from the form of prospectus filed as part of this registration statement in reliance upon Rule 430A and contained in a form of prospectus filed by the registrant pursuant to Rule 424(b)(1) or (4) or 497(h) under the Securities Act shall be deemed to be part of this registration statement as of the time it was declared effective.
(b)For the purpose of determining any liability under the Securities Act of 1933, each post-effective amendment that contains a form of prospectus shall be deemed to be a new registration statement relating to the securities offered therein, and the offering of such securities at that time shall be deemed to be the initial bona fide offering thereof.
Insofar as indemnification for liabilities arising under the Securities Act may be permitted to directors, officers and controlling persons of the registrant pursuant to the indemnification provisions described herein, or otherwise, the registrant has been advised that in the opinion of the SEC such indemnification is against public policy as expressed in the Securities Act and is, therefore, unenforceable. In the event that a claim for indemnification against such liabilities (other than the payment by the registrant of expenses incurred or paid by a director, officer or controlling person of the registrant in the successful defense of any action, suit or proceeding) is asserted by such director, officer or controlling person in connection with the securities being registered, the registrant will, unless in the opinion of its counsel the matter has been settled by controlling precedent, submit to a court of appropriate jurisdiction the question whether such indemnification by it is against public policy as expressed in the Securities Act and will be governed by the final adjudication of such issue.
II-5
SIGNATURES
Pursuant to the requirements of the Securities Act of 1933, as amended, the registrant has duly caused this Registration Statement to be signed on its behalf by the undersigned, thereunto duly authorized, in the City of New York, State of New York, on the 12th day of January, 2026.
MOUNT LOGAN CAPITAL INC. | |||||||||||
| By: | /s/ Edward Goldthorpe | ||||||||||
Name: Edward Goldthorpe | |||||||||||
Title: Chief Executive Officer | |||||||||||
The undersigned directors and officers of Mount Logan Capital Inc. hereby constitute and appoint each of Edward Goldthorpe and Nikita Klassen, with full power to act without the other and with full power of substitution and resubstitution, our true and lawful attorneys-in-fact with full power to execute in our name and on our behalf in the capacities indicated below, this Registration Statement on Form S-1, and any and all amendments thereto, including post-effective amendments to this Registration Statement, and to file the same, with all exhibits thereto and other documents in connection therewith, with the U.S. Securities and Exchange Commission and thereby ratify and confirm that all such attorneys-in-fact, or any of them, or their substitutes shall lawfully do or cause to be done by virtue hereof.
Pursuant to the requirements of the Securities Act of 1933, this Registration Statement on Form S-1 has been signed below by the following persons in the capacities and on the dates indicated:
Signature | Title | Date | ||||||||||||
/s/ Edward Goldthorpe | Chief Executive Officer and Director (Principal Executive Officer) | January 12, 2026 | ||||||||||||
Edward Goldthorpe | ||||||||||||||
/s/ Nikita Klassen | Chief Financial Officer and Corporate Secretary (Principal Financial Officer and Principal Accounting Officer) | January 12, 2026 | ||||||||||||
Nikita Klassen | ||||||||||||||
/s/ David Allen | Director | January 12, 2026 | ||||||||||||
David Allen | ||||||||||||||
/s/ Sabrina Liak | Director | January 12, 2026 | ||||||||||||
Sabrina Liak | ||||||||||||||
/s/ Buckley T. Ratchford | Director | January 12, 2026 | ||||||||||||
Buckley T. Ratchford | ||||||||||||||
/s/ R. Rudolph Reinfrank | Director | January 12, 2026 | ||||||||||||
R. Rudolph Reinfrank | ||||||||||||||
/s/ Parker A. Weil | Director | January 12, 2026 | ||||||||||||
Parker A. Weil | ||||||||||||||
/s/ Matthew Westwood | Director | January 12, 2026 | ||||||||||||
| Matthew Westwood | ||||||||||||||
II-6