10-Q: Quarterly report [Sections 13 or 15(d)]
Published on November 12, 2013
UNITED STATES
SECURITIES AND EXCHANGE COMMISSION
WASHINGTON, D. C. 20549
Form 10-Q
x QUARTERLY REPORT PURSUANT TO SECTION 13 OR 15(d) OF THE SECURITIES EXCHANGE ACT OF 1934
For the quarterly period ended September 30, 2013
¨ TRANSITION REPORT PURSUANT TO SECTION 13 OR 15(d) OF THE SECURITIES EXCHANGE ACT OF 1934
For the transition period from ____________ to _____________
Commission file number: 0-11576
| HARRIS & HARRIS GROUP, INC. |
| (Exact Name of Registrant as Specified in Its Charter) |
| New York | 13-3119827 |
| (State or Other Jurisdiction of | (I.R.S. Employer Identification No.) |
| Incorporation or Organization) |
| 1450 Broadway, New York, New York | 10018 |
| (Address of Principal Executive Offices) | (Zip Code) |
| (212) 582-0900 |
| (Registrant's Telephone Number, Including Area Code) |
Indicate by check mark whether the registrant: (1) has filed all reports required to be filed by Section 13 or 15(d) of the Securities Exchange Act of 1934 during the preceding 12 months (or for such shorter period that the registrant was required to file such reports), and (2) has been subject to such filing requirements for the past 90 days.
Yes x No ¨
Indicate by check mark whether the registrant has submitted electronically and posted on its corporate Web site, if any, every Interactive Data File required to be submitted and posted pursuant to Rule 405 of Regulation S-T during the preceding 12 months (or for such shorter period that the registrant was required to submit and post such files).
Yes ¨ No ¨
Indicate by check mark whether the registrant is a large accelerated filer, an accelerated filer, a non-accelerated filer, or a smaller reporting company. See the definitions of "large accelerated filer," "accelerated filer" and "smaller reporting company" in Rule 12b-2 of the Exchange Act. (Check one):
| Large accelerated filer ¨ | Accelerated filer x |
| Non-accelerated filer ¨ | Smaller reporting company ¨ |
| (Do not check if a smaller reporting company) |
Indicate by check mark whether the registrant is a shell company (as defined in Rule 12b-2 of the Exchange Act).
Yes ¨ No x
Indicate the number of shares outstanding of each of the issuer's classes of common stock, as of the latest practicable date.
| Class | Outstanding at November 12, 2013 |
| Common Stock, $0.01 par value per share | 31,159,256 shares |
Harris & Harris Group, Inc.
Form 10-Q, September 30, 2013
| Page Number | ||
| PART I. FINANCIAL INFORMATION | ||
| Item 1. Consolidated Financial Statements | 1 | |
| Consolidated Statements of Assets and Liabilities | 2 | |
| Consolidated Statements of Operations | 3 | |
| Consolidated Statements of Comprehensive Income (Loss) | 4 | |
| Consolidated Statements of Cash Flows | 5 | |
| Consolidated Statements of Changes in Net Assets | 6 | |
| Consolidated Schedule of Investments | 7 | |
| Notes to Consolidated Financial Statements | 36 | |
| Financial Highlights | 59 | |
| Item 2. Management's Discussion and Analysis of Financial Condition and Results of Operations | 60 | |
| Background | 60 | |
| Overview | 60 | |
| Recent and Potential Liquidity Events From Our Portfolio as of September 30, 2013 | 62 | |
| Strategy for Managing Publicly Traded Positions | 63 | |
| Maturity of Current Equity-Focused Venture Capital Portfolio | 64 | |
| Portfolio Company Revenue | 65 | |
| Growth in Ownership of Portfolio Companies | 65 | |
| Level of Involvement in Our Portfolio Companies | 66 | |
| Investment Objective and Strategy | 67 | |
| Industry Sectors of Investment | 70 | |
| Our Sources of Liquid Capital | 71 | |
| Investments and Current Investment Pace | 72 | |
| Current Business Environment | 74 | |
| Valuation of Investments | 76 | |
| Results of Operations | 78 | |
| Financial Condition | 87 | |
| Liquidity | 88 | |
| Borrowings | 90 | |
| Contractual Obligations | 91 | |
| Critical Accounting Policies | 91 | |
| Recent Developments – Portfolio Companies | 94 | |
| Cautionary Statement Regarding Forward-Looking Statements | 95 | |
| Item 3. Quantitative and Qualitative Disclosures About Market Risk | 96 | |
| Item 4. Controls and Procedures | 97 | |
| PART II. OTHER INFORMATION | ||
| Item 1A. Risk Factors | 98 | |
| Item 6. Exhibits | 101 | |
| Signatures | 102 | |
| Exhibit Index | 103 |
PART I. FINANCIAL INFORMATION
Item 1. Consolidated Financial Statements
The information furnished in the accompanying consolidated financial statements reflects all adjustments that are, in the opinion of management, necessary for a fair statement of the results for the interim period presented.
Harris & Harris Group, Inc.® (the "Company," "us," "our" and "we"), is an internally managed venture capital company that has elected to operate as a business development company ("BDC") under the Investment Company Act of 1940 (the "1940 Act"). Certain information and disclosures normally included in the consolidated financial statements in accordance with accounting principles generally accepted in the United States of America ("GAAP") have been condensed or omitted as permitted by Regulation S-X and Regulation S-K. Accordingly, they do not include all information and disclosures necessary for a fair presentation of our financial position, results of operations and cash flows in conformity with GAAP. The results of operations for any interim period are not necessarily indicative of the results for the full year. The accompanying consolidated financial statements should be read in conjunction with the audited consolidated financial statements and notes thereto contained in our Annual Report on Form 10-K for the year ended December 31, 2012.
| 1 |
|
HARRIS & HARRIS GROUP, INC. CONSOLIDATED STATEMENTS OF ASSETS AND LIABILITIES |
| September 30, 2013 | December 31, 2012 | |||||||
| (Unaudited) | ||||||||
| ASSETS | ||||||||
| Investments, in portfolio securities at value: | ||||||||
| Unaffiliated privately held companies (cost: $29,399,423 and $29,365,558, respectively) |
$ | 29,923,729 | $ | 24,949,756 | ||||
| Unaffiliated rights to milestone payments (adjusted cost basis: $3,291,750 and $3,291,750, respectively) |
3,375,388 | 3,400,734 | ||||||
| Unaffiliated publicly traded securities (cost: $2,790,739 and $5,070,447, respectively) |
8,504,540 | 14,422,261 | ||||||
| Non-controlled affiliated privately held companies (cost: $65,269,025 and $57,789,263, respectively) |
51,573,574 | 60,792,397 | ||||||
| Non-controlled affiliated publicly traded companies (cost: $0 and $2,000,000, respectively) |
0 | 1,348,227 | ||||||
| Controlled affiliated privately held companies (cost: $8,750,349 and $14,233,804, respectively) |
1,006,305 | 3,088,816 | ||||||
| Total, investments in private portfolio companies, rights to milestone payments and public securities at value (cost: $109,501,286 and $111,750,822, respectively) |
$ | 94,383,536 | $ | 108,002,191 | ||||
| Investments, in U.S. Treasury obligations at value (cost: $0 and $13,996,136, respectively) |
0 | 13,998,880 | ||||||
| Cash | 13,528,468 | 8,379,111 | ||||||
| Receivable from sales of investments (Note 3) | 22,799,975 | 0 | ||||||
| Restricted funds (Note 3) | 10,028 | 10,015 | ||||||
| Funds held in escrow from sales of investments at value (Note 3) | 1,168,671 | 1,052,345 | ||||||
| Receivable from portfolio company | 4,160 | 23,830 | ||||||
| Interest receivable | 15,124 | 49,068 | ||||||
| Prepaid expenses (Note 5) | 827,016 | 97,410 | ||||||
| Other assets | 338,302 | 377,400 | ||||||
| Total assets | $ | 133,075,280 | $ | 131,990,250 | ||||
| LIABILITIES & NET ASSETS | ||||||||
| Accounts payable and accrued liabilities | $ | 1,499,238 | $ | 1,262,202 | ||||
| Post retirement plan liabilities (Note 8) | 851,877 | 1,876,447 | ||||||
| Deferred rent | 362,656 | 368,977 | ||||||
| Written call options payable (premiums received: | ||||||||
| $190,564 and $50,000, respectively) (Note 7) | 127,500 | 42,500 | ||||||
| Debt interest and other payable | 42 | 3,350 | ||||||
| Total liabilities | 2,841,313 | 3,553,476 | ||||||
| Net assets | $ | 130,233,967 | $ | 128,436,774 | ||||
| Net assets are comprised of: | ||||||||
| Preferred stock, $0.10 par value, 2,000,000 shares authorized; none issued | $ | 0 | $ | 0 | ||||
| Common stock, $0.01 par value, 45,000,000 shares authorized at 9/30/13 and 12/31/12; 32,987,996 issued at 9/30/13 and 32,945,621 issued at 12/31/12 |
329,880 | 329,456 | ||||||
| Additional paid in capital (Note 9) | 214,072,112 | 213,194,474 | ||||||
| Accumulated net operating and realized loss | (66,678,532 | ) | (77,943,238 | ) | ||||
| Accumulated unrealized depreciation of investments | (15,054,686 | ) | (3,738,387 | ) | ||||
| Accumulated other comprehensive income (Note 8) | 970,724 | 0 | ||||||
| Treasury stock, at cost (1,828,740 shares at 9/30/13 and 12/31/12) | (3,405,531 | ) | (3,405,531 | ) | ||||
| Net assets | $ | 130,233,967 | $ | 128,436,774 | ||||
| Shares outstanding | 31,159,256 | 31,116,881 | ||||||
| Net asset value per outstanding share | $ | 4.18 | $ | 4.13 | ||||
The accompanying unaudited notes are an integral part of these consolidated financial statements.
| 2 |
|
HARRIS & HARRIS GROUP, INC. CONSOLIDATED STATEMENTS OF OPERATIONS (Unaudited) |
| Three Months Ended Sept. 30, | Nine Months Ended Sept. 30, | |||||||||||||||
| 2013 | 2012 | 2013 | 2012 | |||||||||||||
| Investment income: | ||||||||||||||||
| Interest from: | ||||||||||||||||
| Unaffiliated companies | $ | 58,363 | $ | 64,019 | $ | 190,209 | $ | 185,340 | ||||||||
| Non-controlled affiliated companies | 9,187 | 236,695 | 111,957 | 86,319 | ||||||||||||
| Controlled affiliated companies | 28,441 | 44,042 | 72,377 | 111,043 | ||||||||||||
| Cash and U.S. Treasury obligations and other | 3,115 | 5,213 | 12,148 | 17,910 | ||||||||||||
| Miscellaneous income | 35,919 | 46,277 | 123,387 | 128,078 | ||||||||||||
| Total investment income | 135,025 | 396,246 | 510,078 | 528,690 | ||||||||||||
| Expenses: | ||||||||||||||||
| Salaries, benefits and stock-based compensation (Note 9) | 1,305,405 | 1,200,902 | 4,065,804 | 5,148,293 | ||||||||||||
| Administration and operations | 221,182 | 212,917 | 697,527 | 795,143 | ||||||||||||
| Professional fees | 311,428 | 222,467 | 974,296 | 740,106 | ||||||||||||
| Rent (Note 3) | 98,539 | 105,705 | 301,240 | 303,402 | ||||||||||||
| Directors’ fees and expenses | 53,687 | 63,015 | 184,563 | 240,747 | ||||||||||||
| Custody fees | 13,919 | 13,653 | 41,693 | 35,635 | ||||||||||||
| Depreciation | 13,774 | 15,020 | 41,670 | 43,618 | ||||||||||||
| Interest and other debt expense | 9,885 | 12,901 | 21,590 | 36,741 | ||||||||||||
| Total expenses | 2,027,819 | 1,846,580 | 6,328,383 | 7,343,685 | ||||||||||||
| Net operating loss | (1,892,794 | ) | (1,450,334 | ) | (5,818,305 | ) | (6,814,995 | ) | ||||||||
| Net realized gain (loss): | ||||||||||||||||
| Realized gain (loss) from investments: | ||||||||||||||||
| Unaffiliated companies | 0 | 0 | 105,313 | 476,887 | ||||||||||||
| Non-Controlled affiliated companies | 10,006,915 | 354 | 5,770,882 | 11,775 | ||||||||||||
| Publicly traded companies | 2,845,191 | 2,695,339 | 11,389,252 | 3,366,218 | ||||||||||||
| Written call options | 42,049 | 80,573 | (84,713 | ) | 458,911 | |||||||||||
| Purchased put options | 0 | 0 | (72,209 | ) | 0 | |||||||||||
| U.S. Treasury obligations/other | 0 | (218 | ) | 0 | (218 | ) | ||||||||||
| Realized gain from investments | 12,894,155 | 2,776,048 | 17,108,525 | 4,313,573 | ||||||||||||
| Income tax expense (Note 10) | 3,343 | 7,161 | 25,514 | 15,236 | ||||||||||||
| Net realized gain from investments | 12,890,812 | 2,768,887 | 17,083,011 | 4,298,337 | ||||||||||||
| Net (decrease) increase in unrealized appreciation on investments: | ||||||||||||||||
| Change as a result of investment sales | (11,820,261 | ) | (3,616,482 | ) | (13,703,473 | ) | (4,287,361 | ) | ||||||||
| Change on investments held | (1,604,307 | ) | (2,483,303 | ) | 2,331,610 | 6,281,233 | ||||||||||
| Change on written call options | 330,388 | 1,111,515 | 55,564 | 527,333 | ||||||||||||
| Net (decrease) increase in unrealized appreciation on investments | (13,094,180 | ) | (4,988,270 | ) | (11,316,299 | ) | 2,521,205 | |||||||||
| Net realized and unrealized (loss) gain on investments | (203,368 | ) | (2,219,383 | ) | 5,766,712 | 6,819,542 | ||||||||||
| Net (decrease) increase in net assets resulting from operations: | ||||||||||||||||
| Total | $ | (2,096,162 | ) | $ | (3,669,717 | ) | $ | (51,593 | ) | $ | 4,547 | |||||
| Per average basic and diluted outstanding share | $ | (0.07 | ) | $ | (0.12 | ) | $ | (0.00 | ) | $ | 0.00 | |||||
| Average outstanding shares – basic and diluted | 31,159,256 | 31,000,601 | 31,131,654 | 31,000,601 | ||||||||||||
The accompanying unaudited notes are an integral part of these consolidated financial statements.
| 3 |
|
HARRIS & HARRIS GROUP, INC. CONSOLIDATED STATEMENTS OF COMPREHENSIVE INCOME (LOSS) (Unaudited) |
| Three Months Ended Sept. 30, | Nine Months Ended Sept. 30, | |||||||||||||||
| 2013 | 2012 | 2013 | 2012 | |||||||||||||
| Net (decrease) increase resulting from operations | $ | (2,096,162 | ) | $ | (3,669,717 | ) | $ | (51,593 | ) | $ | 4,547 | |||||
| Other comprehensive income: | ||||||||||||||||
| Prior service cost (Note 8) | 0 | 0 | 1,101,338 | 0 | ||||||||||||
| Amortization of prior service cost | (43,538 | ) | 0 | (130,614 | ) | 0 | ||||||||||
| Other comprehensive (loss) income | (43,538 | ) | 0 | 970,724 | 0 | |||||||||||
| Comprehensive income (loss) | $ | (2,139,700 | ) | $ | (3,669,717 | ) | $ | 919,131 | $ | 4,547 | ||||||
The accompanying unaudited notes are an integral part of these consolidated financial statements.
| 4 |
|
HARRIS & HARRIS GROUP, INC. CONSOLIDATED STATEMENTS OF CASH FLOWS (Unaudited) |
| Nine Months Ended | Nine Months Ended | |||||||
| September 30, 2013 | September 30, 2012 | |||||||
| Cash flows used in operating activities: | ||||||||
| Net (decrease) increase in net assets resulting from operations | $ | (51,593 | ) | $ | 4,547 | |||
| Adjustments to reconcile net increase in net assets
resulting from operations to net cash provided by (used in) operating activities: |
||||||||
| Net realized gain and unrealized depreciation on investments | (5,792,226 | ) | (6,834,778 | ) | ||||
| Depreciation of fixed assets, amortization of premium or discount on U.S. government securities, and bridge note interest |
(172,361 | ) | (168,346 | ) | ||||
| Stock-based compensation expense | 939,979 | 2,457,423 | ||||||
| Purchase of U.S. government securities | (115,598,392 | ) | (9,999,356 | ) | ||||
| Sale of U.S. government securities | 129,599,974 | 0 | ||||||
| Purchase of affiliated portfolio companies | (10,200,939 | ) | (8,242,326 | ) | ||||
| Purchase of unaffiliated portfolio companies | (818,880 | ) | (1,575,514 | ) | ||||
| Principal payments received on debt investments | 726,059 | 331,264 | ||||||
| Proceeds from sale of investments | 29,290,630 | 5,062,210 | ||||||
| Proceeds from call option premiums | 1,027,127 | 2,654,935 | ||||||
| Payments for put and call option purchases | (403,863 | ) | (1,367,364 | ) | ||||
| Changes in assets and liabilities: | ||||||||
| Restricted funds | (13 | ) | (497,979 | ) | ||||
| Receivable from funds held in escrow from sales of investments | (116,326 | ) | 0 | |||||
| Receivable from portfolio company | 19,670 | (11,957 | ) | |||||
| Receivable from unsettled trades | (22,799,975 | ) | (64,185 | ) | ||||
| Interest receivable | 33,944 | 165 | ||||||
| Income tax receivable | 0 | 7,161 | ||||||
| Prepaid expenses | (729,606 | ) | 253,623 | |||||
| Other assets | 1,337 | (525 | ) | |||||
| Post retirement plan liabilities | 33,230 | 157,532 | ||||||
| Accounts payable and accrued liabilities | 233,728 | 66,458 | ||||||
| Deferred rent | (6,321 | ) | (1,980 | ) | ||||
| Net cash provided by (used in) operating activities | 5,215,183 | (17,768,992 | ) | |||||
| Cash flows from investing activities: | ||||||||
| Purchase of fixed assets | (3,909 | ) | (15,516 | ) | ||||
| Net cash used in investing activities | (3,909 | ) | (15,516 | ) | ||||
| Cash flows from financing activities: | ||||||||
| Acquisition of vested restricted stock for payment of withholdings | (61,917 | ) | 0 | |||||
| Proceeds from drawdown of credit facility | 0 | 500,000 | ||||||
| Net cash (used in) provided by financing activities | (61,917 | ) | 500,000 | |||||
| Net increase (decrease) in cash | $ | 5,149,357 | $ | (17,284,508 | ) | |||
| Cash at beginning of the period | 8,379,111 | 33,841,394 | ||||||
| Cash at end of the period | $ | 13,528,468 | $ | 16,556,886 | ||||
| Supplemental disclosures of cash flow information: | ||||||||
| Income taxes paid | $ | 25,514 | $ | 8,075 | ||||
| Interest paid | $ | 0 | $ | 21,158 | ||||
The accompanying unaudited notes are an integral part of these consolidated financial statements.
| 5 |
|
HARRIS & HARRIS GROUP, INC. CONSOLIDATED STATEMENTS OF CHANGES IN NET ASSETS |
| Nine Months Ended | Year Ended | |||||||
| September 30, 2013 | December 31, 2012 | |||||||
| (Unaudited) | ||||||||
| Changes in net assets from operations: | ||||||||
| Net operating loss | $ | (5,818,305 | ) | $ | (8,803,343 | ) | ||
| Net realized gain on investments | 17,083,011 | 2,406,433 | ||||||
| Net decrease in unrealized appreciation on investments as a result of sales | (13,703,473 | ) | (1,427,730 | ) | ||||
| Net increase (decrease) in unrealized appreciation on investments held | 2,331,610 | (12,049,760 | ) | |||||
| Net increase (decrease) in unrealized appreciation on written call options | 55,564 | (112,500 | ) | |||||
| Net (decrease) in net assets resulting from operations | (51,593 | ) | (19,986,900 | ) | ||||
| Changes in net assets from capital stock transactions: | ||||||||
| Acquisition of vested restricted stock awards to pay required employee withholding | (61,917 | ) | (203,676 | ) | ||||
| Stock-based compensation expense | 939,979 | 2,928,943 | ||||||
| Net increase in net assets resulting from capital stock transactions | 878,062 | 2,725,267 | ||||||
| Changes in net assets from accumulated other comprehensive income: | ||||||||
| Other comprehensive income | 970,724 | 0 | ||||||
| Net increase in net assets resulting from accumulated other comprehensive income | 970,724 | 0 | ||||||
| Net increase (decrease) in net assets | 1,797,193 | (17,261,633 | ) | |||||
| Net Assets: | ||||||||
| Beginning of the period | 128,436,774 | 145,698,407 | ||||||
| End of the period | $ | 130,233,967 | $ | 128,436,774 | ||||
The accompanying unaudited notes are an integral part of these consolidated financial statements.
| 6 |
|
HARRIS & HARRIS GROUP, INC. CONSOLIDATED SCHEDULE OF INVESTMENTS AS OF SEPTEMBER 30, 2013 (Unaudited) |
| Method of | Primary | Shares/ | ||||||||||||||
| Valuation (1) | Industry (2) | Cost | Principal | Value | ||||||||||||
| Investments in Unaffiliated Companies (3) – 32.1% of net assets at value |
||||||||||||||||
| Private Placement Portfolio (Illiquid) (4) – 23.0% of net assets at value |
||||||||||||||||
| Bridgelux, Inc. (5)(8)(10) | Energy | |||||||||||||||
| Manufacturing high-power light emitting diodes (LEDs) and arrays | ||||||||||||||||
| Series B Convertible Preferred Stock | (M) | $ | 1,000,000 | 1,861,504 | $ | 1,494,464 | ||||||||||
| Series C Convertible Preferred Stock | (M) | 1,352,196 | 2,130,699 | 1,898,508 | ||||||||||||
| Series D Convertible Preferred Stock | (M) | 1,371,622 | 999,999 | 1,284,225 | ||||||||||||
| Series E Convertible Preferred Stock | (M) | 672,599 | 440,334 | 654,788 | ||||||||||||
| Series E-1 Convertible Preferred Stock | (M) | 386,073 | 399,579 | 480,234 | ||||||||||||
| Warrants for Series C Convertible Preferred Stock expiring 12/31/14 |
( I ) | 168,270 | 163,900 | 74,724 | ||||||||||||
| Warrants for Series D Convertible Preferred Stock expiring 8/26/14 |
( I ) | 88,531 | 124,999 | 54,831 | ||||||||||||
| Warrants for Series D Convertible Preferred Stock expiring 3/10/15 |
( I ) | 40,012 | 41,666 | 23,512 | ||||||||||||
| Warrants for Series E Convertible Preferred Stock expiring 12/31/17 |
( I ) | 93,969 | 170,823 | 193,148 | ||||||||||||
| Warrants for Common Stock expiring 6/1/16 | ( I ) | 72,668 | 132,100 | 3,482 | ||||||||||||
| Warrants for Common Stock expiring 8/9/18 | ( I ) | 148,409 | 171,183 | 19,552 | ||||||||||||
| Warrants for Common Stock expiring 10/21/18 | ( I ) | 18,816 | 84,846 | 6,054 | ||||||||||||
| 5,413,165 | 6,187,522 | |||||||||||||||
| Cambrios Technologies Corporation (5)(8)(9)(10) | Electronics | |||||||||||||||
| Developing nanowire-enabled electronic materials for the display industry |
||||||||||||||||
| Series B Convertible Preferred Stock | (M) | 1,294,025 | 1,294,025 | 1,165,383 | ||||||||||||
| Series C Convertible Preferred Stock | (M) | 1,300,000 | 1,300,000 | 1,170,764 | ||||||||||||
| Series D Convertible Preferred Stock | (M) | 515,756 | 515,756 | 773,634 | ||||||||||||
| Series D-2 Convertible Preferred Stock | (M) | 92,400 | 92,400 | 92,400 | ||||||||||||
| Series D-4 Convertible Preferred Stock | (M) | 216,168 | 216,168 | 216,168 | ||||||||||||
| 3,418,349 | 3,418,349 | |||||||||||||||
| Cobalt Technologies, Inc. (5)(8)(9)(11) | Energy | |||||||||||||||
| Developing processes for making bio-butanol through biomass fermentation |
||||||||||||||||
| Series C-1 Convertible Preferred Stock | (M) | 749,998 | 352,112 | 939,188 | ||||||||||||
| Series D-1 Convertible Preferred Stock | (M) | 122,070 | 48,828 | 141,538 | ||||||||||||
| Series E-1 Convertible Preferred Stock | (M) | 114,938 | 46,089 | 112,843 | ||||||||||||
| Warrants for Series E-1 Pref. Stock expiring on 10/9/22 | ( I ) | 2,781 | 1,407 | 3,097 | ||||||||||||
| Warrants for Series E-1 Pref. Stock expiring on 3/11/23 | ( I ) | 5,355 | 2,707 | 6,013 | ||||||||||||
| 995,142 | 1,202,679 | |||||||||||||||
The accompanying unaudited notes are an integral part of these consolidated financial statements.
| 7 |
|
HARRIS & HARRIS GROUP, INC. CONSOLIDATED SCHEDULE OF INVESTMENTS AS OF SEPTEMBER 30, 2013 (Unaudited) |
| Method of | Primary | Shares/ | ||||||||||||||
| Valuation (1) | Industry (2) | Cost | Principal | Value | ||||||||||||
| Investments in Unaffiliated Companies (3) – 32.1% of net assets at value (Cont.) |
||||||||||||||||
| Private Placement Portfolio (Illiquid) (4) – 23.0% of net assets at value (Cont.) |
||||||||||||||||
| Ensemble Therapeutics Corporation (5)(8)(9)(12) | Life Sciences | |||||||||||||||
| Developing DNA-Programmed ChemistryTM for the discovery of new classes of therapeutics | ||||||||||||||||
| Series B Convertible Preferred Stock | (M) | $ | 2,000,000 | 1,449,275 | $ | 96,376 | ||||||||||
| Secured Convertible Bridge Note, 8%, acquired 9/11/08 | (M) | 351,522 | $ | 250,211 | 1,610,680 | |||||||||||
| Secured Convertible Bridge Note, 8%, acquired 12/10/09 | (M) | 63,782 | $ | 48,868 | 309,706 | |||||||||||
| Secured Convertible Bridge Note, 8%, acquired 1/25/12 | (M) | 124,180 | $ | 109,400 | 674,724 | |||||||||||
| Secured Convertible Bridge Note, 8%, acquired 3/28/13 | (M) | 76,637 | $ | 73,598 | 447,010 | |||||||||||
| Secured Convertible Bridge Note, 8%, acquired 6/24/13 | (M) | 26,326 | $ | 25,759 | 155,957 | |||||||||||
| Secured Convertible Bridge Note, 8%, acquired 7/8/13 | (M) | 14,249 | $ | 13,983 | 84,621 | |||||||||||
| 2,656,696 | 3,379,074 | |||||||||||||||
| GEO Semiconductor Inc. (5) | Electronics | |||||||||||||||
| Developing programmable, high-performance video and geometry processing solutions | ||||||||||||||||
| Participation Agreement with Montage Capital relating to the following assets: | ||||||||||||||||
| Warrants for Series A Pref. Stock expiring on 9/17/17 | ( I ) | 66,684 | 100,000 | 79,839 | ||||||||||||
| Warrants for Series A-1 Pref. Stock expiring on 6/30/18 | ( I ) | 23,566 | 34,500 | 31,145 | ||||||||||||
| Loan and Security Agreement with GEO Semiconductor relating to the following assets: | ||||||||||||||||
| Warrants for Series A Pref. Stock expiring on 3/1/18 | ( I ) | 7,512 | 10,000 | 7,778 | ||||||||||||
| Warrants for Series A-1 Pref. Stock expiring on 6/29/18 | ( I ) | 7,546 | 10,000 | 8,249 | ||||||||||||
| 105,308 | 127,011 | |||||||||||||||
| Mersana Therapeutics, Inc. (5)(8)(9)(10)(13) | Life Sciences | |||||||||||||||
| Developing treatments for cancer based on novel drug delivery polymers | ||||||||||||||||
| Series A-1 Convertible Preferred Stock | (M) | 443,038 | 411,630 | 443,038 | ||||||||||||
| Common Stock | (M) | 3,875,395 | 350,539 | 108,667 | ||||||||||||
| 4,318,433 | 551,705 | |||||||||||||||
| Molecular Imprints, Inc. (5)(8)(10)(14) | Electronics | |||||||||||||||
| Manufacturing nanoimprint lithography capital equipment | ||||||||||||||||
| Series B Convertible Preferred Stock | (M) | 2,000,000 | 1,333,333 | 1,185,536 | ||||||||||||
| Series C Convertible Preferred Stock | (M) | 2,406,595 | 1,285,071 | 1,523,498 | ||||||||||||
| Non-Convertible Bridge Note | ( I ) | 0 | $ | 0 | 3,790,474 | |||||||||||
| 4,406,595 | 6,499,508 | |||||||||||||||
The accompanying unaudited notes are an integral part of these consolidated financial statements.
| 8 |
|
HARRIS & HARRIS GROUP, INC. CONSOLIDATED SCHEDULE OF INVESTMENTS AS OF SEPTEMBER 30, 2013 (Unaudited) |
| Method of | Primary | Shares/ | ||||||||||||||
| Valuation (1) | Industry (2) | Cost | Principal | Value | ||||||||||||
| Investments in Unaffiliated Companies (3) – 32.1% of net assets at value (Cont.) |
||||||||||||||||
| Private Placement Portfolio (Illiquid) (4) – 23.0% of net assets at value (Cont.) |
||||||||||||||||
| Nanosys, Inc. (5)(8) | Energy | |||||||||||||||
| Developing inorganic nanowires and quantum dots for use in LED-backlit devices | ||||||||||||||||
| Series C Convertible Preferred Stock | (M) | $ | 1,500,000 | 803,428 | $ | 185,868 | ||||||||||
| Series D Convertible Preferred Stock | (M) | 3,000,003 | 1,016,950 | 2,818,283 | ||||||||||||
| Series E Convertible Preferred Stock | (M) | 496,573 | 433,688 | 699,741 | ||||||||||||
| Unsecured Convertible Bridge Note, 4%, acquired 7/16/12 | (M) | 45,944 | $ | 43,821 | 249,819 | |||||||||||
| 5,042,520 | 3,953,711 | |||||||||||||||
| Nano Terra, Inc. (5)(9) | Energy | |||||||||||||||
| Developing surface chemistry and nano-manufacturing solutions | ||||||||||||||||
| Senior secured debt, 12.0%, maturing on 12/1/15 | ( I ) | 768,785 | $ | 804,188 | 789,300 | |||||||||||
| Warrants for Series A-2 Pref. Stock expiring on 2/22/21 | ( I ) | 69,168 | 446,248 | 64,874 | ||||||||||||
| Warrants for Series C Pref. Stock expiring on 11/15/22 | ( I ) | 35,403 | 241,662 | 34,646 | ||||||||||||
| 873,356 | 888,820 | |||||||||||||||
| Nantero, Inc. (5)(8)(9)(10) | Electronics | |||||||||||||||
| Developing a high-density, nonvolatile, random access memory chip, enabled by carbon nanotubes | ||||||||||||||||
| Series A Convertible Preferred Stock | (M) | 489,999 | 345,070 | 1,349,224 | ||||||||||||
| Series B Convertible Preferred Stock | (M) | 323,000 | 207,051 | 809,569 | ||||||||||||
| Series C Convertible Preferred Stock | (M) | 571,329 | 188,315 | 736,312 | ||||||||||||
| Series D Convertible Preferred Stock | (M) | 139,075 | 35,569 | 139,075 | ||||||||||||
| 1,523,403 | 3,034,180 | |||||||||||||||
| OHSO Clean, Inc. (5)(15) | Life Sciences | |||||||||||||||
| Developing natural, hypoallergenic household cleaning products enabled by nanotechnology-enabled formulations of thyme oil | ||||||||||||||||
| Participation Agreement with Montage Capital relating to the following assets: | ||||||||||||||||
| Senior secured debt, 13.00%, maturing on 3/31/15 | ( I ) | 554,714 | $ | 653,760 | 611,570 | |||||||||||
| Warrants for Series C Pref. Stock expiring on 3/30/22 | ( I ) | 91,742 | 1,109,333 | 69,600 | ||||||||||||
| 646,456 | 681,170 | |||||||||||||||
| Total Unaffiliated Private Placement Portfolio (cost: $29,399,423) | $ | 29,923,729 | ||||||||||||||
The accompanying unaudited notes are an integral part of these consolidated financial statements.
| 9 |
|
HARRIS & HARRIS GROUP, INC. CONSOLIDATED SCHEDULE OF INVESTMENTS AS OF SEPTEMBER 30, 2013 (Unaudited) |
| Method of | Primary | Shares/ | ||||||||||||||
| Valuation (1) | Industry (2) | Cost | Principal | Value | ||||||||||||
| Rights to Milestone Payments (Illiquid) (6) – 2.6% of net assets at value |
||||||||||||||||
| Amgen, Inc. (8)(10) | Life Sciences | |||||||||||||||
| Rights to Milestone Payments from Acquisition of BioVex Group, Inc. | ( I ) | $ | 3,291,750 | $ | 3,291,750 | $ | 3,375,388 | |||||||||
| Laird Technologies, Inc. (8)(10) | Energy | |||||||||||||||
| Rights to Milestone Payments from Merger & Acquisition of Nextreme Thermal Solutions, Inc. | ( I ) | 0 | 0 | 0 | ||||||||||||
| Total Unaffiliated Rights to Milestone Payments (cost: $3,291,750) | $ | 3,375,388 | ||||||||||||||
| Publicly Traded Portfolio (7) – 6.5% of net assets at value | ||||||||||||||||
| Solazyme, Inc. (5)(10)(16) | Energy | |||||||||||||||
| Developing algal biodiesel, industrial chemicals and specialty ingredients using synthetic biology | ||||||||||||||||
| Common Stock | (M) | $ | 590,739 | 250,000 | $ | 2,696,250 | ||||||||||
| Champions Oncology, Inc. (5)(10)(17) | Life Sciences | |||||||||||||||
| Developing its TumorGraftTM platform for personalized medicine and drug development | ||||||||||||||||
| Common Stock | (M) | 2,199,600 | 3,293,190 | 5,763,082 | ||||||||||||
| Warrants for Common Stock expiring 1/29/18 | ( I ) | 400 | 40,000 | 45,208 | ||||||||||||
| 2,200,000 | 5,808,290 | |||||||||||||||
| Total Unaffiliated Publicly Traded Portfolio (cost: $2,790,739) | $ | 8,504,540 | ||||||||||||||
| Total Investments in Unaffiliated Companies (cost: $35,481,912) | $ | 41,803,657 | ||||||||||||||
The accompanying unaudited notes are an integral part of these consolidated financial statements.
| 10 |
|
HARRIS & HARRIS GROUP, INC. CONSOLIDATED SCHEDULE OF INVESTMENTS AS OF SEPTEMBER 30, 2013 (Unaudited) |
| Method of | Primary | Shares/ | ||||||||||||||
| Valuation (1) | Industry (2) | Cost | Principal | Value | ||||||||||||
| Investments in Non-Controlled Affiliated Companies (3) – 39.6% of net assets at value |
||||||||||||||||
| Private Placement Portfolio (Illiquid) (18) – 39.6% of net assets at value |
||||||||||||||||
| ABSMaterials, Inc. (5)(8)(9) | Energy | |||||||||||||||
| Developing nano-structured absorbent materials for environmental remediation | ||||||||||||||||
| Series A Convertible Preferred Stock | (M) | $ | 435,000 | 390,000 | $ | 487,500 | ||||||||||
| Unsecured Convertible Bridge Note, 8%, acquired 10/1/12 | (M) | 216,000 | $ | 200,000 | 251,294 | |||||||||||
| 651,000 | 738,794 | |||||||||||||||
| Adesto Technologies Corporation (5)(8)(19) | Electronics | |||||||||||||||
| Developing low-power, high-performance memory devices | ||||||||||||||||
| Series A Convertible Preferred Stock | (M) | 2,200,000 | 6,547,619 | 1,386,954 | ||||||||||||
| Series B Convertible Preferred Stock | (M) | 2,200,000 | 5,952,381 | 1,260,868 | ||||||||||||
| Series C Convertible Preferred Stock | (M) | 1,485,531 | 2,122,187 | 449,534 | ||||||||||||
| Series D Convertible Preferred Stock | (M) | 1,393,147 | 1,466,470 | 1,042,222 | ||||||||||||
| Series D-1 Convertible Preferred Stock | (M) | 703,740 | 987,706 | 561,092 | ||||||||||||
| Series E Convertible Preferred Stock | (M) | 2,499,999 | 3,508,771 | 9,966,238 | ||||||||||||
| 10,482,417 | 14,666,908 | |||||||||||||||
| AgBiome, LLC (formerly AgInnovation, LLC) (5)(8)(9)(10)(20) | Life Sciences | |||||||||||||||
| Providing early stage research and discovery for agriculture and utilizing the crop microbiome to identify products that reduce risk and improve yield | ||||||||||||||||
| Series A-1 Convertible Preferred Stock | (M) | 2,000,000 | 2,000,000 | 2,476,378 | ||||||||||||
| Series A-2 Convertible Preferred Stock | (M) | 260,870 | 208,696 | 284,492 | ||||||||||||
| 2,260,870 | 2,760,870 | |||||||||||||||
| Contour Energy Systems, Inc. (5)(8)(9)(10) | Energy | |||||||||||||||
| Developing batteries using nano-structured materials | ||||||||||||||||
| Series A Convertible Preferred Stock | (M) | 2,009,995 | 2,565,798 | 10,474 | ||||||||||||
| Series B Convertible Preferred Stock | (M) | 1,300,000 | 812,500 | 4,824 | ||||||||||||
| Series C Convertible Preferred Stock | (M) | 1,200,000 | 1,148,325 | 304,470 | ||||||||||||
| 4,509,995 | 319,768 | |||||||||||||||
The accompanying unaudited notes are an integral part of these consolidated financial statements.
| 11 |
|
HARRIS & HARRIS GROUP, INC. CONSOLIDATED SCHEDULE OF INVESTMENTS AS OF SEPTEMBER 30, 2013 (Unaudited) |
| Method of | Primary | Shares/ | ||||||||||||||
| Valuation (1) | Industry (2) | Cost | Principal | Value | ||||||||||||
| Investments
in Non-Controlled Affiliated Companies (3) – 39.6% of net assets at value (Cont.) |
||||||||||||||||
| Private Placement
Portfolio (Illiquid) (18) – 39.6% of net assets at value (Cont.) |
||||||||||||||||
| D-Wave Systems, Inc. (8)(9)(10)(21) | Electronics | |||||||||||||||
| Developing high-performance quantum computing systems | ||||||||||||||||
| Series 1 Class B Convertible Preferred Stock | (M) | $ | 1,002,074 | 1,144,869 | $ | 1,447,114 | ||||||||||
| Series 1 Class C Convertible Preferred Stock | (M) | 487,804 | 450,450 | 569,369 | ||||||||||||
| Series 1 Class D Convertible Preferred Stock | (M) | 748,473 | 855,131 | 1,080,886 | ||||||||||||
| Series 1 Class E Convertible Preferred Stock | (M) | 248,049 | 269,280 | 340,370 | ||||||||||||
| Series 1 Class F Convertible Preferred Stock | (M) | 238,323 | 258,721 | 327,023 | ||||||||||||
| Series 2 Class D Convertible Preferred Stock | (M) | 736,019 | 678,264 | 857,326 | ||||||||||||
| Series 2 Class E Convertible Preferred Stock | (M) | 659,493 | 513,900 | 649,570 | ||||||||||||
| Series 2 Class F Convertible Preferred Stock | (M) | 633,631 | 493,747 | 624,096 | ||||||||||||
| Warrants for Common Stock expiring 6/30/15 | ( I ) | 98,644 | 153,890 | 43,044 | ||||||||||||
| 4,852,510 | 5,938,798 | |||||||||||||||
| EchoPixel, Inc. (5)(8)(9)(10)(22) | Life Sciences | |||||||||||||||
| Developing algorithms and software to improve visualization of data for life science and healthcare applications | ||||||||||||||||
| Series Seed Convertible Preferred Stock | (M) | 750,000 | 2,516,778 | 750,000 | ||||||||||||
| Enumeral Biomedical Corp. (5)(8)(9)(10) | Life Sciences | |||||||||||||||
| Developing therapeutics and diagnostics through functional assaying of single cells | ||||||||||||||||
| Series A Convertible Preferred Stock | (M) | 1,026,832 | 957,038 | 1,478,450 | ||||||||||||
| Series A-1 Convertible Preferred Stock | (M) | 750,000 | 576,923 | 836,538 | ||||||||||||
| Series A-2 Convertible Preferred Stock | (M) | 1,050,001 | 724,138 | 1,050,001 | ||||||||||||
| 2,826,833 | 3,364,989 | |||||||||||||||
| HzO, Inc. (5)(8)(9) | Electronics | |||||||||||||||
| Developing novel industrial coatings that protect electronics against damage from liquids | ||||||||||||||||
| Series A Convertible Preferred Stock | (M) | 666,667 | 4,057,294 | 1,027,713 | ||||||||||||
| Series B Convertible Preferred Stock | (M) | 3,565,338 | 14,230,331 | 3,604,543 | ||||||||||||
| 4,232,005 | 4,632,256 | |||||||||||||||
The accompanying unaudited notes are an integral part of these consolidated financial statements.
| 12 |
|
HARRIS & HARRIS GROUP, INC. CONSOLIDATED SCHEDULE OF INVESTMENTS AS OF SEPTEMBER 30, 2013 (Unaudited) |
| Method of | Primary | Shares/ | ||||||||||||||
| Valuation (1) | Industry (2) | Cost | Principal | Value | ||||||||||||
| Investments
in Non-Controlled Affiliated Companies (3) – 39.6% of net assets at value (Cont.) |
||||||||||||||||
| Private Placement
Portfolio (Illiquid) (18) – 39.6% of net assets at value (Cont.) |
||||||||||||||||
| Kovio, Inc. (5)(8)(9) | Electronics | |||||||||||||||
| Developing semiconductor products using printed electronics and thin-film technologies | ||||||||||||||||
| Series A' Convertible Preferred Stock | (M) | $ | 5,242,993 | 2,160,000 | $ | 22,459 | ||||||||||
| Series B' Convertible Preferred Stock | (M) | 2,006,540 | 3,015,493 | 31,352 | ||||||||||||
| Secured
Subordinated Convertible Bridge Note, 7%, acquired 6/7/13 |
(M) | 51,112 | $ | 50,000 | 107,898 | |||||||||||
| 7,300,645 | 161,709 | |||||||||||||||
| Laser Light Engines, Inc. (5)(8)(9)(23) | Energy | |||||||||||||||
| Manufacturing solid-state light sources for digital cinema and large-venue projection displays | ||||||||||||||||
| Series A Convertible Preferred Stock | (M) | 2,000,000 | 7,499,062 | 0 | ||||||||||||
| Series B Convertible Preferred Stock | (M) | 3,095,802 | 13,571,848 | 0 | ||||||||||||
| Secured Convertible Bridge Note, 12%, acquired 10/7/11 | (M) | 227,800 | $ | 200,000 | 27,800 | |||||||||||
| Secured Convertible Bridge Note, 12%, acquired 11/17/11 | (M) | 108,948 | $ | 95,652 | 13,296 | |||||||||||
| Secured Convertible Bridge Note, 12%, acquired 12/21/11 | (M) | 94,092 | $ | 82,609 | 11,483 | |||||||||||
| Secured Convertible Bridge Note, 12%, acquired 3/5/12 | (M) | 495,219 | $ | 434,784 | 60,435 | |||||||||||
| Secured Convertible Bridge Note, 12%, acquired 7/26/12 | (M) | 212,942 | $ | 186,955 | 25,987 | |||||||||||
| Secured Convertible Bridge Note, 20%, acquired 4/29/13 | (M) | 180,822 | $ | 166,667 | 23,167 | |||||||||||
| Secured Convertible Bridge Note, 20%, acquired 7/22/13 | (M) | 173,151 | $ | 166,667 | 23,167 | |||||||||||
| 6,588,776 | 185,335 | |||||||||||||||
| Metabolon, Inc. (5)(8)(10) | Life Sciences | |||||||||||||||
| Developing service and diagnostic products through the use of a metabolomics, or biochemical, profiling platform | ||||||||||||||||
| Series B Convertible Preferred Stock | (M) | 2,500,000 | 371,739 | 1,951,723 | ||||||||||||
| Series B-1 Convertible Preferred Stock | (M) | 706,214 | 148,696 | 780,689 | ||||||||||||
| Series C Convertible Preferred Stock | (M) | 1,000,000 | 1,000,000 | 1,794,510 | ||||||||||||
| Series D Convertible Preferred Stock | (M) | 1,499,999 | 835,882 | 1,499,999 | ||||||||||||
| Warrants
for Series B-1 Convertible Preferred Stock expiring 3/25/15 |
( I ) | 293,786 | 74,348 | 149,592 | ||||||||||||
| 5,999,999 | 6,176,513 | |||||||||||||||
| OpGen, Inc. (8)(10) | Life Sciences | |||||||||||||||
| Developing tools for genomic sequence assembly and analysis | ||||||||||||||||
| Series C Convertible Preferred Stock | (M) | 3,260,000 | 23,623,188 | 13,940 | ||||||||||||
The accompanying unaudited notes are an integral part of these consolidated financial statements.
| 13 |
|
HARRIS & HARRIS GROUP, INC. CONSOLIDATED SCHEDULE OF INVESTMENTS AS OF SEPTEMBER 30, 2013 (Unaudited) |
| Method of | Primary | Shares/ | ||||||||||||||
| Valuation (1) | Industry (2) | Cost | Principal | Value | ||||||||||||
| Investments
in Non-Controlled Affiliated Companies (3) – 39.6% of net assets at value (Cont.) |
||||||||||||||||
| Private Placement
Portfolio (Illiquid) (18) – 39.6% of net assets at value (Cont.) |
||||||||||||||||
| Produced Water Absorbents, Inc. (5)(8)(9)(10) | Energy | |||||||||||||||
| Developing nano-structured absorbent materials for environmental remediation of contaminated water in the oil and gas industries | ||||||||||||||||
| Series A Convertible Preferred Stock | (M) | $ | 1,000,000 | 1,000,000 | $ | 147,441 | ||||||||||
| Series B Convertible Preferred Stock | (M) | 648,000 | 2,592,000 | 750,559 | ||||||||||||
| 1,648,000 | 898,000 | |||||||||||||||
| Senova Systems, Inc. (5)(8)(9) | Life Sciences | |||||||||||||||
| Developing next-generation sensors to measure pH | ||||||||||||||||
| Series B Convertible Preferred Stock | (M) | 1,218,462 | 1,350,000 | 540,000 | ||||||||||||
| Series B-1 Convertible Preferred Stock | (M) | 583,960 | 1,509,902 | 603,960 | ||||||||||||
| Warrants for Series B Preferred Stock expiring 10/15/17 | ( I ) | 131,538 | 164,423 | 65,753 | ||||||||||||
| Warrants for Series B Preferred Stock expiring 4/24/18 | ( I ) | 20,000 | 25,000 | 9,997 | ||||||||||||
| 1,953,960 | 1,219,710 | |||||||||||||||
| SiOnyx, Inc. (5)(8)(9) | Electronics | |||||||||||||||
| Developing silicon-based optoelectronic products enabled by its proprietary Black Silicon | ||||||||||||||||
| Series A Convertible Preferred Stock | (M) | 750,000 | 233,499 | 175,124 | ||||||||||||
| Series A-1 Convertible Preferred Stock | (M) | 890,000 | 2,966,667 | 2,225,000 | ||||||||||||
| Series A-2 Convertible Preferred Stock | (M) | 2,445,000 | 4,207,537 | 3,155,653 | ||||||||||||
| Series B-1 Convertible Preferred Stock | (M) | 1,169,561 | 1,892,836 | 1,419,627 | ||||||||||||
| Series C Convertible Preferred Stock | (M) | 1,171,316 | 1,674,030 | 1,255,523 | ||||||||||||
| Secured Conv. Bridge Note, 8%, acquired 7/22/13 | (M) | 424,662 | $ | 418,066 | 424,662 | |||||||||||
| Warrants for Series
B-1 Convertible Preferred Stock expiring 2/23/17 |
( I ) | 130,439 | 247,350 | 128,820 | ||||||||||||
| Warrants for Common Stock expiring 3/28/17 | ( I ) | 84,207 | 418,507 | 74,745 | ||||||||||||
| 7,065,185 | 8,859,154 | |||||||||||||||
| Ultora, Inc. (5)(8)(9) | Energy | |||||||||||||||
| Developing energy-storage devices enabled by carbon nanotubes | ||||||||||||||||
| Series A Convertible Preferred Stock | (M) | 886,830 | 886,830 | 886,830 | ||||||||||||
| Total Non-Controlled Private Placement Portfolio (cost: $65,269,025) | $ | 51,573,574 | ||||||||||||||
| Total Investments in Non-Controlled Affiliated Companies (cost: $65,269,025) | $ | 51,573,574 | ||||||||||||||
The accompanying unaudited notes are an integral part of these consolidated financial statements.
| 14 |
|
HARRIS & HARRIS GROUP, INC. CONSOLIDATED SCHEDULE OF INVESTMENTS AS OF SEPTEMBER 30, 2013 (Unaudited) |
| Method of | Primary | Shares/ | ||||||||||||||
| Valuation (1) | Industry (2) | Cost | Principal | Value | ||||||||||||
| Investments
in Controlled Affiliated Companies (3) – 0.8% of net assets at value |
||||||||||||||||
| Private Placement
Portfolio (Illiquid) (24) – 0.8% of net assets at value |
||||||||||||||||
| Ancora Pharmaceuticals Inc. (5)(8)(9)(25) | Life Sciences | |||||||||||||||
| Developing synthetic carbohydrates for pharmaceutical applications | ||||||||||||||||
| Common Stock | ( I ) | $ | 2,729,817 | 57,463 | $ | 0 | ||||||||||
| Series A' Convertible Preferred Stock | ( I ) | 4,855,627 | 4,855,627 | 0 | ||||||||||||
| Senior Secured Debt, 12.00%, maturing on 12/11/13 | ( I ) | 485,195 | $ | 500,000 | 729,330 | |||||||||||
| Secured Convertible Bridge Note, 8%, acquired 1/23/13 | ( I ) | 369,255 | $ | 350,000 | 149,140 | |||||||||||
| Secured Convertible Bridge Note, 8%, acquired 4/25/13 | ( I ) | 310,455 | $ | 300,000 | 127,835 | |||||||||||
| 8,750,349 | 1,006,305 | |||||||||||||||
| Total Controlled Private Placement Portfolio (cost: $8,750,349) | $ | 1,006,305 | ||||||||||||||
| Total Investments in Controlled Affiliated Companies (cost: $8,750,349) | $ | 1,006,305 | ||||||||||||||
| Total Private Placement and Publicly Traded Portfolio (cost: $109,501,286) | $ | 94,383,536 | ||||||||||||||
| Total Investments (cost: $109,501,286) | $ | 94,383,536 | ||||||||||||||
| Method of | Number of | |||||||||
| Valuation (1) | Contracts | Value | ||||||||
| Written Call Options (22) – (0.10)% of net assets at value | ||||||||||
| Solazyme, Inc. — Strike Price $12.50, December 21, 2013 | (M) | 500 | $ | 27,500 | ||||||
| Solazyme, Inc. — Strike Price $15.00, December 21, 2013 | (M) | 1,000 | 85,000 | |||||||
| Solazyme, Inc. — Strike Price $12.50, March 22, 2014 | (M) | 1,000 | 15,000 | |||||||
| Total Written Call Options (Premiums Received $190,564) | $ | (127,500 | ) | |||||||
The accompanying unaudited notes are an integral part of these consolidated financial statements.
| 15 |
|
HARRIS & HARRIS GROUP, INC. CONSOLIDATED SCHEDULE OF INVESTMENTS AS OF SEPTEMBER 30, 2013 (Unaudited) |
Notes to Consolidated Schedule of Investments
| (1) | See "Footnote to Consolidated Schedule of Investments" on page 32 for a description of the "Valuation Procedures." |
| (2) | We classify "Energy" companies as those that seek to improve performance, productivity or efficiency, and to reduce environmental impact, waste, cost, energy consumption or raw materials. We classify "Electronics" companies as those that address problems in electronics-related industries, including semiconductors. We classify "Life Sciences" companies as those that address problems in life sciences-related industries, including biotechnology, agriculture, advanced materials and chemicals, healthcare, bioprocessing, water, industrial biotechnology, food, nutrition and energy. |
| (3) | Investments in unaffiliated companies consist of investments in which we own less than five percent of the voting shares of the portfolio company. Investments in non-controlled affiliated companies consist of investments in which we own five percent or more, but less than 25 percent, of the voting shares of the portfolio company, or where we hold one or more seats on the portfolio company’s Board of Directors but do not control the company. Investments in controlled affiliated companies consist of investments in which we own 25 percent or more of the voting shares of the portfolio company or otherwise control the company. |
| (4) | The aggregate cost for federal income tax purposes of investments in unaffiliated privately held companies is $29,399,423. The gross unrealized appreciation based on the tax cost for these securities is $5,379,843. The gross unrealized depreciation based on the tax cost for these securities is $4,855,537. |
| (5) | All or a portion of the investments or instruments are pledged as collateral under our loan facility. |
| (6) | The aggregate cost for federal income tax purposes of investments in unaffiliated rights to milestone payments is $3,291,750. The gross unrealized appreciation based on the tax cost for these securities is $83,638. The gross unrealized depreciation based on the tax cost for these securities is $0. |
| (7) | The aggregate cost for federal income tax purposes of investments in unaffiliated publicly traded companies is $2,790,739. The gross unrealized appreciation based on the tax cost for these securities is $5,713,801. The gross unrealized depreciation based on the tax cost for these securities is $0. |
| (8) | We are subject to legal restrictions on the sale of our investment(s) in this company. |
| (9) | These investments are development-stage companies. A development-stage company is defined as a company that is devoting substantially all of its efforts to establishing a new business, and either it has not yet commenced its planned principal operations, or it has commenced such operations but has not realized significant revenue from them. |
| (10) | Represents a non-income producing security. Investments that have not paid dividends or interest within the last 12 months are considered to be non-income producing. |
| (11) | Cobalt Technologies, Inc., also does business as Cobalt Biofuels. |
| (12) | With our investments in convertible bridge notes issued by Ensemble Therapeutics Corporation, we received warrants to purchase a number of shares of the class of stock sold in the next financing of Ensemble Therapeutics Corporation equal to $260,989 divided by the price per share of the class of stock sold in the next financing of Ensemble Therapeutics Corporation. The ability to exercise these warrants is, therefore, contingent on Ensemble Therapeutics Corporation completing successfully a subsequent round of financing. These warrants shall expire and no longer be exercisable on dates ranging from September 10, 2015, through July 8, 2020. The cost basis of these warrants is $157. |
The accompanying unaudited notes are an integral part of this consolidated schedule.
| 16 |
|
HARRIS & HARRIS GROUP, INC. CONSOLIDATED SCHEDULE OF INVESTMENTS AS OF SEPTEMBER 30, 2013 (Unaudited) |
| (13) | With our investment in the Mersana Therapeutics, Inc., Series A-1 financing, we received a warrant to purchase 277,760 shares of Series A-2 Convertible Preferred Stock. The ability to exercise the warrant is contingent upon Mersana's achievement of certain milestones. Mersana has not achieved those milestones as of September 30, 2013, and, therefore, this warrant is a contingent asset as of that date. The warrant will expire on July 27, 2022. |
| (14) | As part of a loan the Company made to Molecular Imprints in the second quarter of 2011, we received a liquidation preference payable upon a sale of the company equal to three times the principal of the loan, or $4,044,450. This preference is senior to the preferences of the outstanding preferred stock. While the loan has since been repaid, this liquidation preference remains outstanding as of September 30, 2013. |
| (15) | OHSO Clean, Inc. also does business as CleanWell Company. |
| (16) | A portion of this security is held in connection with written call option contracts: 250,000 shares, having a fair value of $2,696,250, have been pledged to brokers. |
| (17) | As of September 30, 2013, we owned a total of 3,293,190 shares of Champions Oncology, Inc. During the third quarter of 2013, the restriction on the sale of these securities expired. |
| (18) | The aggregate cost for federal income tax purposes of investments in non-controlled affiliated privately held companies is $65,269,025. The gross unrealized appreciation based on the tax cost for these securities is $8,767,463. The gross unrealized depreciation based on the tax cost for these securities is $22,462,914. |
| (19) | Adesto Technologies Corporation's Series E shares have certain rights and preferences in a sale or IPO that are not ascribed to the other classes of stock. |
| (20) | On January 29, 2013, AgInnovation, LLC, changed its name to AgBiome, LLC. |
| (21) | D-Wave Systems, Inc., is located and is doing business primarily in Canada. We invested in D-Wave Systems, Inc., through Parallel Universes, Inc., a Delaware company. Our investment is denominated in Canadian dollars and is subject to foreign currency translation. See "Note 3. Summary of Significant Accounting Policies." |
| (22) | Initial investment was made in 2013. |
| (23) | We have a 25.01 percent voting interest in Laser Light Engines, Inc. However, we do not control this investment as another investor has a 55 percent voting interest and the majority of the board seats of the company. |
| (24) | The aggregate cost for federal income tax purposes of investments in controlled affiliated companies is $8,750,349. The gross unrealized appreciation based on the tax cost for these securities is $0. The gross unrealized depreciation based on the tax cost for these securities is $7,744,044. |
| (25) | On October 31, 2013, Ancora sold a substantial portion of its assets, including the use of its corporate name, to CordenPharma International US, Inc. ("Corden"). The remaining assets formed a new company, SynGlyco, Inc., of which we continue to own shares. SynGlyco may receive future royalty payments based upon certain sales targets and other terms of the Corden acquisition. |
The accompanying unaudited notes are an integral part of this consolidated schedule.
| 17 |
| HARRIS & HARRIS GROUP, INC. |
| CONSOLIDATED SCHEDULE OF INVESTMENTS AS OF DECEMBER 31, 2012 |
| Method of | Primary | Shares/ | ||||||||||||||
| Valuation (1) | Industry (2) | Cost | Principal | Value | ||||||||||||
| Investments in Unaffiliated Companies (3) – 33.3% of net assets at value |
||||||||||||||||
| Private Placement Portfolio (Illiquid) (4) – 19.4% of net assets at value |
||||||||||||||||
| Bridgelux, Inc. (7)(8) | Energy | |||||||||||||||
| Manufacturing high-power light emitting diodes (LEDs) and arrays | ||||||||||||||||
| Series B Convertible Preferred Stock | (M) | $ | 1,000,000 | 1,861,504 | $ | 426,744 | ||||||||||
| Series C Convertible Preferred Stock | (M) | 1,352,196 | 2,130,699 | 488,456 | ||||||||||||
| Series D Convertible Preferred Stock | (M) | 1,371,622 | 999,999 | 356,865 | ||||||||||||
| Series E Convertible Preferred Stock | (M) | 672,599 | 440,334 | 520,495 | ||||||||||||
| Series E-1 Convertible Preferred Stock | (M) | 534,482 | 399,579 | 368,251 | ||||||||||||
| Warrants for Series C Convertible Preferred | ||||||||||||||||
| Stock expiring 12/31/14 | ( I ) | 168,270 | 163,900 | 11,210 | ||||||||||||
| Warrants for Series D Convertible Preferred | ||||||||||||||||
| Stock expiring 8/26/14 | ( I ) | 88,531 | 124,999 | 8,295 | ||||||||||||
| Warrants for Series D Convertible Preferred | ||||||||||||||||
| Stock expiring 3/10/15 | ( I ) | 40,012 | 41,666 | 3,976 | ||||||||||||
| Warrants for Series E Convertible Preferred | ||||||||||||||||
| Stock expiring 12/31/17 | ( I ) | 93,969 | 170,823 | 144,181 | ||||||||||||
| Warrants for Common Stock expiring 6/1/16 | ( I ) | 72,668 | 132,100 | 3,308 | ||||||||||||
| Warrants for Common Stock expiring 10/21/18 | ( I ) | 18,816 | 84,846 | 3,800 | ||||||||||||
| 5,413,165 | 2,335,581 | |||||||||||||||
| Cambrios Technologies Corporation (7)(9)(10) | Electronics | |||||||||||||||
| Developing nanowire-enabled electronic materials for the display industry | ||||||||||||||||
| Series B Convertible Preferred Stock | (M) | 1,294,025 | 1,294,025 | 700,454 | ||||||||||||
| Series C Convertible Preferred Stock | (M) | 1,300,000 | 1,300,000 | 703,688 | ||||||||||||
| Series D Convertible Preferred Stock | (M) | 515,756 | 515,756 | 870,338 | ||||||||||||
| Series D-2 Convertible Preferred Stock | (M) | 92,400 | 92,400 | 86,625 | ||||||||||||
| Series D-4 Convertible Preferred Stock | (M) | 216,168 | 216,168 | 202,658 | ||||||||||||
| 3,418,349 | 2,563,763 | |||||||||||||||
| Cobalt Technologies, Inc. (7)(9)(11) | Energy | |||||||||||||||
| Developing processes for making bio- butanol through biomass fermentation | ||||||||||||||||
| Series C-1 Convertible Preferred Stock | (M) | 749,998 | 352,112 | 933,802 | ||||||||||||
| Series D-1 Convertible Preferred Stock | (M) | 122,070 | 48,828 | 140,664 | ||||||||||||
| Series E-1 Convertible Preferred Stock | (M) | 42,328 | 16,890 | 41,143 | ||||||||||||
| Secured Convertible Bridge Note, 10%, acquired 5/25/12 | (M) | 47,828 | $ | 45,097 | 47,828 | |||||||||||
| Warrants for Series E-1 Pref. Stock expiring on 10/9/22 | ( I ) | 2,781 | 1,407 | 3,116 | ||||||||||||
| 965,005 | 1,166,553 | |||||||||||||||
The accompanying notes are an integral part of these consolidated financial statements.
| 18 |
| HARRIS & HARRIS GROUP, INC. |
| CONSOLIDATED SCHEDULE OF INVESTMENTS AS OF DECEMBER 31, 2012 |
| Method of | Primary | Shares/ | ||||||||||||||
| Valuation (1) | Industry (2) | Cost | Principal | Value | ||||||||||||
| Investments in Unaffiliated Companies (3) – 33.3% of net assets at value (Cont.) |
||||||||||||||||
| Private Placement Portfolio (Illiquid) (4) – 19.4% of net assets at value (Cont.) |
||||||||||||||||
| Ensemble Therapeutics Corporation (7)(9)(12) | Life Sciences | |||||||||||||||
| Developing DNA-Programmed ChemistryTM for the discovery of new classes of therapeutics | ||||||||||||||||
| Series B Convertible Preferred Stock | (M) | $ | 2,000,000 | 1,449,275 | $ | 0 | ||||||||||
| Secured Convertible Bridge Note, 8%, acquired 9/11/08 | (M) | 336,550 | $ | 250,211 | 1,563,344 | |||||||||||
| Secured Convertible Bridge Note, 8%, acquired 12/10/09 | (M) | 60,858 | $ | 48,868 | 300,461 | |||||||||||
| Secured Convertible Bridge Note, 8%, acquired 1/25/12 | (M) | 117,634 | $ | 109,400 | 654,027 | |||||||||||
| 2,515,042 | 2,517,832 | |||||||||||||||
| GEO Semiconductor Inc. (13) | Electronics | |||||||||||||||
| Developing programmable, high-performance video and geometry processing solutions | ||||||||||||||||
| Participation Agreement with Montage | ||||||||||||||||
| Capital relating to the following assets: | ||||||||||||||||
| Senior secured debt, 13.75%, maturing on 1/15/13 | ( I ) | 285,125 | $ | 375,801 | 347,830 | |||||||||||
| Warrants for Series A Pref. Stock expiring on 9/17/17 | ( I ) | 66,684 | 100,000 | 79,796 | ||||||||||||
| Warrants for Series A-1 Pref. Stock expiring on 6/30/18 | ( I ) | 23,566 | 34,500 | 28,013 | ||||||||||||
| Loan and Security Agreement with GEO Semiconductor relating to the following assets: | ||||||||||||||||
| Subordinated secured debt, 15.75%, maturing on 1/15/13 | ( I ) | 109,574 | $ | 125,000 | 120,410 | |||||||||||
| Warrants for Series A Pref. Stock expiring on 3/1/18 | ( I ) | 7,512 | 10,000 | 7,511 | ||||||||||||
| Warrants for Series A-1 Pref. Stock expiring on 6/29/18 | ( I ) | 7,546 | 10,000 | 7,535 | ||||||||||||
| 500,007 | 591,095 | |||||||||||||||
| Mersana Therapeutics, Inc. (7)(9)(14) | Life Sciences | |||||||||||||||
| Developing treatments for cancer based on novel drug delivery polymers | ||||||||||||||||
| Series A-1 Convertible Preferred Stock | (M) | 316,453 | 294,019 | 316,453 | ||||||||||||
| Common Stock | (M) | 3,875,395 | 350,539 | 108,667 | ||||||||||||
| 4,191,848 | 425,120 | |||||||||||||||
| Molecular Imprints, Inc. (7)(10)(15) | Electronics | |||||||||||||||
| Manufacturing nanoimprint | ||||||||||||||||
| lithography capital equipment | ||||||||||||||||
| Series B Convertible Preferred Stock | (M) | 2,000,000 | 1,333,333 | 1,789,108 | ||||||||||||
| Series C Convertible Preferred Stock | (M) | 2,406,595 | 1,285,071 | 2,138,498 | ||||||||||||
| Non-Convertible Bridge Note | ( I ) | 0 | $ | 0 | 3,033,338 | |||||||||||
| 4,406,595 | 6,960,944 | |||||||||||||||
The accompanying notes are an integral part of these consolidated financial statements.
| 19 |
| HARRIS & HARRIS GROUP, INC. |
| CONSOLIDATED SCHEDULE OF INVESTMENTS AS OF DECEMBER 31, 2012 |
| Method of | Primary | Shares/ | ||||||||||||||
| Valuation (1) | Industry (2) | Cost | Principal | Value | ||||||||||||
| Investments in Unaffiliated Companies (3) – 33.3% of net assets at value (Cont.) |
||||||||||||||||
| Private Placement Portfolio (Illiquid) (4) – 19.4% of net assets at value (Cont.) |
||||||||||||||||
| Nanosys, Inc. (7) | Energy | |||||||||||||||
| Developing inorganic nanowires and quantum dots for use in LED-backlit devices | ||||||||||||||||
| Series C Convertible Preferred Stock | (M) | $ | 1,500,000 | 803,428 | $ | 186,032 | ||||||||||
| Series D Convertible Preferred Stock | (M) | 3,000,003 | 1,016,950 | 2,814,423 | ||||||||||||
| Series E Convertible Preferred Stock | (M) | 496,573 | 433,688 | 698,783 | ||||||||||||
| Unsecured Convertible Bridge Note, 4%, acquired 7/16/12 | (M) | 44,633 | $ | 43,821 | 249,067 | |||||||||||
| 5,041,209 | 3,948,305 | |||||||||||||||
| Nano Terra, Inc. (9) | Energy | |||||||||||||||
| Developing surface chemistry and nano- manufacturing solutions | ||||||||||||||||
| Senior secured debt, 12.0%, maturing on 12/1/15 | ( I ) | 614,597 | $ | 650,000 | 622,600 | |||||||||||
| Warrants for Series A-2 Pref. Stock expiring on 2/22/21 | ( I ) | 69,168 | 446,248 | 66,003 | ||||||||||||
| Warrants for Series C Pref. Stock expiring on 11/15/22 | ( I ) | 35,403 | 241,662 | 35,271 | ||||||||||||
| 719,168 | 723,874 | |||||||||||||||
| Nantero, Inc. (7)(9)(10) | Electronics | |||||||||||||||
| Developing a high-density, nonvolatile, random access memory chip, | ||||||||||||||||
| enabled by carbon nanotubes | ||||||||||||||||
| Series A Convertible Preferred Stock | (M) | 489,999 | 345,070 | 1,349,224 | ||||||||||||
| Series B Convertible Preferred Stock | (M) | 323,000 | 207,051 | 809,569 | ||||||||||||
| Series C Convertible Preferred Stock | (M) | 571,329 | 188,315 | 736,312 | ||||||||||||
| Series D Convertible Preferred Stock | (M) | 139,075 | 35,569 | 139,075 | ||||||||||||
| 1,523,403 | 3,034,180 | |||||||||||||||
| OHSO Clean, Inc. (16)(17) | Life Sciences | |||||||||||||||
| Developing natural, hypoallergenic household cleaning products enabled by nanotechnology- enabled formulations of thyme oil | ||||||||||||||||
| Participation Agreement with Montage | ||||||||||||||||
| Capital relating to the following assets: | ||||||||||||||||
| Senior secured debt, 13.00%, maturing on 3/31/15 | ( I ) | 580,025 | $ | 683,200 | 615,750 | |||||||||||
| Warrants for Series C Pref. Stock expiring on 3/30/22 | ( I ) | 91,742 | 1,109,333 | 66,759 | ||||||||||||
| 671,767 | 682,509 | |||||||||||||||
| Total Unaffiliated Private Placement Portfolio (cost: $29,365,558) | $ | 24,949,756 | ||||||||||||||
The accompanying notes are an integral part of these consolidated financial statements.
| 20 |
| HARRIS & HARRIS GROUP, INC. |
| CONSOLIDATED SCHEDULE OF INVESTMENTS AS OF DECEMBER 31, 2012 |
| Method of | Primary | Shares/ | ||||||||||||||
| Valuation (1) | Industry (2) | Cost | Principal | Value | ||||||||||||
| Rights to Milestone Payments (Illiquid) (5) – 2.7% of net assets at value |
||||||||||||||||
| Amgen, Inc. (7)(10) | Life Sciences | |||||||||||||||
| Rights to Milestone Payments from | ||||||||||||||||
| Acquisition of BioVex Group, Inc. | ( I ) | $ | 3,291,750 | $ | 3,291,750 | $ | 3,400,734 | |||||||||
| Total Unaffiliated Rights to Milestone Payments (cost: $3,291,750) | $ | 3,400,734 | ||||||||||||||
| Publicly Traded Portfolio (6) – 11.2% of net assets at value | ||||||||||||||||
| NeoPhotonics Corporation (10)(18) | Electronics | |||||||||||||||
| Developing and manufacturing optical devices and components | ||||||||||||||||
| Common Stock | (M) | $ | 821,971 | 50,807 | $ | 291,632 | ||||||||||
| Solazyme, Inc. (10)(19) | Energy | |||||||||||||||
| Developing algal biodiesel, industrial chemicals and specialty ingredients using synthetic biology | ||||||||||||||||
| Common Stock | (M) | 4,248,476 | 1,797,790 | 14,130,629 | ||||||||||||
| Total Unaffiliated Publicly Traded Portfolio (cost: $5,070,447) | $ | 14,422,261 | ||||||||||||||
| Total Investments in Unaffiliated Companies (cost: $37,727,755) | $ | 42,772,751 | ||||||||||||||
The accompanying notes are an integral part of these consolidated financial statements.
| 21 |
| HARRIS & HARRIS GROUP, INC. |
| CONSOLIDATED SCHEDULE OF INVESTMENTS AS OF DECEMBER 31, 2012 |
| Method of | Primary | Shares/ | ||||||||||||||
| Valuation (1) | Industry (2) | Cost | Principal | Value | ||||||||||||
| Investments in Non-Controlled Affiliated Companies (3) – | ||||||||||||||||
| 48.4% of net assets at value | ||||||||||||||||
| Private Placement Portfolio (Illiquid) (20) – 47.3% of net assets at value |
||||||||||||||||
| ABSMaterials, Inc. (7)(9) | Energy | |||||||||||||||
| Developing nano-structured absorbent materials for environmental remediation | ||||||||||||||||
| Series A Convertible Preferred Stock | (M) | $ | 435,000 | 390,000 | $ | 97,871 | ||||||||||
| Secured Convertible Bridge Note, 8%, acquired 10/1/12 | (M) | 204,033 | $ | 200,000 | 232,080 | |||||||||||
| 639,033 | 329,951 | |||||||||||||||
| Adesto Technologies Corporation (7)(9)(10) | Electronics | |||||||||||||||
| Developing low-power, high-performance memory devices | ||||||||||||||||
| Series A Convertible Preferred Stock | (M) | 2,200,000 | 6,547,619 | 4,474,625 | ||||||||||||
| Series B Convertible Preferred Stock | (M) | 2,200,000 | 5,952,381 | 4,117,841 | ||||||||||||
| Series C Convertible Preferred Stock | (M) | 1,485,531 | 2,122,187 | 1,643,416 | ||||||||||||
| Series D Convertible Preferred Stock | (M) | 1,393,147 | 1,466,470 | 1,227,285 | ||||||||||||
| 7,278,678 | 11,463,167 | |||||||||||||||
| AgBiome, LLC (formerly AgInnovation, LLC) (7)(9)(10)(16)(21) | Life Sciences | |||||||||||||||
| Providing early stage research and discovery for agriculture and utilizing the crop microbiome to identify products that reduce risk and improve yield | ||||||||||||||||
| Series A-1 Convertible Preferred Stock | (M) | 2,000,000 | 2,000,000 | 2,000,000 | ||||||||||||
| Contour Energy Systems, Inc. (7)(9)(10) | Energy | |||||||||||||||
| Developing batteries using nano-structured materials | ||||||||||||||||
| Series A Convertible Preferred Stock | (M) | 2,009,995 | 2,565,798 | 1,703,814 | ||||||||||||
| Series B Convertible Preferred Stock | (M) | 1,300,000 | 812,500 | 1,008,380 | ||||||||||||
| Series C Convertible Preferred Stock | (M) | 1,200,000 | 1,148,325 | 1,125,002 | ||||||||||||
| 4,509,995 | 3,837,196 | |||||||||||||||
The accompanying notes are an integral part of these consolidated financial statements.
| 22 |
| HARRIS & HARRIS GROUP, INC. |
| CONSOLIDATED SCHEDULE OF INVESTMENTS AS OF DECEMBER 31, 2012 |
| Method of | Primary | Shares/ | ||||||||||||||
| Valuation (1) | Industry (2) | Cost | Principal | Value | ||||||||||||
| Investments in Non-Controlled Affiliated Companies (3) – | ||||||||||||||||
| 48.4% of net assets at value (Cont.) | ||||||||||||||||
| Private Placement Portfolio (Illiquid) (20) – 47.3% of net assets at value (Cont.) |
||||||||||||||||
| D-Wave Systems, Inc. (7)(9)(22) | Electronics | |||||||||||||||
| Developing high-performance quantum computing systems | ||||||||||||||||
| Series 1 Class B Convertible Preferred Stock | (M) | $ | 1,002,074 | 1,144,869 | $ | 1,493,024 | ||||||||||
| Series 1 Class C Convertible Preferred Stock | (M) | 487,804 | 450,450 | 587,432 | ||||||||||||
| Series 1 Class D Convertible Preferred Stock | (M) | 748,473 | 855,131 | 1,115,176 | ||||||||||||
| Series 1 Class E Convertible Preferred Stock | (M) | 248,049 | 269,280 | 351,168 | ||||||||||||
| Series 1 Class F Convertible Preferred Stock | (M) | 238,323 | 258,721 | 337,398 | ||||||||||||
| Series 2 Class D Convertible Preferred Stock | (M) | 736,019 | 678,264 | 884,524 | ||||||||||||
| Series 2 Class E Convertible Preferred Stock | (M) | 409,032 | 317,746 | 414,372 | ||||||||||||
| Series 2 Class F Convertible Preferred Stock | (M) | 392,993 | 305,286 | 398,124 | ||||||||||||
| Warrants for Common Stock expiring 6/30/15 | ( I ) | 98,644 | 153,890 | 40,103 | ||||||||||||
| 4,361,411 | 5,621,321 | |||||||||||||||
| Enumeral Biomedical Corp. (7)(9)(10) | Life Sciences | |||||||||||||||
| Developing therapeutics and diagnostics through functional assaying of single cells | ||||||||||||||||
| Series A Convertible Preferred Stock | (M) | 1,026,832 | 957,038 | 1,325,507 | ||||||||||||
| Series A-1 Convertible Preferred Stock | (M) | 750,000 | 576,923 | 750,000 | ||||||||||||
| 1,776,832 | 2,075,507 | |||||||||||||||
| HzO, Inc. (7)(9)(10) | Electronics | |||||||||||||||
| Developing novel industrial coatings that protect electronics against damage from liquids | ||||||||||||||||
| Series A Convertible Preferred Stock | (M) | 666,667 | 4,057,294 | 760,227 | ||||||||||||
| Series B Convertible Preferred Stock | (M) | 2,000,000 | 7,895,776 | 1,737,366 | ||||||||||||
| 2,666,667 | 2,497,593 | |||||||||||||||
| Kovio, Inc. (7)(9)(10) | Electronics | |||||||||||||||
| Developing semiconductor products using printed electronics and thin-film technologies | ||||||||||||||||
| Series A' Convertible Preferred Stock | (M) | 5,242,993 | 2,160,000 | 359,321 | ||||||||||||
| Series B' Convertible Preferred Stock | (M) | 2,006,540 | 3,015,493 | 1,362,591 | ||||||||||||
| 7,249,533 | 1,721,912 | |||||||||||||||
The accompanying notes are an integral part of these consolidated financial statements.
| 23 |
| HARRIS & HARRIS GROUP, INC. |
| CONSOLIDATED SCHEDULE OF INVESTMENTS AS OF DECEMBER 31, 2012 |
| Method of | Primary | Shares/ | ||||||||||||||
| Valuation (1) | Industry (2) | Cost | Principal | Value | ||||||||||||
| Investments in Non-Controlled Affiliated Companies (3) – | ||||||||||||||||
| 48.4% of net assets at value (Cont.) | ||||||||||||||||
| Private Placement Portfolio (Illiquid) (20) – 47.3% of net assets at value (Cont.) |
||||||||||||||||
| Metabolon, Inc. (7)(10) | Life Sciences | |||||||||||||||
| Developing service and diagnostic products through the use of a metabolomics, or biochemical, profiling platform | ||||||||||||||||
| Series B Convertible Preferred Stock | (M) | $ | 2,500,000 | 371,739 | $ | 1,951,723 | ||||||||||
| Series B-1 Convertible Preferred Stock | (M) | 706,214 | 148,696 | 780,689 | ||||||||||||
| Series C Convertible Preferred Stock | (M) | 1,000,000 | 1,000,000 | 1,794,510 | ||||||||||||
| Series D Convertible Preferred Stock | (M) | 1,499,999 | 835,882 | 1,499,999 | ||||||||||||
| Warrants for Series B-1 Convertible Preferred Stock expiring 3/25/15 | ( I ) | 293,786 | 74,348 | 71,164 | ||||||||||||
| 5,999,999 | 6,098,085 | |||||||||||||||
| Nextreme Thermal Solutions, Inc. (7)(9)(10)(23) | Energy | |||||||||||||||
| Developed thin-film thermoelectric devices for cooling and energy conversion | ||||||||||||||||
| Common Stock | (M) | 4,384,762 | 8,080,153 | 0 | ||||||||||||
| OpGen, Inc. (7)(10)(16) | Life Sciences | |||||||||||||||
| Developing tools for genomic sequence assembly and analysis | ||||||||||||||||
| Series C Convertible Preferred Stock | (M) | 3,260,000 | 23,623,188 | 3,260,000 | ||||||||||||
| Produced Water Absorbents, Inc. (7)(9)(10) | Energy | |||||||||||||||
| Developing nano-structured absorbent materials for environmental remediation of contaminated water in the oil and gas industries | ||||||||||||||||
| Series A Convertible Preferred Stock | (M) | 1,000,000 | 1,000,000 | 278,170 | ||||||||||||
| Senova Systems, Inc. (7)(9)(10) | Life Sciences | |||||||||||||||
| Developing next-generation sensors to measure pH | ||||||||||||||||
| Series B Convertible Preferred Stock | (M) | 1,218,462 | 1,350,000 | 810,000 | ||||||||||||
| Warrants for Series B Preferred Stock expiring 10/15/17 | ( I ) | 131,538 | 164,423 | 98,637 | ||||||||||||
| 1,350,000 | 908,637 | |||||||||||||||
The accompanying notes are an integral part of these consolidated financial statements.
| 24 |
| HARRIS & HARRIS GROUP, INC. |
| CONSOLIDATED SCHEDULE OF INVESTMENTS AS OF DECEMBER 31, 2012 |
| Method of | Primary | Shares/ | ||||||||||||||
| Valuation (1) | Industry (2) | Cost | Principal | Value | ||||||||||||
| Investments in Non-Controlled Affiliated Companies (3) – | ||||||||||||||||
| 48.4% of net assets at value (Cont.) | ||||||||||||||||
| Private Placement Portfolio (Illiquid) (20) – 47.3% of net assets at value (Cont.) |
||||||||||||||||
| SiOnyx, Inc. (7)(9)(10) | Electronics | |||||||||||||||
| Developing silicon-based optoelectronic products enabled by its proprietary Black Silicon | ||||||||||||||||
| Series A Convertible Preferred Stock | (M) | $ | 750,000 | 233,499 | $ | 160,367 | ||||||||||
| Series A-1 Convertible Preferred Stock | (M) | 890,000 | 2,966,667 | 2,037,507 | ||||||||||||
| Series A-2 Convertible Preferred Stock | (M) | 2,445,000 | 4,207,537 | 2,889,736 | ||||||||||||
| Series B-1 Convertible Preferred Stock | (M) | 1,169,561 | 1,892,836 | 1,300,000 | ||||||||||||
| Series C Convertible Preferred Stock | (M) | 1,171,316 | 1,674,030 | 1,255,523 | ||||||||||||
| Warrants for Series B-1 Convertible Preferred Stock expiring 2/23/17 | ( I ) | 130,439 | 247,350 | 50,113 | ||||||||||||
| Warrants for Common Stock expiring 3/28/17 | ( I ) | 84,207 | 418,507 | 32,098 | ||||||||||||
| 6,640,523 | 7,725,344 | |||||||||||||||
| Ultora, Inc. (7)(9) | Energy | |||||||||||||||
| Developing energy-storage devices enabled by carbon nanotubes | ||||||||||||||||
| Series A Convertible Preferred Stock | (M) | 671,830 | 671,830 | 671,830 | ||||||||||||
| Xradia, Inc. (7)(10) | Electronics | |||||||||||||||
| Designing, manufacturing and selling ultra- high resolution 3D x-ray microscopes and fluorescence imaging systems | ||||||||||||||||
| Series D Convertible Preferred Stock | (M) | 4,000,000 | 3,121,099 | 12,303,684 | ||||||||||||
| Total Non-Controlled Private Placement Portfolio (cost: $57,789,263) | $ | 60,792,397 | ||||||||||||||
The accompanying notes are an integral part of these consolidated financial statements.
| 25 |
| HARRIS & HARRIS GROUP, INC. |
| CONSOLIDATED SCHEDULE OF INVESTMENTS AS OF DECEMBER 31, 2012 |
| Method of | Primary | Shares/ | ||||||||||||||
| Valuation (1) | Industry (2) | Cost | Principal | Value | ||||||||||||
| Investments in Non-Controlled Affiliated Companies (3) – | ||||||||||||||||
| 48.4% of net assets at value (Cont.) | ||||||||||||||||
| Publicly Traded Portfolio (Illiquid) (24) – 1.1% of net assets at value | ||||||||||||||||
| Champions Oncology, Inc. (10) | Life Sciences | |||||||||||||||
| Developing its TumorGraftTM platform for personalized medicine and drug development | ||||||||||||||||
| Common Stock | (M) | $ | 2,000,000 | 2,666,667 | $ | 1,348,227 | ||||||||||
| Total Non-Controlled Affiliated Publicly Traded Portfolio (cost: $2,000,000) | $ | 1,348,227 | ||||||||||||||
| Total Investments in Non-Controlled Affiliated Companies (cost: $59,789,263) | $ | 62,140,624 | ||||||||||||||
| Investments in Controlled Affiliated Companies (3)(25) – | ||||||||||||||||
| 2.4% of net assets at value | ||||||||||||||||
| Private Placement Portfolio (Illiquid) – 2.4% of net assets at value | ||||||||||||||||
| Ancora Pharmaceuticals Inc. (7)(9) | Life Sciences | |||||||||||||||
| Developing synthetic carbohydrates for pharmaceutical applications | ||||||||||||||||
| Common Stock | ( I ) | $ | 2,729,817 | 57,463 | $ | 0 | ||||||||||
| Series A' Convertible Preferred Stock | ( I ) | 4,855,627 | 4,855,627 | 521,494 | ||||||||||||
| Senior Secured Debt, 12.00%, maturing on 12/11/13 | ( I ) | 446,731 | $ | 500,000 | 453,270 | |||||||||||
| 8,032,175 | 974,764 | |||||||||||||||
The accompanying notes are an integral part of these consolidated financial statements.
| 26 |
| HARRIS & HARRIS GROUP, INC. |
| CONSOLIDATED SCHEDULE OF INVESTMENTS AS OF DECEMBER 31, 2012 |
| Method of | Primary | Shares/ | ||||||||||||||
| Valuation (1) | Industry (2) | Cost | Principal | Value | ||||||||||||
| Investments in Controlled Affiliated Companies (3)(25) – | ||||||||||||||||
| 2.4% of net assets at value (Cont.) | ||||||||||||||||
| Private Placement Portfolio (Illiquid) – 2.4% of net assets at value (Cont.) |
||||||||||||||||
| Laser Light Engines, Inc. (7)(9) | Energy | |||||||||||||||
| Manufacturing solid-state light sources for digital cinema and large-venue projection displays | ||||||||||||||||
| Series A Convertible Preferred Stock | (M) | $ | 2,000,000 | 7,499,062 | $ | 0 | ||||||||||
| Series B Convertible Preferred Stock | (M) | 3,095,802 | 13,571,848 | 1,008,225 | ||||||||||||
| Secured Convertible Bridge Note, 12%, acquired 10/7/11 | (M) | 229,721 | $ | 200,000 | 229,721 | |||||||||||
| Secured Convertible Bridge Note, 12%, acquired 11/17/11 | (M) | 108,577 | $ | 95,652 | 108,577 | |||||||||||
| Secured Convertible Bridge Note, 12%, acquired 12/21/11 | (M) | 92,848 | $ | 82,609 | 92,848 | |||||||||||
| Secured Convertible Bridge Note, 12%, acquired 3/5/12 | (M) | 477,953 | $ | 434,784 | 477,953 | |||||||||||
| Secured Convertible Bridge Note, 12%, acquired 7/26/12 | (M) | 196,728 | $ | 186,955 | 196,728 | |||||||||||
| 6,201,629 | 2,114,052 | |||||||||||||||
| Total Controlled Private Placement Portfolio (cost: $14,233,804) | $ | 3,088,816 | ||||||||||||||
| Total Investments in Controlled Affiliated Companies (cost: $14,233,804) | $ | 3,088,816 | ||||||||||||||
| Total Private Placement and Publicly Traded Portfolio (cost: $111,750,822) | $ | 108,002,191 | ||||||||||||||
| Method of | Shares/ | |||||||||||||
| Valuation (1) | Cost | Principal | Value | |||||||||||
| U.S. Government Securities (26) – 10.9% of net assets at value | ||||||||||||||
| U.S. Treasury Bill — due date 03/28/13 | (M) | $ | 13,996,136 | $ | 14,000,000 | $ | 13,998,880 | |||||||
| Total Investments in U.S. Government Securities (cost: $13,996,136) | $ | 13,998,880 | ||||||||||||
| Total Investments (cost: $125,746,958) | $ | 122,001,071 | ||||||||||||
The accompanying notes are an integral part of these consolidated financial statements.
| 27 |
| HARRIS & HARRIS GROUP, INC. |
| CONSOLIDATED SCHEDULE OF INVESTMENTS AS OF DECEMBER 31, 2012 |
| Method of | Number of | |||||||||
| Valuation (1) | Contracts | Value | ||||||||
| Written Call Options (16) – (0.03)% of net assets at value | ||||||||||
| Solazyme, Inc. — Strike Price $10.00, March 16, 2013 | (M) | 1,500 | $ | (37,500 | ) | |||||
| NeoPhotonics Corporation — Strike Price $7.50, February 16, 2013 | (M) | 500 | (5,000 | ) | ||||||
| Total Written Call Options (Premiums Received $50,000) | $ | (42,500 | ) | |||||||
The accompanying notes are an integral part of these consolidated financial statements.
| 28 |
| HARRIS & HARRIS GROUP, INC. |
| CONSOLIDATED SCHEDULE OF INVESTMENTS AS OF DECEMBER 31, 2012 |
Notes to Consolidated Schedule of Investments
| (1) | See "Footnote to Consolidated Schedule of Investments" on page 32 for a description of the "Valuation Procedures." |
| (2) | We classify "Energy" companies as those that seek to improve performance, productivity or efficiency, and to reduce environmental impact, waste, cost, energy consumption or raw materials using nanotechnology-enabled solutions. We classify "Electronics" companies as those that use nanotechnology to address problems in electronics-related industries, including semiconductors. In the fourth quarter of 2012, we renamed the industry classification "Healthcare" to "Life Sciences." We classify "Life Sciences" companies as those that address problems in life sciences-related industries, including biotechnology, agriculture, advanced materials and chemicals, healthcare, bioprocessing, water, industrial biotechnology, food, nutrition and energy. |
| (3) | Investments in unaffiliated companies consist of investments in which we own less than five percent of the voting shares of the portfolio company. Investments in non-controlled affiliated companies consist of investments in which we own five percent or more, but less than 25 percent, of the voting shares of the portfolio company, or where we hold one or more seats on the portfolio company’s Board of Directors but do not control the company. Investments in controlled affiliated companies consist of investments in which we own 25 percent or more of the voting shares of the portfolio company or otherwise control the company. |
| (4) | The aggregate cost for federal income tax purposes of investments in unaffiliated privately held companies is $29,365,558. The gross unrealized appreciation based on the tax cost for these securities is $4,376,000. The gross unrealized depreciation based on the tax cost for these securities is $8,791,802. |
| (5) | The aggregate cost for federal income tax purposes of investments in unaffiliated rights to milestone payments is $3,291,750. The gross unrealized appreciation based on the tax cost for these securities is $108,984. The gross unrealized depreciation based on the tax cost for these securities is $0. |
| (6) | The aggregate cost for federal income tax purposes of investments in unaffiliated publicly traded companies is $5,070,447. The gross unrealized appreciation based on the tax cost for these securities is $9,882,153. The gross unrealized depreciation based on the tax cost for these securities is $530,339. |
| (7) | We are subject to legal restrictions on the sale of our investment(s) in this company. |
| (8) | With the conversion of our bridge note into shares of Series E-1 Preferred Stock, we received a warrant to purchase shares of common stock at $0.25 per share. The number of shares is determined by certain financial targets for 2012 set upon receipt of the audited financial statements for 2012. These financial statements have not yet been issued, and, therefore, the warrant remains contingent as of December 31, 2012. |
| (9) | These investments are development-stage companies. A development-stage company is defined as a company that is devoting substantially all of its efforts to establishing a new business, and either it has not yet commenced its planned principal operations, or it has commenced such operations but has not realized significant revenue from them. |
The accompanying notes are an integral part of this consolidated schedule.
| 29 |
| HARRIS & HARRIS GROUP, INC. |
| CONSOLIDATED SCHEDULE OF INVESTMENTS AS OF DECEMBER 31, 2012 |
| (10) | Represents a non-income producing security. Investments that have not paid dividends or interest within the last 12 months are considered to be non-income producing. |
| (11) | Cobalt Technologies, Inc., also does business as Cobalt Biofuels. |
| (12) | With our investment in a convertible bridge note issued by Ensemble Therapeutics Corporation, we received a warrant to purchase a number of shares of the class of stock sold in the next financing of Ensemble Therapeutics Corporation equal to $149,540 divided by the price per share of the class of stock sold in the next financing of Ensemble Therapeutics Corporation. The ability to exercise this warrant is, therefore, contingent on Ensemble Therapeutics Corporation completing successfully a subsequent round of financing. This warrant shall expire and no longer be exercisable on September 10, 2015. The cost basis of this warrant is $89.86. |
| (13) | The outstanding loans with maturity dates of 1/15/13 were not repaid as of that date. The maturity dates of these loans are expected to be extended to at least 6/30/13. GEO Semiconductor continues to pay principal and interest, as applicable, on each loan based on the terms negotiated as of December 31, 2012. |
| (14) | With our investment in the Mersana Therapeutics, Inc., Series A-1 financing, we received a warrant to purchase 277,760 shares of Series A-2 Convertible Preferred Stock. The ability to exercise the warrant is contingent upon Mersana's achievement of certain milestones. Mersana has not achieved those milestones as of December 31, 2012, and, therefore, this warrant is a contingent asset as of that date. The warrant will expire on July 27, 2022. |
| (15) | As part of a loan the Company made to Molecular Imprints in the second quarter of 2011, we received a liquidation preference payable upon a sale of the company equal to three times the principal of the loan, or $4,044,450. This preference is senior to the preferences of the outstanding preferred stock. While the loan has since been repaid, this liquidation preference remains outstanding as of December 31, 2012. |
| (16) | Initial investment was made during 2012. |
| (17) | OHSO Clean, Inc. also does business as CleanWell Company. |
| (18) | A portion of this security is held in connection with written call option contracts: 50,000 shares, having a fair value of $287,000, have been pledged to brokers. |
| (19) | A portion of this security is held in connection with written call option contracts: 150,000 shares, having a fair value of $1,175,000, have been pledged to brokers. |
| (20) | The aggregate cost for federal income tax purposes of investments in non-controlled affiliated companies is $57,789,263. The gross unrealized appreciation based on the tax cost for these securities is $15,229,665. The gross unrealized depreciation based on the tax cost for these securities is $12,226,531. |
| (21) | On January 29, 2013, AgInnovation, LLC, changed its name to AgBiome, LLC. |
The accompanying notes are an integral part of this consolidated schedule.
| 30 |
|
HARRIS & HARRIS GROUP, INC. CONSOLIDATED SCHEDULE OF INVESTMENTS AS OF DECEMBER 31, 2012 |
| (22) | D-Wave Systems, Inc., is located and is doing business primarily in Canada. We invested in D-Wave Systems, Inc., through Parallel Universes, Inc., a Delaware company. Our investment is denominated in Canadian dollars and is subject to foreign currency translation. See "Note 2. Summary of Significant Accounting Policies." |
| (23) | On February 13, 2013, Nextreme Thermal Solutions, Inc., was acquired by Laird Technologies, Inc., for $1 and the potential for future milestone payments. |
| (24) | The aggregate cost for federal income tax purposes of investments in non-controlled affiliated publicly traded companies is $2,000,000. The gross unrealized appreciation based on the tax cost for these securities is $0. The gross unrealized depreciation based on the tax cost for these securities is $651,773. |
| (25) | The aggregate cost for federal income tax purposes of investments in controlled affiliated companies is $14,233,804. The gross unrealized appreciation based on the tax cost for these securities is $0. The gross unrealized depreciation based on the tax cost for these securities is $11,144,988. |
| (26) | The aggregate cost for federal income tax purposes of our U.S. government securities is $13,996,136. The gross unrealized appreciation on the tax cost for these securities is $2,744. The gross unrealized depreciation on the tax cost of these securities is $0. |
The accompanying notes are an integral part of this consolidated schedule.
| 31 |
| HARRIS & HARRIS GROUP, INC. |
| FOOTNOTE TO CONSOLIDATED SCHEDULE OF INVESTMENTS |
VALUATION PROCEDURES
| I. | Determination of Net Asset Value |
The 1940 Act requires periodic valuation of each investment in the portfolio of the Company to determine its net asset value. Under the 1940 Act, unrestricted securities with readily available market quotations are to be valued at the current market value; all other assets must be valued at "fair value" as determined in good faith by or under the direction of the Board of Directors.
The Board of Directors is responsible for (1) determining overall valuation guidelines and (2) ensuring that the investments of the Company are valued within the prescribed guidelines.
The Valuation Committee, comprised of all of the independent board members, is responsible for determining the valuation of the Company’s assets within the guidelines established by the Board of Directors. The Valuation Committee receives information and recommendations from management. An independent valuation firm also reviews select portfolio company valuations. The independent valuation firm does not provide proposed valuations.
The values assigned to these investments are based on available information and do not necessarily represent amounts that might ultimately be realized when that investment is sold, as such amounts depend on future circumstances and cannot reasonably be determined until the individual investments are actually liquidated or become readily marketable.
| II. | Approaches to Determining Fair Value |
GAAP defines fair value as the price that would be received to sell an asset or paid to transfer a liability in an orderly transaction between market participants at the measurement date (exit price). In effect, GAAP applies fair value terminology to all valuations whereas the 1940 Act applies market value terminology to readily marketable assets and fair value terminology to other assets.
The main approaches to measuring fair value utilized are the market approach and the income approach.
| · | Market Approach (M): The market approach may use quantitative inputs such as prices and other relevant information generated by market transactions involving identical or comparable assets or liabilities and the values of market multiples derived from a set of comparable companies. The market approach may also use qualitative inputs such as progress toward milestones, the long-term potential of the business, current and future financing requirements and the rights and preferences of certain securities versus those of other securities. The selection of the relevant inputs used to derive value under the market approach requires judgment considering factors specific to the significance and relevance of each input to deriving value. |
| 32 |
| · | Income Approach (I): The income approach uses valuation techniques to convert future amounts (for example, cash flows or earnings) to a single present value amount (discounted). The measurement is based on the value indicated by current market expectations about those future amounts. Those valuation techniques include present value techniques; option-pricing models, such as the Black-Scholes-Merton formula (a closed-form model) and a binomial model (a lattice model), which incorporate present value techniques; and the multi-period excess earnings method, which is used to measure the fair value of certain assets. |
GAAP classifies the inputs used to measure fair value by these approaches into the following hierarchy:
| · | Level 1: Unadjusted quoted prices in active markets for identical assets or liabilities. |
| · | Level 2: Quoted prices in active markets for similar assets or liabilities, or quoted prices for identical or similar assets or liabilities in markets that are not active, or inputs other than quoted prices that are observable for the asset or liability, either directly or indirectly, for substantially the full term of the financial instrument. Level 2 inputs are in those markets for which there are few transactions, the prices are not current, little public information exists or instances where prices vary substantially over time or among brokered market makers; and |
| · | Level 3: Inputs to the valuation methodology are unobservable and significant to the fair value measurement. Unobservable inputs are those inputs that reflect our own assumptions that market participants would use to price the asset or liability based upon the best available information. |
Financial assets and liabilities are classified in their entirety based on the lowest level of input that is significant to the fair value measurement and are not necessarily an indication of risks associated with the investment.
| III. | Investment Categories |
The Company’s investments can be classified into five broad categories for valuation purposes:
| · | Equity-related securities; |
| · | Long-term fixed-income securities; |
| · | Short-term fixed-income securities; |
| · | Investments in intellectual property, patents, research and development in technology or product development; and |
| · | All other securities. |
The Company applies the methods for determining fair value discussed above to the valuation of investments in each of these five broad categories as follows:
| 33 |
| A. | EQUITY-RELATED SECURITIES |
Equity-related securities, including options or warrants, are fair valued using the market or income approaches. The following factors may be considered when the market approach is used to fair value these types of securities:
| § | Readily available public market quotations; |
| § | The cost of the Company’s investment; |
| § | Transactions in a company's securities or unconditional firm offers by responsible parties as a factor in determining valuation; |
| § | The financial condition and operating results of the company; |
| § | The company's progress towards milestones; |
| § | The long-term potential of the business and technology of the company; |
| § | The values of similar securities issued by companies in similar businesses; |
| § | Multiples to revenue, net income or EBITDA that similar securities issued by companies in similar businesses receive; |
| § | The proportion of the company's securities we own and the nature of any rights to require the company to register restricted securities under applicable securities laws; and |
| § | The rights and preferences of the class of securities we own as compared with other classes of securities the portfolio company has issued. |
When the income approach is used to value warrants, the Company uses the Black-Scholes-Merton formula.
| B. | LONG-TERM FIXED-INCOME SECURITIES |
| 1. | Readily Marketable: Long-term fixed-income securities for which market quotations are readily available are valued using the most recent bid quotations when available. |
| 2. | Not Readily Marketable: Long-term fixed-income securities for which market quotations are not readily available are fair valued using the income approach. The factors that may be considered when valuing these types of securities by the income approach include: |
| · | Credit quality; |
| · | Interest rate analysis; |
| · | Quotations from broker-dealers; |
| · | Prices from independent pricing services that the Board believes are reasonably reliable; and |
| · | Reasonable price discovery procedures and data from other sources. |
| 34 |
| C. | SHORT-TERM FIXED-INCOME SECURITIES |
Short-term fixed-income securities are valued in the same manner as long-term fixed-income securities until the remaining maturity is 60 days or less, after which time such securities may be valued at amortized cost if there is no concern over payment at maturity.
| D. | INVESTMENTS IN INTELLECTUAL PROPERTY, PATENTS, RESEARCH AND DEVELOPMENT IN TECHNOLOGY OR PRODUCT DEVELOPMENT |
Such investments are fair valued using the market approach. The Company may consider factors specific to these types of investments when using the market approach including:
| · | The cost of the Company’s investment; |
| · | Investments in the same or substantially similar intellectual property or patents, research and development in technology or product development, or offers by responsible third parties; |
| · | The results of research and development; |
| · | Product development and milestone progress; |
| · | Commercial prospects; |
| · | Term of patent; |
| · | Projected markets; and |
| · | Other subjective factors. |
| E. | ALL OTHER SECURITIES |
All other securities are reported at fair value as determined in good faith by the Valuation Committee using the approaches for determining valuation as described above.
For all other securities, the reported values shall reflect the Valuation Committee's judgment of fair values as of the valuation date using the outlined basic approaches of valuation discussed in Section III. They do not necessarily represent an amount of money that would be realized if we had to sell such assets in an immediate liquidation. Thus, valuations as of any particular date are not necessarily indicative of amounts that we may ultimately realize as a result of future sales or other dispositions of investments we hold.
| 35 |
| NOTES TO CONSOLIDATED FINANCIAL STATEMENTS |
| (Unaudited) |
NOTE 1. THE COMPANY
Harris & Harris Group, Inc. (the "Company," "us," "our" and "we"), is a venture capital company operating as a business development company ("BDC") under the Investment Company Act of 1940 (the "1940 Act") that specializes in making investments in transformative companies enabled by disruptive science. We operate as an internally managed investment company whereby our officers and employees, under the general supervision of our Board of Directors, conduct our operations.
H&H Ventures Management, Inc.SM ("Ventures"), formerly Harris & Harris Enterprises, Inc.SM, is a 100 percent wholly owned subsidiary of the Company. Ventures is taxed under Subchapter C (a "C Corporation") of the Internal Revenue Code of 1986 (the "Code"). Harris Partners I, L.P, is a limited partnership and, from time to time, may be used to hold certain interests in portfolio companies. The partners of Harris Partners I, L.P., are Ventures (sole general partner) and the Company (sole limited partner). Ventures pays taxes on income generated by its operations as well as on any non-passive investment income generated by Harris Partners I, L.P. For the period ended September 30, 2013, there was no non-passive investment income generated by Harris Partners I, L.P. Ventures, as the sole general partner, consolidates Harris Partners I, L.P. The Company consolidates its wholly owned subsidiary, Ventures, for financial reporting purposes.
NOTE 2. INTERIM FINANCIAL STATEMENTS
Our interim financial statements have been prepared in accordance with the instructions to Form 10-Q and Article 10 of Regulation S-X and in conformity with accounting principles generally accepted in the United States of America ("GAAP") applicable to interim financial information. Accordingly, they do not include all information and disclosures necessary for a fair statement of our financial position, results of operations and cash flows in conformity with GAAP. In the opinion of management, these financial statements reflect all adjustments, consisting of valuation adjustments and normal recurring accruals, necessary for a fair statement of our financial position, results of operations and cash flows for such periods. The results of operations for any interim period are not necessarily indicative of the results for the full year. These financial statements should be read in conjunction with the financial statements and notes thereto contained in our Annual Report on Form 10-K for the fiscal year ended December 31, 2012.
NOTE 3. SUMMARY OF SIGNIFICANT ACCOUNTING POLICIES
The following is a summary of significant accounting policies followed in the preparation of the consolidated financial statements:
| 36 |
Principles of Consolidation. The consolidated financial statements have been prepared in accordance with GAAP and include the accounts of the Company and its wholly owned subsidiary. In accordance with GAAP and Regulation S-X, the Company may only consolidate its interests in investment company subsidiaries and controlled operating companies whose business consists of providing services to the Company. Our wholly owned subsidiary, Ventures, is a controlled operating company that provides services to us and is, therefore, consolidated. All significant inter-company accounts and transactions have been eliminated in consolidation.
Use of Estimates. The preparation of the consolidated financial statements in conformity with GAAP requires management to make estimates and assumptions that affect the reported amounts of assets and liabilities and contingent assets and liabilities and the reported amounts of revenues and expenses. Actual results could differ from these estimates, and the differences could be material. The most significant estimates relate to the fair valuations of our investments.
Portfolio Investment Valuations. Investments are stated at "value" as defined in the 1940 Act and in the applicable regulations of the Securities and Exchange Commission ("SEC") and in accordance with GAAP. Value, as defined in Section 2(a)(41) of the 1940 Act, is (i) the market price for those securities for which a market quotation is readily available and (ii) the fair value as determined in good faith by, or under the direction of, the Board of Directors for all other assets. (See "Valuation Procedures" in the "Footnote to Consolidated Schedule of Investments.") As of September 30, 2013, our financial statements include privately held investments fair valued at $85,924,204. The fair values of our privately held investments and warrants of Champions Oncology, Inc., a publicly traded company, were determined in good faith by, or under the direction of, the Board of Directors. Upon sale of investments, the values that are ultimately realized may be different from what is presently estimated. The difference could be material.
Cash. Cash includes demand deposits. Cash is carried at cost, which approximates fair value.
Restricted Funds. At September 30, 2013, and December 31, 2012, we held $10,028 and $10,015, respectively, in "Restricted funds," related to security deposits for sublessors.
Unaffiliated Rights to Milestone Payments. At September 30, 2013, and December 31, 2012, the outstanding milestone payments from Amgen, Inc.’s acquisition of Biovex Group, Inc., were valued at $3,375,388 and $3,400,734, respectively. The milestone payments are derivatives and valued using the probability-adjusted, present value of proceeds from future payments that would be due upon successful completion of certain regulatory and sales milestones. If all remaining milestones are met, we would receive $9,526,393. There can be no assurance as to how much of this amount we will ultimately realize or when it will be realized, if at all. At September 30, 2013, the outstanding milestone payments from Laird Technologies, Inc.’s acquisition of Nextreme Thermal Solutions, Inc., were valued at $0.
Receivable from Sales of Investments. At September 30, 2013, we had a receivable totaling $22,799,975 relating to an unsettled trade from the sale of a U.S. Treasury security. This transaction settled on October 1, 2013, at which time we received the cash for this sale. We liquidated our U.S. Treasury position owing to the risk of default associated with those securities in October.
| 37 |
Funds Held in Escrow from Sale of Investment. At September 30, 2013, there were funds held in escrow fair valued at $1,168,671 relating to the sale of Xradia, Inc., to Carl Zeiss AG. Funds held in escrow are valued using certain discounts applied to the amounts withheld. Funds held in escrow from the Xradia transaction will be released in January and July of 2014 net of any settlement of any indemnity claims and expenses related to the transaction. If the funds held in escrow for this transaction are released in full, we would receive $2,374,827.
Prepaid Expenses. We include prepaid insurance premiums and deferred financing charges in "Prepaid expenses." Prepaid insurance premiums are recognized over the term of the insurance contract. Deferred financing charges consist of fees and expenses paid in connection with the closing of loan facilities and are capitalized at the time of payment. Deferred financing charges are amortized over the term of the loan facility discussed in "Note 5. Debt." Amortization of the financing charges is included in "Interest and other debt expense" in the Consolidated Statements of Operations.
Property and Equipment. Property and equipment are included in "Other assets" and are carried at $250,361 and $288,122 at September 30, 2013, and December 31, 2012, respectively, representing cost, less accumulated depreciation. Depreciation is provided using the straight-line method over the estimated useful lives of the premises and equipment. We estimate the useful lives to be five to ten years for furniture and fixtures, three years for computer equipment, and the lesser of ten years or the remaining life of the lease for leasehold improvements.
Post Retirement Plan Liabilities. The Company provides a Retiree Medical Benefit Plan for employees who meet certain eligibility requirements. Until it was terminated on May 5, 2011, the Company also provided an Executive Mandatory Retirement Benefit Plan for certain individuals employed by us in a bona fide executive or high policy-making position. The net periodic postretirement benefit cost for the year is determined as the sum of service cost for the year and interest on the accumulated postretirement benefit obligation. Unrecognized actuarial gains and losses are recognized as net periodic benefit cost pursuant to the Company's historical accounting policy. The impact of plan amendments are amortized over the service period as a component of "Accumulated other comprehensive income."
Interest Income Recognition. Interest income, including amortization of premium and accretion of discount, is recorded on an accrual basis. When accrued interest is determined to not be recoverable, the Company ceases accruing interest and writes off any previously accrued interest. Securities are deemed to be non-income producing if, on their last interest or dividend date, no cash was paid or no cash or in-kind dividends were declared. These write-offs are reversed through interest income. During the three months and nine months ended September 30, 2013, the Company earned $81,787 and $257,604, respectively, in interest on U.S. government securities, senior secured debt, participation agreements, subordinated secured debt, non-convertible promissory notes and interest-bearing accounts. During the three months and nine months ended September 30, 2013, the Company recorded $33,238 and $172,474, respectively, of bridge note interest. During the three months and nine months ended September 30, 2012, the Company earned $74,821 and $210,146, respectively, in interest on U.S. government securities, senior secured debt, participation agreements, subordinated secured debt and interest-bearing accounts. During the three months and nine months ended September 30, 2012, the Company recorded, on a net basis, $275,148 and $190,466, respectively, of bridge note interest.
| 38 |
Loan Fees. Loan fees received in connection with our venture debt investments are deferred. The unearned fee income is accreted into income based on the effective interest method over the life of the investment.
Call Options. The Company writes covered call options on publicly traded securities with the intention of earning option premiums. Option premiums may increase the Company’s realized gains and, therefore, may help increase distributable income, but may limit the realized gains on the security. When a Company writes (sells) an option, an amount equal to the premium received by the Company is recorded in the Consolidated Statements of Assets and Liabilities as a liability. The amount of the liability is subsequently marked-to-market to reflect the current market value of the option written. When an option expires, the Company realizes a gain on the option to the extent of the premiums received. Premiums received from writing options that are exercised or closed are added to the proceeds or offset against the amount paid on the transaction to determine the realized gain or loss. At September 30, 2013, and December 31, 2012, the Company had 250,000 shares and 150,000 shares, respectively, of Solazyme, Inc., covered by call option contracts. In the event these contracts are exercised, the Company would be required to deliver those shares to the counterparty.
Put Options. The Company purchases put options on publicly traded securities with the intention of limiting its downside risk. When the Company purchases a put option, an amount equal to the premium paid is recorded in the Consolidated Statements of Assets and Liabilities as an investment. The amount of this asset is subsequently marked-to-market to reflect the current value of the put option. In the event that the put option is exercised, the Company would be required to deliver those shares to the counterparty. When the put option expires unexercised, the Company realizes a loss on the premium paid. The Company did not have any put options outstanding at September 30, 2013, or December 31, 2012.
Stock-Based Compensation. The Company has a stock-based employee compensation plan. The Company accounts for the Amended and Restated Harris & Harris Group, Inc. 2012 Equity Incentive Plan (the "Stock Plan") by determining the fair value of all share-based payments to employees, including the fair value of grants of employee stock options and restricted stock awards, and records these amounts as an expense in the Consolidated Statements of Operations over the vesting period with a corresponding increase to our additional paid-in capital. At September 30, 2013, and December 31, 2012, the increase to our operating expenses was offset by the increase to our additional paid-in capital, resulting in no net impact to our net asset value. Additionally, the Company does not record the potential tax benefits associated with the expensing of stock options or restricted stock because the Company currently intends to qualify as a regulated investment company ("RIC") under Subchapter M of the Code, and the deduction attributable to such expensing, therefore, is unlikely to provide any additional tax savings. The amount of non-cash, stock-based compensation expense recognized in the Consolidated Statements of Operations is based on the fair value of the awards the Company expects to vest, recognized over the vesting period on a straight-line basis for each award, and adjusted for actual awards vested and pre-vesting forfeitures. The forfeiture rate is estimated at the time of grant and revised, if necessary, in subsequent periods if the actual forfeiture rate differs from the estimated rate and is accounted for in the current period and prospectively. See "Note 9. Stock-Based Compensation" for further discussion.
| 39 |
Rent expense. Our lease at 1450 Broadway, New York, New York, commenced on January 21, 2010. The lease expires on December 31, 2019. The base rent is $36 per square foot with a 2.5 percent increase per year over the 10 years of the lease, subject to a full abatement of rent for four months and a rent credit for six months throughout the lease term. Certain leasehold improvements were also paid for on our behalf by the landlord, the cost of which is accounted for as property and equipment and "Deferred rent" in the accompanying Consolidated Statements of Assets and Liabilities. These leasehold improvements are depreciated over the lease term. We also lease office space in California and North Carolina. We apply these rent abatements, credits, escalations and landlord payments on a straight-line basis in the determination of rent expense over the lease term.
Realized Gain or Loss and Unrealized Appreciation or Depreciation of Portfolio Investments. Realized gain or loss is recognized when an investment is disposed of and is computed as the difference between the Company's cost basis in the investment at the disposition date and the net proceeds received from such disposition. Realized gains and losses on investment transactions are determined by specific identification. Unrealized appreciation or depreciation is computed as the difference between the fair value of the investment and the cost basis of such investment.
Income Taxes. As we intend to qualify as a RIC under Subchapter M of the Code, the Company does not accrue for income taxes. The Company has capital loss carryforwards that can be used to offset net realized capital gains. The Company recognizes interest and penalties in income tax expense. We pay federal, state and local income taxes on behalf of our wholly owned subsidiary, Ventures, which is a C corporation. See "Note 10. Income Taxes."
Foreign Currency Translation. The accounting records of the Company are maintained in U.S. dollars. All assets and liabilities denominated in foreign currencies are translated into U.S. dollars based on the rate of exchange of such currencies against U.S. dollars on the date of valuation. For the three months ended September 30, 2013, included in the net increase in unrealized depreciation on investments was an unrealized gain of $132,582 resulting from foreign currency translation. For the nine months ended September 30, 2013, included in the net increase in unrealized depreciation on investments was an unrealized loss of $177,465 resulting from foreign currency translation. For the three months and nine months ended September 30, 2012, included in the net increase in unrealized appreciation on investments was unrealized appreciation of $216,249 and $199,932, respectively, resulting from foreign currency translation.
Securities Transactions. Securities transactions are accounted for on the date the transaction for the purchase or sale of the securities is entered into by the Company (i.e., trade date).
Concentration of Credit Risk. The Company places its cash and cash equivalents with financial institutions and, at times, cash held in depository accounts may exceed the Federal Deposit Insurance Corporation insured limit.
NOTE 4. BUSINESS RISKS AND UNCERTAINTIES
We invest primarily in privately held companies, the securities of which are inherently illiquid. We also have investments in small publicly traded companies. Although these companies are publicly traded, their stock may not trade at high volumes and prices can be volatile, which may restrict our ability to sell our positions. These privately held and publicly traded businesses tend to not have attained profitability, and many of these businesses also lack management depth and have limited or no history of operations. Because of the speculative nature of our investments and the lack of a liquid market for and restrictions on transfers of privately held investments, there is greater risk of loss relative to traditional marketable investment securities.
| 40 |
We do not choose investments based on a strategy of diversification. We also do not rebalance the portfolio should one of our portfolio companies increase in value substantially relative to the rest of the portfolio. Therefore, the value of our portfolio may be more vulnerable to microeconomic events affecting a single sector, industry or portfolio company and to general macroeconomic events that may be unrelated to our portfolio companies. These factors may subject the value of our portfolio to greater volatility than a company that follows a diversification strategy. As of September 30, 2013, and December 31, 2012, our largest 10 investments by value accounted for approximately 74 percent and 73 percent, respectively, of the value of our equity-focused venture capital portfolio. Our largest three investments, by value, Adesto Technologies Corporation, SiOnyx, Inc., and Molecular Imprints, Inc., accounted for approximately 16 percent, 10 percent and 7 percent, respectively, of our equity-focused venture capital portfolio at September 30, 2013. Adesto Technologies, SiOnyx and Molecular Imprints are privately held portfolio companies. As of December 31, 2012, our largest two investments, by value, Solazyme, Inc., a publicly traded company, and Xradia, Inc., a privately held company, accounted for approximately 14 percent and 12 percent, respectively, of our equity-focused venture capital portfolio.
Approximately 91 percent of the portion of our equity-focused venture capital portfolio that was fair valued was comprised of securities of 25 privately held companies and warrants of one publicly traded company. Because there is typically no public or readily ascertainable market for our interests in the small privately held companies in which we invest, the valuation of the securities in that portion of our portfolio is determined in good faith by our Valuation Committee, which is comprised of all of the independent members of our Board of Directors. The values are determined in accordance with our Valuation Procedures and are subject to significant estimates and judgments. The fair value of the securities in our portfolio may differ significantly from the values that would be placed on these securities if a ready market for the securities existed. Any changes in valuation are recorded in our Consolidated Statements of Operations as "Net (decrease) increase in unrealized appreciation on investments." Changes in valuation of any of our investments in privately held companies from one period to another may be significant.
NOTE 5. DEBT
On September 30, 2013, the Company terminated the Revolving Loan Agreement by and between the Company and TD Bank, N.A., dated February 24, 2011, as amended, its existing $10 million three-year revolving credit facility (the “Prior Credit Facility”). As of September 30, 2013, there was no principal outstanding under the Prior Credit Facility and no termination fees were incurred in connection with terminating the Prior Credit Facility.
On September 30, 2013, the Company entered into a four-year $20,000,000 Multi-Draw Term Loan Facility Credit Agreement, by and among the Company, as borrower, Orix Corporate Capital, Inc., as administrative agent and lender and the other lenders party thereto from time to time, which provides for a multi-draw loan facility (the "Loan Facility") that may be used by the Company to fund investments in portfolio companies. The Loan Facility replaces the Company’s Prior Credit Facility with TD Bank, NA. The Loan Facility, among other things, matures on September 30, 2017, and bears interest at 10 percent per annum in cash. The Company has the option to have interest accrue at a rate of 13.5 percent per annum if the Company decides not to pay interest in cash monthly. The Company currently plans to pay interest in cash if and when any borrowings are outstanding. The Loan Facility also requires payment of a draw fee on each borrowing equal to 1.0 percent of such borrowing and an unused commitment fee of 1.0 percent per annum. Interest and fee payments under the Loan Facility are made quarterly in arrears. The Company may prepay the loans or reduce the aggregate commitments under the Loan Facility at any time prior to the maturity date, as long as certain conditions are met, including payment of required prepayment or termination fees. The Loan Facility is secured by all of the assets of the Company and its wholly owned subsidiaries, subject to certain customary exclusions. The Loan Facility contains certain affirmative and negative covenants, including without limitation: (a) maintenance of certain minimum liquidity requirements; (b) maintenance of an eligible asset leverage ratio of not less than 4.0:1.0; (c) limitations on liens; (d) limitations on the incurrence of additional indebtedness; and (e) limitations on structural changes, mergers and disposition of assets (other than in the normal course of our business activities). There were no borrowings at closing.
| 41 |
At September 30, 2013, and December 31, 2012, the Company had no outstanding debt. At December 31, 2012, $0 was held in a collateral account at TD Bank, N.A. as security for the loan under the Prior Credit Facility. The weighted average annual interest rate for the nine months ended September 30, 2013, was zero percent, exclusive of amortization of closing fees and other expenses related to establishing the Prior Credit Facility. The remaining capacity under the Loan Facility was $20,000,000 at September 30, 2013. Fees and expenses of $700,000 related to establishing the Loan Facility have been deferred and included as "Prepaid expenses" as of September 30, 2013. These amounts are amortized over the term of the Loan Facility. At September 30, 2013, the Company was in compliance with all covenants required by the Loan Facility.
NOTE 6. FAIR VALUE OF INVESTMENTS
At September 30, 2013, our financial assets and liabilities were categorized as follows in the fair value hierarchy:
| Fair Value Measurement at Reporting Date Using: | ||||||||||||||||
| Description | September 30, 2013 |
Unadjusted
Quoted Prices in Active Markets for Identical Assets (Level 1) |
Significant Other Observable Inputs (Level 2) |
Significant Unobservable Inputs (Level 3) |
||||||||||||
| Privately Held Portfolio Companies: | ||||||||||||||||
| Preferred Stock | $ | 70,543,092 | $ | 0 | $ | 0 | $ | 70,543,092 | ||||||||
| Bridge Notes | 4,778,681 | 0 | 0 | 4,778,681 | ||||||||||||
| Warrants | 1,017,118 | 0 | 0 | 1,017,118 | ||||||||||||
| Rights to Milestone Payments | 3,375,388 | 0 | 0 | 3,375,388 | ||||||||||||
| Common Stock | 108,667 | 0 | 0 | 108,667 | ||||||||||||
| Senior Secured Debt | 1,518,630 | 0 | 0 | 1,518,630 | ||||||||||||
| Participation Agreement | 792,154 | 0 | 0 | 792,154 | ||||||||||||
| Non-Convertible Promissory Note | 3,790,474 | 0 | 0 | 3,790,474 | ||||||||||||
| Publicly Traded Portfolio Companies: | ||||||||||||||||
| Common Stock | $ | 8,459,332 | $ | 8,459,332 | $ | 0 | $ | 0 | ||||||||
| Total Investments | $ | 94,383,536 | $ | 8,459,332 | $ | 0 | $ | 85,924,204 | ||||||||
| Liabilities: | ||||||||||||||||
| Written Call Options | $ | 127,500 | $ | 127,500 | $ | 0 | $ | 0 | ||||||||
| Total Liabilities | $ | 127,500 | $ | 127,500 | $ | 0 | $ | 0 | ||||||||
| 42 |
Significant Unobservable Inputs
The table below presents the valuation technique and quantitative information about the significant unobservable inputs utilized by the Company in the fair value measurements of Level 3 assets. Unobservable inputs are those inputs for which little or no market data exists and, therefore, require an entity to develop its own assumptions.
| Fair Value at September 30, 2013 |
Valuation Techniques(s) |
Unobservable Input |
Range (Weighted Average(a)) |
|||||||
| Preferred Stock | $ | 70,543,092 | Probability Weighted Discounted Cash Flow Income Approach Market Approach |
Probability of Achieving Milestones Private Offering Price Non-Performance Risk Probability of Exit Outcomes |
0% - 100% (b) $0.14 - $3.91 ($1.23) 0% - 100% (1%) 0% - 100% (50%) |
|||||
| Bridge Notes | 4,778,681 | Market Approach | Private Offering Price Non-Performance Risk |
$1.00 ($1.00) 0% (0%) |
||||||
| Common Stock | 108,667 | Market Approach | Private Offering Price Non-Performance Risk |
$9.99 - $47.51 ($11.06) 0% (0%) |
||||||
| Warrants | 1,017,118 | Black-Sholes-Merton Model | Stock Price Volatility Expected Term |
$0.16 - $2.45 ($1.01) 27.6% - 107% (103%) 0.90 - 9.45 Years (3.7) |
||||||
| Rights to Milestone Payments | 3,375,388 | Probability Weighted Discounted Cash Flow | Probability of Achieving Independent Milestones Probability of Achieving Dependent Milestones |
0% - 75% (b) 0% - 28.125% (b) |
||||||
| Participation Agreements(c) | 792,154 | Income Approach | Warrant Adjusted Effective Yield Effective Yield Non-Performance Risk Participation Payment Risk Stock Price Volatility Expected Term |
21.5% (21.5%) 21.5% (21.5%) 0% (0%) 0% (0%) $0.09 - $0.50 ($0.34) 107% (107%) 3.97 - 8.5 Years (5.85) |
||||||
| Senior Secured Debt | 1,518,630 | Income Approach | Effective Yield Non-Performance Risk |
15.8% - 22.8% (19%) 0% (0%) |
||||||
| Non-Convertible Promissory Note | 3,790,474 | Income Approach | Probability of Exit Outcomes Private Offering Price Non-Performance Risk |
0% - 100% (50%) $3.00 ($3.00) 25% (25%) |
||||||
| Total |
$ | 85,924,204 | ||||||||
(a) Weighted average based on fair value at September 30, 2013.
(b) Weighted average has not been disclosed owing to the wide range of possible values.
(c) In connection with our investments in participation agreements in GEO Semiconductor, Inc., and OHSO Clean, Inc., we received warrants to purchase stock. See "Warrants" for a discussion of the valuation methodology used.
Valuation Methodologies and Inputs for Level 3 Assets
The following sections describe the valuation techniques and significant unobservable inputs used to measure Level 3 assets.
| 43 |
Preferred Stock, Bridge Notes and Common Stock
Preferred stock, bridge notes and common stock are valued by either a market or income approach using internal models with inputs, most of which are not market observable. Common inputs for valuing Level 3 preferred stock, bridge note and private common stock investments include: prices from recently executed private transactions in a company’s securities or unconditional firm offers, revenue multiples of comparable publicly traded companies, discounts for lack of marketability, rights and preferences of the class of securities we own as compared with other classes of securities the portfolio company has issued, particularly related to potential liquidity scenarios of an IPO or an acquisition transaction, and management’s best estimate of risk attributable to non-performance risk. Certain securities are valued using the present value of future cash flows. We define non-performance risk as the risk that the price per share (or implied valuation of a portfolio company) or the effective yield of a debt security of a portfolio company, as applicable, does not appropriately represent the risk that a portfolio company with negative cash flow will be: (a) unable to raise capital, will need to be shut down and will not return our invested capital; or (b) able to raise capital, but at a valuation significantly lower than the implied post-money valuation of the last round of financing. We assess non-performance risk for each private portfolio company quarterly. Our assessment of non-performance risk typically includes an evaluation of the financial condition and operating results of the company, the company's progress towards milestones, and the long-term potential of the business and technology of the company and how this potential may or may not affect the value of the shares owned by us. An increase to the non-performance risk or a decrease in the private offering price of a future round of financing from that of the most recent round would result in a lower fair value measurement and/or a change in the distribution of value among the classes of securities we own.
Bridge notes commonly contain terms that provide for the conversion of the full amount of principal, and sometimes interest, into shares of preferred stock at a defined price per share and/or the price per share of the next round of financing. The use of a discount for non-performance risk in the valuation of bridge notes would indicate the potential for conversion of only a portion of the principal, plus interest when applicable, into shares of preferred stock or the potential that a conversion event will not occur and that the likely outcome of a liquidation of assets would result in payment of less than the remaining principal outstanding of the note. An increase in non-performance risk would result in a lower fair value measurement.
Warrants
We use the Black-Scholes-Merton option-pricing model to determine the fair value of warrants held in our portfolio. Option pricing models, including the Black-Scholes-Merton model, require the use of subjective input assumptions, including expected volatility, expected life, expected dividend rate, and expected risk-free rate of return. In the Black-Scholes-Merton model, variations in the expected volatility or expected term assumptions have a significant impact on fair value. Because certain securities underlying the warrants in our portfolio are not publicly traded, many of the required input assumptions are more difficult to estimate than they would be if a public market for the underlying securities existed.
An input to the Black-Scholes-Merton option-pricing model is the value per share of the type of stock for which the warrant is exercisable as of the date of valuation. This input is derived according to the methodologies discussed in "Preferred Stock, Bridge Notes and Common Stock."
| 44 |
Rights to Milestone Payments
Rights to milestone payments are valued using a probability-weighted discounted cash flow model. As part of Amgen Inc.’s acquisition of our former portfolio company, BioVex Group, Inc., we are entitled to potential future milestone payments based upon the achievement of certain regulatory and sales milestones. We are also entitled to future milestone payments from Laird Technologies Inc.'s acquisition of our former portfolio company, Nextreme Thermal Solutions, Inc. We assign probabilities to the achievements of the various milestones. Milestones identified as independent milestones can be achieved irrespective of the achievement of other contractual milestones. Dependent milestones are those that can only be achieved after another, or series of other, milestones are achieved. The interest rates used in these models are observable inputs from sources such as the Federal Reserve published interest rates.
Participation Agreements and Senior Secured Debt
We invest in venture debt investments through participation agreements and senior secured debt. We value these securities using an income approach. The income approach uses valuation techniques to convert future amounts (for example, cash flows or earnings) to a single present value amount (discounted). The measurement is based on the value indicated by current market expectations about those future amounts. Common inputs for valuing Level 3 debt investments include: the effective yield of the debt investment or, in the case where we have received warrant coverage, the warrant-adjusted effective yield of the security, adjustments for changes in the yields of comparable publicly traded high-yield debt funds and risk-free interest rates and an assessment of non-performance risk. For those debt investments made through participation agreements, we include discounts for the risk of breach of the participation agreements. For venture debt investments, an increase in yields would result in a lower fair value measurement. Furthermore, yields would decrease, and value would increase, if the company is exceeding targets and risk has been substantially reduced from the level of risk that existed at the time of investment. Yields would increase, and values would decrease, if the company is failing to meet its targets and risk has been increased from the level of risk that existed at the time of investment.
Non-Convertible Promissory Note
We have one non-convertible promissory note, which we value using an income approach that uses a valuation technique to convert future amounts (for example, cash flows or earnings) to a single present value amount (discounted). This security has a liquidation preference payable upon a sale of the company equal to three times the principal of the loan. While the loan has since been repaid, this liquidation preference remains outstanding as of September 30, 2013. Inputs include the preferred stock price of the portfolio company, an assessment of non-performance risk, the probability of exit outcomes between an IPO and an acquisition and the resulting impact on rights and preferences of the class of securities we own as compared with other classes of securities the portfolio company has issued.
| 45 |
The following chart shows the components of change in the financial assets categorized as Level 3 for the three months ended September 30, 2013.
| Beginning Balance 7/1/2013 |
Total Realized Gains (Losses) Included in Changes in Net Assets |
Transfers | Total Unrealized (Depreciation) Appreciation Included in Changes in Net Assets |
Investments
in Portfolio Companies, Interest on Bridge Notes, and Amortization of Loan Fees, Net |
Disposals | Ending Balance 9/30/2013 |
Amount of Total (Depreciation) Appreciation for the Period Included in Changes in Net Assets Attributable to the Change in Unrealized Gains or Losses Relating to Assets Still Held at the Reporting Date |
|||||||||||||||||||||||||
| Preferred Stock | $ | 81,963,148 | $ | 10,006,915 | $ | 901,337 | 1 | $ | (11,634,341 | ) | $ | 3,312,948 | $ | (14,006,915 | ) | $ | 70,543,092 | $ | (3,330,657 | ) | ||||||||||||
| Bridge Notes | 6,805,833 | 0 | (901,337 | )1 | (1,757,774 | ) | 631,959 | 0 | 4,778,681 | (1,757,774 | ) | |||||||||||||||||||||
| Common Stock | 108,667 | 0 | 0 | 0 | 0 | 0 | 108,667 | 0 | ||||||||||||||||||||||||
| Warrants | 778,543 | 0 | 0 | 238,575 | 0 | 0 | 1,017,118 | 238,575 | ||||||||||||||||||||||||
| Rights to Milestone Payments | 3,383,720 | 0 | 0 | (8,332 | ) | 0 | 0 | 3,375,388 | (8,332 | ) | ||||||||||||||||||||||
| Participation Agreements | 808,113 | 0 | 0 | 4,790 | 1,331 | (22,080 | ) | 792,154 | 4,790 | |||||||||||||||||||||||
| Senior Secured Debt | 1,445,254 | 0 | 0 | 134,991 | 14,591 | (76,206 | ) | 1,518,630 | 134,991 | |||||||||||||||||||||||
| Non-Convertible Promissory Note | 3,033,338 | 0 | 0 | 757,136 | 0 | 0 | 3,790,474 | 757,136 | ||||||||||||||||||||||||
| Publicly Traded Common Stock | 667,873 | 0 | (667,873 | ) | 0 | 0 | 0 | 0 | 0 | |||||||||||||||||||||||
| Total | $ | 98,994,489 | $ | 10,006,915 | $ | (667,873 | ) | $ | (12,264,955 | ) | $ | 3,960,829 | $ | (14,105,201 | ) | $ | 85,924,204 | $ | (3,961,271 | ) | ||||||||||||
1Transfers among asset classes are owing to conversions at financing events. These do not represent transfers in or out of Level 3.
We elected to use the beginning of period values to recognize transfers in and out of Level 3 investments. For the three months ended September 30, 2013, there were transfers out of Level 3 totaling $667,873. A total of 626,523 shares of Champions Oncology, Inc., transferred from a Level 3 investment to a Level 1 investment owing to the lapse of the restrictions on those shares during the third quarter.
| 46 |
The following chart shows the components of change in the financial assets categorized as Level 3 for the nine months ended September 30, 2013.
| Beginning Balance 1/1/2013 |
Total Realized Gains (Losses) Included in Changes in Net Assets |
Transfers | Total Unrealized (Depreciation) Appreciation Included in Changes in Net Assets |
Investments
in Portfolio Companies, Interest on Bridge Notes, and Amortization of Loan Fees, Net |
Disposals | Ending Balance 9/30/2013 |
Amount of Total (Depreciation) Appreciation for the Period Included in Changes in Net Assets Attributable to the Change in Unrealized Gains or Losses Relating to Assets Still Held at the Reporting Date |
|||||||||||||||||||||||||
| Preferred Stock | $ | 78,615,582 | $ | 10,006,915 | $ | 1,326,785 | 1 | $ | (13,039,695 | ) | $ | 7,640,420 | $ | (14,006,915 | ) | $ | 70,543,092 | $ | (4,736,012 | ) | ||||||||||||
| Bridge Notes | 4,152,634 | 0 | (1,332,140 | )1 | (1,023,688 | ) | 2,981,875 | 0 | 4,778,681 | (1,023,688 | ) | |||||||||||||||||||||
| Common Stock | 108,667 | (4,384,762 | ) | 0 | 4,384,762 | 0 | 0 | 108,667 | 0 | |||||||||||||||||||||||
| Warrants | 586,320 | 0 | 5,355 | 1 | 405,043 | 20,400 | 0 | 1,017,118 | 405,043 | |||||||||||||||||||||||
| Rights to Milestone Payments | 3,400,734 | 0 | 0 | (25,346 | ) | 0 | 0 | 3,375,388 | (25,346 | ) | ||||||||||||||||||||||
| Participation Agreements | 1,138,148 | 90,255 | 0 | (35,557 | ) | 4,555 | (405,247 | ) | 792,154 | 27,146 | ||||||||||||||||||||||
| Subordinated Secured Debt | 120,410 | 15,058 | 0 | (10,836 | ) | 368 | (125,000 | ) | 0 | 0 | ||||||||||||||||||||||
| Senior Secured Debt | 1,075,870 | 0 | 0 | 250,108 | 388,464 | (195,812 | ) | 1,518,630 | 250,108 | |||||||||||||||||||||||
| Non-Convertible Promissory Note | 3,033,338 | 0 | 0 | 757,136 | 0 | 0 | 3,790,474 | 757,136 | ||||||||||||||||||||||||
| Publicly Traded Common Stock | 1,348,227 | 0 | (1,547,827 | ) | 0 | 199,600 | 0 | 0 | 0 | |||||||||||||||||||||||
| Total | $ | 93,579,930 | $ | 5,727,466 | $ | (1,547,827 | ) | $ | (8,338,073 | ) | $ | 11,235,682 | $ | (14,732,974 | ) | $ | 85,924,204 | $ | (4,345,613 | ) | ||||||||||||
1Transfers among asset classes are owing to conversions at financing events. These do not represent transfers in or out of Level 3.
For the nine months ended September 30, 2013, there were transfers out of Level 3 totaling $1,547,827. Our shares of Champions Oncology, Inc., transferred from a Level 3 investment to a Level 1 investment owing to the market for the shares becoming active with increased and sustained trading volume and the lapse of restrictions on 626,523 shares that were previously restricted.
| 47 |
At December 31, 2012, our financial assets were categorized as follows in the fair value hierarchy:
| Fair Value Measurement at Reporting Date Using: | ||||||||||||||||
| Description | December 31, 2012 |
Unadjusted
Quoted Prices in Active Markets for Identical Assets (Level 1) |
Significant
Other Observable Inputs (Level 2) |
Significant Unobservable Inputs (Level 3) |
||||||||||||
| U.S. Government Securities | $ | 13,998,880 | $ | 13,998,880 | $ | 0 | $ | 0 | ||||||||
| Privately Held Portfolio Companies: | ||||||||||||||||
| Preferred Stock | $ | 78,615,582 | $ | 0 | $ | 0 | $ | 78,615,582 | ||||||||
| Bridge Notes | 4,152,634 | 0 | 0 | 4,152,634 | ||||||||||||
| Warrants | 586,320 | 0 | 0 | 586,320 | ||||||||||||
| Rights to Milestone Payments | 3,400,734 | 0 | 0 | 3,400,734 | ||||||||||||
| Common Stock | 108,667 | 0 | 0 | 108,667 | ||||||||||||
| Senior Secured Debt | 1,075,870 | 0 | 0 | 1,075,870 | ||||||||||||
| Participation Agreement | 1,138,148 | 0 | 0 | 1,138,148 | ||||||||||||
| Subordinated Secured Debt | 120,410 | 0 | 0 | 120,410 | ||||||||||||
| Non-Convertible Promissory Note | 3,033,338 | 0 | 0 | 3,033,338 | ||||||||||||
| Publicly Traded Portfolio Companies: | ||||||||||||||||
| Common Stock | $ | 15,770,488 | $ | 14,422,261 | $ | 0 | $ | 1,348,227 | ||||||||
| Total Investments | $ | 122,001,071 | $ | 28,421,141 | $ | 0 | $ | 93,579,930 | ||||||||
| Liabilities: | ||||||||||||||||
| Written Call Options | $ | 42,500 | $ | 37,500 | $ | 5,000 | $ | 0 | ||||||||
| Total | $ | 42,500 | $ | 37,500 | $ | 5,000 | $ | 0 | ||||||||
At December 31, 2012, certain written call option contracts were classified as Level 2 investments because there were no current prices for the options as of that date. These options were valued using a midpoint pricing convention.
| 48 |
The following chart shows the components of change in the financial assets categorized as Level 3 for the twelve months ended December 31, 2012.
| Beginning Balance 1/1/2012 |
Total Realized Gains (Losses) Included in Changes in Net Assets |
Transfers | Total Unrealized (Depreciation) Appreciation Included in Changes in Net Assets |
Investments
in Portfolio Companies, Interest on Bridge Notes, and Amortization of Loan Fees, Net |
Disposals | Ending Balance 12/31/2012 |
Amount of Total (Depreciation) Appreciation for the Period Included in Changes in Net Assets Attributable to the Change in Unrealized Gains or Losses Relating to Assets Still Held at the Reporting Date |
|||||||||||||||||||||||||
| Preferred Stock | $ | 68,833,189 | $ | 0 | $ | 1,091,677 | 1 | $ | (4,903,413 | ) | $ | 13,594,129 | $ | 0 | $ | 78,615,582 | $ | (4,903,413 | ) | |||||||||||||
| Bridge Notes | 4,007,509 | 0 | (2,727,754 | )1 | 1,310,272 | 1,562,607 | 0 | 4,152,634 | 1,310,272 | |||||||||||||||||||||||
| Common Stock | 0 | 0 | 1,633,296 | 1 | (1,524,629 | ) | 0 | 0 | 108,667 | (1,524,629 | ) | |||||||||||||||||||||
| Warrants | 728,787 | 0 | 2,781 | 1 | (396,396 | ) | 251,148 | 0 | 586,320 | (396,396 | ) | |||||||||||||||||||||
| Rights to Milestone Payments | 3,362,791 | 0 | 0 | 37,943 | 0 | 0 | 3,400,734 | 37,943 | ||||||||||||||||||||||||
| Participation Agreements | 560,200 | 0 | 0 | 24,790 | 714,157 | (160,999 | ) | 1,138,148 | 24,790 | |||||||||||||||||||||||
| Subordinated Secured Debt | 121,880 | 0 | 0 | (1,103 | ) | (367 | ) | 0 | 120,410 | (1,103 | ) | |||||||||||||||||||||
| Senior Secured Debt | 942,695 | 0 | 0 | (13,663 | ) | 609,267 | (462,429 | ) | 1,075,870 | (13,663 | ) | |||||||||||||||||||||
| Non-Convertible Promissory Note | 3,033,338 | 0 | 0 | 0 | 0 | 0 | 3,033,338 | 0 | ||||||||||||||||||||||||
| Publicly Traded Common Stock | 1,973,334 | 0 | 0 | (625,107 | ) | 0 | 0 | 1,348,227 | (625,107 | ) | ||||||||||||||||||||||
|
Total |
$ | 83,563,723 | $ | 0 | $ | 0 | $ | (6,091,306 | ) | $ | 16,730,941 | $ | (623,428 | ) | $ | 93,579,930 | $ | (6,091,306 | ) | |||||||||||||
1Transfers among asset classes are owing to conversions at financing events. These do not represent transfers in or out of Level 3.
For the year ended December 31, 2012, there were no transfers out of Level 3.
| 49 |
The following table shows the components of change in the financial assets categorized as Level 3 for the three months ended September 30, 2012.
|
Beginning Balance 7/1/2012 |
Total Realized Gains (Losses) Included in Changes in Net Assets |
Transfers |
Total Unrealized Appreciation (Depreciation) Included in Changes in Net Assets |
Investments in Portfolio Companies, Interest on Bridge Notes, and Amortization of Loan Fees, Net |
Disposals |
Ending Balance 9/30/2012 |
Amount of Total Appreciation (Depreciation) for the Period Included in Changes in Net Assets Attributable to the Change in Unrealized Gains or Losses Relating to Assets Still Held at the Reporting Date |
|||||||||||||||||||||||||
| Preferred Stock | $ | 79,123,640 | $ | 0 | $ | 0 | $ | 2,108,893 | $ | 3,039,921 | $ | 0 | $ | 84,272,454 | $ | 2,108,893 | ||||||||||||||||
| Bridge Notes | 3,474,341 | 0 | (1,633,296 | ) | 1,542,398 | 678,331 | 0 | 4,061,774 | 1,542,398 | |||||||||||||||||||||||
| Common Stock | 0 | 0 | 1,633,296 | (1,458,756 | ) | 0 | 0 | 174,540 | (1,458,756 | ) | ||||||||||||||||||||||
| Warrants | 701,310 | 0 | 0 | (216,765 | ) | 131,538 | 0 | 616,083 | (216,765 | ) | ||||||||||||||||||||||
| Rights to Milestone Payments | 3,386,224 | 0 | 0 | 14,264 | 0 | 0 | 3,400,488 | 14,264 | ||||||||||||||||||||||||
| Participation Agreements | 1,214,935 | 0 | 0 | 37,027 | (222 | ) | (53,130 | ) | 1,198,610 | 37,027 | ||||||||||||||||||||||
| Subordinated Secured Debt | 119,760 | 0 | 0 | 4,703 | (1,043 | ) | 0 | 123,420 | 4,703 | |||||||||||||||||||||||
| Senior Secured Debt | 843,180 | 0 | 0 | (3,562 | ) | 13,036 | (74,172 | ) | 778,482 | (3,562 | ) | |||||||||||||||||||||
| Non-Convertible Promissory Note | 3,033,338 | 0 | 0 | 0 | 0 | 0 | 3,033,338 | 0 | ||||||||||||||||||||||||
| OTC Traded Common Stock | 1,973,334 | 0 | 0 | (658,667 | ) | 0 | 0 | 1,314,667 | (658,667 | ) | ||||||||||||||||||||||
Total |
$ | 93,870,062 | $ | 0 | $ | 0 | $ | 1,369,535 | $ | 3,861,561 | $ | (127,302 | ) | $ | 98,973,856 | $ | 1,369,535 | |||||||||||||||
There were no transfers in or out of Level 3 during the three months ended September 30, 2012.
| 50 |
The following table shows the components of change in the financial assets categorized as Level 3 for the nine months ended September 30, 2012.
|
Beginning Balance 1/1/2012 |
Total Realized Gains (Losses) Included in Changes in Net Assets |
Transfers |
Total Unrealized Appreciation (Depreciation) Included in Changes in Net Assets |
Investments in Portfolio Companies, Interest on Bridge Notes, and Amortization of Loan Fees, Net |
Disposals |
Ending Balance 9/30/2012 |
Amount of Total Appreciation (Depreciation) for the Period Included in Changes in Net Assets Attributable to the Change in Unrealized Gains or Losses Relating to Assets Still Held at the Reporting Date |
|||||||||||||||||||||||||
| Preferred Stock | $ | 68,833,189 | $ | 0 | $ | 905,333 | $ | 6,768,873 | $ | 7,765,059 | $ | 0 | $ | 84,272,454 | $ | 6,768,873 | ||||||||||||||||
| Bridge Notes | 4,007,509 | 0 | (2,538,629 | ) | 1,290,647 | 1,302,247 | 0 | 4,061,774 | 1,290,647 | |||||||||||||||||||||||
| Common Stock | 0 | 0 | 1,633,296 | (1,458,756 | ) | 0 | 0 | 174,540 | (1,458,756 | ) | ||||||||||||||||||||||
| Warrants | 728,787 | 0 | 0 | (328,449 | ) | 215,745 | 0 | 616,083 | (328,449 | ) | ||||||||||||||||||||||
| Rights to Milestone Payments | 3,362,791 | 0 | 0 | 37,697 | 0 | 0 | 3,400,488 | 37,697 | ||||||||||||||||||||||||
| Participation Agreements | 560,200 | 0 | 0 | 39,797 | 713,842 | (115,229 | ) | 1,198,610 | 39,797 | |||||||||||||||||||||||
| Subordinated Secured Debt | 121,880 | 0 | 0 | 2,895 | (1,355 | ) | 0 | 123,420 | 2,895 | |||||||||||||||||||||||
| Senior Secured Debt | 942,695 | 0 | 0 | 17,248 | 34,574 | (216,035 | ) | 778,482 | 17,248 | |||||||||||||||||||||||
| Non-Convertible Promissory Note | 3,033,338 | 0 | 0 | 0 | 0 | 0 | 3,033,338 | 0 | ||||||||||||||||||||||||
| OTC Traded Common Stock | 1,973,334 | 0 | 0 | (658,667 | ) | 0 | 0 | 1,314,667 | (658,667 | ) | ||||||||||||||||||||||
Total |
$ | 83,563,723 | $ | 0 | $ | 0 | $ | 5,711,285 | $ | 10,030,112 | $ | (331,264 | ) | $ | 98,973,856 | $ | 5,711,285 | |||||||||||||||
There were no transfers in or out of Level 3 during the nine months ended September 30, 2012.
NOTE 7. DERIVATIVES
The Company has written covered call options on its holdings of one of its publicly traded portfolio companies in exchange for the receipt of a premium. The option provides the holder the right, but not the obligation, to purchase the shares on which the option is held at a specified price over a specified future period. The call options were sold at a strike price above the market price on the date of the sale allowing the Company to receive potential appreciation in addition to the premium.
| 51 |
Transactions in written call options during the nine months ended September 30, 2013, were as follows:
| Number of Contracts |
Premium | |||||||
| Call options outstanding at December 31, 2012 | 2,000 | $ | 50,000 | |||||
| Call options written | 17,821 | 1,079,239 | ||||||
| Call options expired | (1,565 | ) | (39,065 | ) | ||||
| Call options terminated in closing transactions | (15,756 | ) | (899,610 | ) | ||||
| Call options outstanding at September 30, 2013 | 2,500 | $ | 190,564 | |||||
We have also purchased put options as a method of limiting the downside risk that the price per share of this company may decrease substantially from current levels. A put option gives its holder the right to sell a specified number of shares of a specific security at a specific price (known as the exercise strike price) by a certain date.
Transactions in put options during the nine months ended September 30, 2013, were as follows:
| Number of Contracts |
Premium | |||||||
| Put options outstanding at December 31, 2012 | 0 | $ | 0 | |||||
| Put options purchased | (2,013 | ) | (65,354 | ) | ||||
| Put options expired | 2,013 | 65,354 | ||||||
| Put options terminated in closing transactions | 0 | 0 | ||||||
| Put options outstanding at September 30, 2013 | 0 | $ | 0 | |||||
At September 30, 2013, and December 31, 2012, we had rights to milestone payments from Amgen, Inc.’s acquisition of our former portfolio company, BioVex. These milestone payments were fair valued at $3,375,388 and $3,400,734, respectively, and are contingent upon certain milestones being achieved in the future. As of September 30, 2013, we also had rights to milestone payments from Laird Technologies, Inc.'s acquisition of our former portfolio company, Nextreme Thermal Solutions, Inc. These milestone payments were fair valued at $0 as of September 30, 2013.
The following tables present the value of derivatives held at September 30, 2013, and the effect of derivatives held during the three months ended September 30, 2013, along with the respective location in the financial statements.
| 52 |
| Assets | Liabilities | |||||||||||||
| Derivatives | Location | Fair Value | Location | Fair Value | ||||||||||
| Equity Contracts | Written call options payable | $ | 127,500 | |||||||||||
| Amgen, Inc. Rights to Milestone Payments from Acquisition of BioVex Group, Inc. | Investments | $ | 3,375,388 | — | — | |||||||||
| Laird Technologies, Inc. Rights to Milestone Payments from Acquisition of Nextreme Thermal Solutions, Inc. | Investments | $ | 0 | — | — | |||||||||
Statement of Operations
| Derivatives | Location |
Realized (Loss)/Gain |
Change in unrealized Appreciation/ (Depreciation) |
|||||||
| Equity Contracts | Net Realized and Unrealized (Loss) Gain | $ | (156,922 | ) | $ | 55,564 | ||||
| Amgen, Inc. Rights to Milestone Payments from Acquisition of BioVex Group, Inc. |
Net Realized and Unrealized (Loss) Gain | $ | 0 | $ | (25,346 | ) | ||||
| Laird Technologies, Inc. Rights to Milestone Payments from Acquisition of Nextreme Thermal Solutions, Inc. |
Net Realized and Unrealized (Loss) Gain | $ | 0 | $ | 0 | |||||
NOTE 8. EMPLOYEE BENEFITS
We administer a plan to provide medical and dental insurance for retirees and their spouses who, at the time of their retirement, have 10 years of service with us and have attained 50 years of age or have attained 45 years of age and have 15 years of service with us. On March 7, 2013, the Board of Directors amended this Medical Benefit Retirement Plan. The amendment limits the medical benefit to $10,000 per year for a period of ten years. The amendment does not affect benefits accrued by former employees or one current employee who is grandfathered under the former terms of the plan.
Our accumulated postretirement benefit obligation was remeasured as of the plan amendment date, which resulted in a $1,101,338 decrease in our liability. A deferred gain of $1,101,338 owing to this amendment was included in "Accumulated other comprehensive income." This amount will be amortized over a service period of 5.27 years. During the three months and nine months ended September 30, 2013, a total of $43,538 and $130,614 was amortized and included as a reduction of "Salaries, benefits and stock-based compensation" on our Consolidated Statements of Operations.
NOTE 9. STOCK-BASED COMPENSATION
The Company maintains the Stock Plan, which provides for the grant of equity-based awards of stock options to our officers and employees and restricted stock to our officers, employees and non-employee directors subject to compliance with the 1940 Act and an exemptive order granted by the SEC permitting us to award shares of restricted stock on April 3, 2012 (the "Exemptive Order").
| 53 |
Under the Stock Plan, a maximum of 20 percent (6,200,120 shares) of our total shares of common stock issued and outstanding as of the 2012 Annual Meeting date, calculated on a fully diluted basis (31,000,601 shares), are available for awards under the Stock Plan. Under the Stock Plan, no more than 50 percent of the shares of stock reserved for the grant of the awards under the Stock Plan (up to an aggregate of 3,100,060 shares) may be restricted stock awards at any time during the term of the Stock Plan. If any shares of restricted stock are awarded, such awards will reduce on a percentage basis the total number of shares of stock for which options may be awarded. No more than 1,000,000 shares of our common stock may be made subject to awards under the Stock Plan to any individual in any year. Although the Stock Plan permits us to continue to grant stock options, our Board of Directors currently plans to discontinue further grants of stock options.
The Stock Plan will expire on June 7, 2022. The expiration of the Stock Plan will not by itself adversely affect the rights of plan participants under awards that are outstanding at the time the Stock Plan expires.
Stock Option Awards
During the nine months ended September 30, 2013, and the year ended December 31, 2012, the Compensation Committee of the Board of Directors of the Company did not grant any stock options. On May 11, 2012, certain executive officers voluntarily cancelled 1,963,745 outstanding stock options for no consideration. Upon cancellation, we recognized $1,365,242 in compensation expense related to these previously granted options. The Compensation Committee currently does not plan to grant new stock options to employees.
| For the three months and nine months ended September 30, 2013, the Company recognized $48,487 and $166,907, respectively, of compensation expense in the Consolidated Statements of Operations related to stock options. As of September 30, 2013, there was approximately $141,242 of unrecognized compensation cost related to unvested stock option awards. This cost is expected to be recognized over a weighted-average period of approximately six months. For the three months and nine months ended September 30, 2012, the Company recognized $41,530 and $1,932,821, respectively, of compensation expense in the Consolidated Statements of Operations related to stock options. |
For the nine months ended September 30, 2013, and September 30, 2012, no options were exercised.
| 54 |
A summary of the changes in outstanding stock options for the nine months ended September 30, 2013, is as follows:
| Weighted | Weighted Average |
Weighted Average Remaining |
Aggregate | |||||||||||||||||
| Average | Grant Date | Contractual | Intrinsic | |||||||||||||||||
| Shares | Exercise Price | Fair Value | Term (Years) | Value | ||||||||||||||||
| Options Outstanding at January 1, 2013 | 1,425,372 | $ | 9.77 | $ | 6.27 | 3.68 | $ | 0 | ||||||||||||
| Granted | 0 | 0 | 0 | 0 | ||||||||||||||||
| Exercised | 0 | 0 | 0 | 0 | ||||||||||||||||
| Forfeited or Expired | 0 | 0 | 0 | 0 | ||||||||||||||||
| Options Outstanding at September 30, 2013 | 1,425,372 | $ | 9.77 | $ | 6.27 | 2.93 | $ | 0 | ||||||||||||
| Options Exercisable at September 30, 2013 | 1,399,927 | $ | 9.76 | $ | 6.25 | 2.94 | $ | 0 | ||||||||||||
| Options Exercisable and Expected to be Exercisable at September 30, 2013 | 1,425,372 | $ | 9.77 | $ | 6.27 | 2.93 | $ | 0 | ||||||||||||
The aggregate intrinsic value in the table above with respect to options outstanding, exercisable and expected to be exercisable, is calculated as the difference between the Company's closing stock price of $3.00 on September 30, 2013, the last trading day of the third quarter of 2013, and the exercise price, multiplied by the number of in-the-money options. This amount represents the total pre-tax intrinsic value that would have been received by the option holders had all options been fully vested and all option holders exercised their awards on September 30, 2013.
Restricted Stock
On June 11, 2012, the Committee granted the employees a total of 1,780,000 shares of restricted stock. A total of 1,068,000 awards (60 percent) vest when the volume-weighted stock price is at or above pre-determined stock price targets over a 30-day period. These pre-determined stock price targets range from $5.00 per share to $9.00 per share. The remaining 712,000 of these shares (40 percent) have vesting dates ranging from December 31, 2012, through June 30, 2017, based on the named executive officer's continued service to the Company. After this initial employee grant, the Compensation Committee does not plan to grant additional restricted stock to existing employees until at least June 11, 2015. Pursuant to the Exemptive Order, non-employee directors receive up to 2,000 shares of restricted stock annually. On June 7, 2012, the non-employee directors received a grant of 14,000 shares of restricted stock. On May 2, 2013, an additional 12,000 shares of restricted stock were granted to the non-employee directors.
For the three months and nine months ended September 30, 2013, we recognized $261,291 and $773,072, respectively, of compensation expense related to restricted stock awards. For the three months and nine months ended September 30, 2012, we recognized $430,774 and $524,602, respectively, of compensation expense related to restricted stock awards. As of September 30, 2013, there was unrecognized compensation cost of $3,464,826 related to restricted stock awards. This cost is expected to be recognized over a weighted average period of approximately 1.9 years.
| 55 |
Non-vested restricted stock awards as of September 30, 2013, and changes during the nine months ended September 30, 2013, were as follows:
| Shares |
Weighted-Average Grant Date Fair Value Per Share |
|||||||
| Outstanding at January 1, 2013 | 1,616,000 | $ | 2.82 | |||||
| Granted | 12,000 | 3.15 | ||||||
| Vested based on service | (42,375 | ) | 3.40 | |||||
| Shares withheld related to net share settlement of restricted stock |
(20,367 | ) | 3.38 | |||||
| Forfeited | (2,000 | ) | 3.55 | |||||
| Outstanding at September 30, 2013 | 1,563,258 | $ | 2.80 | |||||
Under net settlement procedures currently applicable to our outstanding restricted stock awards for current employees, upon each settlement date, restricted stock awards are withheld to cover the required withholding tax, which is based on the value of the restricted stock award on the settlement date as determined by the closing price of our common stock on the vesting date. The remaining amounts are delivered to the recipient as shares of our common stock. On June 30, 2013, 58,740 restricted stock awards were net settled by withholding 20,367 shares, which represented the employees' minimum statutory obligation for each such employee's applicable income and other employment taxes and remitted cash totaling of $61,917 to the appropriate tax authorities. The amount remitted to the tax authorities for the employees' tax obligation was reflected as a financing activity within our Consolidated Statements of Cash Flows. The shares withheld by us as a result of the net settlement of restricted stock awards are not considered issued and outstanding, thereby reducing our shares outstanding used to calculate net asset value per share.
NOTE 10. INCOME TAXES
We have elected to be treated as a RIC under the Code and operate in a manner so as to qualify for the tax treatment applicable to RICs.
In order to qualify as a RIC, we must, in general, (1) annually, derive at least 90 percent of our gross income from dividends, interest, gains from the sale of securities and similar sources; (2) quarterly, meet certain investment diversification requirements; and (3) annually, distribute at least 90 percent of our investment company taxable income as a dividend. We may either distribute or retain our net capital gain from investments, but any net capital gain not distributed will be subject to corporate income tax and the excise tax described below to the extent not offset by the capital loss carryforward. We have historically stated our intent to retain and designate any net capital gain as "designated undistributed capital gains" or "deemed dividends" under the rules of the Code. We currently intend to consider designating net capital gains for distribution as cash dividends, deemed dividends or some combination thereof. We will be subject to a four percent excise tax to the extent we fail to distribute at least 98 percent of our annual net ordinary income and 98.2 percent of our capital gain net income and would be subject to income tax to the extent we fail to distribute 100 percent of our investment company taxable income. As of January 1, 2013, we had capital loss carryforwards of $20,146,763, which we intend to use to offset current year capital gains.
Because of the specialized nature of our investment portfolio, we generally can satisfy the diversification requirements under the Code if we receive a certification from the SEC pursuant to Section 851(e) of the Code that we are "principally engaged in the furnishing of capital to other corporations which are principally engaged in the development or exploitation of inventions, technological improvements, new processes, or products not previously generally available."
| 56 |
We have received SEC certification since 1999, including for 2012, pursuant to Section 851(e) of the Code. There can be no assurance that we will qualify for or receive certification for 2013 or subsequent years (to the extent we need additional certification) or that we will actually qualify for Subchapter M treatment in subsequent years. In addition, under certain circumstances, even if we qualified for Subchapter M treatment in a given year, we might take action in a subsequent year to ensure that we would be taxed in that subsequent year as a C Corporation, rather than as a RIC. Because Subchapter M does not permit deduction of operating expenses against net capital gain, it is not clear that the Company and its shareholders have paid less in taxes since 1999 than they would have paid had the Company remained a C Corporation.
For the three months ended September 30, 2013, and 2012, we paid $3,343 and $7,161, respectively, in federal, state and local taxes. For the nine months ended September 30, 2013, and 2012, we paid $25,514 and $15,236, respectively, in federal, state and local taxes. At September 30, 2013, and 2012, we had $0 accrued for federal, state and local taxes payable by the Company.
We pay federal, state and local taxes primarily related to sublease income generated by Ventures, which is taxed as a C Corporation. For the three months ended September 30, 2013, and 2012, our income tax expense for Ventures was $3,343 and $7,161, respectively. For the nine months ended September 30, 2013, and 2012, our income tax expense for Ventures was $24,584 and $14,331, respectively.
NOTE 11. CHANGE IN NET ASSETS PER SHARE
The following table sets forth the computation of basic and diluted per share net increases (decreases) in net assets resulting from operations for the three months and nine months ended September 30, 2013, and September 30, 2012.
| For the Three Months Ended September 30 |
For the Nine Months Ended September 30 |
|||||||||||||||
| 2013 | 2012 | 2013 | 2012 | |||||||||||||
| Numerator for (decrease) increase in net assets per share | $ | (2,096,162 | ) | $ | (3,669,717 | ) | $ | (51,593 | ) | $ | 4,547 | |||||
| Denominator for basic weighted average shares | 31,159,256 | 31,000,601 | 31,131,654 | 31,000,601 | ||||||||||||
| Basic net (decrease) increase in net assets per share resulting from operations | $ | (0.07 | ) | $ | (0.12 | ) | $ | 0.00 | $ | 0.00 | ||||||
| Denominator for diluted weighted average shares | 31,159,256 | 31,000,601 | 31,131,654 | 31,000,681 | ||||||||||||
| Diluted net (decrease) increase in net assets per share resulting from operations1 | $ | (0.07 | ) | $ | (0.12 | ) | $ | 0.00 | $ | 0.00 | ||||||
| Anti-dilutive shares by type: | ||||||||||||||||
| Stock Options | 1,425,372 | 1,425,372 | 1,425,372 | 1,425,292 | ||||||||||||
| Restricted Stock | 495,258 | 726,000 | 489,920 | 295,392 | ||||||||||||
| Total anti-dilutive shares | 1,920,630 | 2,151,372 | 1,915,292 | 1,720,684 | ||||||||||||
1A total of 1,068,000 performance-based shares of restricted stock were outstanding during the three months and nine months ended September 30, 2013. These shares vest when the volume-weighted stock price is at or above pre-determined stock price targets over a 30-day period. These pre-determined stock price targets range from $5.00 per share to $9.00 per share. These shares were not included in the computation of diluted net asset value per share because as of the end of the reporting period none of the pre-determined stock price targets were met.
| 57 |
For the three months and nine months ended September 30, 2013, and for the three months ended September 30, 2012, the calculation of net increase (decrease) in net assets resulting from operations per diluted share does not include any stock options or restricted stock awards because such awards were anti-dilutive. For the nine months ended September 30, 2012, the calculation of net increase in net assets resulting from operations per diluted share includes 80 stock options because such stock options were dilutive. Stock options and restricted stock awards may be dilutive in future periods in which there are both a net increase in net assets resulting from operations and either significant increases in our average stock price or significant decreases in the amount of unrecognized compensation cost during the period.
NOTE 12. COMMITMENTS AND CONTINGENCIES
On December 28, 2011, the Asahi Kasei Group completed its acquisition of Crystal IS, Inc. If claims are made related to certain intellectual property and patents included in the transaction that exceed the escrow amounts withheld, additional claims could be made seeking funds from the former stockholders, including the Company. This special indemnity provision was capped, in aggregate, across all former stockholders at $5 million through December 28, 2013, when the claim period expires. Our pro rata exposure to potential claims is up to $238,000 through December 31, 2013. As of September 30, 2013, no such claims had been made.
NOTE 13. SUBSEQUENT EVENTS
On October 2, 2013, the Company made a $418,066 follow-on investment in SiOnyx, Inc., a privately held portfolio company.
On October 10, 2013, the Company made a $260,870 follow-on investment in AgBiome LLC, a privately held portfolio company.
On October 11, 2013, the Company made a $937,500 follow-on investment in HzO, Inc., a privately held portfolio company.
On October 30, 2013, the Company made an $80,669 follow-on investment in Laser Light Engines, Inc., a privately held portfolio company.
On October 31, 2013, Ancora Pharmaceuticals Inc. sold a substantial portion of its assets, including the use of its corporate name, to CordenPharma International US, Inc. ("Corden"). The remaining assets formed a new company, SynGlyco, Inc., of which we continue to own shares. SynGlyco may receive future royalty payments based upon certain sales targets and other terms of the Corden acquisition.
On November 1, 2013, the Company made a $150,000 follow-on investment in OpGen, Inc., a privately held portfolio company.
On November 8, 2013, the Company made a $500,000 follow-on investment in ABSMaterials, Inc., a privately held portfolio company.
| 58 |
| HARRIS & HARRIS GROUP, INC. |
| FINANCIAL HIGHLIGHTS |
| (Unaudited) |
| Three Months Ended Sept. 30 | Nine Months Ended Sept. 30 | |||||||||||||||
| 2013 | 2012 | 2013 | 2012 | |||||||||||||
| Per Share Operating Performance | ||||||||||||||||
| Net asset value per share, beginning of period | $ | 4.24 | $ | 4.88 | $ | 4.13 | $ | 4.70 | ||||||||
| Net operating loss* | (0.06 | ) | (0.05 | ) | (0.19 | ) | (0.22 | ) | ||||||||
| Net realized gain on investments* | 0.41 | 0.09 | 0.55 | 0.14 | ||||||||||||
| Net decrease in unrealized appreciation as a result of sales* | (0.38 | ) | (0.12 | ) | (0.44 | ) | (0.14 | ) | ||||||||
| Net increase (decrease) in unrealized appreciation on investments held and written call options*(1) | (0.04 | ) | (0.04 | ) | 0.08 | 0.22 | ||||||||||
| Total from investment operations* | (0.07 | ) | (0.12 | ) | 0.00 | 0.00 | ||||||||||
| Net increase as a result of stock- based compensation expense* | 0.01 | 0.02 | 0.03 | 0.08 | ||||||||||||
| Net decrease as a result of acquisition of vested restricted stock awards related to employee withholding | 0.00 | 0.00 | (0.01 | ) | 0.00 | |||||||||||
| Total increase from capital stock transactions | 0.01 | 0.02 | 0.02 | 0.08 | ||||||||||||
| Net increase as a result of other comprehensive income | 0.00 | 0.00 | 0.03 | 0.00 | ||||||||||||
| Net (decrease) increase in net asset value | (0.06 | ) | (0.10 | ) | 0.05 | 0.08 | ||||||||||
| Net asset value per share, end of period | $ | 4.18 | $ | 4.78 | $ | 4.18 | $ | 4.78 | ||||||||
| Stock price per share, end of period | $ | 3.00 | $ | 3.79 | $ | 3.00 | $ | 3.79 | ||||||||
| Total return based on stock price | (1.32 | )% | (0.26 | )% | (9.09 | )% | 9.54 | % | ||||||||
| Supplemental Data: | ||||||||||||||||
| Net assets, end of period | $ | 130,233,967 | $ | 148,160,377 | $ | 130,233,967 | $ | 148,160,377 | ||||||||
| Ratio of expenses to average net assets | 1.5 | % | 1.2 | % | 4.9 | % | 4.9 | % | ||||||||
| Ratio of net operating (loss) to average net assets | (1.4 | )% | (1.0 | )% | (4.5 | )% | (4.6 | )% | ||||||||
| Average debt outstanding | $ | 0.00 | $ | 2,000,000 | $ | 0.00 | $ | 1,820,438 | ||||||||
| Average debt per share | $ | 0.00 | $ | 0.06 | $ | 0.00 | $ | 0.06 | ||||||||
| Number of shares outstanding, end of period | 31,159,256 | 31,000,601 | 31,159,256 | 31,000,601 | ||||||||||||
* Based on Average Shares Outstanding
(1) Net unrealized gains (losses) includes rounding adjustments to reconcile change in net asset value per share. See "Item 2. Management's Discussion and Analysis of Financial Condition and Results of Operations" for a description of unrealized losses on investments.
The accompanying notes are an integral part of this schedule.
| 59 |
| Item 2. | Management's Discussion and Analysis of Financial Condition and Results of Operations |
The information contained in this section should be read in conjunction with the Company's unaudited September 30, 2013, Consolidated Financial Statements and the Company's audited 2012 Consolidated Financial Statements and notes thereto.
Background
We incorporated under the laws of the state of New York in August 1981. In 1983, we completed an initial public offering ("IPO"). In 1984, we divested all of our assets except Otisville BioTech, Inc., and became a financial services company with the investment in Otisville as the initial focus of our business activity.
In 1992, we registered as an investment company under the 1940 Act, commencing operations as a closed-end, non-diversified investment company. In 1995, we elected to become a BDC subject to the provisions of Sections 55 through 65 of the 1940 Act.
Overview
We believe we provide five core benefits to our shareholders. First, we are an established firm with a positive track record of investing in venture capital-backed companies as further discussed in "Investments and Current Investment Pace" on page 72. Second, we provide shareholders with access to disruptive science-enabled companies, particularly ones that are enabled by nanotechnology and BIOLOGY+, that would otherwise be difficult to access or inaccessible for most current and potential shareholders. Third, we have an existing portfolio of companies at varying stages of maturity that provide for a potential pipeline of investment returns over time. Fourth, we are able to invest opportunistically in a range of types of securities to take advantage of market inefficiencies. Fifth, we provide access to venture capital investments in a vehicle that, unlike private venture capital firms, has permanent capital, is transparent and is liquid.
We help build transformative companies from disruptive science. We make venture capital investments in companies enabled by multidisciplinary, disruptive science, particularly those enabled by nanotechnology and microsystems. We define venture capital investments as the money and resources made available to privately held and publicly traded small businesses with exceptional growth potential. Nanotechnology and microsystems are technologies that allow for the characterization, design, manipulation and manufacture of materials and systems on the molecular and micro levels, respectively. Many of our current and historical investments fall within the category of BIOLOGY+. BIOLOGY+ refers to investments in interdisciplinary life science companies where biology innovation is intersecting with innovations in areas such as electronics, physics, materials science, chemistry, information technology, engineering and mathematics. Currently, our BIOLOGY+ investments are a subset of our nanotechnology and microsystems investments. We discuss BIOLOGY+ in detail beginning on page 67.
| 60 |
Our business model is simple. We help build transformative companies by being the first investors, building value in these companies over a multi-year period, realizing returns from our investments through acquisitions or IPOs, and reinvesting some of the returns on our investments into new portfolio companies that can drive future growth. We believe our evergreen structure is a competitive advantage over traditional, time-limited venture capital private partnerships as most of those entities do not have permanent capital to invest in portfolio companies. We believe we are a unique company with the combination of our focus on investing and being actively involved in the formation and building of early-stage companies founded on disruptive science as a liquid, publicly traded company.
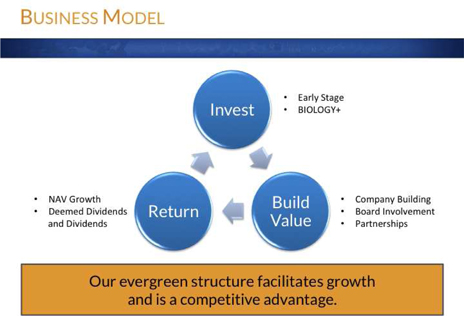
We currently have 26 equity-focused companies in our portfolio that have yet to complete liquidity events (e.g., IPOs or merger and acquisition ("M&A") transactions). This does not include 1) our publicly traded shares of Solazyme; 2) the recently acquired portfolio company Xradia; 3) the three venture debt deals, GEO Semiconductor Inc., Nano Terra, Inc., and OHSO Clean, Inc.; and 4) our rights to milestone payments from Amgen, Inc. and Laird Technologies, Inc. As of September 30, 2013, we valued our 26 equity-focused companies at $86,614,897. Including the companies referenced above, we valued our total venture capital portfolio at $94,383,536 as of September 30, 2013. At September 30, 2013, from first dollar in, the average and median holding periods for these 26 investments were 5.7 years and 6.3 years, respectively. Historically, as measured from first dollar in to last dollar out, the average and median holding periods for the 69 investments we have exited were 4.3 years and 3.4 years, respectively.
Our execution strategy over the next five years has four parts: 1) Realize returns to increase shareholder value; 2) Invest for growth to increase shareholder value; 3) Partner to more effectively create value; and 4) Return value to our shareholders.
| 61 |
Realize
"Realize" refers to realizing value in our venture capital portfolio. Since our investment in Otisville in 1983 through September 30, 2013, we have made a total of 96 equity-focused venture capital investments. We have completely exited 69 of these 96 investments and partially exited through the sale of shares and/or the sale of call options covered by shares of one of these 96 investments, recognizing aggregate net realized gains of $86,255,897 on invested capital of $112,428,031. For the securities of the 26 companies in our equity-focused portfolio held at September 30, 2013, we have net unrealized depreciation of $17,378,780 on invested capital of $103,993,677. We have aggregate net realized gains and unrealized depreciation for our 96 equity-focused investments of $68,877,117 on invested capital of $216,421,708.
The amount of net realized gains includes:
| · | $29,018,645 in payments received from the sale of BioVex Group, Inc., to Amgen, Inc., the sale of Innovalight, Inc., to DuPont, the sale of Crystal IS, Inc., to Asahi Kasei Group and the sale of Xradia, Inc., to Carl Zeiss AG. We had invested a total of $15,383,299 in these four portfolio companies; |
| · | $16,031,030 from the sale of shares of Solazyme, Inc., on invested capital of $4,853,458. In addition, we generated $1,441,099 in realized gains on our sale and/or purchase of written call option and put option contracts covered by our shares of Solazyme, Inc.; and |
| · | A realized loss of $4,839,811, including call options, on our investment in NeoPhotonics Corporation on invested capital of $7,299,590. |
The aggregate net realized gains and the cumulative invested capital do not reflect the cost or value of our shares of Solazyme, Inc., that we owned as of September 30, 2013, or the premiums received on open option contracts of $190,564. The aggregate net realized gains also do not include potential escrow payments from the sale of Xradia, Inc., to Carl Zeiss AG or potential milestone payments that could occur as part of the acquisition of BioVex Group, Inc., by Amgen, Inc., or the acquisition of Nextreme Thermal Solutions, Inc., by Laird Technologies, Inc., at points in time in the future as of September 30, 2013. If these amounts were included as of September 30, 2013, our aggregate net realized gains and cumulative invested capital would be $101,043,931 and $113,018,770, respectively.
Recent and Potential Liquidity Events From Our Portfolio as of September 30, 2013
During the third quarter of 2013, we had one liquidity event in our portfolio. On July 12, 2013, Carl Zeiss AG completed its acquisition of Xradia, Inc., and on July 19, 2013, we received our initial payment of $12,838,244. As of September 30, 2013, additional proceeds of $2,374,827 were held in escrow to be released in whole, or in part, in January and July of 2014. As of September 30, 2013, we valued the funds held in escrow from the sale of Xradia at $1,168,671. If the full amount held in escrow is released, we would receive $2,374,827, but there can be no assurance as to how much of this amount we will ultimately realize.
As of September 30, 2013, we valued potential milestone payments from the sale of BioVex Group, Inc., at $3,375,388. If all the remaining milestone payments were to be paid by Amgen, Inc., we would receive $9,526,393. We have not received any milestone payments as of September 30, 2013, and there can be no assurance as to the timing and how much of this amount we will ultimately realize in the future, if any. As of September 30, 2013, we valued potential milestone payments from the sale of Nextreme Thermal Solutions, Inc., to Laird Technologies, Inc., at $0.
| 62 |
Our companies often plan for and/or begin the process of pursuing potential sales and/or IPOs of those companies by hiring bankers and/or advisors to attempt to pursue such liquidity events. We consider these efforts to be in the ordinary course of business for those companies until the potential and timing of a transaction become tangible through events such as receipt of letters of intent to acquire a company and/or drafting of registration documents to pursue an IPO.
During the third quarter of 2013, two of our portfolio companies received interest from potential acquirers. In the first transaction, Ancora Pharmaceuticals Inc. sold a substantial portion of its assets, including the use of its corporate name, to Corden. The remaining assets formed a new company, SynGlyco, Inc., of which we continue to own shares. SynGlyco may receive future royalty payments based upon certain sales targets and other terms of the Corden acquisition. In the second transaction, one of our portfolio companies and a potential acquirer began drafting definitive documents for a potential acquisition. We currently estimate that the second transaction could close during the fourth quarter of 2013 or the first quarter of 2014; however, there can be no assurance that this company will be able to consummate a transaction within this time frame, if at all.
Strategy for Managing Publicly Traded Positions
We discuss our assessment of the benefits of selling covered call options on our publicly traded portfolio companies in detail in our Annual Report on Form 10-K for the year ended December 31, 2012.
During the nine months ended September 30, 2013, our strategy for managing our publicly traded positions has generated approximately $598,895 in net cash proceeds from premiums on call options sold and put options purchased of Solazyme, Inc. We added approximately $8,177,311 in proceeds, net of commission, to our primary liquidity resulting from options called that were covered by a portion of our shares of Solazyme. We also sold shares in open market transactions for proceeds, net of commission, of $6,800,203. The net increase in our primary liquidity from these transactions was $15,576,409. Through September 30, 2013, we have generated $2,343,729 in net cash premiums on call options sold and put options purchased of Solazyme since the company completed an IPO in May 2011. We have sold a total of 2,054,149 shares of Solazyme since its IPO for net proceeds, after commission, of $20,157,563 or an average sale price of $9.81 per share. Including premiums from call and put options, the average sale price for these shares was $10.95 per share. Our cost basis in Solazyme is $2.36 per share. This increase in primary liquidity is important for our efforts to continue to fund existing and new portfolio companies that could generate future investment returns.
As of September 30, 2013, we had all of our remaining 250,000 shares of Solazyme under the following option contracts:
| No. of Shares | Expiration Date | Strike Price | ||||||
| 50,000 | December 21, 2013 | $ | 12.50 | |||||
| 100,000 | December 21, 2013 | $ | 15.00 | |||||
| 100,000 | March 22, 2014 | $ | 12.50 | |||||
| 63 |
During the nine months ended September 30, 2013, we sold the remaining 50,807 shares of our position in NeoPhotonics Corporation. We no longer own any shares of NeoPhotonics. For the nine months ended September 30, 2013, we received $252,042 in proceeds, net of commission, from the sale of NeoPhotonics shares. We also received proceeds of $24,146 from call option premiums on shares of NeoPhotonics. Since its IPO, the sale of our 450,907 shares of NeoPhotonics generated net proceeds of $2,239,809, or an average sale price, net of commission, of $4.97 per share. Including premiums from call options, the average sale price for these shares was $5.45 per share. Our cost basis in NeoPhotonics was $16.19 per share.
Maturity of Current Equity-Focused Venture Capital Portfolio
There are three main drivers of our potential growth in value over the next five years. First, we have a larger portfolio of more mature companies than we have had historically. Second, we believe the quality of our existing portfolio is stronger than it has been historically. Third, we own a larger percentage of the companies in the existing portfolio than we have owned historically.
Our equity-focused venture capital portfolio is comprised of companies at varying maturities facing different types of risks. We have defined these levels of maturity and sources of risk as: 1) Early Stage/Technology Risk, 2) Mid Stage/Market Risk and 3) Late Stage/Execution Risk. Early-stage companies have a high degree of technical, market and execution risk, which is typical of initial investments by venture capital firms, including us. Mid-stage companies are those that have overcome most of the technical risk associated with their products and are now focused on addressing the market acceptance for their products. Late-stage companies are those that have determined there is a market for their products, and they are now focused on sales execution and scale. Late-stage, life sciences companies are typically generating revenue from the commercial sale of one or more products or, in the case of therapeutic or medical device-focused life sciences companies, are in Phase III Clinical Trials, which are the pivotal trials before a possible FDA approval and commercial launch of a product.
Our current portfolio is comprised of companies at varying stages of maturity in a diverse set of industries within three sectors. As our portfolio companies mature, we seek to invest in new early- and mid-stage companies that may mature into mid- and late-stage companies. This continuous progression creates a pipeline of investment maturities that may lead to future sources of positive contributions to net asset value per share as these companies mature and potentially experience liquidity and exit events. This diversity of industries and our pipeline of investment maturities are demonstrated by the distribution of our current early- and mid-stage portfolio companies that primarily address needs in the sectors shown in the table below.
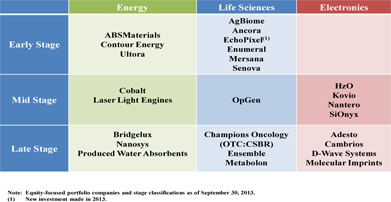
| 64 |
We expect some of our portfolio companies to transition between stages of maturity over time. This transition may be forward if the company is maturing and is successfully executing its business plan or may be backward if the company is not successfully executing its business plan or decides to change its business plan substantially from its original plan. Transitions backward may be accompanied by an increase in non-performance risk, which reduces valuation. We discuss non-performance risk and its implications on value below in the section titled "Valuation of Investments."
During the third quarter of 2013, we transitioned the stage categorization of the following companies:
| · | Produced Water Absorbents, Inc., from an early-stage company to a late-stage company, owing to its acquisition of the U.S. and Malaysia assets of ProSep Inc. |
| · | Cambrios Technologies Corporation from a mid-stage company to a late-stage company. |
Portfolio Company Revenue
We currently have 23 companies in our equity-focused venture capital portfolio as of September 30, 2013, that generate revenues ranging from nominal to significant from commercial sales of products and/or services, from commercial partnerships and/or from government grants.
In aggregate, our 26 equity-focused companies and Solazyme, Inc., generated approximately $241 million in revenue as of the end of 2012, a 26 percent increase from aggregate 2011 revenue of approximately $192 million, a 59 percent increase from aggregate 2010 revenue of $152 million, and a 162 percent increase from aggregate 2009 revenue of $92 million.
Growth in Ownership of Portfolio Companies
The chart below depicts the change in our ownership of our portfolio companies from 2001 through 2013 as our assets have increased. Our investment-weighted average ownership has increased from approximately five percent for initial investments made between 2001 and 2004 to approximately 14 percent for initial investments made between 2009 and 2013. This increasing ownership, which we have noted in previous shareholder communications, gives us more control over these companies to potentially affect outcomes beneficial to the Company. Over the coming five years, as companies where our initial investment was made between 2005 and the present continue to mature and exit, we currently believe our increased levels of ownership have the potential to provide greater returns than our historical investments.
| 65 |
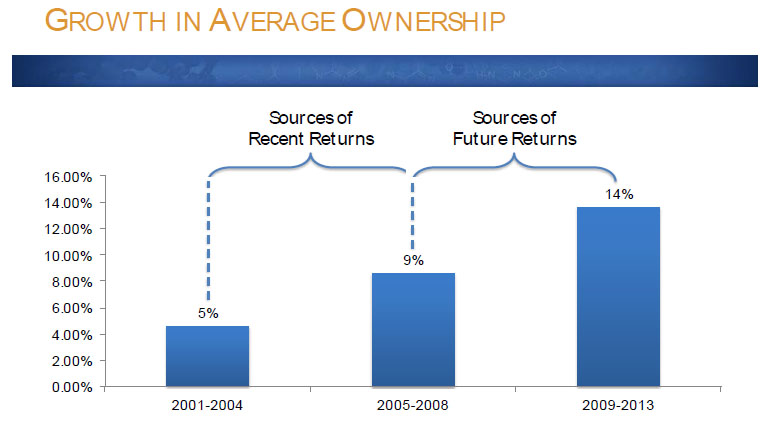
| Notes: Average ownership data includes investment-weighted ownership percentages on a fully diluted basis as of September 30, 2013, for unrealized investments including investments in pending tranches of previously closed financings, as applicable. Many of our current portfolio companies may raise additional capital, and depending on many factors our ownership could increase or decrease in these companies as a result of these financings. The data for 2005-2008 does not include ownership in Ancora Pharmaceuticals Inc. If this investment was included, the investment-weighted average ownership would be 16 percent. |
As important, by studying our portfolio in greater detail, it is evident to us that potential returns from approximately half of the companies in our portfolio could be the real drivers of net asset value growth over the coming years. In previous communications with shareholders, we have discussed how we are managing our portfolio, feeding the "fat hogs" and starving the "lean hogs" to maximize our value at exit. Many of the leaner hogs have been culled through write-downs in valuation and de-emphasized in terms of the time allocation of our team. These steps allow us to focus our time and capital on the companies we believe will be the drivers of our growth. This increases the risk and potential loss of invested capital in these portfolio companies, but it also may increase the potential returns if they are successful. We currently believe companies like D-Wave Systems, Inc., Metabolon, Inc., Adesto Technologies Corporation, SiOnyx, Inc., HzO, Inc., Produced Water Absorbents, Inc., Enumeral Biomedical Corp., Ultora, Inc., AgBiome, LLC, Senova Systems, Inc., and Echopixel, Inc., have the potential to be real drivers of growth in our portfolio in the coming years.
Level of Involvement in Our Portfolio Companies
The 1940 Act requires that BDCs offer to "make available significant managerial assistance" to portfolio companies. We are actively involved with our portfolio companies through membership on boards of directors, as observers to the boards of directors and/or through frequent communication with management. As of September 30, 2013, we held at least one board seat or observer rights on 22 of our 26 equity-focused portfolio companies that have yet to complete a liquidity event or an uplisting to a national exchange (85 percent).
| 66 |
Invest
Investment Objective and Strategy
Our principal investment objective is to achieve long-term capital appreciation by making equity-focused venture capital investments in companies that we believe have exceptional growth potential. Therefore, a significant portion of our current venture capital investment portfolio provides little or no income in the form of dividends or interest. Current income is a secondary investment objective. We seek to reach the point where future growth is financed through reinvestment of our capital gains from our venture capital investments and where current income offsets significant portions of our annual expenses during periods of time between realizations of capital gains on our investments. We also plan to implement a strategy to grow assets under management and generate current income by raising one or more third-party funds to manage. It is possible that we will invest our capital alongside or through these funds in portfolio companies. These funds may be focused on specific sectors, such as life sciences, energy and electronics, that are enabled by scientific breakthroughs, including nanotechnology and BIOLOGY+. It is also possible these funds will invest in companies in each of these sectors that are not directly enabled by nanotechnology. There is no assurance when and if we will be able to raise such fund(s) or, if raised, whether they will be successful.
We have discretion in the investment of our capital to achieve our objectives. Our venture capital investments are made primarily in equity-related securities of companies that can range in stage from pre-revenue to generating positive cash flow. These businesses tend to be thinly capitalized, unproven, small companies that lack management depth, have little or no history of operations and are developing unproven technologies. These businesses may be privately held or publicly traded. We historically have invested in equity securities of these companies that are generally illiquid owing to restrictions on resale and to the lack of an established trading market. We refer to our portfolio of investments in equity and equity-related securities in sections of the Management's Discussion and Analysis of Financial Condition and Results of Operations ("MD&A") as our "equity-focused" portfolio of investments. We have historically, from time to time, taken advantage of opportunities to generate near-term cash flow by investing in non-convertible debt securities of small businesses. These businesses tend to be generating cash or have near-term visibility to reaching positive cash flow. We refer to our portfolio of investments in non-convertible debt in sections of the MD&A as our "venture debt" portfolio of investments.
We are both early-stage and long-term investors. We seek to identify investment opportunities in industries and markets that will be growth opportunities three to seven years from the date of our initial investment. We expect to invest capital in these companies at multiple points in time subsequent to our initial investment. We refer to such investments as "follow-on" investments. Our efforts to identify and predict future growth industries and markets rely on patient and extensive due diligence in innovations developed at universities and corporate and government research laboratories, and the examination of macroeconomic and microeconomic trends and industry dynamics. We believe it is the early identification of and investments in these growth opportunities that will lead to investment returns for our shareholders, growth of our net assets, and capital for us to invest in tomorrow’s growth opportunities.
| 67 |
We believe our ability to bring early-stage financing and strong corporate partnering early in the development process could be perceived as valuable by potential portfolio companies and may be of particular benefit in investment opportunities that become competitive. We also believe that corporate involvement is evolving to become more critical for the success of early-stage companies in the years ahead. We discuss both of these topics in detail on pages 52 and 53, respectively, of the MD&A section of our Annual Report on Form 10-K for the year ended December 31, 2012.
We have always been involved with founding, incubating and building transformative companies from disruptive science. In fact, we have been the first institutional investor or syndicate of first institutional investor in two-thirds of the companies we have invested in since our founding. Our involvement may include hiring management, licensing intellectual property, securing space and raising additional capital. We also provide managerial assistance to late-stage companies looking for potential exit opportunities by leveraging our relationships with the banking and investment community and our knowledge and experience in running a micro-capitalization publicly traded business.
In 2002, we focused our efforts investing in companies that were enabled at the nanoscale. Many of the disruptive scientific breakthroughs that are the basis of the transformative companies we build occur at the nanoscale. Additionally, our interdisciplinary scientific backgrounds led us to identify interesting breakthroughs that were occurring ever more often at the intersection of different scientific disciplines.
Two things have become clear to us over the past five years. First, many of the most interesting scientific breakthroughs are occurring at the intersection of different scientific disciplines, usually with biology as one of these disciplines. Second, companies that intersect with healthcare or the life sciences are yielding increased venture capital returns. In our own portfolio, companies in the life science sector have outperformed portfolio companies in the electronics and energy sectors significantly since 2002. We discuss in detail our assessment of the trends, technologies and interdisciplinary approaches to solving needs within each of these industry sectors on page 43 of the Management's Discussion and Analysis of Financial Condition and Results of Operations section of our Annual Report on Form 10-K for the year ended December 31, 2012.
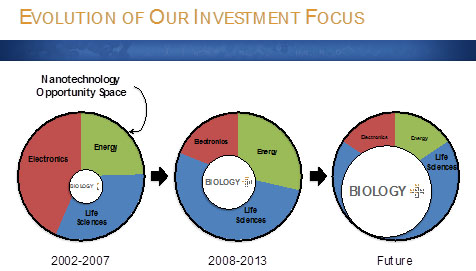
| 68 |
Beginning in 2009, the majority of our investments have been in companies that we define as BIOLOGY+. We define our investment focus of BIOLOGY+ as investments in interdisciplinary life science companies where biology innovation is intersecting with innovations in areas such as electronics, physics, materials science, chemistry, information technology, engineering and mathematics. We focus on this intersection because we believe interdisciplinary innovation will be required in order to address many of the life science challenges of the future.
As the table below demonstrates, we have already invested in companies that have teamed innovations in biology with innovations in engineering, physics, electronics IT, mathematics and material sciences. In the case of Enumeral Biomedical Corp., this combination enables the ability to interrogate cells at the single cell scale in unique ways for the first time. In the case of Molecular Imprints, Inc., the combination enables personal genomics by using a new form of semiconductor lithography to perform genomic sequencing using silicon wafers. This increases the speed and reduces the cost of large-scale sequencing. In the case of D-Wave Systems, Inc., its quantum computer can be used to solve very complex protein folding problems to enable new therapeutic approaches.
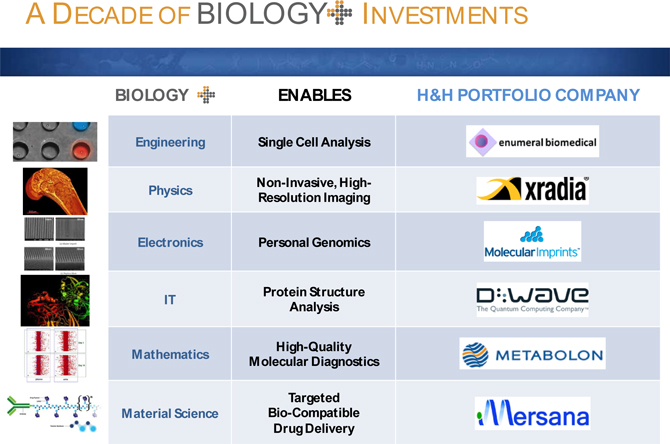
Currently, we plan to focus all our efforts on building new companies enabled by our BIOLOGY+ thesis. We believe areas such as 1) personalized genomics, 2) novel therapeutics for cancer, and 3) 3D non-invasive imaging and diagnostics, as well as applications in agriculture, industrial biotechnology, water, functional foods and personal health will all be influenced by innovations in BIOLOGY+. Our team, with scientific backgrounds in chemistry, biochemical engineering, physics, genetics and material science, is uniquely qualified to identify, diligence and invest in these opportunities.
| 69 |
 |
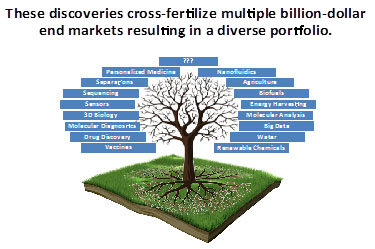 |
Industry Sectors of Investment
We generally classify our investments in one of three industry sectors: Life Sciences, Energy and Electronics. The interdisciplinary nature of science-based inventions enables our portfolio companies to address needs in multiple sectors rather than being confined to addressing needs in one sector. As such, many of our companies can adjust their business foci to address needs in a secondary sector should opportunities in the company’s primary sector decrease in number or magnitude.
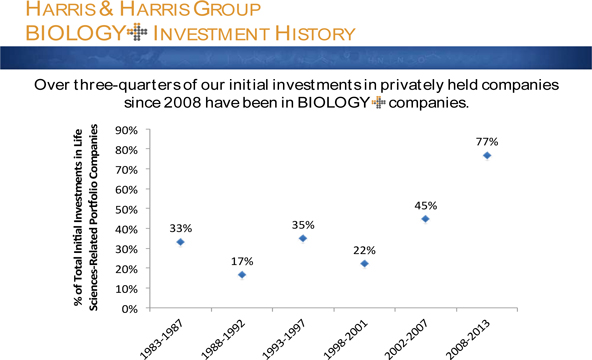
| 70 |
We classify companies in our life sciences portfolio as those that address problems in life sciences-related industries, including biotechnology, agriculture, advanced materials and chemicals, diagnostics, healthcare, bioprocessing, water, industrial biotechnology, food, nutrition and energy. We classify companies that address life science-related problems as a primary or secondary sector as BIOLOGY+. Such investments have been the vast majority of those made by us since 2008. With our focus on investing in BIOLOGY+ companies, we expect that the number of companies addressing life science-related industries as a primary focus will grow, while those that address electronics and energy-related sectors as a primary focus will decline. That said, we expect these companies may address electronics and energy-related sectors as a secondary sector given the interdisciplinary nature of BIOLOGY+ companies.
We classify companies in our energy portfolio as those that seek to improve performance, productivity or efficiency, and to reduce environmental impact, waste, cost, energy consumption or raw materials. Energy is a term used commonly to describe products and processes that solve global problems related to resource constraints. The term, "cleantech," is also used commonly in a similar manner.
We classify companies in our electronics portfolio as those that address problems in electronics-related industries, including semiconductors, telecommunications and data communications, metrology and test and measurement.
Our Sources of Liquid Capital
The sources of liquidity that we use to make our investments are classified as primary and secondary liquidity. As of September 30, 2013, and December 31, 2012, our total primary and secondary liquidity was $44,816,035 and $38,231,691, respectively. We do not include funds available from our credit facility as primary or secondary liquidity. We believe it is important to examine both our primary and secondary liquidity when assessing the strength of our balance sheet and our future investment capabilities.
Primary liquidity is comprised of cash and certain receivables. As of September 30, 2013, we held $13,528,468 in cash and $22,799,975 in a receivable from the sale of U.S. Treasury securities. This receivable was settled for cash on October 1, 2013. As of December 31, 2012, we held $13,998,880 in U.S. government obligations, and we had an additional $8,379,111 in cash.
On January 24, 2013, the Company received payment of its portion of the proceeds held in escrow from DuPont’s acquisition of Innovalight, Inc., totaling $949,469. On April 4, 2013, the Company received payment of its portion of the proceeds held in escrow from Asahi Kasei's acquisition of Crystal IS, Inc., totaling $273,361. On July 19, 2013, the Company received its initial payment from Carl Zeiss' acquisition of Xradia, Inc., totaling $12,838,244. These payments immediately added to our primary liquidity. Additional proceeds of $2,374,827 from Carl Zeiss' acquisition of Xradia are held in escrow to be released in whole, or in part, in January and July of 2014. If and when these amounts held in escrow are released, those funds would add to our primarily liquidity. Payments upon achieving milestones of the BioVex Group, Inc., sale would also add to our primary liquidity in future quarters if these milestones are achieved successfully. The probability-adjusted value of the future milestone payments for the sale of BioVex, as determined at the end of each fiscal quarter, is included as an asset on our Consolidated Statements of Assets and Liabilities and will be included in primary liquidity only if and when payment is received for achievement of the milestones. During the nine months ended September 30, 2013, we sold 1,547,790 shares of our investment in Solazyme, Inc., under written call option contracts and open market sales. We received $15,027,993 in gross proceeds from these transactions, which added to our primary liquidity. During the nine months ended September 30, 2013, we sold the remaining 50,807 shares of our investment in NeoPhotonics Corporation under written call option contracts and open market sales. We received $254,039 in gross proceeds from these transactions, which also added to our primary liquidity.
| 71 |
Our secondary liquidity is comprised of the stock of publicly traded companies. Although these companies are publicly traded, their stock may not trade at high volumes and prices may be volatile, which may restrict our ability to sell our positions at any given time. As of September 30, 2013, our secondary liquidity was $8,459,332. Solazyme, Inc., accounts for $2,696,250 of this amount based on its closing price as of September 30, 2013. If our option contracts are called at their strike prices, we would receive proceeds of $3,375,000. Champions Oncology, Inc., accounts for $5,763,082 of the total amount of secondary liquidity based on its closing price as of September 30, 2013. As of December 31, 2012, our secondary liquidity was $15,770,488. NeoPhotonics and Solazyme accounted for $14,422,261 of this amount based on the closing price of each company as of December 31, 2012. Champions Oncology accounted for $1,348,227 of the total amount of secondary liquidity. All of our public securities were freely tradable as of September 30, 2013. A decision to sell our shares would result in the cash received from the sale of these assets being included in primary liquidity. Until that time, we will continue to include the value of our shares of our publicly traded portfolio companies in secondary liquidity unless the average trading volume of each company reaches sufficient levels for us to monetize our stock in such companies over a short period of time.
Investments and Current Investment Pace
The following is a summary of our initial and follow-on equity-focused investments in nanotechnology companies from January 1, 2009, to September 30, 2013. We consider a "round led" to be a round where we were the new investor or the leader of a group of investors in an investee company. Typically, but not always, the lead investor negotiates the price and terms of the deal with the investee company.
|
Investments in Our Equity-Focused Portfolio of Investments in Privately Held and Publicly Traded Companies |
| 2009 | 2010 | 2011 | 2012 |
Nine
Months Ended September 30, 2013 |
||||||||||||||||
| Total Incremental Investments | $ | 12,334,051 | $ | 9,560,721 | $ | 17,688,903 | $ | 15,141,941 | $ | 10,669,819 | ||||||||||
| No. of New Investments | 2 | 3 | 4 | 2 | 1 | |||||||||||||||
| No. of Follow-On Investment Rounds | 29 | 27 | 31 | 26 | 26 | |||||||||||||||
| No. of Rounds Led | 5 | 5 | 4 | 3 | 6 | |||||||||||||||
| Average Dollar Amount – Initial | $ | 174,812 | $ | 117,069 | $ | 1,339,744 | $ | 1,407,500 | $ | 750,000 | ||||||||||
| Average Dollar Amount – Follow-On | $ | 413,256 | $ | 341,093 | $ | 397,740 | $ | 474,113 | $ | 381,532 | ||||||||||
| 72 |
Partner
As the structure of the public markets has changed over the last decade, the time and dollars required to build transformative companies has increased. Scale and manufacturing expertise is now critical to get to a successful outcome. We believe this expertise is best accomplished by partnering with corporations at earlier stages in the development of the enterprise. Proper partnering can lead to more capital efficient businesses that provide better returns for investors. The Company brings technology platforms and expertise in company building.
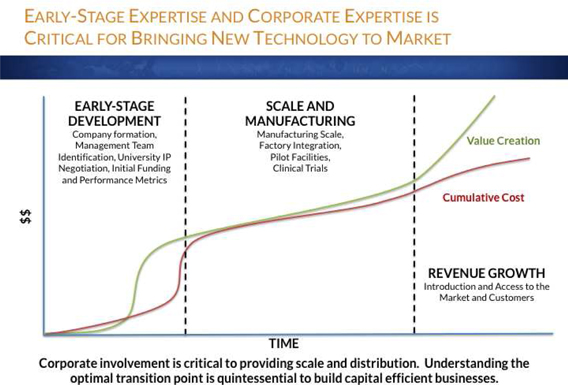
Our corporate partners bring expertise in scale and manufacturing and access to end markets. We are currently executing on our partnering strategy in two ways. First, we are partnering with corporations as syndicate partners investing in and working with to build early-stage companies. A syndicate of financial investors besides key strategic corporations from the very first round of capital is becoming more common in our investments. Over three-fourths of our portfolio companies have significant corporate partnerships or investments, and most developed these relationships in the early-stages of development of those companies.
Second, we are focused on strategically partnering with corporations to manage their capital besides ours. Such a relationship could provide us with intelligence and complementary knowledge the yields could add to our competitive advantage identifying and building companies enabled by disruptive science, particularly BIOLOGY+. In addition, we will benefit by managing third-party capital, which yields more capital for us to invest in building these companies and reducing reliance on identification of sources of capital from other investors. There is no assurance we will be successful in securing these partnerships.
| 73 |
Return
We believe that we will generate meaningful returns for shareholders over the coming years as we continue to execute on our strategy discussed above. We are focused on increasing value for shareholders through growing net asset value per share, and we believe we may have an opportunity to reduce the number of shares outstanding and provide deemed dividends as well as cash dividends as we execute on this strategy.
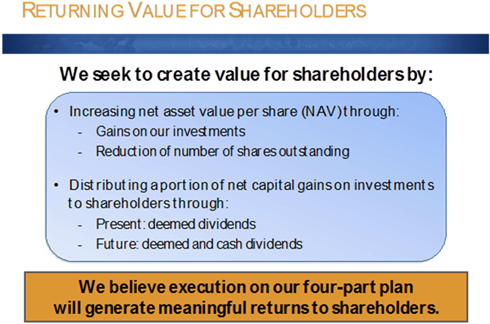
Current Business Environment
The third quarter of 2013 ended with increases in value in the public market indices. These increases coincided with an increase in the number and value of IPOs and M&A transactions. Fundraising by venture capital firms continued to be challenging and concentrated to a small number of funds. These dynamics continue to lead to a difficult fundraising environment for venture-backed companies, particularly those in the middle stages of development and those focused on sectors in which Harris & Harris Group invests.
Twenty-six venture-backed companies raised $2.7 billion through IPOs in the third quarter of 2013, which marks the first time since 2004 with two consecutive quarters of 20+ venture-backed IPOs, according to Thomson Reuters and the National Venture Capital Association ("NVCA"). Twenty-four of the twenty-six venture-backed IPOs were U.S.-based companies. It is also an increase in venture-backed IPOs from the third quarter of 2012, in which 10 IPOs were completed. According to KPMG’s Semi-Annual Venture Capital IPO Webcast Survey, 60 percent of respondents expect IPO volume to increase through the remainder of 2013. For the third quarter of 2013, 107 venture-backed M&A deals were reported, which is an uptick from the second quarter of 2013, in which 92 were reported, but a decrease from the third quarter of 2012, in which 125 were reported.
| 74 |
Fifty-six U.S. venture capital funds raised $4.1 billion in the third quarter of 2013, according to Thomson Reuters and the NVCA. Compared to the second quarter of 2013, this is a 28 percent increase in the amount of capital raised (up from $3.2 billion) and an increase in the number of funds (up from 49). The amount raised through the first three quarters of 2013 is a significant (29 percent) decline from the amount raised in the same period of 2012. The trend of few funds raising more money has continued with the top five venture capital funds accounting for 58 percent of the total fundraising in the third quarter, which is comparable to the second and first quarters of 2013. Of the 56 funds that were raised, 16 were new funds, and they represented 11 percent of the dollar value. This is a slight increase in the number of new funds from the second quarter of 2013. Within the past five years, first-time funds have raised an average of nine percent of the committed capital. This represents an uptick in fundraising by new funds compared with the average.
The current business environment is also complicated by global economic uncertainty and regional unrest. It is unclear if the rising budget deficits and partisan politics in the U.S. will result in further downgrades in its credit rating and/or prolonged partial or complete shutdowns of the U.S. government. Any outcome could be heightened potentially should an alternative to U.S. Treasury securities emerge as the global safe-haven for invested capital or should large holders of these securities, such as China, decide to divest of them in large quantities or in full. Further, many of our portfolio companies receive non-dilutive funding through government contracts and grants. Sequestration has and could continue to have a direct and significant reduction in our portfolio companies' contract or grant awards. Sequestration will also likely result in reduced budgets at research facilities, which has and could continue to reduce the volume of products they could potentially purchase from our portfolio companies. All of this uncertainty could lead to a further broad reduction in risk taken by investors and corporations, which could reduce further the capital available to our portfolio companies, could affect the ability of our portfolio companies to build and grow their respective businesses, and could decrease the liquidity options available to our portfolio companies.
Historically, difficult venture environments have resulted in a higher than normal number of companies not receiving financing and being subsequently closed down with a loss to venture investors, and other companies receiving financing but at significantly lower valuations than the preceding financing rounds. This issue is compounded by the fact that many existing venture capital firms have few remaining years of investment and available capital owing to the finite lifetime of the funds managed by these firms. Additionally, even if a firm was able to raise a new fund, commonly venture capital firms are not permitted to invest new funds in existing investments. This limitation of available capital can lead to fractured syndicates of investors. A fractured syndicate can result in a portfolio company being unable to raise additional capital to fund operations; this issue is especially acute in capital-intensive sectors that are enabled by science-related innovations, such as life sciences, energy and electronics, which are generally not in favor among venture capital firms. The result of these difficulties is that the portfolio company may be forced to sell before reaching its full potential or be shut down entirely if the remaining investors cannot financially support the company. As such, improvements in the exit environment for venture-backed companies through IPOs and M&A transactions may not translate to an increase in the available capital to venture-backed companies, particularly those that have investments from funds that are in the latter stage of life unless the markets improve for some time into the future.
Our overall goal remains unchanged. We want to maintain our leadership position in investing in science-enabled companies, particularly those enabled by nanotechnology and microsystems, and increase our net asset value. The current environment for venture capital financings continues to favor those firms that have capital to invest regardless of the stage of the investee company. We continue to finance our new and follow-on equity and convertible debt investments from our cash reserves held in bank accounts. We may in the future invest borrowed capital to take advantage of opportunities that we believe will return greater than the cost of such borrowed capital. We have historically held, and may in the future again hold, our cash in U.S. Treasury securities. We believe the current status of the venture capital industry and the current economic climate provide opportunities to invest this capital at historically low valuations and under favorable terms in equity and convertible debt of new and existing privately held and publicly traded companies.
| 75 |
Valuation of Investments
We value our privately held venture capital investments each quarter as determined in good faith by our Valuation Committee, a committee of all the independent directors, within guidelines established by our Board of Directors in accordance with the 1940 Act. See "Footnote to Consolidated Schedule of Investments" contained in "Consolidated Financial Statements" for additional information.
The values of privately held, venture capital-backed companies are inherently more difficult than publicly traded companies to assess at any single point in time because securities of these types of companies are not actively traded. We believe, perhaps even more than in the past, that illiquidity, and the perception of illiquidity, can affect value. Management believes further that the long-term effects of the difficult venture capital market and difficult exit environments will continue to affect negatively the fundraising ability of weak companies regardless of near-term improvements in the overall global economy and public markets and that these factors can also affect value.
We note that while the valuations of our privately held, venture capital-backed companies may decrease, sometimes substantially, such decrease may facilitate an increase in our ownership of the overall company in conjunction with a follow-on investment in such company. In these cases, the ultimate return on our overall invested capital could be greater than it would have been without such interim decrease in valuation.
In each of the years in the period of 2009 through 2012, and for the nine months ended September 30, 2013, we recorded the following gross write-ups in privately held securities as a percentage of net assets at the beginning of the year ("BOY"), gross write-downs in privately held securities as a percentage of net assets at the beginning of the year, and change in value of private portfolio securities as a percentage of net assets at the beginning of the year.
Gross Write-Ups and Write-Downs of the Privately Held Portfolio
| 2009 | 2010 | 2011 | 2012 |
Nine Months Ended September 30, 2013 |
||||||||||||||||
| Net Asset Value, BOY | $ | 109,531,113 | $ | 134,158,258 | $ | 146,853,912 | $ | 145,698,407 | $ | 128,436,774 | ||||||||||
| Gross Write-Downs During Year | $ | (12,845,574 | ) | $ | (11,391,367 | ) | $ | (11,375,661 | ) | $ | (19,604,046 | ) | $ | (12,402,795 | ) | |||||
| Gross Write-Ups During Year | $ | 21,631,864 | $ | 30,051,847 | $ | 11,997,991 | $ | 14,099,904 | $ | 7,964,185 | ||||||||||
| Gross Write-Downs as a Percentage of Net Asset Value, BOY | (11.7 | )% | (8.5 | )% | (7.8 | )% | (13.5 | )% | (9.7 | )% | ||||||||||
| Gross Write-Ups as a Percentage of Net Asset Value, BOY | 19.7 | % | 22.4 | % | 8.2 | % | 9.7 | % | 6.2 | % | ||||||||||
| Net Change as a Percentage of Net Asset Value, BOY | 8.0 | % | 13.9 | % | 0.4 | % | (3.8 | )% | (3.5 | )% | ||||||||||
| 76 |
From June 30, 2013, to September 30, 2013, the value of our equity-focused venture capital portfolio, including our rights to potential future milestone payments from the sales of BioVex Group, Inc., and Nextreme Thermal Solutions, Inc., decreased by $14,252,308, from $106,938,843 to $92,686,535. The sale of Xradia, Inc., to Carl Zeiss AG in the third quarter of 2013 accounted for the majority of this decrease, as Xradia was no longer a portfolio company as of September 30, 2013.
Not including our rights to potential future milestone payments from the sale of BioVex Group, Inc., and Nextreme Thermal Solutions, Inc., and the contribution to the change in value from the sale of Xradia, Inc., to Carl Zeiss AG, our equity-focused portfolio companies decreased in value by $238,105. This decrease was primarily owing to 1) a net decrease in the valuation of Solazyme, Inc., and sales of a portion of our shares of this company of $4,101,350, offset by net cash proceeds to us of $3,290,547 that are not included in the valuation of Solazyme as of September 30, 2013, 2) a net decrease in value owing to a net increase in discounts for non-performance risk of $1,142,180 and 3) a net decrease in value owing to the terms and pricing of new rounds of financing of $1,547,504. These changes were offset by 1) follow-on investments of $3,911,669 and 2) a net increase owing to the public markets of $2,161,874. The remaining component of the change in the value of our equity-focused portfolio companies of $479,386 was primarily owing to net increases in the value of warrants, currency fluctuations and interest on convertible bridge notes.
We note that our Valuation Committee and ultimately our Board of Directors take into account multiple sources of quantitative and qualitative inputs to determine the value of our privately held portfolio companies and our publicly traded portfolio companies whose values are not derived solely from the closing price on the last day of the quarter.
We also note that our Valuation Committee does not set the value of Solazyme, Inc., our freely tradable publicly traded portfolio company, or the value of our shares of Champions Oncology, Inc., which trades on an OTC exchange.
We define non-performance as the risk that the price per share (or implied valuation of a portfolio company) or the effective yield of a debt security of a portfolio company, as applicable, does not appropriately represent the risk that a portfolio company that requires or seeks to raise additional capital will be (a) unable to raise capital, will need to be shut down and will not return our invested capital; or (b) able to raise capital, but at a valuation significantly lower than the implied post-money valuation. Our best estimates of non-performance risk of our portfolio companies during the third quarter of 2013 are included in the valuation of the companies as of September 30, 2013. Changes in non-performance risk led to a net decrease in value of $1,142,180. In the future, as these companies receive terms for additional financings or if they are unable to receive additional financing and, therefore, proceed with sales or shutdowns of the business, we expect the contribution of the discount for non-performance risk to vary in importance in determining the fair values of our securities of these companies. Changes in discounts for non-performance risk could positively or negatively affect the value of our portfolio companies in future quarters. As of September 30, 2013, non-performance risk was a significant factor in determining the values of seven of our 25 equity-focused portfolio companies and warrants of Champions Oncology, Inc., that are fair valued by our Board of Directors. These seven companies accounted for approximately $11.6 million, or 14 percent, of the total value of our equity-focused venture capital portfolio, not including our rights to milestone payments from the sale of BioVex Group, Inc., to Amgen, Inc. As of December 31, 2012, non-performance risk was a significant factor in determining the values of nine of our 27 equity-focused portfolio companies that are fair valued by our Board of Directors. These nine companies accounted for approximately $34.6 million, or 33.7 percent, of the total value of our equity-focused venture capital portfolio, not including our rights to milestone payments from the sale of BioVex Group, Inc., to Amgen, Inc., or our rights to milestone payments from the sale of Nextreme Thermal Solutions, Inc., to Laird Technologies, Inc.
| 77 |
We also note that our valuation of our securities of Molecular Imprints, Inc., includes $3,790,474 that is ascribed to a non-convertible bridge note. The principal plus interest of this note was repaid in full in the third quarter of 2011. The remaining value results from a liquidation preference that survived the repayment of the note and, as currently written, would pay the Company $4,044,450 should the company be sold for more than its outstanding debt and a contractual payment to management of Molecular Imprints. This amount assumes that the total non-convertible bridge note preferences of $10.5 million are paid in full. Our value of this portion of our securities of Molecular Imprints as of September 30, 2013, reflects a probability-weighted discount applied to the total amount of the preference.
As of September 30, 2013, our top ten investments by value accounted for approximately 74 percent of the value of our equity-focused venture capital portfolio.
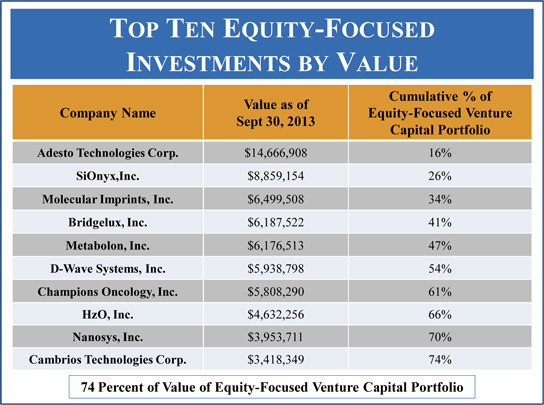
Results of Operations
We present the financial results of our operations utilizing GAAP for investment companies. On this basis, the principal measure of our financial performance during any period is the net increase (decrease) in our net assets resulting from our operating activities, which is the sum of the following three elements:
Net Operating Income (Loss) - the difference between our income from interest, dividends, and fees and our operating expenses.
| 78 |
Net Realized Gain (Loss) on Investments - the difference between the net proceeds of sales of portfolio securities and their stated cost, plus income from interests in limited liability companies.
Net Increase (Decrease) in Unrealized Appreciation or Depreciation on Investments - the net unrealized change in the value of our investment portfolio.
Owing to the structure and objectives of our business, we generally expect to experience net operating losses and seek to generate increases in our net assets from operations through the long-term appreciation and monetization of our venture capital investments. We have relied, and continue to rely, primarily on proceeds from sales of investments, rather than on investment income, to defray a significant portion of our operating expenses. Because such sales are unpredictable, we attempt to maintain adequate working capital to provide for fiscal periods when there are no such sales.
The potential for, or occurrence of, inflation could result in rising interest rates for government-backed debt. We may also invest in both short- and long-term U.S. government and agency securities. To the extent that we invest in short- and long-term U.S. government and agency securities, changes in interest rates result in changes in the value of these obligations that result in an increase or decrease of our net asset value. The level of interest rate risk exposure at any given point in time depends on the market environment, the expectations of future price and market movements, and the quantity and duration of long-term U.S. government and agency securities held by the Company, and it will vary from period to period. We did not hold U.S. government securities at September 30, 2013.
Three months ended September 30, 2013, as compared with the three months ended September 30, 2012
In the three months ended September 30, 2013, we had a net decrease in net assets resulting from operations of $2,096,162. In the three months ended September 30, 2012, we had a net decrease in net assets resulting from operations of $3,669,717.
Investment Income and Expenses:
We had net operating losses of $1,892,794 and $1,450,334 for the three months ended September 30, 2013, and September 30, 2012, respectively. The variation in these results is primarily owing to the changes in investment income and operating expenses, including non-cash expense included in salaries, benefits and stock-based compensation of $309,778 in 2013 primarily associated with the compensation cost for restricted stock as compared with $472,304 for the same period in 2012 associated with granting of stock options in years prior to 2012. During the three months ended September 30, 2013, and 2012, total investment income was $135,025 and $396,246, respectively. During the three months ended September 30, 2013, and 2012, total operating expenses were $2,027,819 and $1,846,580, respectively.
During the three months ended September 30, 2013, as compared with the same period in 2012, investment income decreased, reflecting a decrease in interest income from convertible bridge notes, non-convertible promissory notes, subordinated and senior secured debt. During the three months ended September 30, 2013, our average holdings of U.S. government securities were $19,399,819 as compared with $2,500,000 during the three months ended September 30, 2012, primarily owing to reinvestment of the proceeds received from the sale of Xradia, Inc.
| 79 |
Operating expenses, including non-cash, stock-based compensation expense, were $2,027,819 and $1,846,580 for the three months ended September 30, 2013, and September 30, 2012, respectively. The increase in operating expenses for the three months ended September 30, 2013, as compared with the three months ended September 30, 2012, was primarily owing to increases in salaries, benefits and stock-based compensation expense, administration and operations expense, professional fees and custody fees, offset by decreases in rent expense and directors' fees and expenses. Salaries, benefits and stock-based compensation expense increased by $104,503, or 8.7 percent, for the three months ended September 30, 2013, as compared with September 30, 2012, primarily as a result of increases in bonus accruals, increases in salaries of employees owing to cost of living adjustments and costs associated with increases in salary for three of our employees who were promoted in 2013 from their positions in 2012, offset primarily by a decrease in non-cash stock-based compensation expense of $162,526 associated with the Stock Plan and a decrease of $70,831 in the projected benefit obligation expense accrual for medical retirement benefits. While the non-cash, stock-based compensation expense for the Stock Plan increased our operating expenses by $309,778, this increase was offset by a corresponding increase to our additional paid-in capital, resulting in no net impact to our net asset value. Administration and operations expense increased by $8,265, or 3.9 percent, through September 30, 2013, as compared with September 30, 2012, primarily as a result of timing differences related to certain accrued expenses. Professional fees increased by $88,961, or 39.9 percent, through September 30, 2013, as compared with September 30, 2012, primarily as a result of an increase in certain legal fees related to establishing our loan facility with Orix Corporate Capital, Inc. Custody fees increased by $266, or 1.9 percent, for the three months ended September 30, 2013, as compared with September 30, 2012.
Rent expense decreased by $7,166, or 6.8 percent, for the period ended September 30, 2013, as compared with the three months ended September 30, 2012. Our rent expense of $98,539 for the three months ended September 30, 2013, includes $85,902 of rent paid in cash and $12,637 non-cash rent expense, credits and abatements that we recognize on a straight-line basis over the lease term. Our rent paid in cash of $85,902 includes $6,861 of real estate tax escalation charges on our corporate headquarters located at 1450 Broadway in New York City. Directors' fees and expenses decreased by $9,328, or 14.8 percent, through September 30, 2013, as compared with September 30, 2012, primarily owing to a smaller Board of Directors in 2013.
Realized Income and Losses from Investments:
During the three months ended September 30, 2013, and September 30, 2012, we realized net gains on investments of $12,894,155 and $2,776,048, respectively.
During the three months ended September 30, 2013, we realized net gains of $12,894,155, consisting primarily of a net realized gain on our investment in Xradia, Inc., of $10,006,915, a realized gain of $2,845,191 on the sale of 330,000 shares of Solazyme, Inc., that were called subject to the terms of written call option contracts and a realized gain of $42,049 on the repurchase and sale of certain Solazyme written call option contracts. At September 30, 2013, we still owned 250,000 shares of Solazyme.
During the three months ended September 30, 2012, we realized net gains of $2,776,048, consisting primarily of a realized gain of $2,695,339 on the sale of 277,659 shares of Solazyme, Inc., including the sale of 104,300 shares that were called subject to the terms of call option contracts. We also had a realized gain of $80,573 on the repurchase and expiration of certain Solazyme and NeoPhotonics Corporation written call option contracts.
| 80 |
Net Unrealized Appreciation and Depreciation of Portfolio Securities:
During the three months ended September 30, 2013, net unrealized depreciation on total investments increased by $13,094,180, or 667.9 percent, from accumulated net unrealized depreciation of $1,960,506 at June 30, 2013, to accumulated net unrealized depreciation of $15,054,686 at September 30, 2013. During the three months ended September 30, 2012, net unrealized appreciation on total investments decreased by $4,988,270, or 28.7 percent, from net unrealized appreciation of $17,361,078 at June 30, 2012, to net unrealized appreciation of $12,372,808 at September 30, 2012.
During the three months ended September 30, 2013, net unrealized depreciation on our venture capital investments increased by $13,424,573, from net unrealized depreciation of $1,693,177 at June 30, 2013, to net unrealized depreciation of $15,117,750 at September 30, 2013, owing primarily to a decrease in unrealized appreciation of $10,005,871 on our investment in Xradia, Inc., resulting from realized gains on the sale of its securities and a decrease in unrealized appreciation of $3,321,494 on our investment in Solazyme, Inc., resulting from the change in value of shares held and from realized gains on the sale of its securities. We also had write-downs in the valuations of the following investments held:
| Investment | Amount of Write-Down | |||
| Ancora Pharmaceuticals Inc. | $ | 1,674,742 | ||
| Laser Light Engines, Inc. | 1,307,639 | |||
| Molecular Imprints, Inc. | 461,436 | |||
| OpGen, Inc. | 393,560 | |||
| Contour Energy Systems, Inc. | 319,766 | |||
| Kovio, Inc. | 275,150 | |||
| GEO Semiconductor, Inc. | 4,732 | |||
| D-Wave Systems, Inc. | 3,794 | |||
| Cobalt Technologies, Inc. | 42 | |||
The write-downs for the three months ended September 30, 2013, were offset by write-ups in the valuations of the following investments held:
| Investment | Amount of Write-Up | |||
| Champions Oncology, Inc. | $ | 2,189,257 | ||
| Cambrios Technologies Corporation | 854,586 | |||
| SiOnyx, Inc. | 709,153 | |||
| ABSMaterials, Inc. | 355,927 | |||
| Metabolon, Inc. | 78,375 | |||
| Bridgelux, Inc. | 15,471 | |||
| OhSo Clean, Inc. | 9,043 | |||
| Nanosys, Inc. | 3,108 | |||
| NanoTerra, Inc. | 3,066 | |||
| Ensemble Therapeutics Corporation | 1,418 | |||
| 81 |
We had a decrease in unrealized appreciation of $8,332 on the rights to milestone payments from Amgen, Inc.’s acquisition of BioVex Group, Inc.
We had an increase in unrealized appreciation of $132,582 on our investment in D-Wave Systems, Inc., owing to foreign currency translation.
During the three months ended September 30, 2012, net unrealized appreciation on our venture capital investments decreased by $6,099,871, from net unrealized appreciation of $17,825,260 at June 30, 2012, to net unrealized appreciation of $11,725,389 at September 30, 2012, owing primarily to write-downs in the valuations of the following investments held:
| Investment | Amount of Write-Down | |||
| Solazyme, Inc. | $ | 7,875,223 | ||
| Bridgelux, Inc. | 2,103,770 | |||
| Contour Energy Systems, Inc. | 1,279,064 | |||
| Ancora Pharmaceuticals Inc. | 1,238,523 | |||
| Laser Light Engines, Inc. | 1,069,528 | |||
| Champions Oncology, Inc. | 658,667 | |||
| Senova Systems, Inc. | 302,901 | |||
| Mersana Therapeutics, Inc. | 227,948 | |||
| SiOnyx, Inc. | 111,459 | |||
| Ensemble Therapeutics Corporation | 29,380 | |||
| Metabolon, Inc. | 16,346 | |||
The write-downs for the three months ended September 30, 2012, were offset by write-ups in the valuations of the following investments held:
| Investment | Amount of Write-Up | |||
| Adesto Technologies Corporation | $ | 3,655,548 | ||
| Nanosys, Inc. | 2,639,847 | |||
| Nantero, Inc. | 1,210,298 | |||
| Cobalt Technologies, Inc. | 569,334 | |||
| NeoPhotonics Corporation | 405,816 | |||
| Xradia, Inc. | 34,332 | |||
| GEO Semiconductor, Inc. | 25,824 | |||
| NanoTerra, Inc. | 20,625 | |||
| OHSO Clean, Inc. | 16,151 | |||
| D-Wave Systems, Inc. | 4,650 | |||
We had an increase in unrealized appreciation of $14,264 on the rights to milestone payments from Amgen, Inc.’s acquisition of BioVex Group, Inc.
We had an increase in unrealized appreciation owing to foreign currency translation of $216,249 on our investment in D-Wave Systems, Inc.
| 82 |
Nine months ended September 30, 2013, as compared with the nine months ended September 30, 2012
In the nine months ended September 30, 2013, we had a net decrease in net assets resulting from operations of $51,593. In the nine months ended September 30, 2012, we had a net increase in net assets resulting from operations of $4,547.
Investment Income and Expenses:
We had net operating losses of $5,818,305 and $6,814,995 for the nine months ended September 30, 2013, and September 30, 2012, respectively. The variation in these results is primarily owing to the changes in investment income and operating expenses, including non-cash expense included in salaries, benefits and stock-based compensation of $939,979 in 2013 primarily associated with the compensation cost for restricted stock as compared with $2,457,423 for the same period in 2012 associated with the prior years' granting of stock options. During the nine months ended September 30, 2013, and 2012, total investment income was $510,078 and $528,690, respectively. During the nine months ended September 30, 2013, and 2012, total operating expenses were $6,328,383 and $7,343,685, respectively.
During the nine months ended September 30, 2013, as compared with the same period in 2012, investment income decreased, reflecting a decrease in interest income from convertible bridge notes, non-convertible promissory notes, subordinated and senior secured debt. During the nine months ended September 30, 2013, our average holdings of U.S. government securities were $16,159,577 as compared with $1,000,000 during the nine months ended September 30, 2012, primarily owing to reinvestment of the proceeds received from the sale of Xradia, Inc.
Operating expenses, including non-cash, stock-based compensation expense, were $6,328,383 and $7,343,685 for the nine months ended September 30, 2013, and September 30, 2012, respectively. The decrease in operating expenses for the nine months ended September 30, 2013, as compared with the nine months ended September 30, 2012, was primarily owing to decreases in salaries, benefits and stock-based compensation expense, administration and operations expense, rent expense and directors' fees and expenses, offset by increases in professional fees and custody fees. Salaries, benefits and stock-based compensation expense decreased by $1,082,489, or 21.0 percent, for the nine months ended September 30, 2013, as compared with September 30, 2012, primarily as a result of a decrease in non-cash stock-based compensation expense of $1,517,444 associated with the Stock Plan and a decrease of $212,491 in the projected benefit obligation expense accrual for medical retirement benefits, offset by increases in bonus accruals and salaries of employees owing to cost of living adjustments and costs associated with increases in salary for three of our employees who were promoted in 2013 from their positions in 2012. While the non-cash, stock-based compensation expense for the Stock Plan increased our operating expenses by $939,979, this increase was offset by a corresponding increase to our additional paid-in capital, resulting in no net impact to our net asset value. Administration and operations expense decreased by $97,616, or 12.3 percent, for the nine months ended September 30, 2013, as compared with September 30, 2012, primarily as a result of decreases in costs associated with investor outreach expenses, general office and administration expenses, and timing differences related to certain accrued expenses, offset by increases in managing directors' travel-related expenses. We did not hold a Meet the Portfolio Day during the nine months ended September 30, 2013, as compared with costs of approximately $37,668 associated with such an event in the comparable period in 2012. Rent expense decreased by $2,162, or less than one percent, for the nine months ended September 30, 2013, as compared with September 30, 2012. Our rent expense of $301,240 for the nine months ended September 30, 2013, includes $307,562 of rent paid in cash, net of $6,322 non-cash rent expense, credits and abatements that we recognize on a straight-line basis over the lease term. Our rent paid in cash of $307,562 includes $6,861 of real estate tax escalation charges on our corporate headquarters located at 1450 Broadway in New York City. Directors' fees and expenses decreased by $56,184, or 23.3 percent, for the nine months ended September 30, 2013, as compared with September 30, 2012, primarily owing to a smaller Board of Directors in 2013.
| 83 |
Professional fees increased by $234,190, or 31.6 percent, for the nine months ended September 30, 2013, as compared with September 30, 2012, primarily as a result of an increase in certain legal fees related to establishing our loan facility with Orix Corporate Capital, Inc., offset by a decrease in consulting fees associated with investor outreach and marketing efforts. Custody fees increased by $6,058, or 17.0 percent, for the nine months ended September 30, 2013, as compared with September 30, 2012.
Realized Income and Losses from Investments:
During the nine months ended September 30, 2013, and September 30, 2012, we realized net gains on investments of $17,108,525 and $4,313,573, respectively.
During the nine months ended September 30, 2013, we realized net gains of $17,108,525, consisting primarily of a net realized gain on our investment in Xradia, Inc., of $10,006,915, a realized gain of $11,929,357 on the sale of 1,547,790 shares of Solazyme, Inc., of which 884,800 shares were called subject to the terms of written call option contracts, a realized gain of $148,729 on our escrow payment from the sale of Crystal IS, Inc., and a realized gain of $105,313 on the early repayments of the senior secured and subordinated secured debt by GEO Semiconductor, Inc., offset by a realized loss on the value of our investment in Nextreme Thermal Solutions, Inc., of $4,384,762, a realized loss of $540,106 on the sale of 50,807 shares of NeoPhotonics Corporation, of which 50,800 shares were called subject to the terms of written call option contracts, a realized loss of $84,712 on the repurchase and expiration of certain Solazyme and NeoPhotonics written call option contracts, and a realized loss of $72,209 on the expiration of certain Solazyme purchased put option contracts. At September 30, 2013, we still owned 250,000 shares of Solazyme. At September 30, 2013, we did not hold any shares of NeoPhotonics.
During the nine months ended September 30, 2012, we realized net gains of $4,313,573, consisting primarily of a realized gain of $3,366,218 on the sale of 365,959 shares of Solazyme, Inc., including the sale of 192,600 shares that were called subject to the terms of call option contracts and a realized gain of $458,911 on the repurchase and expiration of certain Solazyme and NeoPhotonics Corporation written call option contracts. At September 30, 2012, we still owned 1,938,190 shares of Solazyme. We also had realized gains on our escrow payments from the sales of BioVex Group, Inc., and Crystal IS, Inc.
Net Unrealized Appreciation and Depreciation of Portfolio Securities:
During the nine months ended September 30, 2013, net unrealized depreciation on total investments increased by $11,316,299, or 302.7 percent, from accumulated net unrealized depreciation of $3,738,387 at December 31, 2012, to accumulated net unrealized depreciation of $15,054,686 at September 30, 2013. During the nine months ended September 30, 2012, net unrealized appreciation on total investments increased by $2,521,205, or 25.6 percent, from net unrealized appreciation of $9,851,603 at December 31, 2011, to net unrealized appreciation of $12,372,808 at September 30, 2012.
| 84 |
During the nine months ended September 30, 2013, net unrealized depreciation on our venture capital investments increased by $11,369,119, from net unrealized depreciation of $3,748,631 at December 31, 2012, to net unrealized depreciation of $15,117,750 at September 30, 2013, owing primarily to a decrease in unrealized appreciation of $8,303,684 on our investment in Xradia, Inc., resulting from realized gains on the sale of its securities and a decrease in unrealized appreciation of $8,509,738 on our investment in Solazyme, Inc., resulting from realized gains on the sale of its securities. We also had write-downs in the valuations of the following investments held:
| Investment | Amount of Write-Down | |||
| Contour Energy Systems, Inc. | $ | 3,517,428 | ||
| OpGen, Inc. | 3,246,060 | |||
| Laser Light Engines, Inc. | 2,315,861 | |||
| Kovio, Inc. | 1,611,315 | |||
| Ancora Pharmaceuticals Inc. | 686,632 | |||
| Molecular Imprints, Inc. | 461,436 | |||
| Senova Systems, Inc. | 292,887 | |||
| GEO Semiconductor, Inc. | 69,383 | |||
| Produced Water Absorbents, Inc. | 28,170 | |||
The write-downs for the nine months ended September 30, 2013, were offset by write-ups in the valuations of the following investments held:
| Investment | Amount of Write-Up | |||
| Champions Oncology, Inc. | 4,260,063 | |||
| Bridgelux, Inc. | 3,851,942 | |||
| Cambrios Technologies Corporation | 854,586 | |||
| Solazyme, Inc. | 732,500 | |||
| Ensemble Therapeutics Corporation | 719,587 | |||
| SiOnyx, Inc. | 709,148 | |||
| HzO, Inc. | 569,325 | |||
| AgBiome, LLC | 500,000 | |||
| ABSMaterials, Inc. | 396,876 | |||
| Enumeral Biomedical Corp. | 239,481 | |||
| Metabolon, Inc. | 78,428 | |||
| OhSo Clean, Inc. | 23,971 | |||
| NanoTerra, Inc. | 10,758 | |||
| Cobalt Technologies, Inc. | 5,989 | |||
| Nanosys, Inc. | 4,094 | |||
| D-Wave Systems, Inc. | 3,842 | |||
We had an increase in unrealized appreciation of $4,384,762 on our investment in Nextreme Thermal Solutions, Inc., owing to a realized loss on the sale of its securities.
We had a decrease in unrealized appreciation of $25,346 on the rights to milestone payments from Amgen, Inc.’s acquisition of BioVex Group, Inc.
| 85 |
We had a decrease in unrealized appreciation of $177,465 on our investment in D-Wave Systems, Inc., owing to foreign currency translation.
We had an increase in unrealized appreciation of $530,934 on our investment in NeoPhotonics Corporation owing to realized losses on the sale of its securities.
During the nine months ended September 30, 2012, net unrealized appreciation on our venture capital investments increased by $1,993,786, from net unrealized appreciation of $9,731,603 at December 31, 2011, to net unrealized appreciation of $11,725,389 at September 30, 2012, owing primarily to increases in the valuations of the following investments held:
| Investment | Amount of Write-Up | |||
| Adesto Technologies Corporation | $ | 6,214,431 | ||
| Nanosys, Inc. | 2,408,883 | |||
| Nantero, Inc. | 1,210,298 | |||
| Ensemble Therapeutics Corporation | 1,085,952 | |||
| Xradia, Inc. | 989,389 | |||
| Cobalt Technologies, Inc. | 819,921 | |||
| Cambrios Technologies Corporation | 800,546 | |||
| NeoPhotonics Corporation | 568,143 | |||
| D-Wave Systems, Inc. | 463,222 | |||
| Enumeral Biomedical Corp. | 215,343 | |||
| NanoTerra, Inc. | 38,543 | |||
| OHSO Clean, Inc. | 28,859 | |||
| GEO Semiconductor, Inc. | 15,204 | |||
The write-ups for the nine months ended September 30, 2012, were offset by write-downs in the valuations of the following investments held:
| Investment | Amount of Write-Down | |||
| Solazyme, Inc. | $ | 4,285,642 | ||
| Bridgelux, Inc. | 2,192,389 | |||
| Mersana Therapeutics, Inc. | 1,460,480 | |||
| Contour Energy Systems, Inc. | 1,279,064 | |||
| Ancora Pharmaceuticals Inc. | 1,234,747 | |||
| Laser Light Engines, Inc. | 1,110,977 | |||
| Champions Oncology, Inc. | 658,667 | |||
| Senova Systems, Inc. | 441,363 | |||
| ABSMaterials, Inc. | 390,000 | |||
| SiOnyx, Inc. | 32,993 | |||
| Metabolon, Inc. | 16,255 | |||
We had an increase in unrealized appreciation of $37,697 on the rights to milestone payments from Amgen, Inc.’s acquisition of BioVex Group, Inc.
| 86 |
We had an increase in unrealized appreciation owing to foreign currency translation of $199,932 on our investment in D-Wave Systems, Inc.
Financial Condition
September 30, 2013
At September 30, 2013, our total assets and net assets were $133,075,280 and $130,233,967, respectively. At December 31, 2012, they were $131,990,250 and $128,436,774, respectively.
At September 30, 2013, our net asset value per share was $4.18, as compared with $4.13 at December 31, 2012. At September 30, 2013, and December 31, 2012, our shares outstanding were 31,159,256 and 31,116,881, respectively.
Significant developments in the nine months ended September 30, 2013, included a decrease in the holdings of our venture capital investments of $13,618,655 and a decrease in our cash and treasury holdings of $8,849,523. As of September 30, 2013, we had a receivable from the sale of our treasury holdings of $22,799,975. This receivable settled on October 1, 2013, and increased our cash balance. The decrease in the value of our venture capital investments from $108,002,191 at December 31, 2012, to $94,383,536 at September 30, 2013, resulted primarily from a net decrease of $15,229,555 owing to the sale of certain of our shares of Solazyme, Inc., and NeoPhotonics Corporation and a net decrease of $12,303,684 owing to the sale of our investment in Xradia, Inc., offset by an increase owing to one new and 26 follow-on investments of $11,019,819 and an increase in the net value of our venture capital investments of $2,894,765. The decrease in our cash and treasury holdings from $22,377,991 at December 31, 2012, to $13,528,468 at September 30, 2013, is primarily owing to the payment of cash for operating expenses of $5,374,569 and to new and follow-on venture capital investments totaling $11,019,819, offset by net proceeds of $15,229,555 received from the sale of certain of our shares of Solazyme and NeoPhotonics, net premium proceeds of $623,042 received from certain Solazyme and NeoPhotonics written call options and purchased put option contracts, $1,222,830 received from the portion of our payments held in escrow from the sales of Innovalight, Inc., and Crystal IS, Inc., and $12,838,244 received from the sale of Xradia, Inc.
The following table is a summary of additions to our portfolio of venture capital investments made during the nine months ended September 30, 2013:
| New Investments | Amount of Investment | |||
| EchoPixel, Inc. | $ | 750,000 | ||
| 87 |
| Follow-On Investments | Amount of Investment | |||
| Adesto Technologies Corporation | $ | 2,499,999 | ||
| HzO, Inc. | 1,212,500 | |||
| Enumeral Biomedical Corp. | 750,000 | |||
| Adesto Technologies Corporation | 672,070 | |||
| Produced Water Absorbents, Inc. | 648,000 | |||
| D-Wave Systems, Inc. | 491,100 | |||
| SiOnyx, Inc. | 418,066 | |||
| Senova Systems, Inc. | 386,363 | |||
| Ancora Pharmaceuticals Inc. | 350,000 | |||
| HzO, Inc. | 350,000 | |||
| Nano Terra, Inc. | 350,000 | |||
| Enumeral Biomedical Corp. | 300,001 | |||
| Ancora Pharmaceuticals, Inc. | 300,000 | |||
| AgBiome, LLC | 260,870 | |||
| Ultora, Inc. | 215,000 | |||
| Champions Oncology, Inc. | 200,000 | |||
| Laser Light Engines, Inc. | 166,667 | |||
| Laser Light Engines, Inc. | 166,667 | |||
| Mersana Therapeutics, Inc. | 126,585 | |||
| Senova Systems, Inc. | 113,636 | |||
| Senova Systems, Inc. | 100,000 | |||
| Ensemble Therapeutics Corporation | 73,620 | |||
| Kovio, Inc. | 50,000 | |||
| Cobalt Technologies, Inc. | 28,920 | |||
| Ensemble Therapeutics Corporation | 25,767 | |||
| Ensemble Therapeutics Corporation | 13,988 | |||
| Total | $ | 11,019,819 | ||
The following tables summarize the values of our portfolios of venture capital investments and U.S. government obligations, as compared with their cost, at September 30, 2013, and December 31, 2012:
| September 30, 2013 | December 31, 2012 | |||||||
| Venture capital investments, at cost | $ | 109,501,286 | $ | 111,750,822 | ||||
| Net unrealized (depreciation) (1) | (15,117,750 | ) | (3,748,631 | ) | ||||
| Venture capital investments, at value | $ | 94,383,536 | $ | 108,002,191 | ||||
| September 30, 2013 | December 31, 2012 | |||||||
| U.S. government obligations, at cost | $ | 0 | $ | 13,996,136 | ||||
| Net unrealized (depreciation) appreciation(1) | 0 | 2,744 | ||||||
| U.S. government obligations, at value | $ | 0 | $ | 13,998,880 | ||||
(1)At September 30, 2013, and December 31, 2012, the net accumulated unrealized depreciation on investments, including written call options, was $15,054,686 and $3,738,387, respectively.
Liquidity
Our liquidity and capital resources are generated and are generally available through our cash holdings, interest earned on our investments on U.S. government securities, cash flows from the sales of U.S. government securities and payments received on our venture debt investments, proceeds from periodic follow-on equity offerings and realized capital gains retained for reinvestment.
| 88 |
We fund our day-to-day operations using interest earned and proceeds from our cash holdings, the sales of our investments in U.S. government securities, when applicable, and interest earned from our venture debt securities. We believe the increase or decrease in the value of our venture capital investments does not materially affect the day-to-day operations of the Company or our daily liquidity. As of September 30, 2013, and December 31, 2012, we had no investments in money market mutual funds.
Our loan facility with Orix Corporate Capital, Inc., may be used to fund our investments and not for the payment of day-to-day operating expenses. As of September 30, 2013, we had no debt outstanding. We have not issued any debt securities, and, therefore, are not subject to credit agency downgrades.
As a venture capital company, it is critical that we have capital available to support our best companies until we have an opportunity for liquidity in our investments. As such, we will continue to maintain a substantial amount of liquid capital on our balance sheet.
At September 30, 2013, and December 31, 2012, our total net primary liquidity was $36,356,703 and $22,461,202, respectively. Our primary liquidity is principally comprised of our cash, U.S. government securities, when applicable, and certain receivables. The increase in our primary liquidity from December 31, 2012, to September 30, 2013, is primarily owing to the receipt of our initial payment of $12,838,244 from the sale of Xradia, Inc., the receipt of $1,222,830 from the portion of our upfront payments held in escrow from the sale of Innovalight, Inc., and Crystal IS, Inc., and net proceeds of $15,229,555 received from the sales of certain of our shares of Solazyme, Inc., and NeoPhotonics Corporation, offset by the use of funds for investments and payment of net operating expenses. During the nine months ended September 30, 2013, we also purchased and sold call option and put option contracts on our publicly traded positions generating net proceeds of $623,042.
At September 30, 2013, and December 31, 2012, our secondary liquidity was $8,459,332 and $15,770,489, respectively. Our secondary liquidity consists of our publicly traded securities. Although these companies are publicly traded, their stock may not trade at high volumes and prices can be volatile, which may restrict our ability to sell our positions at any given time. We may also be restricted for a period of time in selling our positions in these companies due to our shares being unregistered.
We do not include funds held in escrow from the sale of investments in primary or secondary liquidity. These funds become primary liquidity if and when they are received at the expiration of the escrow period.
We believe that the current and future venture capital environment may adversely affect the valuation of investment portfolios, lead to tighter lending standards and result in reduced access to capital. These conditions may lead to a decline in net asset value and/or decline in valuations of our portfolio companies in future quarters. Although we cannot predict future market conditions, we continue to believe that our current cash and U.S. government security holdings and our ability to adjust our investment pace will provide us with adequate liquidity to execute our current business strategy.
| 89 |
Except for a rights offering, we are generally not able to issue and sell our common stock at a price below our net asset value per share, exclusive of any distributing commission or discount, without shareholder approval. As of September 30, 2013, our net asset value per share was $4.18 per share and our closing market price was $3.00 per share. We do not currently have shareholder approval to issue or sell shares below our net asset value per share.
Borrowings
On September 30, 2013, the Company terminated the Revolving Loan Agreement by and between the Company and TD Bank, N.A., dated February 24, 2011, as amended, its existing $10 million three-year revolving credit facility (the “Prior Credit Facility”). As of September 30, 2013, there was no principal outstanding under the Prior Credit Facility and no termination fees were incurred in connection with terminating the Prior Credit Facility.
On September 30, 2013, the Company entered into a four-year $20,000,000 Multi-Draw Term Loan Facility Credit Agreement, by and among the Company, as borrower, Orix Corporate Capital, Inc., as administrative agent and lender and the other lenders party thereto from time to time, which provides for a multi-draw loan facility (the "Loan Facility") that may be used by the Company to fund investments in portfolio companies. The Loan Facility replaces the Company’s Prior Credit Facility with TD Bank, NA. The Loan Facility, among other things, matures on September 30, 2017, and bears interest at 10 percent per annum in cash. The Company has the option to have interest accrue at a rate of 13.5 percent per annum if the Company decides not to pay interest in cash monthly. The Company currently plans to pay interest in cash if and when any borrowings are outstanding. The Loan Facility also requires payment of a draw fee on each borrowing equal to 1.0 percent of such borrowing and an unused commitment fee of 1.0 percent per annum. Interest and fee payments under the Loan Facility are made quarterly in arrears. The Company may prepay the loans or reduce the aggregate commitments under the Loan Facility at any time prior to the maturity date, as long as certain conditions are met, including payment of required prepayment or termination fees. The Loan Facility is secured by all of the assets of the Company and its wholly owned subsidiaries, subject to certain customary exclusions. The Loan Facility contains certain affirmative and negative covenants, including without limitation: (a) maintenance of certain minimum liquidity requirements; (b) maintenance of an eligible asset leverage ratio of not less than 4.0:1.0; (c) limitations on liens; (d) limitations on the incurrence of additional indebtedness; and (e) limitations on structural changes, mergers and disposition of assets (other than in the normal course of our business activities). There were no borrowings at closing.
At September 30, 2013, and December 31, 2012, the Company had no outstanding debt. At December 31, 2012, $0 was held in a collateral account at TD Bank, N.A. as security for the loan under the Prior Credit Facility. The weighted average annual interest rate for the nine months ended September 30, 2013, was zero percent, exclusive of amortization of closing fees and other expenses related to establishing the Prior Credit Facility. The remaining capacity under the Loan Facility was $20,000,000 at September 30, 2013. At September 30, 2013, the Company was in compliance with all covenants required by the Loan Facility.
| 90 |
Contractual Obligations
A summary of our significant contractual payment obligations is as follows:
Payments Due by Period
| Less than | More Than | |||||||||||||||||||
| Total | 1 Year | 1-3 Years | 3-5 Years | 5 Years | ||||||||||||||||
| Multi-Draw Loan Facility(1) | $ | 0 | $ | 0 | $ | 0 | $ | 0 | $ | 0 | ||||||||||
| Operating leases | $ | 1,822,085 | $ | 278,227 | $ | 564,893 | $ | 593,491 | $ | 385,474 | ||||||||||
(1)As of September 30, 2013, we had $20,000,000 of unused borrowing capacity under our Loan Facility.
Critical Accounting Policies
The Company's significant accounting policies are described in Note 3 to the Consolidated Financial Statements and in the Footnote to the Consolidated Schedule of Investments. Critical accounting policies are those that are both important to the presentation of our financial condition and results of operations and those that require management’s most difficult, complex or subjective judgments. The Company considers the following accounting policies and related estimates to be critical:
Valuation of Portfolio Investments
The most significant estimate inherent in the preparation of our consolidated financial statements is the valuation of investments and the related amounts of unrealized appreciation and depreciation of investments recorded. As a BDC, we invest in primarily illiquid securities that generally have no established trading market.
Investments are stated at "value" as defined in the 1940 Act and in the applicable regulations of the SEC and U.S. GAAP. ASC 820 defines fair value, establishes a framework for measuring fair value and expands disclosures about assets and liabilities measured at fair value. ASC 820 provides a consistent definition of fair value that focuses on exit price in the principal, or most advantageous, market and prioritizes, within a measurement of fair value, the use of market-based inputs over entity-specific inputs. ASC 820 also establishes the following three-level hierarchy for fair value measurements based upon the transparency of inputs to the valuation of an asset or liability as of the measurement date.
| • | Level 1 - inputs to the valuation methodology are quoted prices (unadjusted) for identical assets or liabilities in active markets; |
| • | Level 2 - inputs to the valuation methodology include quoted prices for similar assets and liabilities in active markets, and inputs that are observable for the asset or liability, either directly or indirectly, for substantially the full term of the financial instrument. Level 2 inputs are in those markets for which there are few transactions, the prices are not current, little public information exists or instances where prices vary substantially over time or among brokered market makers; and |
| 91 |
| • | Level 3 - inputs to the valuation methodology are unobservable and significant to the fair value measurement. Unobservable inputs are those inputs that reflect our own assumptions that market participants would use to price the asset or liability based upon the best available information. |
See "Note 6. Fair Value of Investments" in the accompanying notes to our consolidated financial statements for additional information regarding fair value measurements.
Value, as defined in Section 2(a)(41) of the 1940 Act, is (i) the market price for those securities for which a market quotation is readily available and (ii) the fair value as determined in good faith by, or under the direction of, the Board of Directors for all other assets. See "Valuation Procedures" in the "Footnote to Consolidated Schedule of Investments" for additional information. As of September 30, 2013, our financial statements include venture capital investments valued at $85,924,204, the fair values of which were determined in good faith by, or under the direction of, the Board of Directors. As of September 30, 2013, approximately 66 percent of our net assets represent investments in portfolio companies at fair value by the Board of Directors.
Determining fair value requires that judgment be applied to the specific facts and circumstances of each portfolio investment, although our valuation policy is intended to provide a consistent basis for determining fair value of the portfolio investments. Factors that may be considered include, but are not limited to, the cost of the Company’s investment; transactions in the portfolio company’s securities or unconditional firm offers by responsible parties; the financial condition and operating results of the company; the long-term potential of the business and technology of the company; the values of similar securities issued by companies in similar businesses; multiples to revenues, net income or EBITDA that similar securities issued by companies in similar businesses receive; the proportion of the company’s securities we own and the nature of any rights to require the company to register restricted securities under the applicable securities laws; management's assessment of non-performance risk; the achievement of milestones; discounts for restrictions on transfers of publicly traded securities; and the rights and preferences of the class of securities we own as compared with other classes of securities the portfolio has issued.
In addition, with respect to our debt investments for which no readily available market quotations are available, we will generally consider the financial condition and current and expected future cash flows of the portfolio company; the creditworthiness of the portfolio company and its ability to meet its current debt obligations; the relative seniority of our debt investment within the portfolio company’s capital structure; the availability and value of any available collateral; and changes in market interest rates and credit spreads for similar debt investments.
Historically, difficult venture capital environments have resulted in companies not receiving financing and being subsequently closed down with a loss of investment to venture investors, and other companies receiving financing but at significantly lower valuations than the preceding rounds, leading to very deep dilution for those who do not participate in the new rounds of investment. Our best estimate of this non-performance risk has been quantified and included in the valuation of our portfolio companies as of September 30, 2013.
All investments recorded at fair value are categorized based upon the level of judgment associated with the inputs used to measure their fair value. Hierarchical levels related to the amount of subjectivity associated with the inputs to fair valuation of these assets, are as follows:
| 92 |
| · | Level 1: Unadjusted quoted prices in active markets for identical assets or liabilities. |
| · | Level 2: Quoted prices in active markets for similar assets or liabilities, or quoted prices for identical or similar assets or liabilities in markets that are not active, or inputs other than quoted prices that are observable for the asset or liability. |
| · | Level 3: Unobservable inputs for the asset or liability. |
As of September 30, 2013, approximately 91 percent of our portfolio company investments were classified as Level 3 in the hierarchy, indicating a high level of judgment required in their valuation.
The values assigned to our assets are based on available information and do not necessarily represent amounts that might ultimately be realized, as these amounts depend on future circumstances and cannot be reasonably determined until the individual investments are actually liquidated or become readily marketable. Upon sale of investments, the values that are ultimately realized may be materially different from what is presently estimated.
Stock-Based Compensation
Determining the appropriate fair-value model and calculating the fair value of share-based awards on the date of grant requires judgment. Historically, we have used the Black-Scholes-Merton option pricing model to estimate the fair value of employee stock options.
Management uses the Black-Scholes-Merton option pricing model in instances where we lack historical data necessary for more complex models and when the share award terms can be valued within the model. Other models may yield fair values that are significantly different from those calculated by the Black-Scholes-Merton option pricing model.
Management uses a binomial lattice option pricing model in instances where it is necessary to include a broader array of assumptions. We used the binomial lattice model for the 10-year NQSOs granted on March 18, 2009, and for performance-based restricted stock awards. These awards included accelerated vesting provisions or target stock prices that were based on market conditions.
Option pricing models require the use of subjective input assumptions, including expected volatility, expected life, expected dividend rate, and expected risk-free rate of return. Variations in the expected volatility or expected term assumptions have a significant impact on fair value. As the volatility or expected term assumptions increase, the fair value of the stock option increases. The expected dividend rate and expected risk-free rate of return are not as significant to the calculation of fair value. A higher assumed dividend rate yields a lower fair value, whereas higher assumed interest rates yield higher fair values for stock options.
In the Black-Scholes-Merton model, we use the simplified calculation of expected term as described in the SEC’s Staff Accounting Bulletin 107 because of the lack of historical information about option exercise patterns. In the binomial lattice model, we use an expected term that assumes the options will be exercised at two-times the strike price because of the lack of option exercise patterns. Future exercise behavior could be materially different than that which is assumed by the model.
| 93 |
Expected volatility is based on the historical fluctuations in the Company's stock. The Company's stock has historically been volatile, which increases the fair value of the underlying share-based awards.
GAAP requires us to develop an estimate of the number of share-based awards that will be forfeited owing to employee turnover. Quarterly changes in the estimated forfeiture rate can have a significant effect on reported share-based compensation, as the effect of adjusting the rate for all expense amortization after the grant date is recognized in the period the forfeiture estimate is changed. If the actual forfeiture rate proves to be higher than the estimated forfeiture rate, then an adjustment will be made to increase the estimated forfeiture rate, which would result in a decrease to the expense recognized in the financial statements. If the actual forfeiture rate proves to be lower than the estimated forfeiture rate, then an adjustment will be made to decrease the estimated forfeiture rate, which would result in an increase to the expense recognized in the financial statements. Such adjustments would affect our operating expenses and additional paid-in capital, but would have no effect on our net asset value.
Pension and Post-Retirement Benefit Plan Assumptions
The Company provides a Retiree Medical Benefit Plan for employees who meet certain eligibility requirements. Until it was terminated on May 5, 2011, the Company also provided an Executive Mandatory Retirement Benefit Plan for certain individuals employed by us in a bona fide executive or high policy-making position. Our former President accrued benefits under this plan prior to his retirement, and the termination of the plan has no impact on his accrued benefits. Several statistical and other factors that attempt to anticipate future events are used in calculating the expense and liability values related to our post-retirement benefit plans. These factors include assumptions we make about the discount rate, the rate of increase in healthcare costs, and mortality, among others.
The discount rate reflects the current rate at which the post-retirement medical benefit and pension liabilities could be effectively settled considering the timing of expected payments for plan participants. In estimating this rate, we consider the Citigroup Pension Liability Index in the determination of the appropriate discount rate assumptions. The weighted average rate we utilized to measure our post retirement medical benefit obligation as of December 31, 2012, and to calculate our 2013 expense was 4.25 percent. The plan amendment was measured at March 1, 2013, using a discount rate of 4.41 percent. We used a discount rate of 2.75 percent to calculate our pension obligation for the Executive Mandatory Retirement Benefit Plan.
Recent Developments - Portfolio Companies
On October 2, 2013, the Company made a $418,066 follow-on investment in SiOnyx, Inc., a privately held portfolio company.
On October 10, 2013, the Company made a $260,870 follow-on investment in AgBiome LLC, a privately held portfolio company.
On October 11, 2013, the Company made a $937,500 follow-on investment in HzO, Inc., a privately held portfolio company.
| 94 |
On October 30, 2013, the Company made an $80,669 follow-on investment in Laser Light Engines, Inc., a privately held portfolio company.
On October 31, 2013, Ancora Pharmaceuticals Inc. sold a substantial portion of its assets, including the use of its corporate name, to Corden. The remaining assets formed a new company, SynGlyco, Inc., of which we continue to own shares. SynGlyco may receive future royalty payments based upon certain sales targets and other terms of the Corden acquisition.
On November 1, 2013, the Company made a $150,000 follow-on investment in OpGen, Inc., a privately held portfolio company.
On November 8, 2013, the Company made a $500,000 follow-on investment in ABSMaterials, Inc., a privately held portfolio company.
Cautionary Statement Regarding Forward-Looking Statements
This Quarterly Report on Form 10-Q contains forward-looking statements that involve substantial risks and uncertainties. These forward-looking statements are not historical facts, but rather are based on current expectations, estimates and projections about the Company, our current and prospective portfolio investments, our industry, our beliefs, and our assumptions. Words such as "anticipates," "expects," "intends," "plans," "will," "may," "continue," "believes," "seeks," "estimates," "would," "could," "should," "targets," "projects," and variations of these words and similar expressions are intended to identify forward-looking statements. The forward-looking statements contained in this Quarterly Report involve risks and uncertainties, including statements as to:
| • | our future operating results; |
| • | our business prospects and the prospects of our portfolio companies; |
| • | the impact of investments that we expect to make; |
| • | our contractual arrangements and relationships with third parties; |
| • | the dependence of our future success on the general economy and its impact on the industries in which we invest; |
| • | the ability of our portfolio companies to achieve their objectives; |
| • | our expected financings and investments; |
| • | the adequacy of our cash resources and working capital; and |
| • | the timing of cash flows, if any, from the operations and/or monetization of our positions in our portfolio companies. |
| 95 |
These statements are not guarantees of future performance and are subject to risks, uncertainties, and other factors, some of which are beyond our control and difficult to predict and could cause actual results to differ materially from those expressed or forecasted in the forward-looking statements, including without limitation:
| • | an economic downturn could impair our portfolio companies’ ability to continue to operate, which could lead to the loss of some or all of our investments in such portfolio companies; |
| • | interest rate volatility could adversely affect our results, particularly if we elect to use leverage as material part of our investment strategy; |
| • | currency fluctuations could adversely affect the results of our investments in foreign companies, particularly to the extent that we receive payments denominated in foreign currency rather than U.S. dollars; and |
| • | the risks, uncertainties and other factors we identify in "Risk Factors" and elsewhere in this Quarterly Report on Form 10-Q and in our other filings with the SEC. |
Although we believe that the assumptions on which these forward-looking statements are based are reasonable, any of those assumptions could prove to be inaccurate, and, as a result, the forward-looking statements based on those assumptions also could be inaccurate. Important assumptions include our ability to originate new investments, certain margins and levels of profitability and the availability of additional capital. In light of these and other uncertainties, the inclusion of a projection or forward-looking statement in this Quarterly Report on Form 10-Q should not be regarded as a representation by us that our plans and objectives will be achieved. These risks and uncertainties include those described or identified in "Risk Factors" and elsewhere in this Quarterly Report on Form 10-Q. You should not place undue reliance on these forward-looking statements, which apply only as of the date of this Quarterly Report on Form 10-Q.
Item 3. Quantitative and Qualitative Disclosures About Market Risk.
Our business activities contain elements of risk. We consider the principal types of market risk to be interest rate risk and foreign currency risk. Although we are risk-seeking rather than risk-averse in our investments, we consider the management of risk to be essential to our business.
Interest Rate Risk
Interest rate sensitivity refers to the change in earnings that may result from changes in the level of interest rates. Our borrowings under our Loan Facility bear interest at a fixed rate of 10 percent per annum, and, therefore, changes in interest rate benchmarks, such as LIBOR, will not affect our earnings on such investments if we decide to fund them through draws from our Loan Facility.
| 96 |
In addition, market interest rates for high-yield corporate debt are an input in determining value of our investments in debt securities of privately held and publicly traded companies. Significant changes in these market rates could affect the value of our debt securities as of the date of measurement of value. Our investment income could be adversely affected should such debt securities include floating interest rates. We do not currently have any investments in debt securities with floating interest rates.
Foreign Currency Risk
Most of our investments are denominated in U.S. dollars. We currently have one investment denominated in Canadian dollars. We are exposed to foreign currency risk related to potential changes in foreign currency exchange rates. The potential loss in fair value on this investment resulting from a 10 percent adverse change in quoted foreign currency exchange rates is $500,724 at September 30, 2013.
Item 4. Controls and Procedures
(a) Disclosure Controls and Procedures. As of the end of the period covered by this report, the Company’s management, under the supervision and with the participation of our chief executive officer and chief financial officer, conducted an evaluation of the effectiveness of the design and operation of our disclosure controls and procedures (as required by Rules 13a-15 of the 1934 Act). Disclosure controls and procedures means controls and other procedures of an issuer that are designed to ensure that information required to be disclosed by the issuer in the reports that it files or submits under the 1934 Act is recorded, processed, summarized and reported, within time periods specified in the SEC's rules and forms, and that such information is accumulated and communicated to the issuer's management, as appropriate, to allow timely decisions regarding required disclosures. As of September 30, 2013, based upon this evaluation of our disclosure controls and procedures, our chief executive officer and chief financial officer concluded that our disclosure controls and procedures were effective.
(b) Changes in Internal Control Over Financial Reporting. There have not been any changes in the Company's internal control over financial reporting (as such term is defined in Rules 13a-15(f) and 15d-15(f) under the 1934 Act) during the third quarter of 2013 to which this report relates that have materially affected, or are reasonably likely to materially affect, the Company’s internal control over financial reporting.
| 97 |
PART II. OTHER INFORMATION
Item 1A. Risk Factors
Investing in our common stock involves significant risks relating to our business and investment objective. You should carefully consider the risks and uncertainties described in our Annual Report on Form 10-K for the year ended December 31, 2012, before you purchase any of our common stock.
The risks described in our Annual Report on Form 10-K are not the only risks facing our Company. Unknown additional risks and uncertainties, or ones that we currently consider immaterial, may also impair our business. If any of these risks or uncertainties materialize, our business, financial condition or results of operations could be materially adversely affected. In this event, the trading price of our common stock could decline, and you could lose all or part of your investment.
Changes in valuations of early-stage small businesses tend to be more volatile than changes in prices of established, more mature securities.
Investments in early- and mid-stage small businesses may be inherently more volatile than investments in more mature businesses. Such immature businesses are inherently fragile and easily affected by both internal and external forces. Our investee companies can lose much or all of their value suddenly in response to an internal or external adverse event. Conversely, these immature small businesses can gain suddenly in value in response to an internal or external positive development. Moreover, because of the lack of daily pricing mechanisms of our privately held companies, our ownership interests in such investments are generally valued only at quarterly intervals by our Valuation Committee. Thus, changes in valuations from one valuation point to another may be larger than changes in valuations of marketable securities that are revalued in the marketplace much more frequently, in some highly liquid cases, virtually continuously. Although we carefully monitor each of our portfolio companies, information pertinent to our portfolio companies is not always known immediately by us, and, therefore, its availability for use in determining value may not always coincide with the timeframe of our valuations required by the federal securities laws.
As of September 30, 2013, our shares of Champions Oncology, Inc., which trades on an OTC exchange, were valued using the closing price at the end of the quarter as required by the 1940 Act. In quarters prior to June 30, 2013, these shares were fair valued by our Board of Directors owing to our determination that there was not an active market as of the dates of valuation. If in future quarters, shares of Champions Oncology do not continue to trade in an active market as of the dates of valuation, the value of our shares could be materially different.
Additionally, we may price or invest in rounds at lower valuations than prior rounds of financing and/or previously reported valuations in order to receive more favorable terms, such as increased ownership percentages or liquidation preferences, which may result in decreased valuations in the interim. These decreases could be material.
| 98 |
We may elect not to be treated as a RIC if we are not able to qualify as a RIC in any given year.
In order to qualify for the special treatment accorded to RICs, we must meet certain income source, asset diversification and annual distribution requirements. Recent changes in our business, including our strategy of taking larger positions in our portfolio companies and increased holding periods to exit through IPOs or M&A transactions, have created more risk specifically relating to the asset diversification requirements of maintaining our special tax status. To qualify as a RIC, we must meet certain asset diversification requirements at the end of each quarter of our taxable year. Failure to meet these tests in any year may result in the loss of RIC status. Because our ownership percentages in our portfolio have grown over the last several years, we have at least two companies with significant valuations that are not qualifying assets for the purpose of the RIC test. As long as the aggregate values of these non-qualifying assets remain below 50 percent of total assets, we will continue to qualify as a RIC. It becomes more difficult to pass this test when companies in our portfolio are successful and we want to invest more capital in those companies to increase our investment returns. Rather than selling portfolio companies that are performing well in order to pass our RIC diversification tests, we may opt instead to not qualify as a RIC. If we fail to qualify for special tax treatment accorded to RICs for failure of our RIC diversification tests, or for any other reason, we will be subject to corporate-level income tax on our income.
If we are unable to comply with the covenants or restrictions of the Loan Facility, our business could be materially adversely affected.
The Loan Facility contains certain affirmative and negative covenants, including without limitation: (a) maintenance of certain minimum liquidity requirements; (b) maintenance of an eligible asset leverage ratio of not less than 4.0:1.0; (c) limitations on liens; (d) limitations on the incurrence of additional indebtedness; and (e) limitations on structural changes, mergers and disposition of assets (other than in the normal course of our business activities). Complying with these restrictions may prevent the Company from taking actions that we believe would help it to grow its business or are otherwise consistent with its investment objective. These restrictions could also limit the Company's ability to plan for or react to market conditions or meet extraordinary capital needs or otherwise restrict corporate activities. For example, these restrictions, as currently in effect, would prohibit the Company from or subject it to limitations on incurring any additional indebtedness, which would include issuing any debt securities.
The breach of any of the covenants or restrictions, unless cured within the applicable grace period, would result in a default under the Loan Facility that would permit the lenders thereunder to declare all amounts outstanding to be due and payable. Because the Loan Facility is secured by all the assets of the Company, in such an event, the Company may be forced to sell assets to repay such indebtedness. As a result, any default could cause the Company to sell portfolio company securities at a time that may not be advantageous and could have serious consequences to our financial condition. The Company may not be granted waivers or amendments to the Loan Facility if, for any reason, it is unable to comply with it, and the Company may not be able to refinance the Loan Facility on terms acceptable to it, or at all.
| 99 |
Successful portfolio companies do not always result in positive investment returns.
Depending on the amount and timing of our investments in our portfolio companies, even if a portfolio company is ultimately successful, the returns on our investment in such portfolio company may not be positive. Venture-backed companies often receive capital from venture capitalists in rounds of financing. Depending on the amount of capital that it takes to operate a company until it either becomes cash flow positive or seeks to exit through an IPO or M&A transaction, each round of financing may have different terms, including liquidation preferences and control over company decisions. Depending on which rounds of financings the Company participates in and the terms of the last round of financing, the investment returns for any particular round may be higher or lower than others. Furthermore, venture-backed companies often require more capital than originally expected, and the ultimate value of those companies at realization may not be greater than the capital invested. Each of these scenarios and others could lead to a realized loss on an investment in an ultimately successful company.
A failure or the perceived risk of a failure to raise the statutory debt limit of the United States, or a shutdown of the United States federal government, could have a material adverse effect on our business, financial condition and results of operations.
As has been widely reported, the United States Treasury Secretary has stated that the federal government may not be able to meet its debt payments in the relatively near future unless the federal debt ceiling is raised. If legislation increasing the debt ceiling is not enacted and the debt ceiling is reached, the federal government may stop or delay making payments on its obligations. A failure by Congress to raise the debt limit would increase the risk of default by the United States on its obligations, as well as the risk of other economic dislocations.
If the United States government fails to complete its budget process or to provide for a continuing resolution before the expiration of the current continuing resolution, a federal government shutdown may result. Such a failure or the perceived risk of such a failure consequently could have a material adverse effect on the financial markets and economic conditions in the United States and throughout the world. It could also limit our ability and the ability of our portfolio companies to obtain financing, and it could have a material adverse effect on the valuation of our portfolio companies. Consequently, the continued uncertainty in the general economic environment, including the recent government shutdown and potential debt ceiling implications, as well as in specific economies of several individual geographic markets in which our portfolio companies operate, could adversely affect our business, financial condition and results of operations.
| 100 |
Item 6. Exhibits
| 10.1 | $20,000,000 Multi-Draw Term Loan Facility Credit Agreement, by and among the Company, as borrower, Orix Corporate Capital, Inc., as Administrative Agent, and the other lenders party thereto from time to time, incorporated by reference as Exhibit 10.1 to the Company's Form 8-K (File No. 814-00176) filed on September 30, 2013. | |
| 10.2 | Form of Indemnification Agreement, incorporated by reference as Exhibit 10.1 to the Company's Form 8-K (File No. 814-00176) filed on November 1, 2013. | |
| 31.01* | Certification of CEO pursuant to Section 302 of the Sarbanes-Oxley Act of 2002. | |
| 31.02* | Certification of CFO pursuant to Section 302 of the Sarbanes-Oxley Act of 2002. | |
| 32* | Certification of CEO and CFO pursuant to 18 U.S.C. Section 1350, as adopted pursuant to Section 906 of the Sarbanes-Oxley Act of 2002. |
*filed herewith
| 101 |
SIGNATURES
Pursuant to the requirements of the Securities Exchange Act of 1934, the Registrant has caused this report to be signed on its behalf by the undersigned thereunto duly authorized.
| Harris & Harris Group, Inc. | ||
| /s/ | Douglas W. Jamison | |
| By: | Douglas W. Jamison | |
| Chief Executive Officer | ||
| /s/ | Patricia N. Egan | |
| By: | Patricia N. Egan | |
| Chief Financial Officer | ||
Date: November 12, 2013
| 102 |
EXHIBIT INDEX
| Exhibit No. | Description | |
| 31.01 | Certification of CEO pursuant to Section 302 of the Sarbanes-Oxley Act of 2002. | |
| 31.02 | Certification of CFO pursuant to Section 302 of the Sarbanes-Oxley Act of 2002. | |
| 32 | Certification of CEO and CFO pursuant to 18 U.S.C. Section 1350, as adopted pursuant to Section 906 of the Sarbanes-Oxley Act of 2002. |
| 103 |