10-Q: Quarterly report [Sections 13 or 15(d)]
Published on November 8, 2010
UNITED
STATES
SECURITIES
AND EXCHANGE COMMISSION
WASHINGTON,
D. C. 20549
Form
10-Q
x QUARTERLY
REPORT PURSUANT TO SECTION 13 OR 15(d) OF THE SECURITIES EXCHANGE ACT OF
1934
For the
quarterly period ended September 30, 2010
o TRANSITION
REPORT PURSUANT TO SECTION 13 OR 15(d) OF THE SECURITIES EXCHANGE ACT OF
1934
For the
transition period from ____________ to _____________
Commission
file number: 0-11576
|
HARRIS & HARRIS GROUP,
INC.
|
(Exact
Name of Registrant as Specified in Its Charter)
|
New York
|
13-3119827
|
|
(State
or Other Jurisdiction of
|
(I.R.S.
Employer Identification No.)
|
|
Incorporation
or Organization)
|
|
1450 Broadway, New York, New
York
|
10018
|
|
(Address
of Principal Executive Offices)
|
(Zip
Code)
|
|
(212)
582-0900
|
(Registrant's
Telephone Number, Including Area Code)
Indicate
by check mark whether the registrant: (1) has filed all reports required to be
filed by Section 13 or 15(d) of the Securities Exchange Act of 1934 during the
preceding 12 months (or for such shorter period that the registrant was required
to file such reports), and (2) has been subject to such filing requirements for
the past 90 days.
|
Yes
|
x
|
No
|
¨
|
Indicate
by check mark whether the registrant has submitted electronically and posted on
its corporate Web site, if any, every Interactive Data File required to be
submitted and posted pursuant to Rule 405 of Regulation S-T during the preceding
12 months (or for such shorter period that the registrant was required to submit
and post such files).
|
Yes
|
x
|
No
|
¨
|
Indicate
by check mark whether the registrant is a large accelerated filer, an
accelerated filer, a non-accelerated filer, or a smaller reporting
company. See the definitions of "large accelerated filer,"
"accelerated filer" and "smaller reporting company" in Rule 12b-2 of the
Exchange Act. (Check one):
|
Large
accelerated filer ¨
|
Accelerated
filer x
|
|
|
Non-accelerated
filer ¨
|
Smaller
reporting company ¨
|
(Do
not check if a smaller reporting company)
Indicate by check mark whether the
registrant is a shell company (as defined in Rule 12b-2 of the Exchange
Act).
|
Yes
|
¨
|
No
|
x
|
Indicate
the number of shares outstanding of each of the issuer's classes of common
stock, as of the latest practicable date.
|
Class
|
Outstanding at November 8,
2010
|
|
|
Common
Stock, $0.01 par value per share
|
30,872,858
shares
|
Harris
& Harris Group, Inc.
Form
10-Q, September 30, 2010
|
Page
Number
|
|
|
PART
I. FINANCIAL INFORMATION
|
|
|
Item
1. Consolidated Financial Statements
|
1
|
|
Consolidated
Statements of Assets and Liabilities
|
2
|
|
Consolidated
Statements of Operations
|
3
|
|
Consolidated
Statements of Cash Flows
|
4
|
|
Consolidated
Statements of Changes in Net Assets
|
5
|
|
Consolidated
Schedule of Investments
|
6
|
|
Notes
to Consolidated Financial Statements
|
32
|
|
Financial
Highlights
|
43
|
|
Item
2. Management's Discussion and Analysis of Financial
Condition
|
|
|
and
Results of Operations
|
44
|
|
Background
and Overview
|
44
|
|
Investment
Strategy
|
45
|
|
Historical
Investments
|
45
|
|
Investment
Pace
|
46
|
|
Importance
of Availability of Liquid Capital
|
46
|
|
Involvement
with Portfolio Companies
|
48
|
|
Commercialization
of Nanotechnology by Our Portfolio Companies
|
48
|
|
Maturity
of Current Venture Capital Portfolio
|
51
|
|
Current
Business Environment
|
54
|
|
Valuation
of Investments
|
55
|
|
Investment
Objective
|
59
|
|
Results
of Operations
|
60
|
|
Financial
Condition
|
68
|
|
Liquidity
|
70
|
|
Capital
Resources
|
71
|
|
Critical
Accounting Policies
|
71
|
|
Recent
Developments – Portfolio Companies
|
74
|
|
Forward-Looking
Statements
|
74
|
|
Item
3. Quantitative and Qualitative Disclosures About Market
Risk
|
75
|
|
Item
4. Controls and Procedures
|
77
|
|
PART
II. OTHER INFORMATION
|
|
|
Item
1A. Risk Factors
|
78
|
|
Item
5. Exhibits
|
79
|
|
Signatures
|
80
|
|
Exhibit
Index
|
81
|
PART
I. FINANCIAL INFORMATION
Item
1. Consolidated Financial Statements
The information furnished in the
accompanying consolidated financial statements reflects all adjustments that
are, in the opinion of management, necessary for a fair statement of the results
for the interim period presented.
Harris & Harris Group, Inc.® (the
"Company," "us," "our" and "we"), is an internally managed venture capital
company that has elected to operate as a business development company ("BDC")
under the Investment Company Act of 1940 (the "1940 Act"). Certain
information and disclosures normally included in the consolidated financial
statements in accordance with accounting principles generally accepted in the
United States of America ("GAAP") have been condensed or omitted as permitted by
Regulation S-X and Regulation S-K. Accordingly, they do not include
all information and disclosures necessary for a presentation of our financial
position, results of operations and cash flows in conformity with
GAAP. The results of operations for any interim period are not
necessarily indicative of the results for the full year. The
accompanying consolidated financial statements should be read in conjunction
with the audited consolidated financial statements and notes thereto contained
in our Annual Report on Form 10-K for the year ended December 31,
2009.
1
|
HARRIS
& HARRIS GROUP, INC.
CONSOLIDATED
STATEMENTS OF ASSETS AND
LIABILITIES
|
|
ASSETS
|
||||||||
|
September
30, 2010
|
December
31, 2009
|
|||||||
|
(Unaudited)
|
||||||||
|
Investments,
in portfolio securities at value:
|
||||||||
|
Unaffiliated
privately held companies
|
||||||||
|
(cost:
$37,470,081 and $26,977,200, respectively)
|
$ | 47,369,210 | $ | 21,656,436 | ||||
|
Unaffiliated
publicly traded securities
|
||||||||
|
(cost:
$0 and $298,827, respectively)
|
0 | 226,395 | ||||||
|
Non-controlled
affiliated privately held companies
|
||||||||
|
(cost:
$51,536,674 and $54,864,948, respectively)
|
40,978,655 | 50,297,220 | ||||||
|
Controlled
affiliated privately held companies
|
||||||||
|
(cost: $9,380,567 and $10,248,932, respectively)
|
8,431,564 | 5,843,430 | ||||||
|
Total,
investments in privately held and publicly
|
||||||||
|
traded
securities at value
|
||||||||
|
(cost:
$98,387,322 and $92,389,907, respectively)
|
$ | 96,779,429 | $ | 78,023,481 | ||||
|
Investments,
in U.S. Treasury obligations at value
|
||||||||
|
(cost:
$43,861,592 and $55,960,024, respectively)
|
43,860,344 | 55,947,581 | ||||||
|
Cash
|
256,103 | 1,611,465 | ||||||
|
Restricted
funds
|
2,001 | 2,000 | ||||||
|
Receivable
from portfolio company
|
10,000 | 28,247 | ||||||
|
Interest
receivable
|
2,104 | 25,832 | ||||||
|
Prepaid
expenses
|
97,996 | 94,129 | ||||||
|
Other
assets
|
622,244 | 376,366 | ||||||
|
Total
assets
|
$ | 141,630,221 | $ | 136,109,101 | ||||
|
LIABILITIES & NET
ASSETS
|
||||||||
|
Post
retirement plan liabilities
|
$ | 1,471,159 | $ | 1,369,843 | ||||
|
Accounts
payable and accrued liabilities
|
532,717 | 579,162 | ||||||
|
Deferred
rent
|
345,835 | 1,838 | ||||||
|
Total
liabilities
|
2,349,711 | 1,950,843 | ||||||
|
Net
assets
|
$ | 139,280,510 | $ | 134,158,258 | ||||
|
Net
assets are comprised of:
|
||||||||
|
Preferred
stock, $0.10 par value,
|
||||||||
|
2,000,000
shares authorized; none issued
|
$ | 0 | $ | 0 | ||||
|
Common
stock, $0.01 par value, 45,000,000 shares authorized at
|
||||||||
|
09/30/10
and 12/31/09; 32,698,945 issued at 09/30/10
|
||||||||
|
and
32,688,333 issued at 12/31/09
|
326,990 | 326,884 | ||||||
|
Additional
paid in capital (Note 8)
|
207,714,612 | 205,977,117 | ||||||
|
Accumulated
net operating and realized loss
|
(63,746,420 | ) | (54,361,343 | ) | ||||
|
Accumulated
unrealized depreciation of investments
|
(1,609,141 | ) | (14,378,869 | ) | ||||
|
Treasury
stock, at cost (1,828,740 shares at 09/30/10 and 12/31/09)
|
(3,405,531 | ) | (3,405,531 | ) | ||||
|
Net
assets
|
$ | 139,280,510 | $ | 134,158,258 | ||||
|
Shares
outstanding
|
30,870,205 | 30,859,593 | ||||||
|
Net
asset value per outstanding share
|
$ | 4.51 | $ | 4.35 | ||||
The
accompanying notes are an integral part of these consolidated financial
statements.
2
|
HARRIS
& HARRIS GROUP, INC.
CONSOLIDATED
STATEMENTS OF OPERATIONS
(Unaudited)
|
|
Three Months Ended Sept.
30,
|
Nine Months Ended Sept. 30,
|
|||||||||||||||
|
2010
|
2009
|
2010
|
2009
|
|||||||||||||
|
Investment
income:
|
||||||||||||||||
|
Interest
from:
|
||||||||||||||||
|
Fixed-income
securities and
|
||||||||||||||||
|
bridge
notes (Note 3)
|
$ | 134,097 | $ | 99,677 | $ | 330,378 | $ | 138,862 | ||||||||
|
Miscellaneous
income
|
6,348 | 6,000 | 18,348 | 27,088 | ||||||||||||
|
Total investment
income
|
140,445 | 105,677 | 348,726 | 165,950 | ||||||||||||
|
Expenses:
|
||||||||||||||||
|
Salaries,
benefits and stock-based
|
||||||||||||||||
|
compensation
(Note 6)
|
1,327,055 | 1,727,743 | 4,181,852 | 4,621,680 | ||||||||||||
|
Administration
and operations
|
201,222 | 225,044 | 711,990 | 746,640 | ||||||||||||
|
Professional
fees
|
136,643 | 190,942 | 556,878 | 558,483 | ||||||||||||
|
Rent
(Note 3)
|
136,879 | 79,617 | 303,239 | 236,678 | ||||||||||||
|
Directors’
fees and expenses
|
70,359 | 79,136 | 251,280 | 252,745 | ||||||||||||
|
Custody
fees
|
24,000 | 33,515 | 72,000 | 51,457 | ||||||||||||
|
Depreciation
|
13,151 | 12,633 | 38,940 | 38,370 | ||||||||||||
|
Lease
termination costs (Note 3)
|
0 | 0 | 68,038 | 0 | ||||||||||||
|
Total
expenses
|
1,909,309 | 2,348,630 | 6,184,217 | 6,506,053 | ||||||||||||
|
Net
operating loss
|
(1,768,864 | ) | (2,242,953 | ) | (5,835,491 | ) | (6,340,103 | ) | ||||||||
|
Net
realized gain (loss):
|
||||||||||||||||
|
Realized
gain (loss) from investments:
|
||||||||||||||||
|
Unaffiliated
companies
|
0 | 0 | 13,218 | (1,514,330 | ) | |||||||||||
|
Non-Controlled
affiliated companies
|
(3,136,552 | ) | (3,176,125 | ) | (3,393,559 | ) | (3,176,125 | ) | ||||||||
|
Publicly
traded companies
|
0 | 0 | (152,980 | ) | 0 | |||||||||||
|
U.S.
Treasury obligations/other
|
(311 | ) | 0 | (11,834 | ) | (325 | ) | |||||||||
|
Realized loss from
investments
|
(3,136,863 | ) | (3,176,125 | ) | (3,545,155 | ) | (4,690,780 | ) | ||||||||
|
Income
tax expense (benefit) (Note 7)
|
1,799 | (2,862 | ) | 4,431 | (753 | ) | ||||||||||
|
Net realized
loss
|
(3,138,662 | ) | (3,173,263 | ) | (3,549,586 | ) | (4,690,027 | ) | ||||||||
|
Net
decrease in unrealized
|
||||||||||||||||
|
depreciation
on investments:
|
||||||||||||||||
|
Change
as a result of investment sales
|
3,136,552 | 3,180,240 | 3,358,871 | 4,691,282 | ||||||||||||
|
Change
on investments held
|
1,316,942 | 1,939,657 | 9,410,857 | 5,512,472 | ||||||||||||
|
Net decrease in
unrealized
|
||||||||||||||||
|
depreciation
on investments
|
4,453,494 | 5,119,897 | 12,769,728 | 10,203,754 | ||||||||||||
|
Net
(decrease) increase in net assets
|
||||||||||||||||
|
resulting
from operations
|
$ | (454,032 | ) | $ | (296,319 | ) | $ | 3,384,651 | $ | (826,376 | ) | |||||
|
Per
average basic outstanding share
|
$ | (0.01 | ) | $ | (0.01 | ) | $ | 0.11 | $ | (0.03 | ) | |||||
|
Average
outstanding shares
|
30,866,399 | 25,866,983 | 30,863,616 | 25,862,070 | ||||||||||||
The
accompanying notes are an integral part of these consolidated financial
statements.
3
|
HARRIS
& HARRIS GROUP, INC.
CONSOLIDATED
STATEMENTS OF CASH FLOWS
(Unaudited)
|
|
Nine
Months Ended
|
Nine
Months Ended
|
|||||||
|
September
30, 2010
|
September
30, 2009
|
|||||||
|
Cash
flows used in operating activities:
|
||||||||
|
Net
increase (decrease) in net assets resulting from
operations
|
$ | 3,384,651 | $ | (826,376 | ) | |||
|
Adjustments
to reconcile net increase (decrease) in net assets
|
||||||||
|
resulting
from operations to net cash used in operating activities:
|
||||||||
|
Net
realized and unrealized gain on investments
|
(9,224,573 | ) | (5,512,974 | ) | ||||
|
Depreciation
of fixed assets, amortization of premiums or
|
||||||||
|
discounts
and bridge note interest
|
(260,793 | ) | 39,784 | |||||
|
Stock-based
compensation expense
|
1,746,734 | 2,425,525 | ||||||
|
Changes in assets and liabilities:
|
||||||||
|
Restricted
funds
|
(1 | ) | 189,970 | |||||
|
Receivable
from portfolio company
|
18,247 | 0 | ||||||
|
Other
receivables
|
7,187 | (217 | ) | |||||
|
Return
of security deposits on leased properties
|
44,376 | 0 | ||||||
|
Interest
receivable
|
11,513 | 2,044 | ||||||
|
Income
tax receivable
|
0 | (3,353 | ) | |||||
|
Prepaid
expenses
|
(3,867 | ) | 335,914 | |||||
|
Other
assets
|
(227,512 | ) | (186,116 | ) | ||||
|
Post
retirement plan liabilities
|
101,316 | (60,403 | ) | |||||
|
Accounts
payable and accrued liabilities
|
(46,445 | ) | (147,329 | ) | ||||
|
Deferred
rent
|
343,997 | (4,727 | ) | |||||
|
Net
cash used in operating activities
|
(4,105,170 | ) | (3,748,258 | ) | ||||
|
Cash
flows from investing activities:
|
||||||||
|
Purchase
of U.S. government securities
|
(58,644,919 | ) | (112,308,457 | ) | ||||
|
Sale
of U.S. government securities
|
70,746,244 | 123,988,254 | ||||||
|
Investments
in affiliated portfolio companies
|
(7,489,948 | ) | (6,561,959 | ) | ||||
|
Investments
in unaffiliated portfolio companies
|
(2,177,123 | ) | (973,915 | ) | ||||
|
Proceeds
from conversion of bridge note
|
1,356 | 0 | ||||||
|
Proceeds
from sale of investments
|
407,543 | 7,365 | ||||||
|
Purchase
of fixed assets
|
(84,212 | ) | (1,313 | ) | ||||
|
Net
cash provided by investing activities
|
2,758,941 | 4,149,975 | ||||||
|
Cash
flows from financing activities:
|
||||||||
|
Proceeds
from stock option exercises
|
39,795 | 401,944 | ||||||
|
Payment
of offering costs
|
(48,928 | ) | 0 | |||||
|
Net
cash (used in) provided by financing activities
|
(9,133 | ) | 401,944 | |||||
|
Net
decrease in cash:
|
||||||||
|
Cash
at beginning of the period
|
1,611,465 | 692,309 | ||||||
|
Cash
at end of the period.
|
256,103 | 1,495,970 | ||||||
|
Net
(decrease) increase in cash
|
$ | (1,355,362 | ) | $ | 803,661 | |||
|
Supplemental
disclosures of cash flow information:
|
||||||||
|
Income
taxes paid
|
$ | 4,431 | $ | 2,179 | ||||
The
accompanying notes are an integral part of these consolidated financial
statements.
4
|
HARRIS
& HARRIS GROUP, INC.
CONSOLIDATED
STATEMENTS OF CHANGES IN NET
ASSETS
|
|
Nine
Months Ended
|
Year
Ended
|
|||||||
|
September
30, 2010
|
December
31, 2009
|
|||||||
|
(Unaudited)
|
||||||||
|
Changes
in net assets from operations:
|
||||||||
|
Net
operating loss
|
$ | (5,835,491 | ) | $ | (8,761,215 | ) | ||
|
Net
realized loss on investments
|
(3,549,586 | ) | (11,105,577 | ) | ||||
|
Net
decrease in unrealized depreciation
|
||||||||
|
on
investments as a result of sales
|
3,358,871 | 11,090,579 | ||||||
|
Net
decrease in unrealized depreciation
|
||||||||
|
on
investments held
|
9,410,857 | 8,627,748 | ||||||
|
Net
increase (decrease) in net assets resulting
|
||||||||
|
from
operations
|
3,384,651 | (148,465 | ) | |||||
|
Changes
in net assets from capital
|
||||||||
|
stock
transactions:
|
||||||||
|
Issuance
of common stock upon the
|
||||||||
|
exercise
of stock options
|
106 | 1,125 | ||||||
|
Issuance
of common stock on offering
|
0 | 48,875 | ||||||
|
Additional
paid-in capital on common
|
||||||||
|
stock
issued and options exercised
|
(9,239 | ) | 21,636,090 | |||||
|
Stock-based
compensation expense
|
1,746,734 | 3,089,520 | ||||||
|
Net
increase in net assets resulting from
|
||||||||
|
capital
stock transactions
|
1,737,601 | 24,775,610 | ||||||
|
Net
increase in net assets
|
5,122,252 | 24,627,145 | ||||||
|
Net
assets:
|
||||||||
|
Beginning
of the period
|
134,158,258 | 109,531,113 | ||||||
|
End
of the period
|
$ | 139,280,510 | $ | 134,158,258 | ||||
The
accompanying notes are an integral part of these consolidated financial
statements.
5
|
HARRIS & HARRIS GROUP,
INC.
CONSOLIDATED
SCHEDULE OF INVESTMENTS AS OF SEPTEMBER 30, 2010
(Unaudited)
|
|
Method
of
|
Shares/
|
|||||||||
|
Valuation (1)
|
Industry (2)
|
Principal
|
Value
|
|||||||
|
Investments
in Unaffiliated Companies (3)(4) – 34.0% of
|
||||||||||
|
net
assets at value
|
||||||||||
|
Private
Placement Portfolio (Illiquid) – 34.0% of net assets
|
||||||||||
|
at
value
|
||||||||||
|
BioVex
Group, Inc. (5)(6)(7)(8) -- Developing novel
|
Healthcare/
|
|||||||||
|
biologics
for treatment of cancer and infectious disease
|
Biotech
|
|||||||||
|
Series
E Convertible Preferred Stock
|
(M)
|
2,799,552 | $ | 1,303,583 | ||||||
|
Series
G Convertible Preferred Stock
|
(M)
|
6,964,034 | 1,462,448 | |||||||
|
Warrants
for Series G Convertible Preferred
|
||||||||||
|
Stock
expiring 11/5/16
|
( I
)
|
285,427 | 21,407 | |||||||
| 2,787,438 | ||||||||||
|
Bridgelux,
Inc. (5)(6) -- Manufacturing high-power light
|
Cleantech
|
|||||||||
|
emitting
diodes (LEDs) and arrays
|
||||||||||
|
Series
B Convertible Preferred Stock
|
(M)
|
1,861,504 | 1,759,121 | |||||||
|
Series
C Convertible Preferred Stock
|
(M)
|
2,130,699 | 2,013,511 | |||||||
|
Series
D Convertible Preferred Stock
|
(M)
|
999,999 | 944,998 | |||||||
|
Warrants
for Series C Convertible Preferred
|
||||||||||
|
Stock
expiring 12/31/14
|
( I
)
|
163,900 | 91,128 | |||||||
|
Warrants
for Series D Convertible Preferred
|
||||||||||
|
Stock
expiring 8/26/14
|
( I
)
|
166,665 | 64,833 | |||||||
| 4,873,591 | ||||||||||
|
Cobalt
Technologies, Inc. (5)(6)(7)(9) -- Developing processes
for
|
Cleantech
|
|||||||||
|
making
biobutanol through biomass fermentation
|
||||||||||
|
Series
C Convertible Preferred Stock
|
(M)
|
352,112 | 375,000 | |||||||
|
Ensemble
Therapeutics Corporation (5)(6)(10) -- Developing
DNA-
|
Healthcare/
|
|||||||||
|
Programmed
ChemistryTM for the discovery of new classes
of
|
Biotech
|
|||||||||
|
therapeutics
|
||||||||||
|
Series
B Convertible Preferred Stock
|
(M)
|
1,449,275 | 2,000,000 | |||||||
|
Unsecured
Convertible Bridge Notes (including interest)
|
(M)
|
$ | 299,169 | 343,473 | ||||||
| 2,343,473 | ||||||||||
|
GEO
Semiconductor Inc. (7)(13) -- Developing programmable,
|
Electronics/
|
|||||||||
|
high-performance
video and geometry processing solutions
|
Semi-
|
|||||||||
|
Participation
Agreement with Montage Capital relating
|
conductors
|
|||||||||
|
to
the following assets:
|
||||||||||
|
Senior
Secured Debt, 13.75%, maturing on 06/30/12
|
( I
)
|
$ | 500,000 | 443,600 | ||||||
|
Warrants
for Series A Preferred Stock expiring on 09/17/17
|
( I
)
|
100,000 | 46,800 | |||||||
| 490,400 | ||||||||||
|
|
The
accompanying notes are an integral part of these consolidated financial
statements.
|
6
|
HARRIS & HARRIS GROUP,
INC.
CONSOLIDATED SCHEDULE OF
INVESTMENTS AS OF SEPTEMBER 30,
2010
(Unaudited)
|
|
Method
of
|
Shares/
|
|||||||||
|
Valuation (1)
|
Industry (2)
|
Principal
|
Value
|
|||||||
|
Investments
in Unaffiliated Companies (3)(4) – 34.0% of
|
||||||||||
|
net
assets at value (Cont.)
|
||||||||||
|
Private
Placement Portfolio (Illiquid) – 34.0% of net assets
|
||||||||||
|
at
value (Cont.)
|
||||||||||
|
Electronics/
|
||||||||||
|
Molecular
Imprints, Inc. (5)(6) -- Manufacturing nanoimprint
|
Semi-
|
|||||||||
|
lithography
capital equipment
|
conductors
|
|||||||||
|
Series
B Convertible Preferred Stock
|
(M)
|
1,333,333 | $ | 2,000,000 | ||||||
|
Series
C Convertible Preferred Stock
|
(M)
|
1,250,000 | 1,875,000 | |||||||
|
Warrants
for Series C Convertible Preferred
|
||||||||||
|
Stock
expiring 12/31/11
|
( I
)
|
125,000 | 69,875 | |||||||
| 3,944,875 | ||||||||||
|
Nanosys,
Inc. (5)(6) -- Developing inorganic nanowires and
|
Cleantech
|
|||||||||
|
quantum
dots for use in batteries and LED-backlit devices
|
||||||||||
|
Series
C Convertible Preferred Stock
|
(M)
|
803,428 | 1,021,835 | |||||||
|
Series
D Convertible Preferred Stock
|
(M)
|
1,016,950 | 1,382,573 | |||||||
|
Series
E Convertible Preferred Stock
|
(M)
|
433,688 | 496,573 | |||||||
| 2,900,981 | ||||||||||
|
Electronics/
|
||||||||||
|
Nantero,
Inc. (5)(6)(7) -- Developing a high-density, nonvolatile,
|
Semi-
|
|||||||||
|
random
access memory chip, enabled by carbon nanotubes
|
conductors
|
|||||||||
|
Series
A Convertible Preferred Stock
|
(M)
|
345,070 | 1,046,908 | |||||||
|
Series
B Convertible Preferred Stock
|
(M)
|
207,051 | 628,172 | |||||||
|
Series
C Convertible Preferred Stock
|
(M)
|
188,315 | 571,329 | |||||||
| 2,246,409 | ||||||||||
|
NeoPhotonics
Corporation (5)(6) -- Developing and manufacturing
|
Other
|
|||||||||
|
optical
devices and components
|
||||||||||
|
Common
Stock
|
(M)
|
1,130,440 | 931,483 | |||||||
|
Series
1 Convertible Preferred Stock
|
(M)
|
1,831,256 | 1,508,955 | |||||||
|
Series
2 Convertible Preferred Stock
|
(M)
|
741,898 | 611,324 | |||||||
|
Series
3 Convertible Preferred Stock
|
(M)
|
2,750,000 | 2,266,000 | |||||||
|
Series
X Convertible Preferred Stock
|
(M)
|
8,923 | 1,427,680 | |||||||
| 6,745,442 | ||||||||||
|
Polatis,
Inc. (5)(6)(7) -- Developing MEMS-based optical
|
Other
|
|||||||||
|
networking
components
|
||||||||||
|
Common
Stock
|
(M)
|
16,438 | 0 | |||||||
|
Series
A-1 Convertible Preferred Stock
|
(M)
|
16,775 | 0 | |||||||
|
Series
A-2 Convertible Preferred Stock
|
(M)
|
71,611 | 0 | |||||||
|
Series
A-4 Convertible Preferred Stock
|
(M)
|
4,774 | 0 | |||||||
| 0 | ||||||||||
|
|
The
accompanying notes are an integral part of these consolidated financial
statements.
|
7
|
HARRIS & HARRIS GROUP,
INC.
CONSOLIDATED SCHEDULE OF
INVESTMENTS AS OF SEPTEMBER 30,
2010
(Unaudited)
|
|
Method
of
|
Shares/
|
|||||||||
|
Valuation (1)
|
Industry (2)
|
Principal
|
Value
|
|||||||
|
Investments
in Unaffiliated Companies (3)(4) – 34.0% of
|
||||||||||
|
net
assets at value (Cont.)
|
||||||||||
|
Private
Placement Portfolio (Illiquid) – 34.0% of net assets
|
||||||||||
|
at
value (Cont.)
|
||||||||||
|
PolyRemedy,
Inc. (5)(6)(7) -- Developing a platform for
|
Healthcare/
|
|||||||||
|
producing
and tracking the use of wound treatment patches
|
Biotech
|
|||||||||
|
Series
B-1 Convertible Preferred Stock
|
(M)
|
287,647 | $ | 23,466 | ||||||
|
Series
B-2 Convertible Preferred Stock
|
(M)
|
676,147 | 30,427 | |||||||
| 53,893 | ||||||||||
|
Siluria
Technologies, Inc. (5)(6)(7) -- Developing nanomaterials
|
Cleantech
|
|||||||||
|
for
manufacturing of chemicals
|
||||||||||
|
Series
S-2 Convertible Preferred Stock
|
(M)
|
612,061 | 204,000 | |||||||
|
Solazyme,
Inc. (5)(6)(7) -- Developing algal biodiesel, industrial
|
Cleantech
|
|||||||||
|
chemicals
and specialty ingredients using synthetic biology
|
||||||||||
|
Series
A Convertible Preferred Stock
|
(M)
|
988,204 | 8,750,744 | |||||||
|
Series
B Convertible Preferred Stock
|
(M)
|
495,246 | 4,385,502 | |||||||
|
Series
C Convertible Preferred Stock
|
(M)
|
651,309 | 5,767,471 | |||||||
|
Series
D Convertible Preferred Stock
|
(M)
|
169,390 | 1,499,991 | |||||||
| 20,403,708 | ||||||||||
|
TetraVitae
Bioscience, Inc. (5)(6)(7)(11) -- Developing methods
|
Cleantech
|
|||||||||
|
of
producing alternative chemicals and fuels through biomass
|
||||||||||
|
fermentation
|
||||||||||
|
Series
B Convertible Preferred Stock
|
(M)
|
118,804 | 0 | |||||||
|
Total
Unaffiliated Private Placement Portfolio (cost:
$37,470,081)
|
$ | 47,369,210 | ||||||||
|
Total
Investments in Unaffiliated Companies (cost: $37,470,081)
|
$ | 47,369,210 | ||||||||
|
|
The
accompanying notes are an integral part of these consolidated financial
statements.
|
8
|
HARRIS & HARRIS GROUP,
INC.
CONSOLIDATED SCHEDULE OF
INVESTMENTS AS OF SEPTEMBER 30,
2010
(Unaudited)
|
|
Method
of
|
Shares/
|
|||||||||
|
Valuation (1)
|
Industry (2)
|
Principal
|
Value
|
|||||||
|
Investments
in Non-Controlled Affiliated Companies (3)(12) –
|
||||||||||
|
29.4%
of net assets at value
|
||||||||||
|
Private Placement
Portfolio (Illiquid) – 29.4% of net
assets
|
||||||||||
|
at
value
|
||||||||||
|
ABS
Materials, Inc. (5)(7)(13) -- Developing nano-structured
|
Cleantech
|
|||||||||
|
absorbent
materials for environmental remediation and for the
|
||||||||||
|
petroleum
industry
|
||||||||||
|
Series
A Convertible Preferred Stock
|
(M)
|
375,000 | $ | 375,000 | ||||||
|
Electronics/
|
||||||||||
|
Adesto
Technologies Corporation (5)(6)(7) -- Developing
low-power,
|
Semi-
|
|||||||||
|
high-performance
memory devices
|
conductors
|
|||||||||
|
Series
A Convertible Preferred Stock
|
(M)
|
6,547,619 | 2,420,000 | |||||||
|
Series
B Convertible Preferred Stock
|
(M)
|
5,952,381 | 2,200,000 | |||||||
| 4,620,000 | ||||||||||
|
Electronics/
|
||||||||||
|
Cambrios
Technologies Corporation (5)(6)(7) – Developing
|
Semi-
|
|||||||||
|
nanowire-enabled
electronic materials for the display industry
|
conductors
|
|||||||||
|
Series
B Convertible Preferred Stock
|
(M)
|
1,294,025 | 647,013 | |||||||
|
Series
C Convertible Preferred Stock
|
(M)
|
1,300,000 | 650,000 | |||||||
|
Series
D Convertible Preferred Stock
|
(M)
|
515,756 | 257,878 | |||||||
| 1,554,891 | ||||||||||
|
Contour
Energy Systems, Inc. (5)(6)(7)(14) -- Developing batteries
using
|
Cleantech
|
|||||||||
|
nanostructured
materials
|
||||||||||
|
Series
A Convertible Preferred Stock
|
(M)
|
2,565,798 | 2,822,378 | |||||||
|
Series
B Convertible Preferred Stock
|
(M)
|
812,500 | 1,300,000 | |||||||
| 4,122,378 | ||||||||||
|
Crystal
IS, Inc. (5)(6) -- Developing single-crystal
|
Cleantech
|
|||||||||
|
aluminum
nitride substrates for light-emitting diodes
|
||||||||||
|
Common
Stock
|
(M)
|
3,994,468 | 0 | |||||||
|
Warrants
for Series A-1 Preferred Stock expiring 05/05/13
|
( I
)
|
15,231 | 0 | |||||||
|
Warrants
for Series A-1 Preferred Stock expiring 05/12/13
|
( I
)
|
2,350 | 0 | |||||||
|
Warrants
for Series A-1 Preferred Stock expiring 08/08/13
|
( I
)
|
4,396 | 0 | |||||||
| 0 | ||||||||||
The
accompanying notes are an integral part of these consolidated financial
statements.
9
|
HARRIS & HARRIS GROUP,
INC.
CONSOLIDATED SCHEDULE OF
INVESTMENTS AS OF SEPTEMBER 30,
2010
(Unaudited)
|
|
Method
of
|
Shares/
|
|||||||||
|
Valuation (1)
|
Industry (2)
|
Principal
|
Value
|
|||||||
|
Investments
in Non-Controlled Affiliated Companies (3)(12) –
|
||||||||||
|
29.4%
of net assets at value (Cont.)
|
||||||||||
|
Private Placement
Portfolio (Illiquid) – 29.4% of net
assets
|
||||||||||
|
at
value (Cont.)
|
||||||||||
|
Electronics/
|
||||||||||
|
D-Wave
Systems, Inc. (5)(6)(7)(15) -- Developing high-
|
Semi-
|
|||||||||
|
performance
quantum computing systems
|
conductors
|
|||||||||
|
Series
B Convertible Preferred Stock
|
(M)
|
1,144,869 | $ | 1,232,451 | ||||||
|
Series
C Convertible Preferred Stock
|
(M)
|
450,450 | 484,909 | |||||||
|
Series
D Convertible Preferred Stock
|
(M)
|
1,533,395 | 1,650,700 | |||||||
|
Unsecured
Convertible Bridge Note (including interest)
|
(M)
|
$ | 580,257 | 612,070 | ||||||
|
Warrants
for Common Stock expiring 06/30/15
|
( I
)
|
153,890 | 73,713 | |||||||
| 4,053,843 | ||||||||||
|
Enumeral
Technologies, Inc. (5)(6)(7) -- Developing therapeutics
|
Healthcare/
|
|||||||||
|
and
diagnostics through functional assaying of single cells
|
Biotech
|
|||||||||
|
Unsecured
Convertible Bridge Note (including interest)
|
(M)
|
$ | 250,000 | 265,452 | ||||||
|
Innovalight,
Inc. (5)(6)(7) -- Developing silicon-based
|
Cleantech
|
|||||||||
|
nanomaterials
for use in the solar energy industry
|
||||||||||
|
Series
B Convertible Preferred Stock
|
(M)
|
16,666,666 | 2,227,333 | |||||||
|
Series
C Convertible Preferred Stock
|
(M)
|
5,810,577 | 957,378 | |||||||
|
Series
D Convertible Preferred Stock
|
(M)
|
4,046,974 | 540,838 | |||||||
| 3,725,549 | ||||||||||
|
Electronics/
|
||||||||||
|
Kovio,
Inc. (5)(6) -- Developing semiconductor products
|
Semi-
|
|||||||||
|
using
printed electronics and thin-film technologies
|
conductors
|
|||||||||
|
Series
A' Convertible Preferred Stock
|
(M)
|
2,686,225 | 1,343,113 | |||||||
|
Mersana
Therapeutics, Inc. (5)(6)(7)(16) -- Developing treatments
for
|
Healthcare/
|
|||||||||
|
cancer
based on novel drug delivery polymers
|
Biotech
|
|||||||||
|
Series
A Convertible Preferred Stock
|
(M)
|
68,451 | 136,902 | |||||||
|
Series
B Convertible Preferred Stock
|
(M)
|
866,500 | 1,733,000 | |||||||
|
Unsecured
Convertible Bridge Notes (including interest)
|
(M)
|
$ | 821,975 | 940,231 | ||||||
|
Warrants
for Series B Convertible Preferred
|
||||||||||
|
Stock
expiring 10/21/10
|
( I
)
|
91,625 | 19,150 | |||||||
| 2,829,283 | ||||||||||
The
accompanying notes are an integral part of these consolidated financial
statements.
10
|
HARRIS & HARRIS GROUP,
INC.
CONSOLIDATED SCHEDULE OF
INVESTMENTS AS OF SEPTEMBER 30,
2010
(Unaudited)
|
|
Method
of
|
Shares/
|
|||||||||
|
Valuation (1)
|
Industry (2)
|
Principal
|
Value
|
|||||||
|
Investments
in Non-Controlled Affiliated Companies (3)(12) –
|
||||||||||
|
29.4%
of net assets at value (Cont.)
|
||||||||||
|
Private Placement
Portfolio (Illiquid) – 29.4% of net
assets
|
||||||||||
|
at
value (Cont.)
|
||||||||||
|
Metabolon,
Inc. (5)(6) -- Developing service and diagnostic
|
Healthcare/
|
|||||||||
|
products
through the use of a metabolomics, or biochemical,
|
Biotech
|
|||||||||
|
profiling
platform
|
||||||||||
|
Series
B Convertible Preferred Stock
|
(M)
|
371,739 | $ | 1,087,608 | ||||||
|
Series
B-1 Convertible Preferred Stock
|
(M)
|
148,696 | 435,043 | |||||||
|
Series
C Convertible Preferred Stock
|
(M)
|
1,000,000 | 1,000,000 | |||||||
|
Warrants
for Series B-1 Convertible Preferred
|
||||||||||
|
Stock
expiring 3/25/15
|
( I
)
|
74,348 | 100,084 | |||||||
| 2,622,735 | ||||||||||
|
Nextreme
Thermal Solutions, Inc. (5)(6) -- Developing thin-film
|
Cleantech
|
|||||||||
|
thermoelectric
devices for cooling and energy conversion
|
||||||||||
|
Series
A Convertible Preferred Stock
|
(M)
|
17,500 | 437,500 | |||||||
|
Series
B Convertible Preferred Stock
|
(M)
|
4,870,244 | 663,814 | |||||||
| 1,101,314 | ||||||||||
|
Questech
Corporation (5)(6) -- Manufacturing and marketing
|
Other
|
|||||||||
|
proprietary
metal and stone products for home decoration
|
||||||||||
|
Common
Stock
|
(M)
|
655,454 | 469,961 | |||||||
|
Electronics/
|
||||||||||
|
SiOnyx,
Inc. (5)(6)(7) -- Developing silicon-based optoelectronic
|
Semi-
|
|||||||||
|
products
enabled by its proprietary Black Silicon
|
conductors
|
|||||||||
|
Series
A Convertible Preferred Stock
|
(M)
|
233,499 | 160,367 | |||||||
|
Series
A-1 Convertible Preferred Stock
|
(M)
|
2,966,667 | 2,037,507 | |||||||
|
Series
A-2 Convertible Preferred Stock
|
(M)
|
4,207,537 | 2,889,736 | |||||||
|
Series
B-1 Convertible Preferred Stock
|
(M)
|
1,892,836 | 1,300,000 | |||||||
|
Warrants
for Series B-1 Convertible Preferred
|
||||||||||
|
Stock
expiring 2/23/17
|
( I
)
|
247,350 | 141,732 | |||||||
| 6,529,342 | ||||||||||
|
|
The
accompanying notes are an integral part of these consolidated financial
statements.
|
11
|
HARRIS & HARRIS GROUP,
INC.
CONSOLIDATED
SCHEDULE OF INVESTMENTS AS OF SEPTEMBER 30, 2010
(Unaudited)
|
|
Method
of
|
Shares/
|
|||||||||
|
Valuation (1)
|
Industry (2)
|
Principal
|
|
Value
|
||||||
|
Investments
in Non-Controlled Affiliated Companies (3)(12) –
|
||||||||||
|
29.4%
of net assets at value (Cont.)
|
||||||||||
|
Private Placement
Portfolio (Illiquid) – 29.4% of net
assets
|
||||||||||
|
at
value (Cont.)
|
||||||||||
|
Xradia,
Inc. (5)(6) -- Designing, manufacturing and selling
ultra-high
|
Other
|
|||||||||
|
resolution
3D x-ray microscopes and fluorescence imaging systems
|
||||||||||
|
Series
D Convertible Preferred Stock
|
(M)
|
3,121,099 | $ | 7,365,794 | ||||||
|
Total
Non-Controlled Private Placement Portfolio (cost:
$51,536,674)
|
$ | 40,978,655 | ||||||||
|
Total
Investments in Non-Controlled Affiliated Companies (cost:
$51,536,674)
|
$ | 40,978,655 | ||||||||
|
|
The
accompanying notes are an integral part of these consolidated financial
statements.
|
12
|
HARRIS & HARRIS GROUP,
INC.
CONSOLIDATED SCHEDULE OF
INVESTMENTS AS OF SEPTEMBER 30,
2010
(Unaudited)
|
|
Method
of
|
Shares/
|
|||||||||
|
Valuation (1)
|
Industry (2)
|
Principal
|
Value
|
|||||||
|
Investments
in Controlled Affiliated Companies (3)(17) –
|
||||||||||
|
6.1%
of net assets at value
|
||||||||||
|
Private Placement
Portfolio (Illiquid) – 6.1%
of
|
||||||||||
|
net
assets at value
|
||||||||||
|
Ancora
Pharmaceuticals Inc. (5)(6)(7) -- Developing synthetic
|
Healthcare/
|
|||||||||
|
carbohydrates
for pharmaceutical applications
|
Biotech
|
|||||||||
|
Series
B Convertible Preferred Stock
|
(M)
|
1,663,808 | $ | 17,374 | ||||||
|
Series
C Convertible Preferred Stock
|
(M)
|
2,066,051 | 1,239,632 | |||||||
|
Secured
Convertible Bridge Notes (including interest)
|
(M)
|
$ | 1,500,000 | 1,554,948 | ||||||
| 2,811,954 | ||||||||||
|
Laser
Light Engines, Inc. (5)(6)(7) -- Manufacturing solid-state
light
|
Cleantech
|
|||||||||
|
sources
for digital cinema and large-venue projection displays
|
||||||||||
|
Series
A Convertible Preferred Stock
|
(M)
|
7,499,062 | 2,000,000 | |||||||
|
Series
B Convertible Preferred Stock
|
(M)
|
13,571,848 | 3,619,610 | |||||||
| 5,619,610 | ||||||||||
|
Total
Controlled Private Placement Portfolio (cost: $9,380,567)
|
$ | 8,431,564 | ||||||||
|
Total
Investments in Controlled Affiliated Companies (cost:
$9,380,567)
|
$ | 8,431,564 | ||||||||
|
Total
Private Placement Portfolio (cost: $98,387,322)
|
$ | 96,779,429 | ||||||||
|
|
The
accompanying notes are an integral part of these consolidated financial
statements.
|
13
|
HARRIS & HARRIS GROUP,
INC.
CONSOLIDATED SCHEDULE OF
INVESTMENTS AS OF SEPTEMBER 30,
2010
(Unaudited)
|
|
Method
of
|
Shares/
|
||||||||
|
Valuation (1)
|
Principal
|
Value
|
|||||||
|
U.S.
Government Securities (18) – 31.5% of net assets at value
|
|||||||||
|
U.S.
Treasury Bill -- due date 10/07/10
|
(M)
|
$ | 5,600,000 | $ | 5,599,888 | ||||
|
U.S.
Treasury Bill -- due date 01/13/11
|
(M)
|
38,275,000 | 38,260,456 | ||||||
|
Total
Investments in U.S. Government Securities (cost:
$43,861,592)
|
$ | 43,860,344 | |||||||
|
Total
Investments (cost: $142,248,914)
|
$ | 140,639,773 | |||||||
|
|
The
accompanying notes are an integral part of these consolidated financial
statements.
|
14
|
HARRIS & HARRIS GROUP,
INC.
CONSOLIDATED SCHEDULE OF
INVESTMENTS AS OF SEPTEMBER 30,
2010
(Unaudited)
|
Notes to
Consolidated Schedule of Investments
|
(1)
|
See
Footnote to Consolidated Schedule of Investments on page 28 for a
description of the Valuation
Procedures.
|
|
(2)
|
We
classify Cleantech companies as those that seek to improve performance,
productivity or efficiency, and to reduce environmental impact, waste,
cost, energy consumption or raw materials using nanotechnology-enabled
solutions. We classify Electronics/Semiconductors companies as
those that use nanotechnology to address problems in electronics-related
industries, including semiconductors. We classify
Healthcare/Biotech companies as those that use nanotechnology to address
problems in healthcare-related industries, including biotechnology,
pharmaceuticals and medical devices. We use the term “Other” for
companies that operate primarily in industries other than those within
Cleantech, Electronics/Semiconductors and
Healthcare/Biotech. These industries include photonics,
metrology, test and measurement, materials, mining, decorative products
and personal care products.
|
|
(3)
|
Investments
in unaffiliated companies consist of investments in which we own less than
five percent of the voting shares of the portfolio
company. Investments in non-controlled affiliated companies
consist of investments in which we own five percent or more, but less than
25 percent, of the voting shares of the portfolio company, or where we
hold one or more seats on the portfolio company’s Board of Directors but
do not control the company. Investments in controlled
affiliated companies consist of investments in which we own 25 percent or
more of the voting shares of the portfolio company or otherwise control
the company.
|
|
(4)
|
The
aggregate cost for federal income tax purposes of investments in
unaffiliated privately held companies is $37,470,081. The gross
unrealized appreciation based on the tax cost for these securities is
$16,674,553. The gross unrealized depreciation based on the tax cost for
these securities is $6,775,424.
|
|
(5)
|
We
are subject to legal restrictions on the sale of this
investment.
|
|
(6)
|
Represents
a non-income producing security. Investments that have not paid
dividends or interest within the last 12 months are considered to be
non-income producing.
|
|
(7)
|
These
investments are development-stage companies. A
development-stage company is defined as a company that is devoting
substantially all of its efforts to establishing a new business, and
either it has not yet commenced its planned principal operations, or it
has commenced such operations but has not realized significant revenue
from them.
|
|
(8)
|
With
our purchase of Series E Convertible Preferred Stock of BioVex, we
received a warrant to purchase a number of shares of common stock of
BioVex as determined by dividing 624,999.99 by the price per share at
which the common stock is offered and sold to the public in connection
with the initial public offering (IPO). The ability to exercise this
warrant is therefore contingent on BioVex completing successfully an IPO
before the expiration date of the warrant on September 27,
2012. The exercise price of this warrant shall be 110 percent
of the IPO price.
|
The
accompanying notes are an integral part of this consolidated
schedule.
15
|
HARRIS & HARRIS GROUP,
INC.
CONSOLIDATED SCHEDULE OF
INVESTMENTS AS OF SEPTEMBER 30,
2010
(Unaudited)
|
|
(9)
|
Cobalt
Technologies, Inc., also does business as Cobalt
Biofuels.
|
|
(10)
|
On
June 9, 2010, Ensemble Discovery Corporation changed its name to Ensemble
Therapeutics Corporation. With our investment in a convertible
bridge note issued by Ensemble Therapeutics, we received a warrant to
purchase a number of shares of the class of stock sold in the next
financing of Ensemble Therapeutics equal to $149,539.57 divided by the
price per share of the class of stock sold in the next financing of
Ensemble Therapeutics. The ability to exercise this warrant is,
therefore, contingent on Ensemble Therapeutics completing successfully a
subsequent round of financing. This warrant shall expire and no
longer be exercisable on September 10, 2015. The cost basis of
this warrant is $89.86.
|
|
(11)
|
With
our purchase of the Series B Convertible Preferred Stock of TetraVitae
Bioscience, Inc., we received the right to purchase, at a price of
$2.63038528 per share, a number of shares in the Series C financing equal
to the number of shares of Series B Preferred Stock purchased. The
ability to exercise this right is contingent on TetraVitae Bioscience
completing successfully a subsequent round of
financing.
|
|
(12)
|
The
aggregate cost for federal income tax purposes of investments in
non-controlled affiliated companies is $51,536,674. The gross
unrealized appreciation based on the tax cost for these securities is
$6,024,080. The gross unrealized depreciation based on the tax
cost for these securities is
$16,582,099.
|
|
(13)
|
Initial
investment was made during 2010.
|
|
(14)
|
On
February 28, 2008, Lifco, Inc., merged with CFX Battery,
Inc. The surviving entity was CFX Battery, Inc. On
February 24, 2010, CFX Battery, Inc., changed its name to Contour Energy
Systems, Inc.
|
|
(15)
|
D-Wave
Systems, Inc., is located and is doing business primarily in
Canada. We invested in D-Wave Systems, Inc., through
D-Wave USA, a Delaware company. Our investment is denominated
in Canadian dollars and is subject to foreign currency
translation. See Note 3. Summary of Significant Accounting
Policies.
|
|
(16)
|
Warrants
expired unexercised subsequent to September 30,
2010.
|
|
(17)
|
The
aggregate cost for federal income tax purposes of investments in
controlled affiliated companies is $9,380,567. The gross
unrealized appreciation based on the tax cost for these securities is
$523,808. The gross unrealized depreciation based on the tax
cost for these securities is
$1,472,811.
|
|
(18)
|
The
aggregate cost for federal income tax purposes of our U.S. government
securities is $43,861,592. The gross unrealized appreciation on
the tax cost for these securities is $0. The gross unrealized
depreciation on the tax cost of these securities is
$1,248.
|
The
accompanying notes are an integral part of this consolidated
schedule.
16
|
HARRIS & HARRIS GROUP,
INC.
CONSOLIDATED
SCHEDULE OF INVESTMENTS AS OF DECEMBER 31,
2009
|
|
Method
of
|
Shares/
|
||||||||
|
Valuation (1)
|
Principal
|
Value
|
|||||||
|
Investments
in Unaffiliated Companies (2)(3)(4) – 16.3% of
|
|||||||||
|
net
assets at value
|
|||||||||
|
Private
Placement Portfolio (Illiquid) – 16.1% of net assets
|
|||||||||
|
at
value
|
|||||||||
|
BioVex
Group, Inc. (5)(6)(7)(8) -- Developing novel biologics
|
|||||||||
|
for
treatment of cancer and infectious disease
|
|||||||||
|
Series
E Convertible Preferred Stock
|
(M)
|
2,799,552 | $ | 1,042,862 | |||||
|
Series
G Convertible Preferred Stock
|
(M)
|
3,738,004 | 627,985 | ||||||
|
Warrants
at $0.21 expiring 11/5/16
|
( I
)
|
285,427 | 20,836 | ||||||
| 1,691,683 | |||||||||
|
Cobalt
Technologies, Inc. (5)(6)(7)(9) -- Developing processes
for
|
|||||||||
|
making
biobutanol through biomass fermentation
|
|||||||||
|
Series
C Convertible Preferred Stock
|
(M)
|
352,112 | 375,000 | ||||||
|
D-Wave
Systems, Inc. (5)(6)(7)(10) -- Developing high-
|
|||||||||
|
performance
quantum computing systems
|
|||||||||
|
Series
B Convertible Preferred Stock
|
(M)
|
1,144,869 | 907,612 | ||||||
|
Series
C Convertible Preferred Stock
|
(M)
|
450,450 | 357,101 | ||||||
|
Series
D Convertible Preferred Stock
|
(M)
|
1,533,395 | 1,215,622 | ||||||
| 2,480,335 | |||||||||
|
Molecular
Imprints, Inc. (5)(6) -- Manufacturing nanoimprint
|
|||||||||
|
lithography
capital equipment
|
|||||||||
|
Series
B Convertible Preferred Stock
|
(M)
|
1,333,333 | 2,999,999 | ||||||
|
Series
C Convertible Preferred Stock
|
(M)
|
1,250,000 | 2,812,500 | ||||||
|
Warrants
at $2.00 expiring 12/31/11
|
( I
)
|
125,000 | 163,625 | ||||||
| 5,976,124 | |||||||||
|
Nanosys,
Inc. (5)(6) -- Developing zero and one-dimensional
|
|||||||||
|
inorganic
nanometer-scale materials and devices
|
|||||||||
|
Series
C Convertible Preferred Stock
|
(M)
|
803,428 | 1,185,056 | ||||||
|
Series
D Convertible Preferred Stock
|
(M)
|
1,016,950 | 1,500,001 | ||||||
| 2,685,057 | |||||||||
|
|
The
accompanying notes are an integral part of these consolidated financial
statements.
|
17
|
HARRIS & HARRIS GROUP,
INC.
CONSOLIDATED SCHEDULE OF
INVESTMENTS AS OF DECEMBER 31,
2009
|
|
Method
of
|
Shares/
|
||||||||
|
Valuation (1)
|
Principal
|
Value
|
|||||||
|
Investments
in Unaffiliated Companies (2)(3)(4) – 16.3% of
|
|||||||||
|
net
assets at value (Cont.)
|
|||||||||
|
Private
Placement Portfolio (Illiquid) – 16.1% of net assets
|
|||||||||
|
at
value (Cont.)
|
|||||||||
|
Nantero,
Inc. (5)(6)(7) -- Developing a high-density, nonvolatile,
|
|||||||||
|
random
access memory chip, enabled by carbon nanotubes
|
|||||||||
|
Series
A Convertible Preferred Stock
|
(M)
|
345,070 | $ | 1,046,908 | |||||
|
Series
B Convertible Preferred Stock
|
(M)
|
207,051 | 628,172 | ||||||
|
Series
C Convertible Preferred Stock
|
(M)
|
188,315 | 571,329 | ||||||
| 2,246,409 | |||||||||
|
NeoPhotonics
Corporation (5)(6)(11) -- Developing and manufacturing
|
|||||||||
|
optical
devices and components
|
|||||||||
|
Common
Stock
|
(M)
|
1,100,013 | 739,209 | ||||||
|
Series
1 Convertible Preferred Stock
|
(M)
|
1,831,256 | 1,230,604 | ||||||
|
Series
2 Convertible Preferred Stock
|
(M)
|
741,898 | 498,555 | ||||||
|
Series
3 Convertible Preferred Stock
|
(M)
|
2,750,000 | 1,848,000 | ||||||
|
Series
X Convertible Preferred Stock
|
(M)
|
8,923 | 1,427,680 | ||||||
|
Warrants
at $0.15 expiring 01/26/10
|
( I
)
|
16,364 | 11,291 | ||||||
|
Warrants
at $0.15 expiring 12/05/10
|
( I
)
|
14,063 | 9,703 | ||||||
| 5,765,042 | |||||||||
|
Polatis,
Inc. (5)(6)(7) -- Developing MEMS-based optical
|
|||||||||
|
networking
components
|
|||||||||
|
Series
A-1 Convertible Preferred Stock
|
(M)
|
16,775 | 0 | ||||||
|
Series
A-2 Convertible Preferred Stock
|
(M)
|
71,611 | 0 | ||||||
|
Series
A-4 Convertible Preferred Stock
|
(M)
|
4,774 | 0 | ||||||
|
Series
A-5 Convertible Preferred Stock
|
(M)
|
16,438 | 0 | ||||||
| 0 | |||||||||
|
PolyRemedy,
Inc. (5)(6)(7) -- Developing a robotic
|
|||||||||
|
manufacturing
platform for wound treatment patches
|
|||||||||
|
Series
B-1 Convertible Preferred Stock
|
(M)
|
287,647 | 46,933 | ||||||
|
Series
B-2 Convertible Preferred Stock
|
(M)
|
676,147 | 60,853 | ||||||
| 107,786 | |||||||||
|
|
The
accompanying notes are an integral part of these consolidated financial
statements.
|
18
|
HARRIS & HARRIS GROUP,
INC.
CONSOLIDATED SCHEDULE OF
INVESTMENTS AS OF DECEMBER 31,
2009
|
|
Method
of
|
Shares/
|
||||||||
|
Valuation (1)
|
Principal
|
Value
|
|||||||
|
Investments
in Unaffiliated Companies (2)(3)(4) – 16.3% of
|
|||||||||
|
net
assets at value (Cont.)
|
|||||||||
|
Private
Placement Portfolio (Illiquid) – 16.1% of net assets
|
|||||||||
|
at
value (Cont.)
|
|||||||||
|
Siluria
Technologies, Inc. (5)(6)(7) -- Developing next-generation
|
|||||||||
|
nanomaterials
|
|||||||||
|
Series
S-2 Convertible Preferred Stock
|
(M)
|
612,061 | $ | 204,000 | |||||
|
TetraVitae
Bioscience, Inc. (5)(6)(7)(12) -- Developing methods
|
|||||||||
|
of
producing alternative chemicals and fuels through biomass
|
|||||||||
|
fermentation
|
|||||||||
|
Series
B Convertible Preferred Stock
|
(M)
|
118,804 | 125,000 | ||||||
|
Total
Unaffiliated Private Placement Portfolio (cost:
$26,977,200)
|
$ | 21,656,436 | |||||||
|
Publicly
Traded Portfolio (Liquid) – 0.2% of net assets
|
|||||||||
|
at
value
|
|||||||||
|
Orthovita, Inc. (6)(13) --
Developing materials and devices
|
|||||||||
|
for
orthopedic medical implant applications
|
|||||||||
|
Common
Stock
|
(M)
|
64,500 | 226,395 | ||||||
|
Total
Unaffiliated Publicly Traded Portfolio (cost: $298,827)
|
$ | 226,395 | |||||||
|
Total
Investments in Unaffiliated Companies (cost: $27,276,027)
|
$ | 21,882,831 | |||||||
|
|
The
accompanying notes are an integral part of these consolidated financial
statements.
|
19
|
HARRIS & HARRIS GROUP,
INC.
CONSOLIDATED SCHEDULE OF
INVESTMENTS AS OF DECEMBER 31,
2009
|
|
Method
of
|
Shares/
|
||||||||
|
Valuation (1)
|
Principal
|
Value
|
|||||||
|
Investments
in Non-Controlled Affiliated Companies (2)(14) –
|
|||||||||
|
37.5%
of net assets at value
|
|||||||||
|
Private Placement
Portfolio (Illiquid) – 37.5% of net
assets
|
|||||||||
|
at
value
|
|||||||||
|
Adesto
Technologies Corporation (5)(6)(7) -- Developing
low-power,
|
|||||||||
|
high-performance
memory devices
|
|||||||||
|
Series
A Convertible Preferred Stock
|
(M)
|
6,547,619 | $ | 2,420,000 | |||||
|
Series
B Convertible Preferred Stock
|
(M)
|
5,952,381 | 2,200,000 | ||||||
| 4,620,000 | |||||||||
|
Bridgelux,
Inc. (5)(6) -- Manufacturing high-power light
|
|||||||||
|
emitting
diodes (LEDs) and arrays
|
|||||||||
|
Series
B Convertible Preferred Stock
|
(M)
|
1,861,504 | 1,804,914 | ||||||
|
Series
C Convertible Preferred Stock
|
(M)
|
2,130,699 | 2,065,926 | ||||||
|
Series
D Convertible Preferred Stock
|
(M)
|
833,333 | 807,999 | ||||||
|
Warrants
at $0.7136 expiring 12/31/14
|
( I
)
|
163,900 | 98,995 | ||||||
|
Warrants
at $1.50 expiring 8/26/14
|
( I
)
|
124,999 | 55,375 | ||||||
| 4,833,209 | |||||||||
|
Cambrios
Technologies Corporation (5)(6)(7) -- Developing
|
|||||||||
|
nanowire-enabled
electronic materials for the display industry
|
|||||||||
|
Series
B Convertible Preferred Stock
|
(M)
|
1,294,025 | 647,013 | ||||||
|
Series
C Convertible Preferred Stock
|
(M)
|
1,300,000 | 650,000 | ||||||
|
Series
D Convertible Preferred Stock
|
(M)
|
515,756 | 257,878 | ||||||
| 1,554,891 | |||||||||
|
CFX
Battery, Inc. (5)(6)(7)(15) -- Developing batteries
using
|
|||||||||
|
nanostructured
materials
|
|||||||||
|
Series
A Convertible Preferred Stock
|
(M)
|
2,565,798 | 2,822,378 | ||||||
|
Series
B Convertible Preferred Stock
|
(M)
|
812,500 | 1,300,000 | ||||||
| 4,122,378 | |||||||||
|
Crystal
IS, Inc. (5)(6) -- Developing single-crystal
|
|||||||||
|
aluminum
nitride substrates for light-emitting diodes
|
|||||||||
|
Common
Stock
|
(M)
|
2,585,657 | 0 | ||||||
|
Warrants
at $0.78 expiring 05/05/13
|
( I
)
|
15,231 | 0 | ||||||
|
Warrants
at $0.78 expiring 05/12/13
|
( I
)
|
2,350 | 0 | ||||||
|
Warrants
at $0.78 expiring 08/08/13
|
( I
)
|
4,396 | 0 | ||||||
| 0 | |||||||||
The
accompanying notes are an integral part of these consolidated financial
statements.
20
|
HARRIS & HARRIS GROUP,
INC.
CONSOLIDATED SCHEDULE OF
INVESTMENTS AS OF DECEMBER 31,
2009
|
|
Method
of
|
Shares/
|
||||||||
|
Valuation (1)
|
Principal
|
Value
|
|||||||
|
Investments
in Non-Controlled Affiliated Companies (2)(14) –
|
|||||||||
|
37.5%
of net assets at value (Cont.)
|
|||||||||
|
Private Placement
Portfolio (Illiquid) – 37.5% of net
assets
|
|||||||||
|
at
value (Cont.)
|
|||||||||
|
Ensemble
Discovery Corporation (5)(6)(16) -- Developing
DNA-
|
|||||||||
|
Programmed
ChemistryTM for the discovery of new classes
of
|
|||||||||
|
therapeutics
and bioassays
|
|||||||||
|
Series
B Convertible Preferred Stock
|
(M)
|
1,449,275 | $ | 1,500,000 | |||||
|
Unsecured
Convertible Bridge Note (including interest)
|
(M)
|
$ | 299,169 | 325,506 | |||||
| 1,825,506 | |||||||||
|
Enumeral
Technologies, Inc. (5)(6)(7)(13) -- Developing high-value
|
|||||||||
|
opportunities
in immunology including therapeutic discovery,
|
|||||||||
|
immune
profiling and personalized medicine
|
|||||||||
|
Unsecured
Convertible Bridge Note (including interest)
|
(M)
|
$ | 250,000 | 250,438 | |||||
|
Innovalight,
Inc. (5)(6)(7) -- Developing solar power
|
|||||||||
|
products
enabled by silicon-based nanomaterials
|
|||||||||
|
Series
B Convertible Preferred Stock
|
(M)
|
16,666,666 | 2,969,667 | ||||||
|
Series
C Convertible Preferred Stock
|
(M)
|
5,810,577 | 1,276,457 | ||||||
|
Series
D Convertible Preferred Stock
|
(M)
|
4,046,974 | 721,090 | ||||||
| 4,967,214 | |||||||||
|
Kovio,
Inc. (5)(6) -- Developing semiconductor products
|
|||||||||
|
using
printed electronics and thin-film technologies
|
|||||||||
|
Series
C Convertible Preferred Stock
|
(M)
|
2,500,000 | 609,943 | ||||||
|
Series
D Convertible Preferred Stock
|
(M)
|
800,000 | 195,182 | ||||||
|
Series
E Convertible Preferred Stock
|
(M)
|
1,200,000 | 1,500,000 | ||||||
|
Warrants
at $1.25 expiring 12/31/12
|
( I
)
|
355,880 | 291,466 | ||||||
| 2,596,591 | |||||||||
|
Mersana
Therapeutics, Inc. (5)(6)(7) -- Developing treatments for
|
|||||||||
|
cancer
based on novel drug delivery polymers
|
|||||||||
|
Series
A Convertible Preferred Stock
|
(M)
|
68,451 | 68,451 | ||||||
|
Series
B Convertible Preferred Stock
|
(M)
|
866,500 | 866,500 | ||||||
|
Unsecured
Convertible Bridge Note (including interest)
|
(M)
|
$ | 650,000 | 708,165 | |||||
|
Warrants
at $2.00 expiring 10/21/10
|
( I
)
|
91,625 | 16,218 | ||||||
| 1,659,334 | |||||||||
The
accompanying notes are an integral part of these consolidated financial
statements.
21
|
HARRIS & HARRIS GROUP,
INC.
CONSOLIDATED SCHEDULE OF
INVESTMENTS AS OF DECEMBER 31,
2009
|
|
Method
of
|
Shares/
|
||||||||
|
Valuation (1)
|
Principal
|
Value
|
|||||||
|
Investments
in Non-Controlled Affiliated Companies (2)(14) –
|
|||||||||
|
37.5%
of net assets at value (Cont.)
|
|||||||||
|
Private Placement
Portfolio (Illiquid) – 37.5% of net
assets
|
|||||||||
|
at
value (Cont.)
|
|||||||||
|
Metabolon,
Inc. (5)(6) -- Developing service and diagnostic products
|
|||||||||
|
through
the use of a metabolomics, or biochemical, profiling
platform
|
|||||||||
|
Series
B Convertible Preferred Stock
|
(M)
|
371,739 | $ | 1,034,061 | |||||
|
Series
B-1 Convertible Preferred Stock
|
(M)
|
148,696 | 413,625 | ||||||
|
Series
C Convertible Preferred Stock
|
(M)
|
1,000,000 | 1,000,000 | ||||||
|
Warrants
at $1.15 expiring 3/25/15
|
( I
)
|
74,348 | 112,092 | ||||||
| 2,559,778 | |||||||||
|
NanoGram
Corporation (5)(6) -- Developing solar power products
|
|||||||||
|
enabled
by silicon-based nanomaterials
|
|||||||||
|
Series
I Convertible Preferred Stock
|
(M)
|
63,210 | 0 | ||||||
|
Series
II Convertible Preferred Stock
|
(M)
|
1,250,904 | 0 | ||||||
|
Series
III Convertible Preferred Stock
|
(M)
|
1,242,144 | 0 | ||||||
|
Series
IV Convertible Preferred Stock
|
(M)
|
432,179 | 0 | ||||||
| 0 | |||||||||
|
Nextreme
Thermal Solutions, Inc. (5)(6) -- Developing thin-film
|
|||||||||
|
thermoelectric
devices for cooling and energy conversion
|
|||||||||
|
Series
A Convertible Preferred Stock
|
(M)
|
17,500 | 1,750,000 | ||||||
|
Series
B Convertible Preferred Stock
|
(M)
|
4,870,244 | 2,655,257 | ||||||
| 4,405,257 | |||||||||
|
Questech
Corporation (5)(6) -- Manufacturing and marketing
|
|||||||||
|
proprietary
metal and stone decorative tiles
|
|||||||||
|
Common
Stock
|
(M)
|
655,454 | 425,390 | ||||||
|
Solazyme,
Inc. (5)(6)(7) -- Developing algal biodiesel, industrial
|
|||||||||
|
chemicals
and special ingredients based on synthetic biology
|
|||||||||
|
Series
A Convertible Preferred Stock
|
(M)
|
988,204 | 4,978,157 | ||||||
|
Series
B Convertible Preferred Stock
|
(M)
|
495,246 | 2,494,841 | ||||||
|
Series
C Convertible Preferred Stock
|
(M)
|
651,309 | 3,281,021 | ||||||
| 10,754,019 | |||||||||
|
|
The
accompanying notes are an integral part of these consolidated financial
statements.
|
22
|
HARRIS & HARRIS GROUP,
INC.
CONSOLIDATED
SCHEDULE OF INVESTMENTS AS OF DECEMBER 31,
2009
|
|
Method
of
|
Shares/
|
||||||||
|
Valuation (1)
|
Principal
|
Value
|
|||||||
|
Investments
in Non-Controlled Affiliated Companies (2)(14) –
|
|||||||||
|
37.5%
of net assets at value (Cont.)
|
|||||||||
|
Private Placement
Portfolio (Illiquid) – 37.5% of net
assets
|
|||||||||
|
at
value (Cont.)
|
|||||||||
|
Xradia,
Inc. (5)(6) -- Designing, manufacturing and selling
ultra-high
|
|||||||||
|
resolution
3D x-ray microscopes and fluorescence imaging systems
|
|||||||||
|
Series
D Convertible Preferred Stock
|
(M)
|
3,121,099 | $ | 5,723,215 | |||||
|
Total
Non-Controlled Private Placement Portfolio (cost:
$54,864,948)
|
$ | 50,297,220 | |||||||
|
Total
Investments in Non-Controlled Affiliated Companies (cost:
$54,864,948)
|
$ | 50,297,220 | |||||||
|
|
The
accompanying notes are an integral part of these consolidated financial
statements.
|
23
|
HARRIS & HARRIS GROUP,
INC.
CONSOLIDATED SCHEDULE OF
INVESTMENTS AS OF DECEMBER 31,
2009
|
|
Method
of
|
Shares/
|
||||||||
|
Valuation (1)
|
Principal
|
Value
|
|||||||
|
Investments
in Controlled Affiliated Companies (2)(17) –
|
|||||||||
|
4.40%
of net assets at value
|
|||||||||
|
Private Placement
Portfolio (Illiquid) – 4.40%
of
|
|||||||||
|
net
assets at value
|
|||||||||
|
Ancora
Pharmaceuticals Inc. (5)(6)(7) -- Developing synthetic
|
|||||||||
|
carbohydrates
for pharmaceutical applications
|
|||||||||
|
Series
B Convertible Preferred Stock
|
(M)
|
1,663,808 | $ | 17,374 | |||||
|
Series
C Convertible Preferred Stock
|
(M)
|
2,066,051 | 1,239,632 | ||||||
| 1,257,006 | |||||||||
|
Laser
Light Engines, Inc. (5)(6)(7) -- Manufacturing solid-state
light
|
|||||||||
|
sources
for digital cinema and large-venue projection displays
|
|||||||||
|
Series
A Convertible Preferred Stock
|
(M)
|
7,499,062 | 1,000,000 | ||||||
|
Secured
Convertible Bridge Note (including interest)
|
(M)
|
$ | 1,390,000 | 1,434,116 | |||||
| 2,434,116 | |||||||||
|
SiOnyx,
Inc. (5)(6)(7) -- Developing silicon-based optoelectronic
|
|||||||||
|
products
enabled by its proprietary "Black Silicon"
|
|||||||||
|
Series
A Convertible Preferred Stock
|
(M)
|
233,499 | 67,843 | ||||||
|
Series
A-1 Convertible Preferred Stock
|
(M)
|
2,966,667 | 861,965 | ||||||
|
Series
A-2 Convertible Preferred Stock
|
(M)
|
4,207,537 | 1,222,500 | ||||||
| 2,152,308 | |||||||||
|
Total
Controlled Private Placement Portfolio (cost: $10,248,932)
|
$ | 5,843,430 | |||||||
|
Total
Investments in Controlled Affiliated Companies (cost:
$10,248,932)
|
$ | 5,843,430 | |||||||
|
Total
Private Placement and Publicly Traded Portfolio (cost:
$92,389,907)
|
$ | 78,023,481 | |||||||
|
|
The
accompanying notes are an integral part of these consolidated financial
statements.
|
24
|
HARRIS & HARRIS GROUP,
INC.
CONSOLIDATED SCHEDULE OF
INVESTMENTS AS OF DECEMBER 31,
2009
|
|
Method
of
|
Shares/
|
||||||||
|
Valuation (1)
|
Principal
|
Value
|
|||||||
|
U.S.
Government Securities (18) – 41.7% of net assets at value
|
|||||||||
|
U.S.
Treasury Bill -- due date
04/22/10
|
(M)
|
$ | 10,000,000 | $ | 9,997,600 | ||||
|
U.S.
Treasury Bill -- due date
06/17/10
|
(M)
|
42,175,000 | 42,139,151 | ||||||
|
U.S.
Treasury Notes -- due date 02/28/10, coupon
2.000%
|
(M)
|
3,800,000 | 3,810,830 | ||||||
|
Total
Investments in U.S. Government Securities (cost:
$55,960,024)
|
$ | 55,947,581 | |||||||
|
Total
Investments (cost: $148,349,931)
|
$ | 133,971,062 | |||||||
|
|
The
accompanying notes are an integral part of these consolidated financial
statements.
|
25
|
HARRIS & HARRIS GROUP,
INC.
CONSOLIDATED SCHEDULE OF
INVESTMENTS AS OF DECEMBER 31,
2009
|
Notes to
Consolidated Schedule of Investments
|
(1)
|
See
Footnote to Consolidated Schedule of Investments on page 28 for a
description of the Valuation
Procedures.
|
|
(2)
|
Investments
in unaffiliated companies consist of investments in which we own less than
five percent of the voting shares of the portfolio company or less than
five percent of the common shares of the publicly traded
company. Investments in non-controlled affiliated companies
consist of investments in which we own five percent or more, but less than
25 percent, of the voting shares of the portfolio company, or where we
hold one or more seats on the portfolio company’s Board of Directors but
do not control the company. Investments in controlled
affiliated companies consist of investments in which we own 25 percent or
more of the voting shares of the portfolio company or otherwise control
the company.
|
|
(3)
|
The
aggregate cost for federal income tax purposes of investments in
unaffiliated privately held companies is $26,977,200. The gross
unrealized appreciation based on the tax cost for these securities is
$2,338,205. The gross unrealized depreciation based on the tax cost for
these securities is $7,658,969.
|
|
(4)
|
The
aggregate cost for federal income tax purposes of investments in
unaffiliated publicly traded companies is $298,827. The gross
unrealized appreciation based on the tax cost for these securities is
$0. The gross unrealized depreciation based on the tax cost for
these securities is $72,432.
|
|
(5)
|
Legal
restrictions on sale of investment.
|
|
(6)
|
Represents
a non-income producing security. Equity investments that have
not paid dividends within the last 12 months are considered to be
non-income producing.
|
|
(7)
|
These
investments are development-stage companies. A
development-stage company is defined as a company that is devoting
substantially all of its efforts to establishing a new business, and
either it has not yet commenced its planned principal operations, or it
has commenced such operations but has not realized significant revenue
from them.
|
|
(8)
|
With
our purchase of Series E Convertible Preferred Stock of BioVex, we
received a warrant to purchase a number of shares of common stock of
BioVex as determined by dividing 624,999.99 by the price per share at
which the common stock is offered and sold to the public in connection
with the IPO. The ability to exercise this warrant is therefore
contingent on BioVex completing successfully an IPO before the expiration
date of the warrant on September 27, 2012. The exercise price
of this warrant shall be 110 percent of the IPO
price.
|
|
(9)
|
Cobalt
Technologies, Inc., does business as Cobalt
Biofuels.
|
|
(10)
|
D-Wave
Systems, Inc., is located and is doing business primarily in
Canada. We invested in D-Wave Systems, Inc., through
D-Wave USA, a Delaware company. Our investment is denominated
in Canadian dollars and is subject to foreign currency
translation. See "Note 3. Summary of Significant Accounting
Policies."
|
|
(11)
|
We
exercised NeoPhotonics Corporation warrants in January and February
2010.
|
The
accompanying notes are an integral part of this consolidated
schedule.
26
|
HARRIS & HARRIS GROUP,
INC.
CONSOLIDATED SCHEDULE OF
INVESTMENTS AS OF DECEMBER 31,
2009
|
|
(12)
|
With
our purchase of the Series B Convertible Preferred Stock of TetraVitae
Bioscience, Inc., we received the right to purchase, at a price of
$2.63038528 per share, a number of shares in the Series C financing equal
to the number of shares of Series B Preferred Stock purchased. The
ability to exercise this right is contingent on TetraVitae Bioscience
completing successfully a subsequent round of
financing.
|
|
(13)
|
Initial
investment was made during 2009.
|
|
(14)
|
The
aggregate cost for federal income tax purposes of investments in
non-controlled affiliated companies is $54,864,948. The gross
unrealized appreciation based on the tax cost for these securities is
$10,648,525. The gross unrealized depreciation based on the tax
cost for these securities is
$15,216,253.
|
|
(15)
|
On
February 28, 2008, Lifco, Inc., merged with CFX Battery,
Inc. The surviving entity is CFX Battery,
Inc.
|
|
(16)
|
With
our investment in a convertible bridge note issued by Ensemble Discovery,
we received a warrant to purchase a number of shares of the class of stock
sold in the next financing of Ensemble Discovery equal to $149,539.57
divided by the price per share of the class of stock sold in the next
financing of Ensemble Discovery. The ability to exercise this
warrant is, therefore, contingent on Ensemble Discovery completing
successfully a subsequent round of financing. This warrant
shall expire and no longer be exercisable on September 10,
2015. The cost basis of this warrant is
$89.86.
|
|
(17)
|
The
aggregate cost for federal income tax purposes of investments in
controlled affiliated companies is $10,248,932. The gross
unrealized appreciation based on the tax cost for these securities is
$0. The gross unrealized depreciation based on the tax cost for
these securities is $4,405,502.
|
|
(18)
|
The
aggregate cost for federal income tax purposes of our U.S. government
securities is $55,960,024. The gross unrealized appreciation on the tax
cost for these securities is $0. The gross unrealized depreciation on the tax cost of these
securities is $12,443.
|
The
accompanying notes are an integral part of this consolidated
schedule.
27
|
HARRIS
& HARRIS GROUP, INC.
FOOTNOTE
TO CONSOLIDATED SCHEDULE OF
INVESTMENTS
|
VALUATION
PROCEDURES
|
I.
|
Determination
of Net Asset Value
|
The 1940 Act requires periodic
valuation of each investment in the portfolio of the Company to determine its
net asset value ("NAV"). Under the 1940 Act, unrestricted securities
with readily available market quotations are to be valued at the current market
value; all other assets must be valued at "fair value" as determined in good
faith by or under the direction of the Board of Directors.
The Board of Directors is responsible
for (1) determining overall valuation guidelines and (2) ensuring that the
investments of the Company are valued within the prescribed
guidelines.
The Valuation Committee, comprised of
all of the independent Board members, is responsible for determining the
valuation of the Company’s assets within the guidelines established by the Board
of Directors. The Valuation Committee receives information and
recommendations from management.
The values assigned to these
investments are based on available information and do not necessarily represent
amounts that might ultimately be realized when that investment is sold, as such
amounts depend on future circumstances and cannot reasonably be determined until
the individual investments are actually liquidated or become readily
marketable.
|
II.
|
Approaches
to Determining Fair Value
|
Accounting principles generally
accepted in the United States of America ("GAAP") define fair value as the price
that would be received to sell an asset or paid to transfer a liability in an
orderly transaction between market participants at the measurement date (exit
price). In effect, GAAP applies fair value terminology to all
valuations whereas the 1940 Act applies market value terminology to readily
marketable assets and fair value terminology to other assets.
The main
approaches to measuring fair value utilized are the market approach and the
income approach.
|
|
·
|
Market Approach
(M): The market approach uses prices and other relevant information
generated by market transactions involving identical or comparable assets
or liabilities. For example, the market approach often uses market
multiples derived from a set of comparables. Multiples might lie in ranges
with a different multiple for each comparable. The selection of where
within the range each appropriate multiple falls requires judgment
considering factors specific to the measurement (qualitative and
quantitative).
|
28
|
|
·
|
Income Approach
(I): The income approach uses valuation techniques to convert
future amounts (for example, cash flows or earnings) to a single present
value amount (discounted). The measurement is based on the value indicated
by current market expectations about those future amounts. Those valuation
techniques include present value techniques; option-pricing models, such
as the Black-Scholes-Merton formula (a closed-form model) and a binomial
model (a lattice model), which incorporate present value techniques; and
the multi-period excess earnings method, which is used to measure the fair
value of certain assets.
|
GAAP
classifies the inputs used to measure fair value by these approaches into the
following hierarchy:
|
|
·
|
Level 1:
Unadjusted quoted prices in active markets for identical assets or
liabilities.
|
|
|
·
|
Level 2: Quoted
prices in active markets for similar assets or liabilities, or quoted
prices for identical or similar assets or liabilities in markets that are
not active, or inputs other than quoted prices that are observable for the
asset or liability.
|
|
|
·
|
Level 3:
Unobservable inputs for the asset or
liability.
|
Financial assets and liabilities are
classified in their entirety based on the lowest level of input that is
significant to the fair value measurement and are not necessarily an indication
of risks associated with the investment.
|
III.
|
Investment
Categories
|
The Company’s investments can be
classified into five broad categories for valuation purposes:
|
|
·
|
Equity-related
securities;
|
|
|
·
|
Long-term
fixed-income securities;
|
|
|
·
|
Short-term
fixed-income securities;
|
|
|
·
|
Investments
in intellectual property, patents, research and development in technology
or product development;
and
|
|
|
·
|
All
other securities.
|
The Company applies the methods for
determining fair value discussed above to the valuation of investments in each
of these five broad categories as follows:
|
|
A.
|
EQUITY-RELATED
SECURITIES
|
Equity-related
securities, including warrants, are fair valued using the market or income
approaches. The following factors may be considered when the market
approach is used to fair value these types of securities:
29
|
|
§
|
Readily
available public market quotations;
|
|
|
§
|
The
cost of the Company’s investment;
|
|
|
§
|
Transactions
in a company's securities or unconditional firm offers by responsible
parties as a factor in determining
valuation;
|
|
|
§
|
The
financial condition and operating results of the
company;
|
|
|
§
|
The
company's progress towards
milestones.
|
|
|
§
|
The
long-term potential of the business and technology of the
company;
|
|
|
§
|
The
values of similar securities issued by companies in similar
businesses;
|
|
|
§
|
Multiples
to revenue, net income or EBITDA that similar securities issued by
companies in similar businesses
receive;
|
|
|
§
|
The
proportion of the company's securities we own and the nature of any rights
to require the company to register restricted securities under applicable
securities laws; and
|
|
|
§
|
The
rights and preferences of the class of securities we own as compared with
other classes of securities the portfolio company has
issued.
|
When the income approach is used to
value warrants, the Company uses the Black-Scholes-Merton formula.
|
|
B.
|
LONG-TERM
FIXED-INCOME SECURITIES
|
|
|
1.
|
Readily
Marketable: Long-term fixed-income securities for which
market quotations are readily available are valued using the most recent
bid quotations when available.
|
|
|
2.
|
Not
Readily Marketable: Long-term fixed-income securities
for which market quotations are not readily available are fair valued
using the income approach. The factors that may be considered
when valuing these types of securities by the income approach
include:
|
|
|
·
|
Credit
quality;
|
|
|
·
|
Interest
rate analysis;
|
|
|
·
|
Quotations
from broker-dealers;
|
|
|
·
|
Prices
from independent pricing services that the Board believes are reasonably
reliable; and
|
|
|
·
|
Reasonable
price discovery procedures and data from other
sources.
|
30
|
|
C.
|
SHORT-TERM
FIXED-INCOME SECURITIES
|
Short-term fixed-income securities
are valued using the market approach in the same manner as long-term
fixed-income securities until the remaining maturity is 60 days or less, after
which time such securities may be valued at amortized cost if there is no
concern over payment at maturity.
|
|
D.
|
INVESTMENTS
IN INTELLECTUAL PROPERTY, PATENTS, RESEARCH AND DEVELOPMENT IN TECHNOLOGY
OR PRODUCT DEVELOPMENT
|
Such investments are fair valued using
the market approach. The Company may consider factors specific to these types of
investments when using the market approach including:
|
|
·
|
The
cost of the Company’s investment;
|
|
|
·
|
Investments
in the same or substantially similar intellectual property or patents or
research and development in technology or product development or offers by
responsible third parties;
|
|
|
·
|
The
results of research and
development;
|
|
|
·
|
Product
development and milestone progress;
|
|
|
·
|
Commercial
prospects;
|
|
|
·
|
Term
of patent;
|
|
|
·
|
Projected
markets; and
|
|
|
·
|
Other
subjective factors.
|
|
|
E.
|
ALL
OTHER SECURITIES
|
All other securities are reported at
fair value as determined in good faith by the Valuation Committee using the
approaches for determining valuation as described above.
For all other securities, the reported
values shall reflect the Valuation Committee's judgment of fair values as of the
valuation date using the outlined basic approaches of valuation discussed in
Section III. They do not necessarily represent an amount of money
that would be realized if we had to sell such assets in an immediate
liquidation. Thus, valuations as of any particular date are not
necessarily indicative of amounts that we may ultimately realize as a result of
future sales or other dispositions of investments we hold.
31
|
NOTES
TO CONSOLIDATED FINANCIAL STATEMENTS
(Unaudited)
|
NOTE 1. THE
COMPANY
Harris & Harris Group, Inc. (the
"Company," "us," "our" and "we"), is a venture capital company operating as a
business development company ("BDC") under the Investment Company Act of 1940
(the "1940 Act") that specializes in making investments in companies
commercializing and integrating products enabled by nanotechnology and
microsystems. We operate as an internally managed company whereby our
officers and employees, under the general supervision of our Board of Directors,
conduct our operations.
Harris & Harris Enterprises,
Inc.SM, is a
100 percent wholly owned subsidiary of the Company. Harris &
Harris Enterprises, Inc., is a partner in Harris Partners I, L.P. SM, and
is taxed under Subchapter C of the Code (a "C Corporation"). Harris
Partners I, L.P, is a limited partnership and, from time to time, may be used to
hold certain interests in portfolio companies. The partners of Harris
Partners I, L.P., are Harris & Harris Enterprises, Inc., (sole general
partner) and Harris & Harris Group, Inc. (sole limited
partner). Harris & Harris Enterprises, Inc., pays taxes on any
non-passive investment income generated by Harris Partners I,
L.P. For the period ended September 30, 2010, there was no
non-passive investment income generated by Harris Partners I,
L.P. The Company consolidates the results of its subsidiaries for
financial reporting purposes.
NOTE 2. INTERIM
FINANCIAL STATEMENTS
Our interim financial statements
have been prepared in accordance with the instructions to Form 10-Q and Article
10 of Regulation S-X and in conformity with accounting principles generally
accepted in the United States of America ("GAAP") applicable to interim
financial information. Accordingly, they do not include all
information and disclosures necessary for a presentation of our financial
position, results of operations and cash flows in conformity with
GAAP. In the opinion of management, these financial statements
reflect all adjustments, consisting of valuation adjustments and normal
recurring accruals, necessary for a fair presentation of our financial position,
results of operations and cash flows for such periods. The results of
operations for any interim period are not necessarily indicative of the results
for the full year. These financial statements should be read in
conjunction with the financial statements and notes thereto contained in
our Annual Report
on Form 10-K for the fiscal year ended December 31, 2009.
NOTE 3. SUMMARY
OF SIGNIFICANT ACCOUNTING POLICIES
The following is a summary of
significant accounting policies followed in the preparation of the consolidated
financial statements:
Principles of
Consolidation. The consolidated financial statements have been
prepared in accordance with GAAP and include the accounts of the Company and its
wholly owned subsidiary. All significant inter-company accounts and
transactions have been eliminated in consolidation. Certain prior
period amounts have been reclassified to conform to the current period
presentation.
32
Use of
Estimates. The preparation of the consolidated financial
statements in conformity with GAAP requires management to make estimates and
assumptions that affect the reported amounts of assets and liabilities and
contingent assets and liabilities and the reported amounts of revenues and
expenses. Actual results could differ from these estimates, and the
differences could be material. The most significant estimates relate
to the fair valuations of our investments.
Cash and Cash
Equivalents. Cash and cash equivalents includes demand
deposits. Cash and cash equivalents are carried at cost which
approximates value.
Portfolio Investment
Valuations. Investments are stated at "value" as defined in
the 1940 Act and in the applicable regulations of the Securities and Exchange
Commission ("SEC") and in accordance with GAAP. Value, as defined in
Section 2(a)(41) of the 1940 Act, is (i) the market price for those securities
for which a market quotation is readily available and (ii) the fair value as
determined in good faith by, or under the direction of, the Board of Directors
for all other assets. (See "Valuation Procedures" in the "Footnote to
Consolidated Schedule of Investments.") At September 30, 2010, our
financial statements include privately held venture capital investments valued
at $96,779,429. The fair values of our private venture capital
investments were determined in good faith by, or under the direction, of the
Board of Directors. Upon sale of investments, the values that are
ultimately realized may be different from what is presently
estimated. The difference could be material.
Foreign Currency
Translation. The accounting records of the Company are
maintained in U.S. dollars. All assets and liabilities denominated in
foreign currencies are translated into U.S. dollars based on the rate of
exchange of such currencies against U.S. dollars on the date of
valuation. For the nine months ended September 30, 2010, included in
the net decrease in unrealized depreciation on investments was a $46,860 unrealized gain resulting
from foreign currency translation.
Securities
Transactions. Securities transactions are accounted for on the
date the transaction for the purchase or sale of the securities is entered into
by the Company (i.e., trade date).
Interest Income
Recognition. Interest income, adjusted for amortization of
premium and accretion of discount, is recorded on an accrual
basis. When securities are determined to be non-income producing, the
Company ceases accruing interest and writes off any previously accrued
interest. During the three months and nine months ended September 30,
2010, the Company earned $15,327 and $38,161, respectively, in interest on U.S.
government securities, participation agreements and interest-bearing
accounts. During the three months and nine months ended September 30,
2010, the Company recorded $118,770 and $292,217, respectively, of bridge note
interest.
Loan Origination
Fees. Upfront loan origination fees received in
connection with investments are capitalized. The unearned fee income
is accreted into income based on the effective interest method over the life of
the investment.
Realized Gain or Loss and
Unrealized Appreciation or Depreciation of Portfolio Investments.
Realized gain or loss is recognized when an investment is disposed of and
is computed as the difference between the Company's cost basis in the investment
at the disposition date and the net proceeds received from such
disposition. Realized gains and losses on investment transactions are
determined by specific identification. Unrealized appreciation or
depreciation is computed as the difference between the fair value of the
investment and the cost basis of such investment.
33
Stock-Based
Compensation. The Company has a stock-based employee
compensation plan. The Company accounts for the Harris & Harris
Group, Inc. 2006 Equity Incentive Plan (the "Stock Plan") by determining the
fair value of all share-based payments to employees, including the fair value of
grants of employee stock options, and records these amounts as an expense in the
Consolidated Statements of Operations over the vesting period with a
corresponding increase to our additional paid-in capital. At
September 30, 2010, and December 31, 2009, the increase to our operating
expenses was offset by the increase to our additional paid-in capital, resulting
in no net impact to our NAV. Additionally, the Company does not
record the tax benefits associated with the expensing of stock options, because
the Company currently intends to qualify as a RIC under Subchapter M of the
Code. The amount of non-cash, stock-based compensation expense
recognized in the Consolidated Statements of Operations is based on the fair
value of the awards the Company expects to vest, recognized over the vesting
period on a straight-line basis for each award, and adjusted for actual options
vested and pre-vesting forfeitures. The forfeiture rate is estimated
at the time of grant and revised, if necessary, in subsequent periods if the
actual forfeiture rate differs from the estimated rate and is accounted for in
the current period and prospectively. See "Note
6. Stock-Based Compensation" for further discussion.
Income
Taxes. As we intend to qualify as a RIC under Subchapter M of
the Internal Revenue Code, the Company does not provide for income
taxes. The Company
recognizes interest and penalties in income tax expense.
We pay federal, state and local income
taxes on behalf of our wholly owned subsidiary, Harris & Harris Enterprises,
Inc., which is a C corporation. See "Note 7. Income
Taxes."
Restricted
Funds. At September 30, 2010, and December 31, 2009, we held
$2,001 and $2,000, respectively, in restricted funds as a security deposit for a
sublessor.
Property and
Equipment. Property and equipment are included in "Other
Assets" and are carried at $371,084 and $69,528 at September 30, 2010, and
December 31, 2009, respectively, representing cost, less accumulated
depreciation. Depreciation is provided using the straight-line method
over the estimated useful lives of the premises and equipment. We
estimate the useful lives to be five to ten years for furniture and fixtures,
three years for computer equipment, and ten years for leasehold
improvements.
Rent
expense. Our lease at 1450 Broadway, New York, New York,
commenced on January 21, 2010. The lease expires on December 31,
2019. The base rent is $36 per square foot with a 2.5 percent
increase per year over the 10 years of the lease, subject to a full abatement of
rent for four months and a rent credit for six months throughout the lease
term. Certain leasehold improvements were also paid for on our behalf
by the landlord, the cost of which is accounted for as property and equipment
and deferred rent in the accompanying Consolidated Statements of Assets and
Liabilities. These leasehold improvements are depreciated over the
lease term. We apply these rent abatements, credits and escalations
on a straight-line basis in the determination of rent expense over the lease
term.
Lease Termination
Costs. During the nine months ended September 30, 2010, we
recognized a loss of $68,038 for costs associated with vacating our offices at
111 West 57th Street,
New York, New York, prior to the end of our lease in April 2010.
34
Post Retirement Plan
Liabilities. Unrecognized actuarial gains and losses are
recognized as net periodic benefit cost pursuant to the Company's historical
accounting policy for amortizing such amounts. Actuarial gains and
losses that arise that are not recognized as net periodic benefit cost in the
same periods will be recognized as a component of net assets.
Concentration of Credit
Risk. The Company places its cash and cash equivalents with
financial institutions and, at times, cash held in checking accounts may exceed
the Federal Deposit Insurance Corporation insured limit.
Recent Accounting
Pronouncements. In January 2010, the FASB issued Accounting
Standards Update No. 2010-06, Fair Value Measurements and Disclosures (Topic
820) - Improving Disclosures about Fair Value Measurements. This
guidance requires reporting entities to make new disclosures about recurring and
nonrecurring fair value measurements, including significant transfers into and
out of Level 1 and Level 2 fair value measurements, and information on
purchases, sales, issuances and settlements, on a gross basis, in the
reconciliation of Level 3 fair value measurements. This guidance also
requires disclosure of fair value measurements by "class" instead of by "major
category" as well as any changes in valuation techniques used during the
reporting period. For disclosures of Level 1 and Level 2 activity,
fair value measurements by "class" and changes in valuation techniques, this
guidance was effective for interim and annual reporting periods beginning after
December 15, 2009, with disclosures for previous comparative periods prior to
adoption not required. The adoption of this portion of the guidance
on January 1, 2010, did not have a material impact on the Company's
disclosures. For the reconciliation of Level 3 fair value
measurements, this guidance is effective for interim and annual reporting
periods beginning after December 15, 2010. The adoption of this
portion of the guidance is not expected to have a material impact on the
Company's disclosures.
NOTE 4. BUSINESS
RISKS AND UNCERTAINTIES
We have invested a substantial portion
of our assets in privately held companies, the securities of which are
inherently illiquid. We also seek to invest in small publicly traded
companies that we believe have exceptional growth potential. Although
these companies are publicly traded, their stock may not trade at high volumes
and prices can be volatile, which may restrict our ability to sell our
positions. These privately held and publicly traded businesses tend
to lack management depth, to have limited or no history of operations and to not
have attained profitability. Because of the speculative nature of our
investments and the lack of a public market for privately held investments,
there is greater risk of loss than is the case with traditional investment
securities.
We do not
choose investments based on a strategy of diversification. We also do
not rebalance the portfolio should one of our portfolio companies increase in
value substantially relative to the rest of the portfolio. Therefore, the
value of our portfolio may be more vulnerable to events affecting a single
sector, industry or portfolio company and, therefore, subject to greater
volatility than a company that follows a diversification strategy. As
of September 30, 2010, our largest ten investments by value accounted for
approximately 71 percent of the value of our venture capital
portfolio. Our largest investment, by value, accounted for
approximately 21 percent of our venture capital portfolio at September 30,
2010.
35
Because there is typically no public or
readily ascertainable market for our interests in the small privately held
companies in which we invest, the valuation of the equity, bridge note and
participation agreement interests in that portion of our portfolio is determined
in good faith by our Valuation Committee, comprised of all of the independent
members of our Board of Directors, in accordance with our Valuation Procedures
and is subject to significant estimates and judgments. The determined
value of our portfolio of equity interests, bridge notes and participation
agreements may differ significantly from the values that would be placed on the
portfolio if a ready market for the equity interests, bridge notes and
participation agreements existed. Any changes in valuation are
recorded in our Consolidated Statements of Operations as "Net decrease
(increase) in unrealized depreciation on investments." Changes in
valuation of any of our investments in privately held companies from one period
to another may be volatile.
NOTE
5. INVESTMENTS
At
September 30, 2010, our financial assets were categorized as follows in the fair
value hierarchy:
|
Fair Value Measurement at Reporting Date
Using:
|
||||||||||||||||
|
Description
|
September
30,
2010
|
Quoted Prices in
Active
Markets for
Identical
Assets (Level
1)
|
Significant
Other
Observable
Inputs
(Level 2)
|
Significant
Unobservable
Inputs
(Level 3)
|
||||||||||||
|
U.S.
Government Securities
|
$ | 43,860,344 | $ | 43,860,344 | $ | 0 | $ | 0 | ||||||||
|
Privately
Held Portfolio Companies:
|
||||||||||||||||
|
Preferred
Stock
|
$ | 90,589,489 | $ | 0 | $ | 0 | $ | 90,589,489 | ||||||||
|
Bridge
Notes
|
$ | 3,716,174 | $ | 0 | $ | 0 | $ | 3,716,174 | ||||||||
|
Common
Stock
|
$ | 1,401,444 | $ | 0 | $ | 0 | $ | 1,401,444 | ||||||||
|
Warrants
|
$ | 581,922 | $ | 0 | $ | 0 | $ | 581,922 | ||||||||
|
Participation
Agreement
|
$ | 490,400 | $ | 490,400 | ||||||||||||
|
Publicly
Traded
|
||||||||||||||||
|
Portfolio
Companies:
|
||||||||||||||||
|
Common
Stock
|
$ | 0 | $ | 0 | $ | 0 | $ | 0 | ||||||||
|
Total
|
$ | 140,639,773 | $ | 43,860,344 | $ | 0 | $ | 96,779,429 | ||||||||
The
following chart shows the components of change in the financial assets
categorized as Level 3 for the three months ended September 30,
2010.
36
|
Beginning
Balance
7/1/2010
|
Total
Realized
Losses
Included
in
Changes
in
Net
Assets
|
Total
Unrealized
Gains
(Losses)
Included
in
Changes
in
Net
Assets
|
Investments
in
Private
Placements
and
Interest
on
Bridge
Notes,
Net
|
Disposals
|
Ending
Balance
9/30/2010
|
Amount
of Total Gains
for
the Period Included
in
Changes in Net
Assets
Attributable to
the
Change in
Unrealized
Gains or
Losses
Relating to
Assets
Still Held at the
Reporting
Date
|
||||||||||||||||||||||
|
Preferred
Stock
|
$ | 85,717,686 | $ | (3,136,552 | ) | $ | 4,092,902 | $ | 3,915,453 | $ | 0 | $ | 90,589,489 | $ | 956,350 | |||||||||||||
|
Bridge
Notes
|
4,658,791 | 0 | 112,804 | (1,055,420 | ) | 0 | 3,716,175 | 112,804 | ||||||||||||||||||||
|
Common
Stock
|
1,122,777 | 0 | 278,667 | 0 | 0 | 1,401,444 | 278,667 | |||||||||||||||||||||
|
Warrants
|
540,743 | 0 | (57,465 | ) | 98,643 | 0 | 581,921 | (57,465 | ) | |||||||||||||||||||
|
Participation
Agreement
|
0 | 0 | 10,052 | 480,348 | 0 | 490,400 | 10,052 | |||||||||||||||||||||
|
Total
|
$ | 92,039,997 | $ | (3,136,552 | ) | $ | 4,436,960 | $ | 3,439,024 | $ | 0 | $ | 96,779,429 | $ | 1,300,408 | |||||||||||||
The following chart shows the
components of change in the financial assets categorized as Level 3 for the nine
months ended September 30, 2010.
|
Beginning
Balance
1/1/2010
|
Total
Realized
Losses
Included
in
Changes
in
Net
Assets
|
Total
Unrealized
Gains
(Losses)
Included
in
Changes
in
Net
Assets
|
Investments
in
Private
Placements
and
Interest
on
Bridge
Notes,
Net
|
Disposals
|
Ending
Balance
9/30/2010
|
Amount
of Total Gains
for
the Period Included
in
Changes in Net
Assets
Attributable to
the
Change in
Unrealized
Gains or
Losses
Relating to
Assets
Still Held at the
Reporting
Date
|
||||||||||||||||||||||
|
Preferred
Stock
|
$ | 73,134,661 | $ | (3,136,552 | ) | $ | 12,410,293 | $ | 8,181,087 | $ | 0 | $ | 90,589,489 | $ | 9,273,741 | |||||||||||||
|
Bridge
Notes
|
2,718,225 | 0 | 112,804 | 885,146 | 0 | 3,716,175 | 112,804 | |||||||||||||||||||||
|
Common
Stock
|
1,164,599 | 0 | 227,967 | 8,878 | 0 | 1,401,444 | 227,967 | |||||||||||||||||||||
|
Warrants
|
779,601 | (257,007 | ) | (75,015 | ) | 134,342 | 0 | 581,921 | (75,015 | ) | ||||||||||||||||||
|
Participation
Agreement
|
0 | 0 | 10,052 | 480,348 | 0 | 490,400 | 10,052 | |||||||||||||||||||||
|
Total
|
$ | 77,797,086 | $ | (3,393,559 | ) | $ | 12,686,101 | $ | 9,689,801 | $ | 0 | $ | 96,779,429 | $ | 9,549,549 | |||||||||||||
37
At
December 31, 2009, our financial assets were categorized as follows in the fair
value hierarchy:
|
Fair Value Measurement at Reporting Date
Using:
|
||||||||||||||||
|
Description
|
December
31,
2009
|
Quoted Prices in
Active
Markets for
Identical
Assets (Level
1)
|
Significant
Other
Observable
Inputs
(Level 2)
|
Significant
Unobservable
Inputs
(Level 3)
|
||||||||||||
|
U.S.
Government Securities
|
$ | 55,947,581 | $ | 52,136,751 | $ | 3,810,830 | $ | 0 | ||||||||
|
Privately
Held Portfolio Companies:
|
||||||||||||||||
|
Preferred
Stock
|
$ | 73,134,661 | $ | 0 | $ | 0 | $ | 73,134,661 | ||||||||
|
Bridge
Notes
|
$ | 2,718,225 | $ | 0 | $ | 0 | $ | 2,718,225 | ||||||||
|
Common
Stock
|
$ | 1,164,599 | $ | 0 | $ | 0 | $ | 1,164,599 | ||||||||
|
Warrants
|
$ | 779,601 | $ | 0 | $ | 0 | $ | 779,601 | ||||||||
| $ | 77,797,086 | |||||||||||||||
|
Publicly
Traded
|
||||||||||||||||
|
Portfolio
Companies
|
$ | 226,395 | $ | 226,395 | $ | 0 | $ | 0 | ||||||||
|
Total
|
$ | 133,971,062 | $ | 52,363,146 | $ | 3,810,830 | $ | 77,797,086 | ||||||||
The
following chart shows the components of change in the financial assets
categorized as Level 3, for the twelve months ended December 31,
2009.
|
Fair
Value Measurements Using Significant
|
||||
|
Unobservable
Inputs (Level 3)
|
||||
|
Portfolio
Companies
|
||||
|
Beginning
Balance, January 1, 2009
|
$ | 56,965,153 | ||
|
Total
realized losses included in change in net assets
|
(11,106,005 | ) | ||
|
Total
unrealized gains included in change in net assets
|
19,830,852 | |||
|
Investments
in private placements and interest on bridge notes
|
12,212,789 | |||
|
Disposals
and write-offs of bridge note interest
|
(105,703 | ) | ||
|
Ending
Balance, December 31, 2009
|
$ | 77,797,086 | ||
|
The
amount of total gains for the period
|
||||
|
included
in changes in net assets attributable to the
|
||||
|
change
in unrealized gains or losses relating to
|
||||
|
assets
still held at the reporting date
|
$ | 8,786,290 | ||
NOTE
6. STOCK-BASED COMPENSATION
On March
18, 2010, and May 12, 2010, the Compensation Committee of the Board of Directors
and the full Board of Directors of the Company approved grants of individual
Non-Qualified Stock Option ("NQSO") awards for certain officers and employees of
the Company. The terms and conditions of the stock options granted
were set forth in award agreements between the Company and each award recipient
entered into on those dates. Options to purchase a total of 150,000
shares of stock were granted on March 18, 2010, with vesting periods ranging
from March 18, 2011, to March 18, 2013, and with an exercise price of $4.75,
which was the closing price of our shares of common stock as quoted on the
Nasdaq Global Market on March 18, 2010. Options to purchase a total
of 150,000 shares of stock were granted on May 12, 2010, with vesting periods
ranging from May 12, 2011, to May 12, 2013, and with an exercise price of $4.84,
which was the closing price of our shares of common stock as quoted on the
Nasdaq Global Market on May 12, 2010. The awards may become fully
vested and exercisable prior to the date or dates in the vesting schedule if the
Board of Directors accepts an offer for the sale of all or substantially all of
the Company's assets. Upon exercise, the shares would be issued from
our previously authorized but unissued shares.
38
The fair
value of the options was determined on the date of grant using the
Black-Scholes-Merton model.
The assumptions used in the calculation
of fair value of the NQSOs granted on March 18, 2010, and May 12, 2010, using
the Black-Scholes-Merton model for the expected term was as
follows:
|
Weighted
|
|||||||
|
Number
of
Options
|
Expected
|
Expected
|
Expected
|
Risk-Free
|
Average
Fair
Value
|
||
|
Type of Award
|
Term
|
Granted
|
Term in Yrs
|
Volatility Factor
|
Dividend Yield
|
Interest Rates
|
Per Share
|
|
March
18, 2010 Non-qualified stock options
|
5
Years
|
150,000
|
3.50
|
63.1%
|
0%
|
1.77%
|
$2.20
|
|
May
12, 2010 Non-qualified stock options
|
5
Years
|
150,000
|
3.50
|
62.3%
|
0%
|
1.64%
|
$2.21
|
|
|
|
||||||
|
Total
|
300,000
|
$2.21
|
For the
three months and nine months ended September 30, 2010, the Company recognized
$531,795 and $1,746,734 of compensation expense in the Consolidated Statements
of Operations. As of September 30, 2010, there was approximately
$4,956,008 of unrecognized compensation cost related to unvested stock option
awards. This cost is expected to be recognized over a weighted
average period of approximately 1.5 years.
For the three months ended September
30, 2010, a total of 5,306 options were exercised for total proceeds to the
Company of $19,898. For the nine months ended September 30, 2010, a
total of 10,612 options were exercised for total proceeds to the Company of
$39,795.
A summary of the changes in outstanding
stock options for the nine months ended September 30, 2010, is as
follows:
39
|
Weighted
Average
|
||||||
|
Weighted
|
Weighted
Average
|
Remaining
|
Aggregate
|
|||
|
Average
|
Grant
Date
|
Contractual
|
Intrinsic
|
|||
|
Shares
|
Exercise Price
|
Fair Value
|
Term (Yrs)
|
Value
|
||
|
Options
Outstanding at January 1, 2010
|
4,184,503
|
$8.20
|
$4.79
|
6.24
|
$216,333
|
|
|
Granted
|
300,000
|
$4.80
|
$2.21
|
4.54
|
||
|
Exercised
|
(10,612)
|
$3.75
|
$1.29
|
|||
|
Forfeited
or Expired
|
(3,245)
|
$4.82
|
$2.24
|
|||
|
Options
Outstanding at September 30, 2010
|
4,470,646
|
$7.98
|
$4.63
|
5.44
|
$ 107,571
|
|
|
Options
Exercisable at September 30, 2010
|
2,934,598
|
$8.61
|
$4.96
|
5.11
|
$ 107,571
|
|
|
Options
Exercisable and Expected to be Exercisable at September 30,
2010
|
4,178,811
|
$8.05
|
$4.67
|
5.39
|
$ 107,571
|
The
aggregate intrinsic value in the table above with respect to options
outstanding, exercisable and expected to be exercisable, is calculated as the
difference between the Company's closing stock price of $4.27 on the last
trading day of the third quarter of 2010 and the exercise price, multiplied by
the number of in-the-money options. This amount represents the total
pre-tax intrinsic value that would have been received by the option holders had
all options been fully vested and all option holders exercised their awards on
September 30, 2010. The intrinsic value on the dates of exercise of
10,612 options exercised during the nine months ended September 30, 2010, was
$8,521.
On June
2, 2010, the Company announced that its Compensation Committee has cancelled its
previously scheduled meetings for the purpose of awarding stock options pursuant
to the Stock Plan in 2010, and it will not award stock options for at least one
year from the date of the announcement. The Compensation Committee
also decided that any future grants of options, if they occur, will not be
awarded at a price below NAV per share.
NOTE 7. INCOME
TAXES
We have
elected to be treated as a regulated investment company (“RIC”) under Subchapter
M of the Internal Revenue Code of 1986, as amended (the “Code”) and operate in a
manner so as to qualify for the tax treatment applicable to RICs.
In order
to qualify as a RIC, we must, in general, (1) annually, derive at least 90
percent of our gross income from dividends, interest, gains from the sale of
securities and similar sources; (2) quarterly, meet certain investment
diversification requirements; and (3) annually, distribute at least 90 percent
of our investment company taxable income as a dividend. We may
either distribute or retain our net capital gain from investments, but any net
capital gain not distributed will be subject to corporate income tax and the
excise tax described below. We will be subject to a four percent
excise tax to the extent we fail to distribute at least 98 percent of our annual
net ordinary income and 98 percent of our capital gain net income and would be
subject to income tax to the extent we fail to distribute 100 percent of our
investment company taxable income.
40
Because
of the specialized nature of our investment portfolio, we generally can satisfy
the diversification requirements under the Code if we receive a certification
from the SEC that we are "principally engaged in the furnishing of capital to
other corporations which are principally engaged in the development or
exploitation of inventions, technological improvements, new processes, or
products not previously generally available."
On
May 28, 2010, we received SEC certification for 2009, permitting us to qualify
for RIC treatment for 2009 (as we had for the years 1999 through 2008) pursuant
to Section 851(e) of the Code. Although the SEC certification for
2009 was issued, there can be no assurance that we will qualify for or receive
such certification for subsequent years (to the extent we need additional
certification as a result of changes in our portfolio) or that we will actually
qualify for Subchapter M treatment in subsequent years. We qualified
for RIC treatment in 2009 even without certification. In addition,
under certain circumstances, even if we qualified for Subchapter M treatment in
a given year, we might take action in a subsequent year to ensure that we would
be taxed in that subsequent year as a C Corporation, rather than as a
RIC. Because Subchapter M does not permit deduction of operating
expenses against net capital gain, it is not clear that the Company and its
shareholders have paid less in taxes since 1999 than they would have paid had
the Company remained a C Corporation.
For the
nine months ended September 30, 2010, we paid $4,431 in state and local income
and franchise taxes. During the third quarter of 2010, we paid $1,799
in state franchise taxes. At September 30, 2010, we had $0 accrued
for federal, state and local taxes payable by the Company.
We pay
federal, state and local taxes on behalf of our wholly owned subsidiary, Harris
& Harris Enterprises, Inc., which is taxed as a C
Corporation. For the three months ended September 30, 2010, and 2009,
our income tax expense (benefit) for Harris & Harris Enterprises, Inc., was
$0 and $(2,960), respectively. For the nine months ended September
30, 2010, and 2009, our income tax expense (benefit) for Harris & Harris
Enterprises, Inc., was $2,527 and $(2,960), respectively.
NOTE 8. CAPITAL
TRANSACTIONS
On
October 9, 2009, we closed a public follow-on offering of 4,887,500 shares of
our common stock at a price of $4.75 per share to the public. The net
proceeds of this offering, after deducting underwriting discounts and offering
costs of $2,000,413, were $21,215,212.
NOTE 9. CHANGE IN
NET ASSETS PER SHARE
The following table sets forth the
computation of basic and diluted per share net (decreases) increases in net
assets resulting from operations for the three months and nine months ended
September 30, 2010, and September 30, 2009.
41
|
For
the Three Months Ended
September
30
|
For
the Nine Months Ended
September
30
|
|||||
|
2010
|
2009
|
2010
|
2009
|
|||
|
Numerator
for (decrease) increase in net assets per share
|
$(454,032)
|
$(296,319)
|
$3,384,651
|
$(826,376)
|
||
|
Denominator
for basic weighted average shares
|
30,866,399
|
25,866,983
|
30,863,616
|
25,862,070
|
||
|
Basic
net (decrease) increase in net assets per share resulting from
operations
|
$(0.01)
|
$(0.01)
|
$0.11
|
$(0.03)
|
||
|
Denominator
for diluted weighted average shares
|
30,866,399
|
25,866,983
|
30,895,197
|
25,862,070
|
||
|
Diluted
net (decrease) increase in net assets per share resulting from
operations
|
$(0.01)
|
$(0.01)
|
$0.11
|
$(0.03)
|
||
For the nine months ended September 30,
2010, the calculation of net increase in net assets resulting from operations
per diluted share includes 31,581 stock options from the March 2009 grant
because such options were dilutive. All other options granted in the
period from June 2006 through May 2010 were anti-dilutive. Stock
options may be dilutive in future periods in which there is a net increase in
net assets resulting from operations, or in the event that there are significant
increases in the average stock price in the stock market or significant
decreases in the amount of unrecognized compensation cost.
NOTE
10. SUBSEQUENT EVENTS
On October 27, 2010, we made a $300,000 follow-on investment in a privately
held tiny technology portfolio
company.
42
|
HARRIS
& HARRIS GROUP, INC.
FINANCIAL
HIGHLIGHTS
(Unaudited)
|
|
Three Months Ended Sept. 30
|
Nine Months Ended
Sept. 30
|
|||||||||||||||
|
2010
|
2009
|
2010
|
2009
|
|||||||||||||
|
Per
Share Operating Performance
|
||||||||||||||||
|
Net
asset value per share, beginning
|
||||||||||||||||
|
of
period
|
$ | 4.51 | $ | 4.27 | $ | 4.35 | $ | 4.24 | ||||||||
|
Net
operating (loss)*
|
(0.05 | ) | (0.08 | ) | (0.19 | ) | (0.25 | ) | ||||||||
|
Net
realized (loss) on investments*(1)
|
(0.10 | ) | (0.12 | ) | (0.11 | ) | (0.18 | ) | ||||||||
|
Net
decrease in unrealized
|
||||||||||||||||
|
depreciation
as a result of sales*(1)
|
0.10 | 0.12 | 0.11 | 0.18 | ||||||||||||
|
Net
decrease (increase) in unrealized
|
||||||||||||||||
|
depreciation
on investments held*
|
0.04 | 0.07 | 0.30 | 0.21 | ||||||||||||
|
Total
from investment operations*
|
(0.01 | ) | (0.01 | ) | 0.11 | (0.04 | ) | |||||||||
|
Net
increase as a result of stock-
|
||||||||||||||||
|
based
compensation expense*
|
0.01 | 0.03 | 0.05 | 0.09 | ||||||||||||
|
Net
increase as a result of proceeds
|
||||||||||||||||
|
from
exercise of options
|
0.00 | 0.01 | 0.00 | 0.01 | ||||||||||||
|
Total
increase from capital
|
||||||||||||||||
|
stock transactions
|
0.01 | 0.04 | 0.05 | 0.10 | ||||||||||||
|
Net
asset value per share, end
|
||||||||||||||||
|
of
period
|
$ | 4.51 | $ | 4.30 | $ | 4.51 | $ | 4.30 | ||||||||
|
Stock
price per share, end
|
||||||||||||||||
|
of
period
|
$ | 4.27 | $ | 6.25 | $ | 4.27 | $ | 6.25 | ||||||||
|
Total
return based on stock price (2)
|
4.40 | % | 7.20 | % | (6.56 | )% | 58.23 | % | ||||||||
|
Supplemental
Data:
|
||||||||||||||||
|
Net
assets, end of period
|
$ | 139,280,510 | $ | 111,532,206 | $ | 139,280,510 | $ | 111,532,206 | ||||||||
|
Ratio
of expenses to average
|
||||||||||||||||
|
net
assets (2)
|
1.4 | % | 2.1 | % | 4.5 | % | 5.9 | % | ||||||||
|
Ratio
of net operating loss to
|
||||||||||||||||
|
average
net assets (2)
|
(1.3 | )% | (2.0 | )% | (4.3 | )% | (5.8 | )% | ||||||||
|
Number
of shares outstanding,
|
||||||||||||||||
|
end
of period
|
30,870,205 | 25,966,758 | 30,870,205 | 25,966,758 | ||||||||||||
*Based on
Average Shares Outstanding
(1)
Net realized and unrealized gains (losses) include rounding adjustments to
reconcile change in net asset value per share. See Item 2.
"Management's Discussion and Analysis of Financial Condition and Results of
Operations" for a description of realized and unrealized gains and
losses.
(2) Not
annualized
The
accompanying notes are an integral part of this schedule.
43
|
Item
2.
|
Management's
Discussion and Analysis of Financial Condition and Results of
Operations
|
The information contained in this
section should be read in conjunction with the Company's unaudited September 30,
2010, Consolidated Financial Statements and the Company's audited 2009
Consolidated Financial Statements and notes thereto.
Background
and Overview
We incorporated under the laws of the
state of New York in August 1981. In 1983, we completed an initial
public offering ("IPO"). In 1984, we divested all of our assets
except Otisville BioTech, Inc., and became a financial services company with the
investment in Otisville as the initial focus of our business
activity.
In 1992, we registered as an investment
company under the 1940 Act, commencing operations as a closed-end,
non-diversified investment company. In 1995, we elected to become a
BDC subject to the provisions of Sections 55 through 65 of the 1940
Act.
We are a
venture capital company that specializes in making investments in companies
commercializing and integrating products enabled by nanotechnology and
microsystems. We define venture capital investments as the money and
resources made available to privately held start-up firms and privately held and
publicly traded small businesses with exceptional growth
potential. Nanotechnology is the study of structures measured in
nanometers, which are units of measurement in billionths of a
meter. Microsystems are measured in micrometers, which are units of
measurement in millionths of a meter. We sometimes use "tiny
technology" to describe both of these disciplines.
We
consider a company to fit our investment thesis if the company employs or
intends to employ technology that we consider to be at the microscale or smaller
and if the employment of that technology is material to its business
plan. By making these investments, we seek to provide our
shareholders with a specific focus on nanotechnology and microsystems through a
portfolio of venture capital investments that address a variety of markets and
products.
As of
September 30, 2010, $96,779,429, or 68 percent, of our total assets at fair
value consisted of privately held venture capital investments, net of unrealized
depreciation of $1,607,893. As of December 31, 2009, $77,797,086, or
57 percent, of our total assets at fair value consisted of privately held
venture capital investments, net of unrealized depreciation of
$14,293,994.
We
believe that we are the only publicly traded BDC making venture capital
investments exclusively in nanotechnology and microsystems. We
believe we provide four core benefits to our shareholders. First, we
are an established firm with a track record of investing in venture
capital-backed companies. Second, we provide shareholders with access
to emerging companies that commercialize and integrate products enabled by
nanotechnology and microsystems that are privately and publicly
owned. Third, we have an existing portfolio of companies that we
believe are comparable in stage to those found in the latter years of a private
venture capital fund. Fourth, we provide access to venture capital
investments in a vehicle that, unlike private venture capital firms, is both
transparent and liquid.
44
Investment
Strategy
We have
discretion in the investment of our capital. Throughout our corporate
history, we have made primarily early-stage venture capital investments in a
variety of industries. These businesses can range in stage from
pre-revenue to generating positive cash flow. These businesses tend
to be thinly capitalized, unproven, small companies that lack management depth,
have little or no history of operations and are developing unproven
technologies. We historically have invested in equity securities of
these companies that take the form of preferred stock and that are generally
illiquid due to restrictions on resale and to the lack of an established trading
market.
Additionally,
we provide debt financing to privately held or publicly traded companies that
are generating cash or have near-term visibility to reaching positive cash
flow. Credit remains extremely expensive or unavailable for even the
strongest small privately held and publicly traded companies. In
addition to fees and monthly principal and interest payments, we may receive
warrants in these investments. Providing venture debt enables us to generate
near-term cash flow with a defined period for return on our
investment.
With the lengthening time between
investment and return on investment in privately held venture capital-backed
companies, we seek to generate returns with greater frequency by also investing
in publicly traded companies. Some of these companies have revenue
and some are generating positive cash flow. Several of these
companies are one to two years ahead of similar venture capital-funded,
privately held companies but currently trade at a deep discount to the value of
similar privately held companies. We believe our time frame from
investment to monetization of our investment in these publicly traded companies
could be shorter than that of our privately held companies and that our domain
expertise, combined with our venture capital skill-sets and deal structure
know-how, provide important competitive advantages in this
space. Although currently we are focused primarily on investing in
opportunities with market capitalizations below $50 million, we may invest in
publicly traded companies with market capitalizations anywhere below $500
million.
Historical
Investments
Since our investment in Otisville in
1983 through September 30, 2010, we have made a total of 89 venture capital
investments. We have exited 58 of these 89 investments, realizing
total gross proceeds of $144,325,044 on our cumulative invested capital of
$75,537,972.
In 1994, we invested in our first
nanotechnology company, Nanophase Technologies
Corporation. Recognizing the potential of nanotechnology, we
continued to monitor developments in the field. From August 2001
through September 30, 2010, all 47 of our initial investments have been in
companies commercializing or integrating products enabled by nanotechnology or
microsystems. From August 2001 through September 30, 2010, we have
invested a total (before any subsequent write-ups, write-downs or dispositions)
of $126,415,833 in these companies. We currently have 31 companies in
our portfolio, including one investment made prior to 2001. At
September 30, 2010, from first dollar in, the average and median holding periods
for these 31 investments were 4.9 years and 4.5 years,
respectively. Historically, as measured from first dollar in to last
dollar out, the average and median holding periods for the 58 investments we
have exited were 3.9 years and 3.3 years, respectively.
45
Investment
Pace
The following is a summary of our
initial and follow-on investments in nanotechnology from January 1, 2006, to
September 30, 2010. We consider a "round led" to be a round where we
were the new investor or the leader of a set of investors in an investee
company. Typically, but not always, the lead investor negotiates the
price and terms of the deal with the investee company.
|
2006
|
2007
|
2008
|
2009
|
Nine
Months Ended
September 30, 2010
|
|
|
Total
Incremental Investments
|
$24,408,187
|
$20,595,161
|
$17,779,462
|
$12,334,051
|
$9,667,071
|
|
Investments
in Equity and Convertible Bridge Notes in Privately Held
Companies
|
|||||
|
No.
of New Investments
|
6
|
7
|
4
|
1
|
1
|
|
No.
of Follow-On Investment Rounds
|
14
|
20
|
25
|
27
|
22
|
|
No.
of Rounds Led
|
7
|
3
|
4
|
5
|
4
|
|
Average
Dollar Amount – Initial
|
$2,383,424
|
$1,086,441
|
$683,625
|
$250,000
|
$250,000
|
|
Average
Dollar Amount – Follow-On
|
$721,974
|
$649,504
|
$601,799
|
$436,490
|
$394,027
|
|
Investments
in Equity in Publicly Traded Companies
|
|||||
|
No.
of New Investments(1)
|
0
|
0
|
0
|
1
|
1
|
|
No.
of Follow-On Investment Rounds(1)
|
0
|
0
|
0
|
2
|
3
|
|
Average
Dollar Amount – Initial
|
$0
|
$0
|
$0
|
$99,624
|
$99,957
|
|
Average
Dollar Amount – Follow-On
|
$0
|
$0
|
$0
|
$99,602
|
$49,507
|
|
Investments
in Non-Convertible Debt Securities
|
|||||
|
No.
of New Investments
|
0
|
0
|
0
|
0
|
1
|
|
Average
Dollar Amount
|
$0
|
$0
|
$0
|
$0
|
$500,000
|
(1) These
investments in publicly traded companies were subsequently sold. At
September 30, 2010, we had no equity investments in publicly traded
companies.
Importance
of Availability of Liquid Capital
Private venture capital funds are
structured commonly as limited partnerships with a committed level of capital
and finite lifetime. Capital is "called" from limited partners to
make investments and pay for expenses of running the firm at various points
within the lifetime of the fund. For each initial investment, the
fund must reserve additional capital for follow-on investments at later stages
of the life of the portfolio companies. These follow-on investments
are required because often venture-backed portfolio companies in areas in which
we invest, whether privately held or publicly traded, operate with negative cash
flow for lengthy periods of time. In general, the cumulative total of
initial invested capital and reserves cannot exceed the committed level of
capital of the fund.
46
Our strategy for investing capital is
similar to this approach in some respects. We make initial
investments in privately held and publicly traded companies and project the
amount of capital that may be required should the company mature
successfully. These projections, equivalent to the reserves of
private venture capital funds, are reviewed weekly by management, are updated
frequently and are a component of the data that guide our decisions on whether
to make new and follow-on investments. As a publicly traded,
internally managed venture capital company, our cash used to make investments
and pay expenses is held by us and not called from external sources when
needed. Accordingly, it is crucial that we operate the company with a
substantial balance of liquid capital for this reason and for four additional
reasons.
|
1)
|
We
manage the company and our investment pace and criteria such that our
projected needs for capital to make new and follow-on investments do not
exceed the total of our liquid investments. Although we use
best efforts to predict when this capital will be required for use in new
and follow-on investments, we cannot predict with certainty the timing for
these investments. We would be unable to make new or follow-on
investments in our portfolio companies without having substantial liquid
resources of capital available to
us.
|
|
2)
|
Venture
capital firms traditionally invest beside other venture capital firms in a
process called syndication. The size of the fund and the amount
of capital reserves available to syndicate partners is often an attribute
that potential co-investors consider when deciding on syndicate
partners. As we do not have committed capital from limited
partners, we believe we must have adequate available liquid capital on our
balance sheet to be able to have access to high-quality deal
flow.
|
|
3)
|
We
rarely commit the total amount of cumulative capital intended for
investment in any portfolio company at one point in
time. Instead, our investments consist of multiple rounds of
financing of a given portfolio company, in which we typically participate
if we believe that the merits of such an investment outweigh the
risks. We also commonly have preemptive rights to invest
additional capital in our privately held portfolio
companies. These rights are useful to protect and potentially
increase the value of our positions in our portfolio companies as they
mature. Commonly, the terms of such financings in privately
held companies also include penalties for those investors that do not
invest in these subsequent rounds of financing. Without
available capital at the time of investment, our ownership in the company
would be subject to these penalties that can lead to a partial or complete
loss of the capital invested prior to that round of
financing.
|
|
4)
|
We
may have the opportunity to increase ownership in late rounds of financing
in some of our most mature companies. Many private venture
capital funds that invested in these companies are reaching the end of the
term associated with their limited partnerships. This issue may
limit the available capital to these funds for follow-on investments, and
the ability to take advantage of potentially valuable terms given to those
who have investable capital. Having permanent, liquid capital
available for investment allows us to take advantage of these
opportunities as they arise.
|
47
Involvement
with Portfolio Companies
The 1940 Act requires that BDCs offer
to "make available significant managerial assistance" to portfolio
companies. We are actively involved with our portfolio companies
through membership on boards of directors, as observers to the boards of
directors and/or through frequent communication with management. As
of September 30, 2010, we held at least a board seat or observer rights on 25 of
our 31 portfolio companies (81 percent).
We may hold two or more board seats in
early-stage portfolio companies or those in which we have significant
ownership. As of September 30, 2010, we held two board seats in
Ancora Pharmaceuticals and Enumeral Technologies. We may transition
off of the board of directors to an observer role as our portfolio companies
raise additional capital from new investors, as they mature or as they are able
to attract independent members who have relevant industry experience and
contacts. We also typically step off the board of directors upon the
completion of an IPO.
We may be actively involved in the
formation and development of business strategies of our earliest stage portfolio
companies. This involvement may include hiring management, licensing
intellectual property, securing space and raising additional
capital. We also provide managerial assistance to late-stage
companies looking for potential exit opportunities by leveraging our status as a
publicly traded company through our relationships with the banking community and
our knowledge and experience implementing and complying with Section 404 of the
Sarbanes-Oxley Act for larger companies.
Commercialization
of Nanotechnology by Our Portfolio Companies
Our nanotechnology investments have
matured around three main industry clusters: cleantech (45.1 percent of our
venture capital portfolio as of September 30, 2010); electronics, including
semiconductors (25.6 percent of our venture capital portfolio as of September
30, 2010); and healthcare/biotechnology (14.2 percent of our venture capital
portfolio as of September 30, 2010). We call these three areas
"Nanotech for CleantechSM,"
"Nanotech for ElectronicsSM," and
"Nanotech for HealthcareSM,"
respectively. We have and may continue to make investments outside
these industry areas, and we may not maintain these industry clusters or the
weightings within these clusters.
48
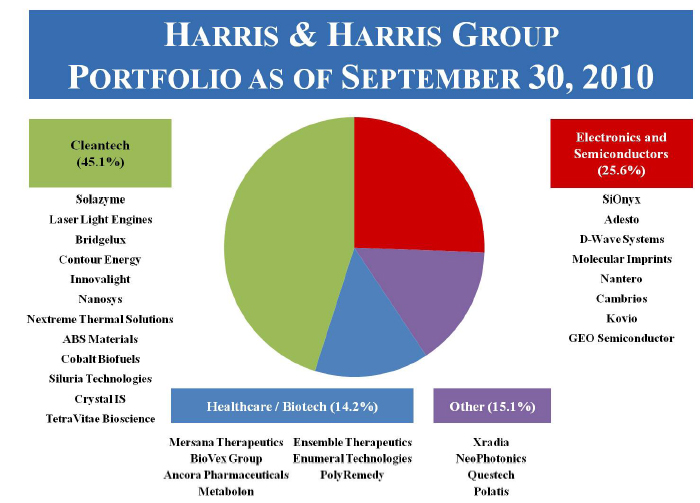
These
three clusters are comprised of multi-billion dollar industries that have grown
historically through innovation of technology. "Cleantech" is a term
used commonly to describe products and processes that solve global problems
related to resource constraints. We classify Nanotech for
CleantechSM
companies as those that seek to improve performance, productivity or efficiency,
and to reduce environmental impact, waste, cost, energy consumption or raw
materials using nanotechnology-enabled solutions.
We classify Nanotech for
ElectronicsSM
companies as those that use nanotechnology to address problems in
electronics-related industries, including semiconductors.
We classify Nanotech for
HealthcareSM
companies as those that use nanotechnology to address problems in
healthcare-related industries, including biotechnology, pharmaceuticals and
medical devices.
We believe the development and
commercialization of nanotechnology-enabled solutions are the result of the
convergence of traditionally separate scientific disciplines such as biology,
materials science, chemistry, electronics, information technology, and
physics. We believe such nanotechnology‐enabled advances
in each of these industry clusters, and in general, could not otherwise occur
within one discipline alone.
49
We define market domains as groupings
of technology that enable new user, business or economic experiences. There are
many billion-dollar market domains within each of the above listed industry
clusters. These market domains hold the potential for effecting substantial
change in everyday life. Our experience is that technology adoption
occurs on two time scales. Existing market domains can allow for
rapid adoption as new technologies are continuously added to the existing
domain. These new technologies refine and improve the existing
experience provided by the market domain. Emerging market domains
often require more time for the adoption of technology than existing market
domains, as the new market domain is itself being absorbed by society and the
economy.
We classify our portfolio companies
into either existing market domains or emerging market domains. We expect that
the time scale at which these companies mature commercially will be impacted by
whether their technology is being adopted into an existing market domain or an
emerging market domain. We continue to look for investment
opportunities in emerging market domains, as we believe these investments have
the potential to create outsized venture capital returns.
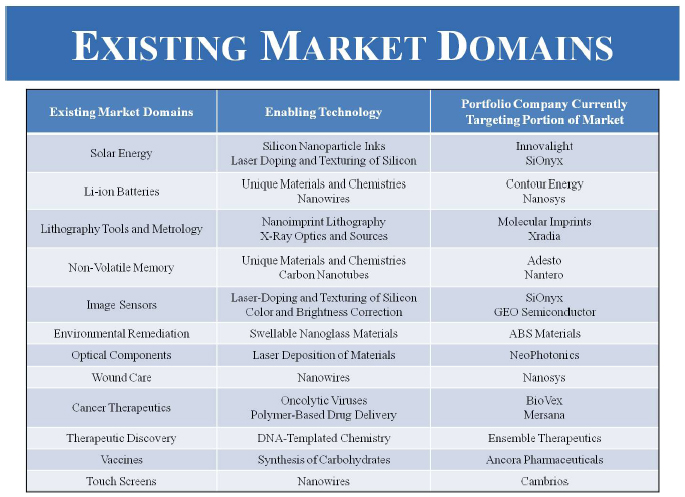
50
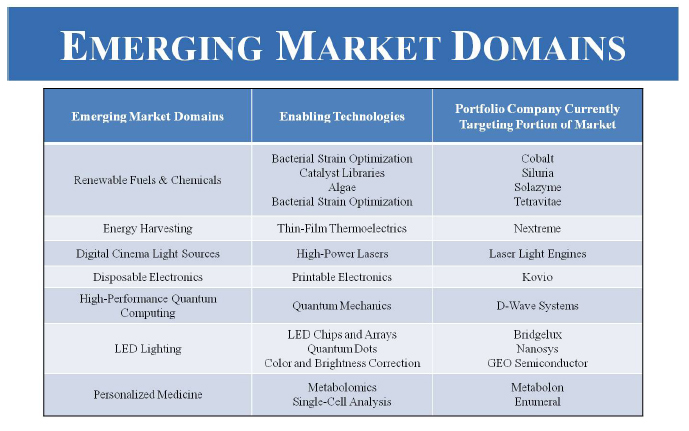
Maturity
of Current Venture Capital Portfolio
Our venture capital portfolio is
composed of companies at varying maturities facing different types of
risks. We have defined these levels of maturity and sources of risk
as: 1) Early Stage / Technology Risk, 2) Mid Stage / Market Risk and 3) Late
Stage / Execution Risk. Early-stage companies have a high degree of
technical, market and execution risk, which is typical of initial investments by
venture capital firms, including us. These companies often require
substantial development of their technologies before they begin introducing
products to market. Mid-stage companies are those that have overcome
most of the technical risk associated with their products and are now focused on
addressing the market acceptance for their products. For those
companies developing therapeutics or medical devices, the focus is on bringing
their products through the first phases of clinical
trials. Late-stage companies are those that have determined there is
a market for their products, and they are now focused on sales execution and
scale. Late-stage healthcare and biotechnology companies are
typically either in Phase III Clinical Trials, which are the pivotal trials
before a possible FDA approval and commercial launch of a product, or are
generating revenue from the commercial sale of one or more
products. The charts below show our assessment of the stage of
maturity of our 31 portfolio companies and the distribution of ownership of our
portfolio companies within each of these stages of maturity,
respectively.
51

52
We seek
to create a portfolio of companies that enables consistent flows of potential
exit events in multiple industry sectors that can be monetized as these
companies mature. We believe a portfolio of companies focused on a
diverse set of industry clusters reduces the potential impact of cyclicality of
any one cluster on the flow of potential exit events. Our current
portfolio is comprised of companies at varying stages of maturity in a diverse
set of industry clusters. As our portfolio companies mature, we seek
to invest in new early and mid-stage companies that may mature into mid and
late-stage companies. This continuous progression creates a pipeline
of investment maturities that may lead to more frequent exit events of our
portfolio companies. This pipeline is demonstrated by the
distribution of our current portfolio companies by stage within each industry
cluster.
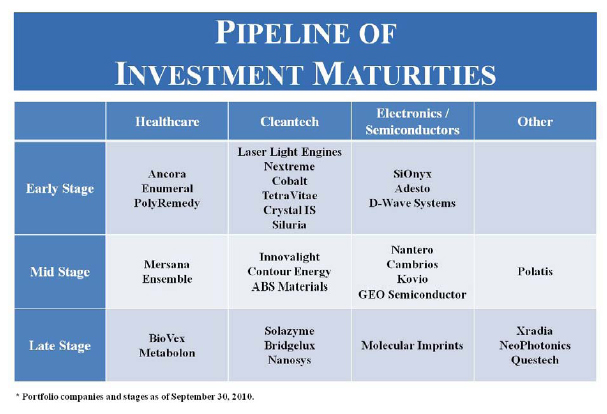
We expect
some of our portfolio companies to transition between stages of maturity
over time. This transition may be forward if the company is maturing and
is successfully executing its business plan or may be backward if the company is
not successfully executing its business plan or decides to change its business
plan substantially from its original plan. Transitions backward are
commonly accompanied by an increase in non-performance risk, which reduces
valuation. We discuss non-performance risk and its implications on
value below in the section titled Valuation of Investments.
From June
30, 2010, to September 30, 2010, we transitioned one company, Nanosys, Inc.,
from being classified as a mid-stage company to a late-stage
company. We classified our new portfolio company, GEO Semiconductor
Inc., as a mid-stage company as of September 30, 2010.
53
We
currently have 22 companies in our venture capital portfolio that generate
revenues ranging from nominal to significant from commercial sales of products
and/or services, from commercial partnerships and/or from government
grants.
On April 15, 2010, NeoPhotonics
Corporation filed a registration statement on Form S-1 to register its shares of
common stock for an IPO. We believe that in the next 6 to 12 months
one or more of our other late-stage portfolio companies could take steps toward
a filing of a registration statement on Form S-1 for an IPO. There
can be no assurance that these companies will successfully complete IPOs, and a
variety of factors, including stock market and general business conditions,
could lead them to terminate such IPOs.
During the third quarter of 2010, two
of our privately held companies retained bankers to explore opportunities to
sell those companies. There can be no assurance that these companies
will successfully complete a sale. A variety of factors, including
general business conditions, could lead them to terminate such
efforts.
Current
Business Environment
The
third quarter of 2010 concluded with the public markets increasing broadly in
value, including the best performance in the month of September since
1939. Amidst this improvement in the value of public equities, there
were continued positive signs in the exit market for venture-backed companies
with nine venture-backed companies managing to complete IPOs, up from two IPOs
in the same quarter of 2009. However, most companies that debuted on a public exchange either priced lower than expected,
performed poorly once they debuted, or both. The number of merger
and acquisition ("M&A") transactions of venture-backed companies was up from
the second quarter of 2010; however, the median amount paid for a venture-backed
company in the most recent quarter was $27 million, almost three times less than the median sale price during
the second quarter of 2010. According to Dow Jones VentureSource,
it took a median of 4.8
years and a median of $23 million for a venture-backed company to reach
liquidity through M&A
transactions in the third
quarter of
2010. This is 20 percent less time and 30 percent more capital than the same period last
year. Venture-backed companies that went
public in the most recent quarter took a median of 6.7 years to achieve
liquidity, 16
percent less time than the
median in the third quarter of 2009. The $51 million median amount of
venture capital raised prior to liquidity (IPO or M&A) during the most recent quarter is
21 percent higher than the median in the third quarter of
2009. We expect that it may take
significantly more time for the exit market for venture-backed companies to
recover from the current economic turmoil than the public stock
markets. Additionally, any increase in volatility in the financial
markets may impact opportunities for IPOs.
The venture capital industry’s 10-year performance stands at minus
4.2 percent as of June 30, 2010, a reversal from positive 35 percent as of December 31, 2008, according to Cambridge
Associates LLC and the National Venture Capital Association. U.S. venture firms raised $9.2 billion for 103 funds during
the first three quarters, according to Dow Jones LP Source. This amount is slightly more than the
$8.9 billion raised for 105 funds during the same period in 2009. Capital raised by early-stage funds fell 12
percent to $3.4 billion for 65 funds, while
investment in later-stage funds, traditionally the
smallest sector for
fundraising, rose 71 percent as five funds raised $1.3
billion. Venture
fundraising for all of last
year totaled $13.5 billion, the lowest since
2003. These amounts of investment
remain below those prior to the onset of the financial crisis in the third
quarter of 2008. We believe these data support our conclusion that
the availability of capital for venture capital firms and venture-backed
companies continues to be restricted.
54
Many of
our portfolio companies have negative cash flow and, therefore, need additional
rounds of financing to continue operations. Historically, this
capital typically comes from the existing venture capital syndicate as well as
new investors. As a result of the economic downturn and the tight
availability of capital for investment by venture capital firms, the existing
investors in a syndicate are increasingly required to provide this capital
without the participation of new investors. This limited market for
capital to invest also affects existing members of syndicates of
investors. Some of these co-investors are unable to invest their full
pro rata amount of a round of financing, if at all, which results in a fractured
syndicate. A fractured syndicate can result in a portfolio company
being unable to raise additional capital to fund operations. The
portfolio company may be forced to sell before reaching its full potential or be
shut down entirely if the remaining investors cannot financially support the
company.
Our
overall goal remains unchanged, which is to maintain our leadership position in
investing in nanotechnology and microsystems and to increase our
NAV. The current environment for venture capital financings favors
those firms that have capital to invest regardless of the stage of the investee
company. We have not used leverage or debt financing when making
equity and convertible debt investments; thus, we continue to finance our new
and follow-on equity and convertible debt investments from our cash reserves,
currently invested in U.S. treasury obligations. We believe the
turmoil of the venture capital industry and the current economic climate provide
opportunities to invest this capital at historically low valuations in new and
existing privately held and publicly traded companies of varying
maturities.
Valuation
of Investments
We value our privately held venture
capital investments each quarter as determined in good faith by our Valuation
Committee, a committee of all the independent directors, within guidelines
established by our Board of Directors in accordance with the 1940
Act. (See "Footnote to Consolidated Schedule of Investments"
contained in "Consolidated Financial Statements.")
The
values of privately held, venture capital-backed companies are inherently more
difficult than publicly traded companies to assess at any single point in time
because securities of these types of companies are not actively
traded. We believe, perhaps even more than in the past, that
illiquidity, and the perception of illiquidity, can affect value.
Difficult
economic environments can result in weak companies not receiving financing and
being subsequently closed down with a loss to venture investors, and/or strong
companies receiving financing but at significantly lower valuations than the
preceding financing rounds. The current state of the venture capital
market limits the availability of capital for investment by venture capital
firms. Increasingly, existing investors in a syndicate are required
to provide capital without the participation of new investors. Some
of these existing investors are unable to invest their full pro rata amount of a
private round of financing, if at all, which results in a fractured
syndicate. A fractured syndicate can result in a privately held
portfolio company being unable to raise additional capital to fund operations
regardless of the potential of the intellectual property or the business of the
portfolio company. The portfolio company may be forced to sell before
reaching its full potential or be shut down entirely if the remaining investors
cannot financially support the company. These scenarios may adversely
affect value.
55
In each of the years in the period 2006
through 2009, and for the nine months ended September 30, 2010, the Company
recorded the following gross write-ups in privately held securities as a
percentage of net assets at the beginning of the year ("BOY"), gross write-downs
in privately held securities as a percentage of net assets at the beginning of
the year, and change in value of privately held portfolio securities as a
percentage of net assets at the beginning of the year.
|
2006
|
2007
|
2008
|
2009
|
Nine
Months Ended
September 30, 2010
|
|
|
Net
Asset Value, BOY
|
$117,987,742
|
$113,930,303
|
$138,363,344
|
$109,531,113
|
$134,158,258
|
|
Gross
Write-Downs During Year
|
$(4,211,323)
|
$(7,810,794)
|
$(39,671,588)
|
$(12,845,574)
|
$(8,996,223)
|
|
Gross
Write-Ups During Year
|
$279,363
|
$11,694,618
|
$820,559
|
$21,631,864
|
$18,545,772
|
|
Gross
Write-Downs as a Percentage of Net Asset Value, BOY
|
-3.57%
|
-6.86%
|
-28.67%
|
-11.7%
|
-6.7%
|
|
Gross
Write-Ups as a Percentage of Net Asset Value,
BOY
|
0.24%
|
10.26%
|
0.59%
|
19.7%
|
13.8%
|
|
Net
Change as a Percentage of Net Asset Value, BOY
|
-3.33%
|
3.40%
|
-28.08%
|
8.0%
|
7.1%
|
From
December 31, 2009, to September 30, 2010, the value of our privately held
venture capital portfolio increased by $18,982,343 from $77,797,086 to
$96,779,429. The table below indicates some of the inputs used to
determine value of our privately held portfolio companies and the portion of the
change in value, on a quarter over quarter basis, relevant to those
inputs. We note that our Valuation Committee takes into account
multiple quantitative and qualitative inputs to ultimately determine the value
of our privately held portfolio companies.
56
|
Q2
2010 to
Q3
2010
|
Q1
2010 to
Q2
2010
|
Q4
2009 to
Q1
2010
|
Q3
2009 to
Q4
2009
|
|
|
Value
of Privately Held Portfolio as of
Previous
Quarter
|
$92,039,997
|
$83,014,946
|
$77,797,086
|
$69,876,210
|
|
Value
of Privately Held Portfolio as of
Current
Quarter
|
$96,779,429
|
$92,039,997
|
$83,014,946
|
$77,797,086
|
Examples
of Inputs that Contribute to Changes in Value
|
Total
New and Follow-On Investments
|
$3,320,255
|
$4,652,106
|
$1,426,580
|
$4,698,782
|
|
(+)
Due to Terms of New Equity Rounds of Financing
|
$1,023,808
|
$11,564,433
|
$1,436,628
|
$5,229,990
|
|
(-)
Due to Terms of New Equity Rounds of Financing
|
$0
|
$(280,649)
|
$0
|
$0
|
|
(+)
Due to (+) in Values of Comparables
|
$1,407,773
|
$730,026
|
$2,151,404
|
$1,938,047
|
|
(-)
Due to (-) in Values of Comparables
|
$0
|
$(1,618,341)
|
$0
|
$(6,313)
|
|
(+)
Due to (-) in Non-Performance Risk
|
$53,893
|
$1,355,025
|
$2,511,106
|
$500,000
|
|
(-)
Due to (+) in Non-Performance Risk
|
$(1,304,165)
|
$(7,172,178)
|
$(2,307,768)
|
$(4,795,765)
|
|
Other
Factors(1)
|
$237,868
|
$(205,371)
|
$(90)
|
$356,135
|
|
Total
Change in Value of Privately Held Portfolio
from
Quarter to Quarter
|
$4,739,432
|
$9,025,051
|
$5,217,860
|
$7,920,876
|
(1) Other
factors include changes in accrued bridge note interest, currency fluctuations
and the value of warrants.
The values of publicly traded
comparables on September 30, 2010, were significant factors in determining the
values of four of our 31 privately held portfolio companies. One of these
four companies is GEO Semiconductor Inc. Our investment of $500,000 in GEO Semiconductor occurred through a participation
agreement with Montage Capital, LLC, for pro rata ownership of a senior secured non-convertible debt
security that included warrants for the purchase of preferred stock at a future
date. As part of this investment, we also received payment of a loan
initiation fee. Should we decide to sell this note and the warrants, the
purchaser would not receive the loan initiation fee. The difference
between the amount
invested in GEO Semiconductor and the value of our investment as of
September 30, 2010, results
primarily from the effect of this loan initiation fee on the calculation value by a discounted cash flow
analysis. With the information available to us as of September 30, 2010,
we believe the investment will return its full amount of interest and principal
under the terms of the investment.
57
The other three companies for which
publicly traded comparables were significant factors in determining value
increased in value for the three months ended September 30,
2010. These four companies accounted for approximately $15.1 million
of the total value of our venture capital portfolio as of September 30,
2010. These values could differ materially if calculated on a
different date due to changes in values and/or operating performance of the
publicly traded comparables.
The values set by private equity
financings that occurred during the third quarter of 2010, or that occurred
during the fourth quarter of 2010, but reflect on value as of September 30,
2010, were significant inputs in determining the values of four of our 31
privately held portfolio companies. These four companies accounted
for approximately $29.1 million of the total value of our venture capital
portfolio as of September 30, 2010. The financings of three of these
four portfolio companies included third-party independent investors and
accounted for $28.9 million of the $29.1 million. The financings of
one of these four portfolio companies included only current investors and
accounted for $0.2 million of the $29.1 million. These values could
differ materially in future quarters, particularly should these companies not
execute on their business plans and become subject to discounts for
non-performance risk or require additional capital that is available only at
lower valuations than those of the most recent round of financing.
As part of the valuation process, we
consider non-performance risk. Non-performance risk is the risk that
a portfolio company will be: (a) unable to raise capital, will need to be shut
down and will not return our invested capital; or (b) able to raise capital, but
at a valuation significantly lower than the implied post-money
valuation. Our best estimate of the non-performance risk of our
portfolio companies has been quantified and included in the valuation of the
companies as of September 30, 2010. In the future, as these companies
receive terms for additional financings or are unable to receive additional
financing and, therefore, proceed with sales or shutdowns of the business, we
expect the contribution of the discount for non-performance risk to vary in
importance in determining the values of our securities of these
companies. As of September 30, 2010, non-performance risk was a
significant factor in determining the values of 11 of our 31 privately held
portfolio companies. These 11 companies accounted for approximately
$23.9 million of the total value of our
privately held venture capital portfolio. We increased the
non-performance risk, thereby decreasing the value, of two
companies. We decreased the non-performance risk, thereby increasing
the value, of one company. We maintained the same level of
non-performance risk in eight companies.
As of September 30, 2010, our top ten
investments by value accounted for approximately 71 percent of the value of our
venture capital portfolio. As of that date, we believe at least one
of these ten companies will require capital by the end of 2010, and at least
three of the remaining nine companies will require additional capital by the end
of the third quarter of 2011.
58
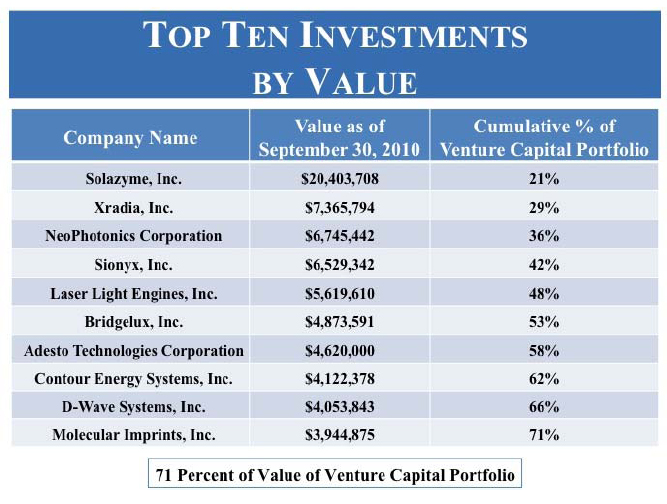
The increase or decrease in the value
of our venture capital investments does not affect the day-to-day operations of
the Company, as we have no debt and fund our venture capital investments and
daily operating expenses from interest earned and proceeds from the sales of our
investments in U.S. government and agency obligations. As of
September 30, 2010, we held $43,860,344 in U.S. government obligations, and we
had an additional $256,103 in cash.
Investment
Objective
Our principal objective is to
achieve long-term capital appreciation by making venture capital
investments. Therefore, a significant portion of our current venture
capital investment portfolio provides little or no income in the form of
dividends or interest. Current income is a secondary
objective. We are implementing a strategy that we believe will
provide greater regularity and shorter time periods between realizations of
capital gains on investments. As part of this strategy, we are
seeking to increase our current income by providing debt financing to privately
held and publicly traded small companies. We made our first debt
investment that generates current income in the third quarter of
2010. We seek to reach the point where future growth is financed
through reinvestment of our capital gains from our venture capital investments
and where current income offsets our annual expenses during periods of time
between realizations of capital gains on our investments.
59
We currently earn interest income from
fixed-income securities, including U.S. government and agency
securities. The amount of interest income we earn varies with the
average balance of our fixed-income portfolio and the average yield on this
portfolio. In previous
years, we have been able to generate substantial amounts of interest income from
our holdings of U.S. treasury securities. As of September 30, 2010, we held two short-duration U.S. treasury securities, yielding approximately 0.09 percent. As of September 30, 2010,
yields for 3-month, 6-month, and 12-month U.S. treasury securities were 0.16
percent, 0.19 percent and 0.27 percent, respectively. With yields at
this level, we expect to generate less interest income from U.S. government
securities than in fiscal quarters and years prior to 2009.
Results
of Operations
We present the financial results of our
operations utilizing GAAP for investment companies. On this basis,
the principal measure of our financial performance during any period is the net
increase (decrease) in our net assets resulting from our operating activities,
which is the sum of the following three elements:
Net
Operating Income (Loss) - the difference
between our income from interest, dividends, and fees and our operating
expenses.
Net
Realized Gain (Loss) on Investments - the difference between
the net proceeds of sales of portfolio securities and their stated cost, plus
income from interests in limited liability companies.
Net
Increase (Decrease) in Unrealized Appreciation or Depreciation on
Investments - the net unrealized change in the value of our investment
portfolio.
Owing to the structure and objectives
of our business, we generally expect to experience net operating losses and seek
to generate increases in our net assets from operations through the long term
appreciation of our venture capital investments. Historically, we
have relied on proceeds from sales of investments, rather than on investment
income, to defray a significant portion of our operating
expenses. Because such sales are unpredictable, we attempt to
maintain adequate working capital to provide for fiscal periods when there are
no such sales. We began efforts to generate additional current income
in the third quarter of 2010 by making a venture debt
investment. Although we plan to continue to make investments in
securities that produce current income, we do not believe these investments will
reach an amount that would generate enough income to offset a significant
portion of our operating expenses within the next 12 months.
Three
months ended September 30, 2010, as compared with the three months ended
September 30, 2009
In the three months ended September 30,
2010, and September 30, 2009, we had net decreases in net assets resulting from
operations of $454,032 and $296,319, respectively.
60
Investment Income and
Expenses:
We had net operating losses of
$1,768,864 and $2,242,953 for the three months ended September 30, 2010, and
September 30, 2009, respectively. The variation in these results is
primarily owing to the changes in investment income and operating expenses,
including non-cash expense of $531,795 in 2010 and $1,013,608 in 2009 associated
with the granting of stock options. During the three months ended
September 30, 2010, and 2009, total investment income was $140,445 and $105,677,
respectively. During the three months ended September 30, 2010, and
2009, total operating expenses were $1,909,309 and $2,348,630,
respectively.
During the three months ended September
30, 2010, as compared with the same period in 2009, investment income increased,
reflecting an increase in interest income from bridge notes and the
participation agreement, offset by a decrease in our average holdings of U.S.
government securities as well as a decrease in the average interest rates
yielded by these securities. The average yield on our U.S. government
securities decreased from 0.3 percent for the three months ended September 30,
2009, to 0.1 percent for the three months ended September 30,
2010. During the three months ended September 30, 2010, our average
holdings of such securities were $44,971,268, as compared with $49,590,199
during the three months ended September 30, 2009.
Operating expenses, including non-cash,
stock-based compensation expense, were $1,909,309 and $2,348,630 for the three
months ended September 30, 2010, and September 30, 2009,
respectively. The decrease in operating expenses for the three months
ended September 30, 2010, as compared with the three months ended September 30,
2009, was primarily owing to decreases in salaries,
benefits and stock-based compensation expense, administration and operations
expense, professional fees, directors' fees and expenses and custody fees,
offset by an increase in rent expense. Salaries, benefits and
stock-based compensation decreased by $400,688, or 23.2 percent, through
September 30, 2010, as compared with September 30, 2009, primarily as a result
of a decrease in non-cash expense of $481,813 associated with the Harris &
Harris Group, Inc. 2006 Equity Incentive Plan (the "Stock Plan"), offset by an
increase in salaries and benefits owing primarily to an accrual for year-end
employee bonuses of $59,750 and to an increase in salary of two of our
employees. While the non-cash, stock-based compensation expense for
the Stock Plan increased our operating expenses by $531,795, this increase was
offset by a corresponding increase to our additional paid-in capital, resulting
in no net impact to our NAV. Administration and operations expense
decreased by $23,822, or 10.6 percent, through September 30, 2010, as compared
with September 30, 2009, primarily as a result of a decrease in our directors'
and officers' liability insurance expense and decreases in the expenses related
to the annual report and proxy. Professional fees decreased by
$54,299, or 28.4 percent, for the three months ended September 30, 2010, as
compared with the same period in 2009, primarily as a result of a decrease in
certain legal and accounting fees, offset by an increase in consulting
fees. Directors' fees and expenses decreased by $8,777, or 11.1
percent, through September 30, 2010, as compared with September 30, 2009,
primarily as a result of one less meeting held during the
quarter. Custody fees decreased by $9,515, or 28.4 percent, for the
three months ended September 30, 2010, as compared with the same period in 2009,
owing to a higher accrual in the third quarter of 2009 for services provided by
our new custodian, from the inception of the agreement in May 2009 to September
2009. Rent expense increased by $57,262, or 71.9 percent, for the
three months ended September 30, 2010, as compared with the same period in
2009. Our rent expense of $136,879 for the three months ended
September 30, 2010, includes $141,674 of rent paid in cash and $(4,795) of
non-cash rent expense, credits and abatements that we recognize on a
straight-line basis over the lease term. Our rent paid in cash of
$141,674 includes $47,094 of real estate tax escalation charges from 2003 to
2010 paid on our previous corporate headquarters located at 111 West 57 Street
in New York City.
61
Realized Income and Losses
from Investments:
During the three months ended September
30, 2010, and September 30, 2009, we realized net losses on investments of
$3,136,863 and $3,176,125, respectively.
During the three months ended September
30, 2010, we realized net losses of
$3,136,863, consisting primarily of a realized loss on our investment in
NanoGram Corporation, of $3,136,552. On July 11, 2010, NanoGram was
acquired for an undisclosed amount. Holders of common stock did not
receive any proceeds from this transaction.
During the three months ended September
30, 2009, we realized net losses of $3,176,125, consisting of a realized loss of
$3,176,125 on our investment in Nanomix, Inc. During the third
quarter of 2009, we received a payment of $4,115 for the sale of our interest in
Nanomix, Inc.
Net Unrealized Appreciation
and Depreciation of Portfolio Securities:
During the three months ended September
30, 2010, net unrealized depreciation on total investments decreased by
$4,453,494, or 73.5 percent, from net unrealized depreciation of $6,062,635 at
June 30, 2010, to net unrealized depreciation of $1,609,141 at September 30,
2010. During the three months ended September 30, 2009, net
unrealized depreciation on total investments decreased by $5,119,897, or 17.6
percent, from net unrealized depreciation of $29,013,339 at June 30, 2009, to
net unrealized depreciation of $23,893,442 at September 30, 2009.
During
the three months ended September 30, 2010, net unrealized depreciation on our
venture capital investments decreased by $4,436,960, from net unrealized
depreciation of $6,044,853 at June 30, 2010, to net unrealized depreciation of
$1,607,893 at September 30, 2010, owing primarily to increases in the valuations
of the following investments held:
|
Investment
|
Amount of Write-Up
|
|||
|
Bridgelux,
Inc.
|
$ | 10,594 | ||
|
D-Wave
Systems, Inc.
|
73,713 | |||
|
GEO
Semiconductor Inc.
|
10,052 | |||
|
Laser
Light Engines, Inc.
|
1,023,808 | |||
|
NeoPhotonics
Corporation
|
980,947 | |||
|
PolyRemedy,
Inc.
|
53,893 | |||
|
Questech
Corporation
|
106,840 | |||
|
Xradia,
Inc.
|
312,110 | |||
The
write-ups for the three months ended September 30, 2010, were partially offset
by decreases in the valuations of the following investments held:
62
|
Investment
|
Amount of Write-Down
|
|||
|
BioVex
Group, Inc.
|
$ | 3,134 | ||
|
Innovalight,
Inc.
|
1,241,665 | |||
|
Mersana
Therapeutics, Inc.
|
23,822 | |||
|
Metabolon,
Inc.
|
6,678 | |||
|
Molecular
Imprints, Inc.
|
8,125 | |||
|
SiOnyx,
Inc.
|
1,731 | |||
|
TetraVitae
Bioscience, Inc.
|
62,500 | |||
We had a decrease in unrealized
depreciation for NanoGram Corporation of $3,136,552. On July 11,
2010, NanoGram Corporation was acquired for an undisclosed
amount. Holders of common stock did not receive any proceeds from
this transaction.
We had a
decrease in unrealized depreciation owing to foreign currency translation of
$76,106 on our investment in D-Wave Systems, Inc.
Unrealized
depreciation on our U.S. government securities portfolio decreased from $17,782
at June 30, 2010, to $1,248 at September 30, 2010.
During
the three months ended September 30, 2009, net unrealized depreciation on our
venture capital investments decreased by $5,125,667, from net unrealized
depreciation of $29,029,756 at June 30, 2009, to net unrealized depreciation of
$23,904,089 at September 30, 2009, owing primarily to increases in the
valuations of the following investments held:
|
Investment
|
Amount of Write-Up
|
|||
|
Adesto
Technologies Corporation
|
$ | 1,320,000 | ||
|
BioVex
Group, Inc.
|
350,867 | |||
|
BridgeLux,
Inc.
|
997,091 | |||
|
Cambrios
Technologies Corporation
|
519,567 | |||
|
CFX
Battery, Inc.
|
812,383 | |||
|
NeoPhotonics
Corporation
|
1,521,999 | |||
|
Questech
Corporation
|
189,860 | |||
|
Xradia,
Inc.
|
1,118,602 | |||
The
write-ups for the three months ended September 30, 2009, were partially offset
by decreases in the valuations of the following investments held:
63
|
Investment
|
Amount of Write-Down
|
|||
|
Ancora
Pharmaceuticals Inc.
|
$ | 405,969 | ||
|
Cobalt
Technologies, Inc.
|
187,499 | |||
|
Crystal
IS, Inc.
|
440,543 | |||
|
Innovalight,
Inc.
|
1,561,187 | |||
|
Kovio,
Inc.
|
1,232,466 | |||
|
Laser
Light Engines, Inc.
|
499,999 | |||
|
Mersana
Therapeutics, Inc.
|
4,581 | |||
|
Metabolon,
Inc.
|
4,963 | |||
|
Molecular
Imprints, Inc.
|
7,000 | |||
|
NanoGram
Corporation
|
735,902 | |||
|
Orthovita,
Inc.
|
26,027 | |||
We also
had a decrease to unrealized depreciation for Nanomix, Inc., of $3,180,240 owing
to the sale of our investment in Nanomix, Inc. We had an increase
owing to foreign currency translation of $221,194 on our investment in D-Wave
Systems, Inc.
Unrealized
appreciation on our U.S. government securities portfolio decreased from $16,417
at June 30, 2009, to $10,647 at September 30, 2009.
Nine
months ended September 30, 2010, as compared with the nine months ended
September 30, 2009
In the nine months ended September 30,
2010, we had a net increase in net assets resulting from operations of
$3,384,651. In the nine
months ended September 30, 2009, we had a net decrease in net assets resulting
from operations of $826,376.
Investment Income and
Expenses:
We had net operating losses of
$5,835,491 and $6,340,103 for the nine months ended September 30, 2010, and
September 30, 2009, respectively. The variation in these results is
primarily owing to the changes in investment income and operating expenses,
including non-cash expense of $1,746,734 in 2010 and $2,425,525 in 2009
associated with the granting of stock options. During the nine months
ended September 30, 2010, and 2009, total investment income was $348,726 and
$165,950, respectively. During the nine months ended September 30,
2010, and 2009, total operating expenses were $6,184,217 and $6,506,053,
respectively.
During the nine months ended September
30, 2010, as compared with the same period in 2009, investment income increased,
reflecting an increase in interest income from bridge notes and the
participation agreement, offset by a decrease in our average holdings of U.S.
government securities as well as a substantial decrease in interest
rates. The average yield on our U.S. government securities decreased
from 0.3 percent for the nine months ended September 30, 2009, to 0.09 percent
for the nine months ended September 30, 2010. During the nine months
ended September 30, 2010, our average holdings of such securities were
$49,440,025, as compared with $50,447,538 at September 30, 2009.
64
Operating expenses, including non-cash,
stock-based compensation expense, were $6,184,217 and $6,506,053 for the nine
months ended September 30, 2010, and September 30, 2009,
respectively. The decrease in operating expenses for the nine months
ended September 30, 2010, as compared with the nine months ended September 30,
2009, was primarily owing to decreases in salaries,
benefits and stock-based compensation expense, administration and operations
expense, professional fees, and directors' fees and expenses, offset by an
increase in rent expense and custody fees. Salaries, benefits and
stock-based compensation decreased by $439,828, or 9.5 percent, through
September 30, 2010, as compared with September 30, 2009, primarily as a result
of a decrease in non-cash expense of $678,791 associated with the Stock Plan,
offset by an increase in salaries and benefits owing primarily to an accrual for
year-end employee bonuses of $179,250 and to an increase in salary of two of our
employees. While the non-cash, stock-based compensation expense for
the Stock Plan increased our operating expenses by $1,746,734, this increase was
offset by a corresponding increase to our additional paid-in capital, resulting
in no net impact to our NAV. Administration and operations expense
decreased by $34,650, or 4.6 percent, through September 30, 2010, as compared
with September 30, 2009, primarily as a result of a decrease in our directors'
and officers' liability insurance expense and decreases in the expenses related
to the annual report and proxy, offset by increases in the cost of non-employee
related insurance, expenses associated with the relocation of our corporate
headquarters in New York City and expenses associated with hosting "Meet the
Portfolio" day on May 7, 2010. Professional fees decreased by $1,605,
or 0.3 percent, for the nine months ended September 30, 2010, as compared with
the same period in 2009, primarily as a result of a decrease in accounting fees,
offset by an increase in certain legal and consulting
fees. Directors' fees and expenses decreased by $1,465, or 0.6
percent, through September 30, 2010, as compared with September 30, 2009,
primarily as a result of less meetings held during the period. Rent
expense increased by $66,561, or 28.1 percent, for the nine months ended
September 30, 2010, as compared with the same period in 2009. Our
rent expense of $303,239 for the nine months ended September 30, 2010, includes
$212,704 of rent paid in cash and $90,535 of non-cash rent expense, credits and
abatements that we recognize on a straight-line basis over the lease
term. Our rent paid in cash of $212,704 includes $47,094 of real
estate tax escalation charges from 2003 to 2010 paid on our previous corporate
headquarters located at 111 West 57 Street in New York City. For the
nine months ended September 30, 2010, we had a loss of $68,038 as a result of
abandoning our lease at our former office prior to the end of the lease term,
which expired in April 2010. Custody fees increased
by $20,543, or 39.9 percent, for the nine months ended September 30, 2010, as
compared with the same period in 2009, owing to the higher fees charged by our
new custodian, the Bank of New York Mellon, which has more expertise in working
with investment companies.
Realized Income and Losses
from Investments:
During the nine months ended September
30, 2010, we realized net losses on investments of $3,545,155, as compared with
realized net losses on investments of $4,690,780 during the nine months ended
September 30, 2009.
During the nine months ended September
30, 2010, we realized net losses of $3,545,155, consisting primarily of realized
losses on a portion of our investment in Kovio, Inc., of $257,007, in NanoGram
Corporation of $3,136,552, in Orthovita, Inc., of $167,300, and realized losses
on the disposal of fixed assets, offset by realized gains on our investment in
Satcon Technology Corporation of $14,320 and realized gains on the sale of U.S.
government securities.
65
The realized loss on our investment in
Kovio, Inc., was owing to the termination of a warrant. The warrant
was terminated pursuant to the terms of the Series A' financing which closed
during the second quarter of 2010.
On July 11, 2010, NanoGram was acquired
for an undisclosed amount. Holders of common stock did not receive
any proceeds from this transaction.
During the nine months ended September
30, 2010, we received a dividend payment of $13,218 representing our pro rata
portion of the residual net proceeds from the liquidation of Optiva,
Inc. We had invested in Optiva during 2002, and in 2005, it began
liquidation under an assignment for the benefit of creditors. This
sum represents the final payment from the liquidation.
During the nine months ended September
30, 2009, we realized net losses of $4,690,780, consisting primarily of realized
losses on our investments in Exponential Business Development Company of
$14,330, in Kereos, Inc., of $1,500,000, and in Nanomix, Inc., of
$3,176,125. Since the date of our investment of $25,000 in
Exponential Business Development Company in 1995, we periodically received cash
distributions totaling $31,208 through the date of the sale. During
the third quarter of 2009, we received a payment of $4,115 from the sale of our
interest in Nanomix, Inc.
Net Unrealized Appreciation
and Depreciation of Portfolio Securities:
During the nine months ended September
30, 2010, net
unrealized depreciation on total investments decreased by $12,769,728, or 88.8
percent, from net unrealized depreciation of $14,378,869 at December 31, 2009,
to net unrealized depreciation of $1,609,141 at September 30,
2010. During the nine months ended September 30, 2009, net
unrealized depreciation on total investments decreased by $10,203,754, or 29.9
percent, from net unrealized depreciation of $34,097,196 at December 31, 2008,
to net unrealized depreciation of $23,893,442 at September 30,
2009.
During
the nine months ended September 30, 2010, net unrealized depreciation on our
venture capital investments decreased by $12,758,533, from net unrealized
depreciation of $14,366,426 at December 31, 2009, to net unrealized depreciation
of $1,607,893 at September 30, 2010, owing primarily to increases
in the valuations of the following investments held:
|
Investment
|
Amount of Write-Up
|
|||
|
BioVex
Group, Inc.
|
$ | 418,288 | ||
|
D-Wave
Systems, Inc.
|
928,738 | |||
|
Ensemble
Therapeutics Corporation
|
500,000 | |||
|
GEO
Semiconductor Inc.
|
10,052 | |||
|
Laser
Light Engines, Inc.
|
1,523,808 | |||
|
Mersana
Therapeutics, Inc.
|
937,882 | |||
|
Metabolon,
Inc.
|
62,957 | |||
|
NeoPhotonics
Corporation
|
975,836 | |||
|
Questech
Corporation
|
44,571 | |||
|
SiOnyx,
Inc.
|
3,077,034 | |||
|
Solazyme,
Inc.
|
8,149,698 | |||
|
Xradia,
Inc.
|
1,642,579 | |||
66
The
write-ups for the nine months ended September 30, 2010, were partially offset by
decreases in the valuations of the following investments held:
|
Investment
|
Amount of Write-Down
|
|||
|
Bridgelux,
Inc.
|
$ | 209,659 | ||
|
Innovalight,
Inc.
|
1,241,665 | |||
|
Kovio,
Inc.
|
1,750,165 | |||
|
Molecular
Imprints, Inc.
|
2,031,249 | |||
|
Nanosys,
Inc.
|
280,649 | |||
|
Nextreme
Thermal Solutions, Inc.
|
3,303,943 | |||
|
PolyRemedy,
Inc.
|
53,893 | |||
|
TetraVitae
Bioscience, Inc.
|
125,000 | |||
We had a decrease in unrealized
depreciation for Kovio, Inc., of $227,469 owing to the termination of a
warrant. The warrant was terminated pursuant to the terms of the
Series A' financing which closed during the second quarter of 2010.
We had a decrease in unrealized
depreciation for NanoGram Corporation of $3,136,552, which resulted from a
realized loss on such investment during the period. On July 11, 2010,
NanoGram was acquired for an undisclosed amount. Holders of common
stock did not receive any proceeds from this transaction.
We had a
decrease in unrealized depreciation for Orthovita, Inc., of $72,432 owing to the
sale of its securities.
We had a
decrease in unrealized depreciation owing to foreign currency translation of
$46,860 on our investment in D-Wave Systems, Inc.
Unrealized
depreciation on our U.S. government securities portfolio decreased from $12,443
at December 31, 2009, to $1,248 at September 30, 2010.
During
the nine months ended September 30, 2009, net unrealized depreciation on our
venture capital investments decreased by $10,220,759, from net unrealized
depreciation of $34,124,848 at December 31, 2008, to net unrealized depreciation
of $23,904,089 at September 30, 2009, owing primarily to increases
in the valuations of the following investments held:
|
Investment
|
Amount of Write-Up
|
|||
|
Adesto
Technologies Corporation
|
$ | 1,320,000 | ||
|
BioVex
Group, Inc.
|
331,246 | |||
|
BridgeLux,
Inc.
|
995,124 | |||
|
Cambrios
Technologies Corporation
|
519,567 | |||
|
CFX
Battery, Inc.
|
812,383 | |||
|
Metabolon,
Inc.
|
200,235 | |||
|
Molecular
Imprints, Inc.
|
1,062,605 | |||
|
NeoPhotonics
Corporation
|
2,094,325 | |||
|
Nextreme
Thermal Solutions, Inc.
|
2,202,628 | |||
|
Questech
Corporation
|
212,550 | |||
|
Siluria
Technologies, Inc.
|
160,723 | |||
|
Solazyme,
Inc.
|
5,376,988 | |||
|
Xradia,
Inc.
|
1,118,602 | |||
67
These
write-ups for the nine months ended September 30, 2009, were partially offset by
the following write-downs:
|
Investment
|
Amount of Write-Down
|
|||
|
Ancora
Pharmaceuticals Inc.
|
$ | 1,165,060 | ||
|
Cobalt
Technologies, Inc.
|
187,499 | |||
|
Crystal
IS, Inc.
|
772,781 | |||
|
CSwitch
Corporation
|
20,286 | |||
|
Innovalight,
Inc.
|
1,561,187 | |||
|
Kovio,
Inc.
|
1,244,957 | |||
|
Laser
Light Engines, Inc.
|
999,999 | |||
|
Mersana
Therapeutics, Inc.
|
12,461 | |||
|
NanoGram
Corporation
|
1,471,805 | |||
|
Nanosys,
Inc.
|
2,685,059 | |||
|
Orthovita,
Inc.
|
26,027 | |||
|
PolyRemedy,
Inc.
|
28,384 | |||
|
SiOnyx,
Inc.
|
1,076,155 | |||
We also
had decreases to unrealized depreciation for Exponential Business Development
Company of $15,361, Kereos, Inc., of $1,500,000, and Nanomix, Inc., of
$3,150,190 owing to the disposal of their securities and changes in the capital
account balance of Exponential Business Development Company prior to its
sale.
We had an
increase owing to foreign currency translation of $399,892 on our investment in
D-Wave Systems, Inc. We had an increase to unrealized depreciation on
our publicly traded security, Orthovita, Inc., of $26,027.
Unrealized
appreciation on our U.S. government securities portfolio decreased from $27,652
at December 31, 2008, to $10,647 at September 30, 2009.
Financial
Condition
|
|
September
30, 2010
|
At September 30, 2010, our total assets
and net assets were $141,630,221 and $139,280,510, respectively. At
December 31, 2009, they were $136,109,101 and $134,158,258,
respectively.
At September 30, 2010, NAV per share
was $4.51, as compared with $4.35 at December 31, 2009. At September
30, 2010, our shares outstanding increased to 30,870,205 from 30,859,593 at
December 31, 2009.
68
Significant developments in the nine
months ended September 30, 2010, included an increase in
the holdings of our venture capital investments of $18,755,948 and a decrease in
our holdings of U.S. government obligations and cash of
$13,442,599. The increase in the value of our venture capital
investments from $78,023,481 at December 31, 2009, to $96,779,429 at September
30, 2010, resulted primarily from an increase in the net value of our venture
capital investments of $9,211,992 and by three new and 25 follow-on investments
of $9,667,071. The decrease in the value of our U.S. government
obligations and cash from $57,559,046 at December 31, 2009, to $44,116,447 at
September 30, 2010, is primarily owing to the payment of cash for operating
expenses of $4,165,824 and to new and follow-on venture capital investments
totaling $9,667,071.
The following table is a summary of
additions to our portfolio of venture capital investments made during the nine
months ended September 30, 2010:
|
New Investments
|
Amount of Investment
|
|||
|
ABS
Materials, Inc.
|
$ | 250,000 | ||
|
Satcon
Technology Corporation
|
99,957 | |||
|
GEO
Semiconductor Inc.
|
500,000 | |||
|
Follow-On Investments
|
Amount of Investment
|
|||
|
ABS
Materials, Inc.
|
$ | 125,000 | ||
|
Ancora
Pharmaceuticals Inc.
|
500,000 | |||
|
Ancora
Pharmaceuticals Inc.
|
600,000 | |||
|
Ancora
Pharmaceuticals Inc.
|
400,000 | |||
|
BioVex
Group, Inc.
|
354,390 | |||
|
BioVex
Group, Inc.
|
323,077 | |||
|
Bridgelux,
Inc.
|
250,041 | |||
|
D-Wave
Systems, Inc.
|
580,257 | |||
|
Kovio,
Inc.
|
526,225 | |||
|
Laser
Light Engines, Inc.
|
250,000 | |||
|
Laser
Light Engines, Inc.
|
250,000 | |||
|
Laser
Light Engines, Inc.
|
40,000 | |||
|
Laser
Light Engines, Inc.
|
90,000 | |||
|
Laser
Light Engines, Inc.
|
910,000 | |||
|
Mersana
Therapeutics, Inc.
|
87,500 | |||
|
Mersana
Therapeutics, Inc.
|
84,475 | |||
|
Nanosys,
Inc.
|
496,573 | |||
|
NeoPhotonics
Corporation
|
2,455 | |||
|
NeoPhotonics
Corporation
|
2,109 | |||
|
Orthovita,
Inc.
|
98,427 | |||
|
Satcon
Technology Corporation
|
22,134 | |||
|
Satcon
Technology Corporation
|
27,960 | |||
|
SiOnyx,
Inc.
|
339,760 | |||
|
SiOnyx,
Inc.
|
956,740 | |||
|
Solazyme,
Inc.
|
1,499,991 | |||
|
Total
|
$ | 9,667,071 | ||
69
The following tables summarize the
values of our portfolios of venture capital investments and U.S. government
obligations, as compared with their cost, at September 30, 2010, and December
31, 2009:
|
September 30, 2010
|
December 31, 2009
|
|||||||
|
Venture
capital investments,
|
||||||||
|
at
cost
|
$ | 98,387,322 | $ | 92,389,907 | ||||
|
Net
unrealized depreciation(1)
|
1,607,893 | 14,366,426 | ||||||
|
Venture
capital investments,
|
||||||||
|
at
value
|
$ | 96,779,429 | $ | 78,023,481 | ||||
|
September 30, 2010
|
December 31, 2009
|
|||||||
|
U.S.
government
|
||||||||
|
obligations,
at cost
|
$ | 43,861,592 | $ | 55,960,024 | ||||
|
Net
unrealized depreciation(1)
|
1,248 | 12,443 | ||||||
|
U.S.
government
|
||||||||
|
obligations,
at value
|
$ | 43,860,344 | $ | 55,947,581 | ||||
(1) At
September 30, 2010, and December 31, 2009, the net accumulated unrealized
depreciation on investments was $1,609,141 and $14,378,869,
respectively.
Liquidity
Our
liquidity and capital resources are generated and generally available through
our cash holdings, interest earned on our investments on U.S. government
securities, cash flows from the sales of U.S. government securities, proceeds
from periodic follow-on equity offerings and realized capital gains retained for
reinvestment.
We fund
our day-to-day operations using interest earned and proceeds from the sales of
our investments in U.S. government securities. The increase or
decrease in the valuations of our portfolio companies does not impact our daily
liquidity. At September 30, 2010, and December 31, 2009, we had no
investments in money market mutual funds. We have no debt
outstanding, and, therefore, are not subject to credit agency
downgrades.
As a
venture capital company, it is critical that we have capital available to
support our best companies until we have an opportunity for liquidity in our
investments. As such, we will continue to maintain a substantial
amount of liquid capital on our balance sheet and will not put the company in a
position where we must raise capital through additional equity financings to
continue operations. However, to complement our private portfolio
investing, we seek to invest some of this capital in publicly traded companies
and debt where we will have greater liquidity and more defined investment return
timelines, respectively, than we currently have in our existing
portfolio. In addition, in the future, we may from time to time opt
to borrow money to make investments, specifically in debt securities that
generate cash flow and have a known timeframe for return on
investment.
70
At
September 30, 2010, and December 31, 2009, our total net primary liquidity was
$44,150,472 and $57,642,233, respectively. Our primary liquidity is
comprised of our cash, U.S. government securities, receivables from unsettled
trades, receivables from portfolio companies and interest
receivables. The decrease in our primary liquidity from December 31,
2009, to September 30, 2010, is primarily owing to the use of funds for
investments and payment of net operating expenses.
At September 30, 2010, and December 31,
2009, our secondary liquidity was $0 and $226,395, respectively. Our
secondary liquidity consists of our publicly traded
securities. Although these companies are publicly traded, their stock
may not trade at high volumes and prices can be volatile, which may restrict our
ability to sell our positions at any given time.
Although
we cannot predict future market conditions, we continue to believe that our
current cash and U.S. government security holdings, our strategy to invest in
more publicly traded companies and debt and our ability to adjust our investment
pace will provide us with adequate liquidity to execute our current business
strategy.
Except
for a rights offering, we are also generally not able to issue and sell our
common stock at a price below our NAV per share, exclusive of any distributing
commission or discount, without shareholder approval. As of September
30, 2010, our NAV per share was $4.51 per share and our closing market price was
$4.27 per share. We do not currently have shareholder approval to
issue or sell shares below our NAV per share.
Capital
Resources
On
October 9, 2009, we completed the sale of 4,887,500 shares of our common stock
at a price of $4.75 per share to the public for total gross proceeds of
$23,215,625; net proceeds of this offering, after deducting underwriting
discounts and offering costs of $2,000,413, were $21,215,212. We
intend to use, and have been using, the net proceeds of this offering to make
new investments in nanotechnology, as well as for follow-on investments in our
existing venture capital investments and for working capital. Through
September 30, 2010, we have used $19,429,844 of the net proceeds from this
offering for these purposes.
Critical
Accounting Policies
The Company's significant accounting
policies are described in Note 3 to the Consolidated Financial Statements and in
the Footnote to the Consolidated Schedule of Investments. Critical
accounting policies are those that are both important to the presentation of our
financial condition and results of operations and those that require
management’s most difficult, complex or subjective judgments. The
Company considers the following accounting policies and related estimates to be
critical:
Valuation of Portfolio
Investments
The most
significant estimate inherent in the preparation of our consolidated financial
statements is the valuation of investments and the related amounts of unrealized
appreciation and depreciation of investments recorded. As a BDC, we
invest in primarily illiquid securities that generally have no established
trading market.
71
Investments
are stated at "value" as defined in the 1940 Act and in the applicable
regulations of the SEC and GAAP. Value, as defined in Section
2(a)(41) of the 1940 Act, is (i) the market price for those securities for which
a market quotation is readily available and (ii) the fair value as determined in
good faith by, or under the direction of, the Board of Directors for all other
assets. (See "Valuation Procedures" in the "Footnote to Consolidated
Schedule of Investments.") As of September 30, 2010, our financial
statements include privately held venture capital investments valued at
$96,779,429, the fair values of which were determined in good faith by, or under
the direction of, the Board of Directors. As of September 30, 2010,
approximately 69.5 percent of our net assets represent investments in portfolio
companies valued at fair value by the Board of Directors.
Determining fair value requires that
judgment be applied to the specific facts and circumstances of each portfolio
investment, although our valuation policy is intended to provide a consistent
basis for determining fair value of the portfolio
investments. Factors that may be considered include, but are not
limited to, readily available public market quotations; the cost of the
Company’s investment; transactions in the portfolio company’s
securities or unconditional firm offers by responsible parties; the financial
condition and operating results of the company; the long-term potential of the
business and technology of the company; the values of similar securities issued
by companies in similar businesses; multiples to revenues, net income or EBITDA
that similar securities issued by companies in similar businesses receive; the
proportion of the company’s securities we own and the nature of any rights to
require the company to register restricted securities under the applicable
securities laws; the achievement of milestones; and the rights and preferences
of the class of securities we own as compared with other classes of securities
the portfolio has issued.
The
difficult economic environment continues to make it extremely difficult for many
companies to raise capital. Moreover, the cost of capital has
increased substantially. Historically, difficult economic
environments have resulted in weak companies not receiving financing and being
subsequently closed down with a loss of investment to venture investors, and/or
strong companies receiving financing but at significantly lower valuations than
the preceding rounds, leading to very deep dilution for those who do not
participate in the new rounds of investment. Our best estimate of
this non-performance risk has been quantified and included in the valuation of
our portfolio companies as of September 30, 2010.
All investments recorded at fair value
are categorized based upon the level of judgment associated with the inputs used
to measure their fair value. Hierarchical levels related to the
amount of subjectivity associated with the inputs to fair valuation of these
assets, are as follows:
|
|
·
|
Level
1: Unadjusted quoted prices in active markets for
identical assets or liabilities.
|
|
|
·
|
Level
2: Quoted prices in active markets for similar assets or
liabilities, or quoted prices for identical or similar assets or
liabilities in markets that are not active, or inputs other than quoted
prices that are observable for the asset or liability.
|
|
·
|
Level 3: Unobservable inputs for the asset or liability. |
As of
September 30, 2010, all of our privately held portfolio investments were
classified as Level 3 in the hierarchy, indicating a high level of judgment
required in their valuation.
72
The
values assigned to our assets are based on available information and do not
necessarily represent amounts that might ultimately be realized, as these
amounts depend on future circumstances and cannot be reasonably determined until
the individual investments are actually liquidated or become readily
marketable. Upon sale of investments, the values that are ultimately
realized may be different from what is presently estimated. This
difference could be material.
Stock-Based
Compensation
Determining the appropriate fair-value
model and calculating the fair value of share-based awards on the date of grant
requires judgment. Historically, we have used the
Black-Scholes-Merton option pricing model to estimate the fair value of employee
stock options.
Management
uses the Black-Scholes-Merton option pricing model in instances where we lack
historical data necessary for more complex models and when the share award terms
can be valued within the model. Other models may yield fair values
that are significantly different from those calculated by the
Black-Scholes-Merton option pricing model.
Management
uses a binomial lattice option pricing model in instances where it is necessary
to include a broader array of assumptions. We used the binomial
lattice model for the 10-year NQSOs granted on March 18, 2009. These
awards included accelerated vesting provisions that were based on market
conditions. At the date of the grant, management’s analysis concluded
that triggering of the market condition acceleration clause was
probable.
Option
pricing models require the use of subjective input assumptions, including
expected volatility, expected life, expected dividend rate, and expected
risk-free rate of return. Variations in the expected volatility or
expected term assumptions have a significant impact on fair value. As
the volatility or expected term assumptions increase, the fair value of the
stock option increases. The expected dividend rate and expected
risk-free rate of return are not as significant to the calculation of fair
value. A higher assumed dividend rate yields a lower fair value,
whereas higher assumed interest rates yield higher fair values for stock
options.
In the
Black-Scholes-Merton model, we use the simplified calculation of expected term
as described in the SEC’s Staff Accounting Bulletin 107 because of the lack of
historical information about option exercise patterns. In the
binomial lattice model, we use an expected term that assumes the options will be
exercised at two-times the strike price because of the lack of option exercise
patterns. Future exercise behavior could be materially different than
that which is assumed by the model.
Expected volatility is based on the
historical fluctuations in the Company's stock. The Company's stock
has historically been volatile, which increases the fair value of the underlying
share-based awards.
GAAP requires us to develop an estimate
of the number of share-based awards that will be forfeited owing to employee
turnover. Quarterly changes in the estimated forfeiture rate can have
a significant effect on reported share-based compensation, as the effect of
adjusting the rate for all expense amortization after the grant date is
recognized in the period the forfeiture estimate is changed. If
the actual forfeiture rate proves to be higher than the estimated forfeiture
rate, then an adjustment will be made to increase the estimated forfeiture rate,
which would result in a decrease to the expense recognized in the financial
statements. If the actual forfeiture rate proves to be lower than the
estimated forfeiture rate, then an adjustment will be made to decrease the
estimated forfeiture rate, which would result in an increase to the expense
recognized in the financial statements. Such adjustments would affect
our operating expenses and additional paid-in capital, but would have no effect
on our NAV.
73
Pension and Post-Retirement
Benefit Plan Assumptions
The
Company provides a Retiree Medical Benefit Plan for employees who meet certain
eligibility requirements. The Company also provides an Executive
Mandatory Retirement Benefit Plan for certain individuals employed by us in a
bona fide executive or high policy-making position. Several
statistical and other factors that attempt to anticipate future events are used
in calculating the expense and liability values related to our post-retirement
benefit plans. These factors include assumptions we make about the
discount rate, the rate of increase in healthcare costs, and mortality, among
others.
The
discount rate reflects the current rate at which the post-retirement medical
benefit and pension liabilities could be effectively settled considering the
timing of expected payments for plan participants. In estimating this
rate, we consider the Citigroup Pension Liability Index in the determination of
the appropriate discount rate assumptions. The weighted average rate
we utilized to measure our post retirement medical benefit obligation as of
December 31, 2009, and to calculate our 2010 expense was 5.72
percent. We used a discount rate of 5.75 percent to calculate our
pension obligation for the Executive Mandatory Retirement Benefit
Plan.
Recent
Developments - Portfolio Companies
On October 27, 2010, we made a $300,000 follow-on investment in a privately
held tiny technology portfolio
company.
Forward-Looking
Statements
The information contained herein may
contain "forward-looking statements" based on our current expectations,
assumptions and estimates about us and our industry. These
forward-looking statements involve risks and uncertainties. Words
such as "believe," "anticipate," "estimate," "expect," "intend," "plan," "will,"
"may," "might," "could," "continue" and other similar expressions identify
forward-looking statements. In addition, any statements that refer to
expectations, projections or other characterizations of future events or
circumstances are forward-looking statements. Our actual results
could differ materially from those anticipated in the forward-looking statements
as a result of several factors more fully described in "Risk Factors" and
elsewhere in this Form 10-Q, and in our Form 10-K for the year ended December
31, 2009. The forward-looking statements made in this Form 10-Q
relate only to events as of the date on which the statements are
made. We undertake no obligation to update publicly any
forward-looking statements for any reason, even if new information becomes
available or other events occur in the future.
74
Item
3. Quantitative and Qualitative Disclosures About Market
Risk.
Our business activities contain
elements of risk. We consider the principal types of market risk to
be valuation risk, interest rate risk and foreign currency
risk. Although we are risk-seeking rather than risk-averse in our
investments, we consider the management of risk to be essential to our
business.
Valuation
Risk
Value, as defined in Section 2(a)(41)
of the 1940 Act, is (i) the market price for those securities for which market
quotations are readily available and (ii) fair value as determined in good faith
by, or under the direction of, the Board of Directors for all other
assets. (See the "Valuation Procedures" in the "Footnote to
Consolidated Schedule of Investments" contained in "Item 1. Consolidated
Financial Statements.")
Because there is typically no public
market for our interests in the small privately held companies in which we
invest, the valuation of the equity interests in that portion of our portfolio
is determined in good faith by our Valuation Committee, comprised of the
independent members of our Board of Directors, in accordance with our Valuation
Procedures. In the absence of a readily ascertainable market value,
the determined value of our portfolio of equity interests may differ
significantly from the values that would be placed on the portfolio if a ready
market for the equity interests existed. Determining fair value
requires that judgment be applied to the specific facts and circumstances of
each portfolio investment, although our valuation policy is intended to provide
a consistent basis for determining fair value of the portfolio
investments. Factors that may be considered include, but are not
limited to, readily available public market quotations; the cost of the
Company’s investment; transactions in the portfolio company’s
securities or unconditional firm offers by responsible parties; the financial
condition and operating results of the company; the long-term potential of the
business and technology of the company; the values of similar securities issued
by companies in similar businesses; multiples to revenues, net income or EBITDA
that similar securities issued by companies in similar businesses receive; the
proportion of the company’s securities we own and the nature of any rights to
require the company to register restricted securities under the applicable
securities laws; the achievement of milestones; and the rights and preferences
of the class of securities we own as compared with other classes of securities
the portfolio has issued. Any changes in valuation are recorded in
our Consolidated Statements of Operations as "Net decrease in unrealized
depreciation on investments." Changes in valuation of any of our
investments in privately held companies from one period to another may be
volatile.
Investments in privately held, immature
companies are inherently more volatile than investments in more mature
businesses. Such immature businesses are inherently fragile and easily
affected by both internal and external forces. Our investee companies can
lose much or all of their value suddenly in response to an internal or external
adverse event. Conversely, these immature businesses can gain suddenly in
value in response to an internal or external positive development.
The
values assigned to our assets are based on available information and do not
necessarily represent amounts that might ultimately be realized, as these
amounts depend on future circumstances and cannot be reasonably determined until
the individual investments are actually liquidated or become readily
marketable. Upon sale of investments, the values that are ultimately
realized may be different from what is presently estimated. This
difference could be material.
75
Interest
Rate Risk
We generally also invest in both short
and long-term U.S. government and agency securities. To the extent
that we invest in short and long-term U.S. government and agency securities,
changes in interest rates result in changes in the value of these obligations
that result in an increase or decrease of our NAV. The level of
interest rate risk exposure at any given point in time depends on the market
environment, the expectations of future price and market
movements, and the quantity and duration of long-term U.S.
government and agency securities held by the Company, and it will vary from
period to period. If the average interest rate on U.S. government
securities at September 30, 2010, were to increase by 25, 75 and 150 basis
points, the average value of these securities held by us at September 30, 2010,
would decrease by approximately $109,651, $328,953 and $657,905, respectively,
and our NAV would decrease correspondingly.
In addition, market interest rates for
high-yield corporate debt are an input in determining value of our investments
in debt securities of privately held and publicly traded
companies. Significant changes in these market rates could affect the
value of our debt securities as of the date of measurement of
value. Our investment income could be adversely affected should such
debt securities include floating interest rates. We do not currently
have any investments in debt securities with floating interest
rates.
In the
future, we may from time to time opt to borrow money to make
investments. Our net investment income will be dependent upon the
difference between the rate at which we borrow funds and the rate at which we
invest such funds. As a result, there can be no assurance that a
significant change in market interest rates will not have a material adverse
effect on our net investment income in the event we choose to borrow funds for
investing purposes.
Foreign
Currency Risk
Most of our investments are denominated
in U.S. dollars. We currently have one investment denominated in
Canadian dollars. We are exposed to foreign currency risk related to
potential changes in foreign currency exchange rates. The potential
loss in fair value on this investment resulting from a 10 percent adverse change
in quoted foreign currency exchange rates is $374,905 at September 30,
2010.
76
Item
4. Controls and Procedures
(a) Disclosure Controls and
Procedures. As of the end of the period covered by this
report, the Company’s management, under the supervision and with the
participation of our chief executive officer and chief financial officer,
conducted an evaluation of the effectiveness of the design and operation of our
disclosure controls and procedures (as required by Rules 13a-15 of the 1934
Act). Disclosure controls and procedures means controls and other
procedures of an issuer that are designed to ensure that information required to
be disclosed by the issuer in the reports that it files or submits under the
1934 Act is recorded, processed, summarized and reported, within time periods
specified in the SEC's rules and forms, and that such information is accumulated
and communicated to the issuer's management, as appropriate, to allow timely
decisions regarding required disclosures. As of September 30, 2010,
based upon this evaluation of our disclosure controls and procedures, our chief
executive officer and chief financial officer concluded that our disclosure
controls and procedures were effective.
(b) Changes in Internal Control Over
Financial Reporting. There have not been any changes in
the Company's internal control over financial reporting (as such term is defined
in Rules 13a-15(f) and 15d-15(f) under the 1934 Act) during the third quarter of
2010 to which this report relates that have materially affected, or are
reasonably likely to materially affect, the Company’s internal control over
financial reporting.
77
PART
II. OTHER INFORMATION
Item
1A. Risk Factors
Investing
in our common stock involves significant risks relating to our business and
investment objective. You should carefully consider the risks and
uncertainties described in our Annual Report on Form 10-K for the year ended
December 31, 2009, before you purchase any of our common stock.
The risks
described in our Annual Report on Form 10-K are not the only risks facing our
Company. Unknown additional risks and uncertainties, or ones that we currently
consider immaterial, may also impair our business. If any of these
risks or uncertainties materialize, our business, financial condition or results
of operations could be materially adversely affected. In this event,
the trading price of our common stock could decline, and you could lose all or
part of your investment. In addition to the risks described in our
Annual Report on Form 10-K, you should also consider the following
risks:
The
market price of our shares of common stock may be adversely affected by the sale
of shares by our management or founding stockholder.
Sales of
our shares of common stock by our officers through 10b5-1 plans or by our
founding stockholder could adversely and unpredictably affect the price of those
securities. Additionally, the price of our shares of common stock
could be affected even by the potential for sales by these
persons. We cannot predict the effect that any future sales of our
common stock, or the potential for those sales, will have on our share
price. Furthermore, due to relatively low trading volume of our
stock, should one or more large stockholders seek to sell a significant portion
of its stock in a short period of time, the price of our stock may
decline.
Our
portfolio companies face risks associated with international sales.
We
anticipate that certain of our portfolio companies could generate revenue from
international sales. Risks associated with these potential future
sales include:
|
|
·
|
Political
and economic instability;
|
|
|
·
|
Export
controls and other trade
restrictions;
|
|
|
·
|
Changes
in legal and regulatory
requirements;
|
|
|
·
|
U.S.
and foreign government policy changes affecting the markets for the
technologies;
|
|
|
·
|
Changes
in tax laws and tariffs;
|
|
|
·
|
Convertibility
and transferability of international currencies;
and
|
|
|
·
|
International
currency exchange rate
fluctuations.
|
78
Any of
these factors could have a material adverse effect on the business, results of
operations and financial condition of our portfolio
companies. Currency exchange rate fluctuations may negatively affect
the cost of portfolio company products to international customers and,
therefore, reduce their competitive position.
|
Item
5.
|
Exhibits
|
|
|
3(i)
|
Certificate
of Change of the Certificate of Incorporation of Harris & Harris
Group, Inc., dated August 5, 2010, incorporated by reference as Exhibit 3
to Form 8-K (File No. 814-00176) filed on August 6,
2010.
|
|
|
31.01*
|
Certification
of CEO pursuant to Section 302 of the Sarbanes-Oxley Act of
2002.
|
|
|
31.02*
|
Certification
of CFO pursuant to Section 302 of the Sarbanes-Oxley Act of
2002.
|
|
|
32*
|
Certification
of CEO and CFO pursuant to 18 U.S.C. Section 1350, as adopted pursuant to
Section 906 of the Sarbanes-Oxley Act of
2002.
|
*filed
herewith
79
SIGNATURES
Pursuant to the requirements of the
Securities Exchange Act of 1934, the Registrant has caused this report to be
signed on its behalf by the undersigned thereunto duly authorized.
Harris
& Harris Group, Inc.
/s/ Daniel B.
Wolfe
By: Daniel
B. Wolfe
Chief Financial Officer
Chief Financial Officer
/s/ Patricia N.
Egan
By: Patricia
N. Egan
Chief Accounting Officer
and Vice President
Chief Accounting Officer
and Vice President
Date:
November 8, 2010
80
EXHIBIT
INDEX
|
Exhibit
No.
|
Description
|
|
31.01
|
Certification
of CEO pursuant to Section 302 of the Sarbanes-Oxley Act of
2002.
|
|
31.02
|
Certification
of CFO pursuant to Section 302 of the Sarbanes-Oxley Act of
2002.
|
|
32
|
Certification
of CEO and CFO pursuant to 18 U.S.C. Section 1350, as adopted pursuant to
Section 906 of the Sarbanes-Oxley Act of
2002.
|
81