Published on August 8, 2008
|
Venture
Capital for Tiny Technology
|
SECOND
QUARTER REPORT 2008
FELLOW
SHAREHOLDERS:
As
always, in adversity, there is opportunity. Currently, the United States is
beset by great economic and financial adversity: declining housing prices and
rising mortgage foreclosures; the credit and banking crisis precipitated by
the
sub-prime mortgage debacle; the slowing economy; the global bear market in
stocks; the shutdown of the market for venture capital-backed initial public
offerings (IPOs); the slowdown of merger-and-acquisition activity; the
disappearance of the auction-rate securities markets; the growing U.S. budget
deficit; the devaluation of the U.S. dollar; the slump in sales and declining
re-sale values of gas-guzzling vehicles; rising unemployment; growing
delinquencies in credit-card debt; rising industrial-commodity prices; rising
food prices; widely accepted evidence of global warming; and rising energy
prices.
Of
all of
these problems, none seems more intractable than the cost and availability
of
clean energy. But for the venture capital industry and for those seeking
commercial applications for nanotechnology, there is no greater opportunity
than
cleantech -- reducing the consumption, costs, and pollution associated with
generating energy.
At
a time
when capital is hard to attract in most industries, it is pouring into
cleantech. And our own portfolio reflects this onslaught of capital for
cleantech. All of the nine companies in our portfolio that we classify as "Tiny
Tech for Cleantech," except Laser Light Engines, Inc., in which we recently
made
our initial investment, have completed follow-on financings subsequent to our
initial investment. Of the eight companies that have completed subsequent
financings, seven have completed financings at premiums to the prices of the
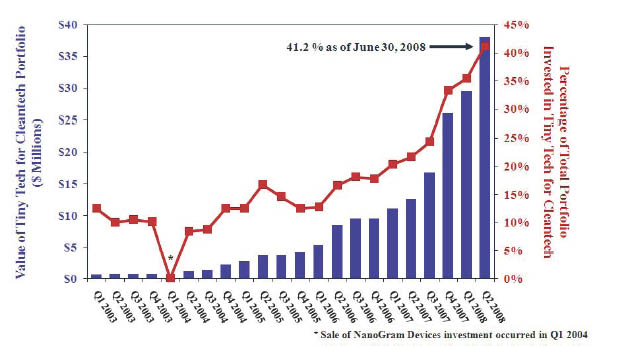
rounds of financing in which we initially participated. Thus, the value of
our
Tiny Tech for Cleantech holdings is currently $38,063,904, versus our cost
of
$21,612,011. Moreover, since we began making new investments strictly in tiny
technology in 2001, we have had no write-offs of cleantech investments, and
we
sold our shares in one such investment, NanoGram Devices Corporation, for
$2,749,955, versus our cost basis of $813,210, approximately 14 months after
our
investment. (Prior to 2001, our only investment in cleantech was in Molten
Metal
Technology, Inc., in which we completed the sale of our shares for $30,660,765,
versus our cost basis of $110,000, approximately 48 months after our
investment.)
In
the
second quarter, as a result of both new investment and appreciation in the
value
of our previous holdings, Tiny Tech for Cleantech increased from 35.5 to 41.2
percent of our portfolio. Driven by the increase in value of our Tiny Tech
for
Cleantech holdings, our net asset value per share (NAV) increased to $5.95,
its
all-time high. One of these holdings, Solazyme, was recently named most
promising U.S. green-tech firm at the sixth annual World Investment Conference
in France.
Given
the
growing employment of nanotechnology for cleantech solutions, Tiny Tech for
Cleantech may continue to grow as a percentage of our portfolio.
With
32
active companies in our portfolio, developing, making and selling a variety
of
products for a variety of markets, we are of course exposed, either directly
or
indirectly, to most of the negative forces in our economy. With respect to
some
of these negative forces, our exposure is isolated. For example, one of our
companies makes products for the home-building industry, two hold some
auction-rate securities, and some of our companies have borrowed money from
banks. With respect to other of these negative forces, most of our companies
are
or may become affected. For example, we would expect the economic slowdown
to
have some effect on most of our companies, other than the ones developing and
selling products and services for the life-sciences markets.
In
this
unusually difficult environment, we are continuing to invest. But until the
capital markets improve, we would not expect any of our portfolio companies
to
try to move ahead with IPO plans. For the first time in a quarter since 1978,
in
the second quarter of 2008, there were no IPOs in the United States of venture
capital-backed companies. Nor did the IPO market improve in July; July was
the
worst month for IPOs globally in the last five years. And while
merger-and-acquisition activity continues, it has been subdued recently.
Companies that remain in a venture capital portfolio rather than going public
or
being acquired generate no liquidity and often require additional investment.
Thus, while we weather the storm, we expect to be making a higher percentage
of
our investments than was our wont in follow-on, as opposed to initial,
investments.
|
2001
|
|
2002
|
|
2003
|
|
2004
|
|
2005
|
|
2006
|
|
2007
|
|
YTD
6/30/08
|
|||||||||||
|
Total
Incremental Investments
|
$
|
489,999
|
$
|
6,240,118
|
$
|
3,812,600
|
$
|
14,837,846
|
$
|
16,251,339
|
$
|
24,408,187
|
$
|
20,595,161
|
$
|
10,847,095
|
|||||||||
|
No.
of New Investments
|
1
|
7
|
5
|
8
|
4
|
6
|
7
|
2
|
|||||||||||||||||
|
No.
of Follow-On Investment Rounds
|
0
|
1
|
5
|
21
|
13
|
14
|
20
|
13
|
|||||||||||||||||
|
No.
of Rounds Led
|
0
|
1
|
0
|
2
|
0
|
7
|
3
|
3
|
|||||||||||||||||
|
Average
Dollar Amount - Initial
|
$
|
489,999
|
$
|
784,303
|
$
|
437,156
|
$
|
911,625
|
$
|
1,575,000
|
$
|
2,383,424
|
$
|
1,086,441
|
$
|
1,122,250
|
|||||||||
|
Average
Dollar Amount - Follow-On
|
N/A
|
$
|
750,000
|
$
|
325,364
|
$
|
359,278
|
$
|
765,488
|
$
|
721,974
|
$
|
649,504
|
$
|
661,738
|
||||||||||
In
all
environments, we endeavor to manage the high risk inherent in our individual
investments in three ways: financial diversification, economic diversification,
and degree of liquidity on our parent-company balance sheet. With respect to
financial diversification, we do not currently have as much as five percent
of
our net assets invested on a cost basis in any one portfolio company (although
occasionally we have gone over five percent in the past and may do so again
in
the future). With respect to economic diversification, our portfolio companies
are utilizing tiny technology to develop, manufacture, and market a wide variety
of products for a variety of end-user markets. With respect to balance-sheet
liquidity, we raised enough additional capital ($14,383,497, net of offering
expenses) in the second quarter to continue to execute a long-term growth
strategy, in spite of the difficult environment in which we find ourselves.
We
wound up the second quarter with $61,425,025 in U.S. treasury securities and
no
debt.
Our
company is extremely sensitive to bear markets in stocks. Our stock has a high
beta - in other words, it is much more volatile than the general stock market.
Thus, a bear market tends to lower our stock's price, which raises our cost
of
capital as well as hurting our shareholders. A bear market tends to slow if
not
halt IPOs of venture capital-backed companies. Merger-and-acquisition activity
tends to slow, and valuations of acquisitions decline, in a bear market.
Moreover, the multiple of our stock price to our net asset value per share
(NAV)
seems to be sensitive to the level of venture capital-backed IPOs. This year,
as
IPO activity dried up (there were only five venture capital-backed IPOs in
the
entire first half), whether coincidentally or not, our stock traded at times
at
or below NAV, even as our NAV was headed to a record high at the end of the
second quarter. Of course, we are far from alone in this bear market.
Ironically, in spite of the actual decline in our market value this year, we
were included in the Russell 2000 Index after the close of the equity markets
on
June 27, 2008, on the basis of the relative increase
in our
market value!
In
closing, we are very appreciative of the patience and support of our fellow
shareholders. Bear markets burn out eventually, and in their aftermath, it
always turns out that great new companies rise from the ashes. We are in the
business of trying to identify, invest in, and develop such companies. The
world
looked pretty gloomy in 1978 too, the last time there were no venture
capital-backed IPOs for an entire quarter. In the aftermath of the current
bear
market, we are betting that cleantech companies will be in the vanguard of
the
next IPO market.
 |
 |
 |
|
Charles
E. Harris
|
Douglas
W. Jamison
|
Daniel
B. Wolfe
|
|
Chairman
and Chief Executive Officer
|
President
and Chief Operating Officer
|
Chief
Financial Officer
|
|
Managing
Director
|
Managing
Director
|
Managing
Director
|
 |
 |
|
|
Michael
A. Janse
|
Alexei
A. Andreev
|
|
|
Executive
Vice President
|
Executive
Vice President
|
|
|
Managing
Director
|
Managing
Director
|
|
|
August
7, 2008
|
This
letter may contain statements of a forward-looking nature relating to future
events. These forward-looking statements are subject to the inherent
uncertainties in predicting future results and conditions. These statements
reflect the Company's current beliefs, and a number of important factors could
cause actual results to differ materially from those expressed in this letter.
Please see the Company's Annual Report on Form 10-K for the fiscal year ended
December 31, 2007, the Company's report on Form 10-Q for the quarter ended
June
30, 2008 and subsequent filings, filed with the Securities and Exchange
Commission, for a more detailed discussion of the risks and uncertainties
associated with the Company's business, including but not limited to the risks
and uncertainties associated with venture capital investing and other
significant factors that could affect the Company's actual results. Except
as
otherwise required by Federal securities laws, Harris & Harris Group,
Inc.®,
undertakes no obligation to update or revise these forward-looking statements
to
reflect new events or uncertainties. The reference to the website
www.TinyTechVC.com has been provided as a convenience, and the information
contained on such website is not incorporated by reference into this
letter.
|
HARRIS
& HARRIS GROUP, INC.
CONSOLIDATED
STATEMENTS OF ASSETS AND
LIABILITIES
|
ASSETS
|
June
30, 2008
|
December
31, 2007
|
||||||
|
(Unaudited)
|
|||||||
|
Investments,
in portfolio securities at value
|
|||||||
|
(cost:
$88,459,760 and $82,677,528, respectively)
|
$
|
92,335,524
|
$
|
78,110,384
|
|||
|
Investments,
in U.S. Treasury obligations at value
|
|||||||
|
(cost:
$60,984,874 and $59,552,933, respectively)
|
61,425,025
|
60,193,593
|
|||||
|
Cash
and cash equivalents
|
688,119
|
330,009
|
|||||
|
Restricted
funds
|
53,871
|
2,667,020
|
|||||
|
Receivable
from portfolio company
|
21,500
|
524
|
|||||
|
Interest
receivable
|
573,686
|
647,337
|
|||||
|
Prepaid
expenses
|
263,363
|
488,667
|
|||||
|
Other
assets
|
425,895
|
455,798
|
|||||
|
Total
assets
|
$
|
155,786,983
|
$
|
142,893,332
|
|||
LIABILITIES
& NET ASSETS
|
Accounts
payable and accrued liabilities
|
$
|
1,996,853
|
$
|
4,515,463
|
|||
|
Deferred
rent
|
11,290
|
14,525
|
|||||
|
Total
liabilities
|
2,008,143
|
4,529,988
|
|||||
|
Net
assets
|
$
|
153,778,840
|
$
|
138,363,344
|
|||
|
Net
assets are comprised of:
|
|||||||
|
Preferred
stock, $0.10 par value, 2,000,000 shares authorized; none
issued
|
$
|
0
|
$
|
0
|
|||
|
Common
stock, $0.01 par value, 45,000,000 shares authorized at 6/30/08
and
12/31/07; 27,688,313 issued at 6/30/08 and 25,143,313 issued
at
12/31/07
|
276,884
|
251,434
|
|||||
|
Additional
paid in capital
|
178,252,063
|
160,927,691
|
|||||
|
Accumulated
net realized loss
|
(25,660,491
|
)
|
(15,483,766
|
)
|
|||
|
Accumulated
unrealized appreciation (depreciation) of investments
|
4,315,915
|
(3,926,484
|
)
|
||||
|
Treasury
stock, at cost (1,828,740 shares at 6/30/08 and 12/31/07)
|
(3,405,531
|
)
|
(3,405,531
|
)
|
|||
|
Net
assets
|
$
|
153,778,840
|
$
|
138,363,344
|
|||
|
Shares
outstanding
|
25,859,573
|
23,314,573
|
|||||
|
Net
asset value per outstanding share
|
$
|
5.95
|
$
|
5.93
|
|
HARRIS
& HARRIS GROUP, INC.
CONSOLIDATED
STATEMENTS OF OPERATIONS
(Unaudited)
|
|
Three
Months Ended June 30,
|
Six
Months Ended June 30,
|
||||||||||||
|
2008
|
2007
|
2008
|
2007
|
||||||||||
|
Investment
income:
|
|||||||||||||
|
Interest
from:
|
|||||||||||||
|
Fixed-income
securities
|
$
|
464,456
|
$
|
637,701
|
$
|
1,040,758
|
$
|
1,290,199
|
|||||
|
Miscellaneous
income
|
3,169
|
0
|
3,169
|
0
|
|||||||||
|
Total
investment income
|
467,625
|
637,701
|
1,043,927
|
1,290,199
|
|||||||||
|
Expenses:
|
|||||||||||||
|
Salaries,
benefits and stock-based compensation
|
2,461,802
|
2,644,284
|
4,895,097
|
5,179,050
|
|||||||||
|
Administration
and operations
|
283,361
|
357,178
|
585,216
|
738,043
|
|||||||||
|
Professional
fees
|
201,866
|
335,067
|
340,098
|
517,262
|
|||||||||
|
Rent
|
59,748
|
58,813
|
117,602
|
118,320
|
|||||||||
|
Directors’
fees and expenses
|
79,169
|
112,157
|
184,315
|
253,353
|
|||||||||
|
Depreciation
|
13,819
|
15,908
|
27,804
|
31,221
|
|||||||||
|
Custodian
fees
|
6,143
|
5,961
|
12,696
|
11,735
|
|||||||||
|
Total
expenses
|
3,105,908
|
3,529,368
|
6,162,828
|
6,848,984
|
|||||||||
|
Net
operating loss
|
(2,638,283
|
)
|
(2,891,667
|
)
|
(5,118,901
|
)
|
(5,558,785
|
)
|
|||||
|
Net
realized gain (loss) from investments:
|
|||||||||||||
|
Realized
gain (loss) from investments
|
3,912
|
(8,213
|
)
|
(5,010,958
|
)
|
(8,887
|
)
|
||||||
|
Income
tax expense
|
668
|
0
|
46,866
|
84,905
|
|||||||||
|
Net
realized gain (loss) from investments
|
3,244
|
(8,213
|
)
|
(5,057,824
|
)
|
(93,792
|
)
|
||||||
|
Net
decrease (increase) in unrealized depreciation on
investments:
|
|||||||||||||
|
Change
as a result of investment sales
|
0
|
0
|
5,014,653
|
0
|
|||||||||
|
Change
on investments held
|
3,
989,748
|
(1,193,764
|
)
|
3,227,746
|
(4,831,227
|
)
|
|||||||
|
Net
decrease (increase) in unrealized depreciation on
investments
|
3,
989,748
|
(1,193,764
|
)
|
8,242,399
|
(4,831,227
|
)
|
|||||||
|
Net
increase (decrease) in net assets resulting from
operations
|
$
|
1,354,709
|
$
|
(4,093,644
|
)
|
$
|
(1,934,326
|
)
|
$
|
(10,483,804
|
)
|
||
|
Per
average basic and diluted outstanding share
|
$
|
0.06
|
$
|
(0.19
|
)
|
$
|
(0.08
|
)
|
$
|
(0.49
|
)
|
||
|
Average
outstanding shares
|
23,622,210
|
21,721,591
|
23,468,392
|
21,500,810
|
|||||||||