10-K: Annual report [Section 13 and 15(d), not S-K Item 405]
Published on March 13, 2008
UNITED
STATES
SECURITIES
AND EXCHANGE COMMISSION
WASHINGTON,
DC 20549
Form
10-K
|
x
|
ANNUAL
REPORT PURSUANT TO SECTION 13 OR 15(d)
OF THE SECURITIES EXCHANGE ACT OF
1934
|
For
the
fiscal year ended December 31, 2007
or
|
o
|
TRANSITION
REPORT PURSUANT TO SECTION 13 OR 15(d) OF THE SECURITIES EXCHANGE
ACT OF
1934
|
For
the
transition period from _____________________ to
____________________
Commission
File No. 0-11576
HARRIS
& HARRIS GROUP, INC.®
(Exact
Name of Registrant as Specified in Its Charter)
|
New
York
|
13-3119827
|
|
|
(State
or Other Jurisdiction
|
(I.R.S.
Employer
|
|
|
of
Incorporation or Organization)
|
Identification
No.)
|
|
111
West 57th Street, New York, New York
|
10019
|
|
(Address
of Principal Executive Offices)
|
(Zip
Code)
|
Registrant's
telephone number, including area code (212)
582-0900
Securities
registered pursuant to Section 12(b) of the Act:
|
Title
of Each Class
|
Name
of Each Exchange on Which Registered
|
|
|
Common
Stock, $.01 par value
|
Nasdaq
Global Market
|
Securities
registered pursuant to Section 12(g) of the Act:
None
(Title
of
Class)
Indicate
by check mark if the registrant is a well-known seasoned issuer, as defined
in
Rule 405 of the Securities Act. ¨Yes
x
No
Indicate
by check mark if the registrant is not required to file reports pursuant to
Section 13 or Section 15(d) of the Act.
oYes x No
Indicate
by check mark whether the registrant (1) has filed all reports required to
be
filed by Section 13 or 15(d) of the Securities Exchange Act of 1934 during
the
preceding 12 months (or for such shorter period that the registrant was required
to file such reports), and (2) has been subject to such filing requirements
for
the past 90 days.
x Yes
¨
No
Indicate
by check mark if disclosure of delinquent filers pursuant to Item 405 of
Regulation S-K is not contained herein, and will not be contained, to the best
of registrant's knowledge, in definitive proxy or information statements
incorporated by reference in Part III of this Form 10-K or any amendment to
this
Form 10-K.
x
Indicate
by check mark whether the registrant is a large accelerated filer, an
accelerated filer, or a non-accelerated filer. See definition of “accelerated
filer and large accelerated filer” in Rule 12b-2 of the Exchange Act. (Check
one):
|
Large
Accelerated Filer ¨
|
Accelerated
Filer x
|
Non-Accelerated
Filer ¨
|
Indicate
by check mark whether the registrant is a shell company (as defined in Rule
12b-2 of the Act).
¨ Yes
x No
The
aggregate market value of the common stock held by non-affiliates of Registrant
as of June 29, 2007 was $244,666,430 based on the last sale price as quoted
by
the Nasdaq Global Market on such date (only officers and directors are
considered affiliates for this calculation).
As
of
March 12, 2008, the registrant had 23,314,573 shares of common stock, par value
$.01 per share, outstanding.
|
DOCUMENTS
INCORPORATED BY REFERENCE
|
INCORPORATED
AT
|
|
|
Harris
& Harris Group, Inc. Proxy Statement for the
|
Part
III, Items 10, 11,
|
|
|
2008
Annual Meeting of Shareholders
|
12,
13 and 14
|
TABLE
OF
CONTENTS
|
Page
|
||
|
PART
I
|
||
|
Item
1.
|
Business
|
1
|
|
Item
1A.
|
Risk
Factors
|
15
|
|
Item
1B.
|
Unresolved
Staff Comments
|
27
|
|
Item
2.
|
Properties
|
28
|
|
Item
3.
|
Legal
Proceedings
|
28
|
|
Item
4.
|
Submission
of Matters to a Vote of Security Holders
|
28
|
|
PART
II
|
||
|
Item
5.
|
Market
For Registrant's Common Equity, Related Stockholder Matters and Issuer
Purchases of Equity Securities
|
29
|
|
Item
6.
|
Selected
Financial Data
|
32
|
|
Item
7.
|
Management's
Discussion and Analysis of Financial
|
|
|
Condition
and Results of Operations
|
33
|
|
|
Item
7A.
|
Quantitative
and Qualitative Disclosures About Market Risk
|
49
|
|
Item
8.
|
Consolidated
Financial Statements and
Supplementary Data
|
51
|
|
Item
9.
|
Changes
in and Disagreements With Accountants on Accounting and Financial
Disclosure
|
104
|
|
Item
9A.
|
Controls
and Procedures
|
104
|
|
Item
9B.
|
Other
Information
|
104
|
|
PART
III
|
||
|
Item
10.
|
Directors
and Executive Officers of the Registrant
|
105
|
|
Item
11.
|
Executive
Compensation
|
105
|
|
Item
12.
|
Security
Ownership of Certain Beneficial Owners and Management and Related
Stockholder Matters
|
105
|
|
Item
13.
|
Certain
Relationships and Related Transactions, and Director
Independence
|
105
|
|
Item
14.
|
Principal
Accountant Fees and Services
|
106
|
|
PART
IV
|
||
|
Item
15.
|
Exhibits
and Financial Statements Schedules
|
107
|
|
Signatures
|
110
|
|
|
Exhibit Index
|
112
|
PART
I
Item
1. Business.
Harris
& Harris Group, Inc.®
(the
"Company," "us," "our," and "we"), is an internally managed venture capital
company specializing in tiny technology that has elected to operate as a
business development company ("BDC") under the Investment Company Act of 1940,
which we refer to as the 1940 Act. For tax purposes, we have elected to be
a
regulated investment company ("RIC") under Subchapter M of the Internal Revenue
Code of 1986, which we refer to as the Code. Our investment objective is to
achieve long-term capital appreciation, rather than current income, by making
venture capital investments in early-stage companies. We incorporated under
the
laws of the state of New York in August 1981. Our investment approach is
comprised of a patient examination of available opportunities, thorough due
diligence and close involvement with management. As a venture capital company,
we invest in and provide managerial assistance to our portfolio companies which,
in our opinion, have significant potential for growth. We are managed by our
Board of Directors and officers and have no investment advisor.
We
make
initial venture capital investments exclusively in "tiny technology," which
we
define as nanotechnology, microsystems and microelectromechanical systems
("MEMS"). Nanotechnology is measured in nanometers, which are units of
measurement in billionths of a meter. Microsystems and microelectromechanical
systems are measured in micrometers, which are units of measurement in
millionths of a meter. We consider a company to be a tiny technology company
if
the company employs or intends to employ technology that we consider to be
at
the microscale or smaller and if the employment of that technology is material
to its business plan. Because it is in many respects a new field, tiny
technology has significant scientific, engineering and commercialization
risks.
At
December 31, 2007, 54.7 percent of our total assets and 99.9 percent of our
venture capital portfolio were invested in tiny technology investments. The
remaining 0.1 percent of our venture capital portfolio represents one non-tiny
technology investment made prior to 2001. We may make follow-on investments
in
any of our portfolio companies. By making these investments, we seek to provide
our shareholders with an increasingly specific focus on tiny technology through
a portfolio of venture capital investments that address a variety of markets
and
products. This investment policy is not a fundamental policy and accordingly
may
be changed without shareholder approval, although we intend to give shareholders
at least 60 days prior notice of any change in our policy.
Tiny
technology is multidisciplinary and widely applicable, and it incorporates
technology that was not previously in widespread use. Products enabled by tiny
technology are applicable to a large number of industries including
pharmaceuticals, medical devices, electronics and alternative (clean) energy.
The use of nanotechnology-enabled advanced materials for clean energy in
particular is an area of increasing global interest, and these types of
materials are the cornerstones of new generations of photovoltaics, batteries,
solid-state lighting, fuel cells, bio-fuels and other energy-related
applications that are the focus of a number of recently funded early-stage
companies. Although we have not specifically targeted investments in alternative
energy companies, as of December 31, 2007, eight of our 30 active portfolio
companies are focused on the commercialization of alternative energy-related
products. These companies represent 33.4 percent of our venture capital
portfolio based on value as of December 31, 2007.
1
Neither
our investments, nor an investment in us, is intended to constitute a balanced
investment program. We expect to be risk seeking rather than risk averse in
our
investment approach. To such end, we reserve the fullest possible freedom of
action, subject
to our certificate of incorporation, applicable law and regulations, and policy
statements contained herein. There is no assurance that our investment objective
will be achieved.
We
expect
to invest a substantial or major portion of our assets in securities that we
consider to be venture capital investments. These venture capital investments
usually do not pay interest or dividends and usually are subject to legal or
contractual restrictions on resale that may adversely affect the liquidity
and
marketability of such securities.
We
expect
to make speculative venture capital investments with limited marketability
and a
greater risk of investment loss than less speculative venture capital issues.
Although we currently restrict our initial venture capital investments to tiny
technology, such technology is enabling technology applicable to a wide range
of
fields and businesses, and we do not seek to invest in any particular industries
or categories of investments. Our securities investments may consist of private,
public or governmental issuers of any type. Subject to the diversification
requirements applicable to a RIC, we may commit all of our assets to only a
few
investments.
Achievement
of our investment objective is basically dependent upon the judgment of a team
of six professional, full-time members of management, five of whom are
designated as Managing Directors: Charles E. Harris, Douglas W. Jamison, Alexei
A. Andreev, Michael A. Janse and Daniel B. Wolfe. One of our directors, Lori
D.
Pressman, is also a consultant to us. This team collectively has expertise
in
venture capital investing, intellectual property and nanotechnology. There
can
be no assurance that a suitable replacement could be found for any of our
officers upon their retirement, resignation, inability to act on our behalf,
or
death. Charles E. Harris is our Chairman and Chief Executive Officer and a
"control" person as defined in the 1940 Act. On December 31, 2008, Mr. Harris
will be subject to mandatory retirement pursuant to the Company's mandatory
retirement policy for senior executives. The Board of Directors may extend
the
mandatory retirement age for a given senior executive for one additional year.
On November 2, 2006, the Board of Directors named Douglas W. Jamison as Mr.
Harris's successor upon Mr. Harris's retirement.
Subject
to continuing to meet the compliance tests applicable to BDCs, there are no
limitations on the types of securities or other assets in which we may invest.
Investments may include the following:
| · |
Equity,
equity-related securities (including warrants) and debt with equity
features from either private or public
issuers;
|
2
| · |
Venture
capital investments, whether in corporate, partnership or other form,
including development stage or start-up
entities;
|
| · |
Intellectual
property or patents or research and development in technology or
product
development that may lead to patents or other marketable
technology;
|
| · |
Debt
obligations of all types having varying terms with respect to security
or
credit support, subordination, purchase price, interest payments
and
maturity;
|
| · |
Foreign
securities; and
|
| · |
Miscellaneous
investments.
|
Investments
and Strategies
The
following is a summary description of the types of assets in which we may
invest, the investment strategies we may utilize and the attendant risks
associated with our investments and strategies.
Equity,
Equity-Related Securities and Debt with Equity Features
We
may
invest in equity, equity-related securities and debt with equity features.
These
securities include common stock, preferred stock, debt instruments convertible
into common or preferred stock, limited partnership interests, other beneficial
ownership interests and warrants, options or other rights to acquire any of
the
foregoing.
We
may
make investments in companies with operating histories that are unprofitable
or
marginally profitable, that have negative net worth or that are involved in
bankruptcy or reorganization proceedings. These investments would involve
businesses that management believes have turnaround potential through the
infusion of additional capital and management assistance. In addition, we may
make investments in connection with the acquisition or divestiture of companies
or divisions of companies. There is a significantly greater risk of loss with
these types of securities than is the case with traditional investment
securities.
We
may
also invest in publicly traded securities of whatever nature, including
relatively small, emerging growth companies that management believes have
long-term growth possibilities.
Warrants,
options and convertible or exchangeable securities generally give the investor
the right to acquire specified equity securities of an issuer at a specified
price during a specified period or on a specified date. Warrants and options
fluctuate in value in relation to the value of the underlying security and
the
remaining life of the warrant or option, while convertible or exchangeable
securities fluctuate in value both in relation to the intrinsic value of the
security without the conversion or exchange feature and in relation to the
value
of the conversion or exchange feature, which is like a warrant or option. When
we invest in these securities, we incur the risk that the option feature will
expire worthless, thereby either eliminating or diminishing the value of our
investment.
3
Investments
in equity securities of private companies involve securities that are restricted
as to sale and cannot be sold in the open market without registration under
the
Securities Act of 1933 or pursuant to a specific exemption from these
registrations. Opportunities for sale are more limited than in the case of
marketable securities, although these investments may be purchased at more
advantageous prices and may offer attractive investment opportunities. Even
if
one of our portfolio companies completes an initial public offering, we are
typically subject to a lock-up agreement for 180 days, and the stock price
may
decline substantially before we are free to sell. Even if we have registration
rights to make our investments more marketable, a considerable amount of time
may elapse between a decision to sell or register the securities for sale and
the time when we are able to sell the securities. The prices obtainable upon
sale may be adversely affected by market conditions or negative conditions
affecting the issuer during the intervening time. We may elect to hold formerly
restricted securities after they have become freely marketable, either because
they remain relatively illiquid or because we believe that they may appreciate
in value, during which holding period they may decline in value and be
especially volatile as unseasoned securities. If we need funds for investment
or
working capital purposes, we might sell marketable securities at disadvantageous
times or prices.
Venture
Capital Investments
We
define
venture capital as the money and resources made available to start-up firms
and
small businesses with exceptional growth potential. We expect our venture
capital investments to be largely in development stage or start-up businesses.
Substantially all of our long-term venture capital investments are in thinly
capitalized, unproven, small companies focused on risky technologies. These
businesses also tend to lack management depth, to have limited or no history
of
operations and to have not attained profitability. Because of the speculative
nature of these investments, these securities have a significantly greater
risk
of loss than traditional investment securities. Some of our venture capital
investments will be complete losses or unprofitable, and some will never realize
their potential.
We
may
own 100 percent of the securities of a start-up investment for a period of
time
and may control the company for a substantial period. Start-up companies are
more vulnerable than better capitalized companies to adverse business or
economic developments. Start-up businesses generally have limited product lines,
markets and/or financial resources. Start-up companies are not well-known to
the
investing public and are subject to potential bankruptcy, general movements
in
markets and perceptions of potential growth.
In
connection with our venture capital investments, we may participate in providing
a variety of services to our portfolio companies, including the
following:
4
| · |
recruiting
management;
|
| · |
formulating
operating strategies;
|
| · |
formulating
intellectual property strategies;
|
| · |
assisting
in financial planning;
|
| · |
providing
management in the initial start-up stages; and
|
| · |
establishing
corporate goals.
|
We
may
assist in raising additional capital for these companies from other potential
investors and may subordinate our own investment to that of other investors.
We
typically find it necessary or appropriate to provide additional capital of
our
own. We may introduce these companies to potential joint venture partners,
suppliers and customers. In addition, we may assist in establishing
relationships with investment bankers and other professionals. We may also
assist with mergers and acquisitions. We do not derive income from these
companies for the performance of any of the above services.
We
may
control, be represented on, or have observer rights on the Board of Directors
of
a portfolio company through one or more of our officers or directors, who may
also serve as officers of the portfolio company. We indemnify our officers
and
directors for serving on the Boards of Directors or as officers of portfolio
companies, which exposes us to additional risks. Particularly during the early
stages of an investment, we may, in rare instances, in effect be conducting
the
operations of the portfolio company. As a venture capital backed company emerges
from the developmental stage with greater management depth and experience,
we
expect that our role in the portfolio company’s operations will diminish. Our
goal is to assist each company in establishing its own independent
capitalization, management and Board of Directors. We expect to be able to
reduce our involvement in those start-up companies that become successful,
as
well as in those start-up companies that fail.
Intellectual
Property
We
believe there is a role for organizations that can assist in technology
transfer. Scientists and institutions that develop and patent intellectual
property perceive the need for and rewards of entrepreneurial commercialization
of their inventions.
Our
form
of investment may be:
| · |
funding
research and development in the development of a technology;
|
| · |
obtaining
licensing rights to intellectual property or patents;
|
| · |
acquiring
intellectual property or patents;
or
|
| · |
forming
and funding companies or joint ventures to commercialize further
intellectual property.
|
5
Income
from our investments in intellectual property or its development may take the
form of participation in licensing or royalty income, fee income, or some other
form of remuneration. In order to satisfy RIC requirements, these investments
will normally be held in an entity taxable as a corporation. Investment in
developmental intellectual property rights involves a high degree of risk that
can result in the loss of our entire investment as well as additional risks
including uncertainties as to the valuation of an investment and potential
difficulty in liquidating an investment. Further, investments in intellectual
property generally require investor patience, as investment return may be
realized only after or over a long period. At some point during the
commercialization of a technology, our investment may be transformed into
ownership of securities of a development stage or start-up company, as discussed
under "Venture Capital Investments" above.
Debt
Obligations
We
may
hold debt securities for income and as a reserve pending more speculative
investments. Debt obligations may include U.S. government and agency securities,
commercial paper, bankers’ acceptances, receivables or other asset-based
financing, notes, bonds, debentures, or other debt obligations of any nature
and
repurchase agreements related to these securities. These obligations may have
varying terms with respect to security or credit support, subordination,
purchase price, interest payments and maturity from private, public or
governmental issuers of any type located anywhere in the world. We may invest
in
debt obligations of companies with operating histories that are unprofitable
or
marginally profitable, that have negative net worth or are involved in
bankruptcy or reorganization proceedings, or that are start-up or development
stage entities. In addition, we may participate in the acquisition or
divestiture of companies or divisions of companies through issuance or receipt
of debt obligations. As of December 31, 2007, the debt obligations held in
our
portfolio consisted of convertible bridge notes and U.S. Treasury
securities.
It
is
likely that our investments in debt obligations will be of varying quality,
including non-rated, unsecured, highly speculative debt investments with limited
marketability. Investments in lower-rated and non-rated securities, commonly
referred to as "junk bonds," are subject to special risks, including a greater
risk of loss of principal and non-payment of interest. Generally, lower-rated
securities offer a higher return potential than higher-rated securities, but
involve greater volatility of price and greater risk of loss of income and
principal, including the possibility of default or bankruptcy of the issuers
of
these securities. Lower-rated securities and comparable non-rated securities
will likely have large uncertainties or major risk exposure to adverse
conditions and are predominantly speculative with respect to the issuer’s
capacity to pay interest and repay principal in accordance with the terms of
the
obligation. The occurrence of adverse conditions and uncertainties to issuers
of
lower-rated securities would likely reduce the value of lower-rated securities
held by us, with a commensurate effect on the value of our shares.
6
The
markets in which lower-rated securities or comparable non-rated securities
are
traded generally are more limited than those in which higher-rated securities
are traded. The existence of limited markets for these securities may restrict
our ability to obtain accurate market quotations for the purposes of valuing
lower-rated or non-rated securities and calculating net asset value or to sell
securities at their fair value. Any economic downturn could adversely affect
the
ability of issuers’ lower-rated securities to repay principal and pay interest
thereon. The market values of lower-rated and non-rated securities also tend
to
be more sensitive to individual corporate developments and changes in economic
conditions than higher-rated securities. In addition, lower-rated securities
and
comparable non-rated securities generally present a higher degree of credit
risk. Issuers of lower-rated securities and comparable non-rated securities
are
often highly leveraged and may not have more traditional methods of financing
available to them, so that their ability to service their debt obligations
during an economic downturn or during sustained periods of rising interest
rates
may be impaired. The risk of loss owing to default by these issuers is
significantly greater because lower-rated securities and comparable non-rated
securities generally are unsecured and frequently are subordinated to the prior
payment of senior indebtedness. We may incur additional expenses to the extent
that we are required to seek recovery upon a default in the payment of principal
or interest on our portfolio holdings.
The
market value of investments in debt securities that carry no equity
participation usually reflects yields generally available on securities of
similar quality and type at the time purchased. When interest rates decline,
the
market value of a debt portfolio already invested at higher yields can be
expected to rise if the securities are protected against early call. Similarly,
when interest rates increase, the market value of a debt portfolio already
invested at lower yields can be expected to decline. Deterioration in credit
quality also generally causes a decline in market value of the security, while
an improvement in credit quality generally leads to increased
value.
Foreign
Securities
We
may
make investments in securities of issuers whose principal operations are
conducted outside the United States, and whose earnings and securities are
stated in foreign currency. In order to maintain our status as a business
development company, our investments in the stocks of companies organized
outside the U.S. would be limited to 30 percent of our assets, because we must
invest at least 70 percent of our assets in "qualifying assets," and securities
of foreign companies are not "qualifying assets."
Compared
to otherwise comparable investments in securities of U.S. issuers, currency
exchange risk of securities of foreign issuers is a significant variable. The
value of these investments to us will vary with the relation of the currency
in
which they are denominated to the U.S. dollar, as well as with intrinsic
elements of value such as credit risk, interest rates and performance of the
issuer. Investments in foreign securities also involve risks relating to
economic and political developments, including nationalization, expropriation
of
assets, currency exchange freezes and local recession. Securities of many
foreign issuers are less liquid and more volatile than those of comparable
U.S.
issuers. Interest and dividend income and capital gains on our foreign
securities may be subject to withholding and other taxes that may not be
recoverable by us. We may seek to hedge all or part of the currency risk of
our
investments in foreign securities through the use of futures, options and
forward currency purchases or sales.
7
Borrowing
and Margin Transactions
We
may
from time to time borrow money or obtain credit by any lawful means from banks,
lending institutions, other entities or individuals, in negotiated transactions.
We may issue, publicly or privately, bonds, debentures or notes, in series
or
otherwise, with interest rates and other terms and provisions, including
conversion rights, on a secured or unsecured basis, for any purpose, up to
the
maximum amounts and percentages permitted for business development companies
under the 1940 Act. The 1940 Act currently prohibits us from borrowing any
money
or issuing any other senior securities (other than preferred stock and other
than temporary borrowings of up to five percent of our assets), if in giving
effect to the borrowing or issuance, the value of our total assets would be
less
than 200 percent of our total liabilities (other than liabilities not
constituting senior securities). We may pledge assets to secure any borrowings.
We currently have no leverage and have no current intention to issue preferred
stock.
A
primary
purpose of our borrowing power is for leverage, to increase our ability to
acquire investments both by acquiring larger positions and by acquiring more
positions. Borrowings for leverage accentuate any increase or decrease in the
market value of our investments and thus our net asset value. Because any
decline in the net asset value of our investments will be borne first by holders
of common stock, the effect of leverage in a declining market would be a greater
decrease in net asset value applicable to the common stock than if we were
not
leveraged. Any decrease would likely be reflected in a decline in the market
price of our common stock. To the extent the income derived from assets acquired
with borrowed funds exceeds the interest and other expenses associated with
borrowing, our total income will be greater than if borrowings were not used.
Conversely, if the income from assets is not sufficient to cover the borrowing
costs, our total income will be less than if borrowings were not used. If our
current income is not sufficient to meet our borrowing costs (repayment of
principal and interest), we might have to liquidate some or all of our
investments when it may be disadvantageous to do so. Our borrowings for the
purpose of buying most liquid equity securities will be subject to the margin
rules, which require excess liquid collateral marked to market daily. If we
are
unable to post sufficient collateral, we will be required to sell securities
to
remain in compliance with the margin rules. These sales might be at
disadvantageous times or prices.
Repurchase
of Shares
Our
shareholders do not have the right to compel us to redeem our shares. We may,
however, purchase outstanding shares of our common stock from time to time,
subject to approval of our Board of Directors and compliance with applicable
corporate and securities laws. The Board of Directors may authorize purchases
from time to time when they are deemed to be in the best interests of our
shareholders, but could do so only after notification to shareholders. The
Board
of Directors may or may not decide to undertake any purchases of our common
stock.
8
Our
repurchases of our common shares would decrease our total assets and would
therefore likely have the effect of increasing our expense ratio. Subject to
our
investment restrictions, we may borrow money to finance the repurchase of our
common stock in the open market pursuant to any tender offer. Interest on any
borrowings to finance share repurchase transactions will reduce our net assets.
If, because of market fluctuations or other reasons, the value of our assets
falls below the required 1940 Act coverage requirements, we may have to reduce
our borrowed debt to the extent necessary to comply with the requirement. To
achieve a reduction, it is possible that we may be required to sell portfolio
securities at inopportune times when it may be disadvantageous to do so. Since
1998, we have repurchased a total of 1,828,740 shares of our common stock at
a
total cost of $3,405,531, or $1.86 per share. On July 23, 2002, because of
our
strategic decision to invest in tiny technology, our Board of Directors
reaffirmed its commitment not to authorize the purchase of additional shares
of
our common stock.
Portfolio
Company Turnover
Changes
with respect to portfolio companies will be made as our management considers
necessary in seeking to achieve our investment objective. The rate of portfolio
turnover will not be treated as a limiting or relevant factor when circumstances
exist, which are considered by management to make portfolio changes
advisable.
Although
we expect that many of our investments will be relatively long term in nature,
we may make changes in our particular portfolio holdings whenever it is
considered that an investment no longer has substantial growth potential or
has
reached its anticipated level of performance, or (especially when cash is not
otherwise available) that another investment appears to have a relatively
greater opportunity for capital appreciation. We may also make general portfolio
changes to increase our cash to position us in a defensive posture. We may
make
portfolio changes without regard to the length of time we have held an
investment, or whether a sale results in profit or loss, or whether a purchase
results in the reacquisition of an investment which we may have only recently
sold. Our investments in privately held companies are illiquid, which limits
portfolio turnover.
The
portfolio turnover rate may vary greatly from year to year as well as during
a
year and may also be affected by cash requirements.
Competition
Numerous
companies and individuals are engaged in the venture capital business, and
such
business is intensely competitive. We believe the perpetual nature of our
corporate structure enables us to be a better long-term partner for our
portfolio companies than if we were organized as a traditional private equity
fund, which typically has a limited life. We believe that we have invested
in
more nanotechnology-enabled companies than any venture capital firm and that
we
have assembled a team of investment professionals that have scientific and
intellectual property expertise that is relevant to investing in tiny
technology. Nevertheless, many of our competitors have significantly greater
financial and other resources and managerial capabilities than we do and are
therefore, in certain respects, in a better position than we are to obtain
access to attractive venture capital investments, particularly as a lead
investor in capital-intensive companies. There can be no assurance that we
will
be able to compete against these venture capital businesses for attractive
investments, particularly as a lead investor in capital-intensive
companies.
9
Regulation
The
Small
Business Investment Incentive Act of 1980 added the provisions of the 1940
Act
applicable to BDCs. BDCs are a special type of investment company. After a
company files its election to be treated as a BDC, it may not withdraw its
election without first obtaining the approval of holders of a majority of its
outstanding voting securities. The following is a brief description of the
1940
Act provisions applicable to BDCs, qualified in its entirety by reference to
the
full text of the 1940 Act and the rules issued thereunder by the
SEC.
Generally,
to be eligible to elect BDC status, a company must primarily engage in the
business of furnishing capital and making significant managerial assistance
available to companies that do not have ready access to capital through
conventional financial channels. Such portfolio companies are termed "eligible
portfolio companies." In general, in order to qualify as a BDC, a company must:
(i) be a domestic company; (ii) have registered a class of its securities
pursuant to Section 12 of the Securities Exchange Act of 1934; (iii) operate
for
the purpose of investing in the securities of certain types of portfolio
companies, including early stage or emerging companies and businesses suffering
or just recovering from financial distress (see following paragraph); (iv)
make
available significant managerial assistance to such portfolio companies; and
(v)
file a proper notice of election with the SEC.
An
eligible portfolio company generally is a domestic company that is not an
investment company or a company excluded from investment company status pursuant
to exclusions for certain types of financial companies (such as brokerage firms,
banks, insurance companies and investment banking firms) and that: (i) does
not
have a class of equity securities listed on a national securities exchange
or
(ii) is controlled by the BDC by itself or together with others (control under
the 1940 Act is presumed to exist where a person owns at least 25 percent of
the
outstanding voting securities of the portfolio company).
We
may be
periodically examined by the SEC for compliance with the 1940 Act.
As
with
other companies regulated by the 1940 Act, a BDC must adhere to certain
substantive regulatory requirements. A majority of the directors must be persons
who are not interested persons, as that term is defined in the 1940 Act.
Additionally, we are required to provide and maintain a bond issued by a
reputable fidelity insurance company to protect the BDC. Furthermore, as a
BDC,
we are prohibited from protecting any director or officer against any liability
to us or our shareholders arising from willful malfeasance, bad faith, gross
negligence or reckless disregard of the duties involved in the conduct of such
person's office.
10
The
1940
Act provides that we may not make an investment in non-qualifying assets unless
at the time at least 70 percent of the value of our total assets (measured
as of
the date of our most recently filed financial statements) consists of qualifying
assets. Qualifying assets include: (i) securities of eligible portfolio
companies that are not part of a public offering; (ii) securities of certain
companies that were eligible portfolio companies at the time we initially
acquired their securities and in which we retain a substantial interest; (iii)
securities of certain controlled companies; (iv) securities of certain bankrupt,
insolvent or distressed companies; (v) securities received in exchange for
or
distributed in or with respect to any of the foregoing; and (vi) cash items,
government securities and high quality short-term debt. The SEC has adopted
a
rule permitting a BDC to invest its cash in certain money market funds. The
1940
Act also places restrictions on the nature of the transactions in which, and
the
persons from whom, securities can be purchased in some instances in order for
the securities to be considered qualifying assets.
We
are
permitted by the 1940 Act, under specified conditions, to issue multiple classes
of debt and a single class of preferred stock if our asset coverage, as defined
in the 1940 Act, is at least 200 percent after the issuance of the debt or
the
preferred stock (i.e., such senior securities may not be in excess of our net
assets). Under specific conditions, we are also permitted by the 1940 Act to
issue warrants.
Except
under certain conditions, we may sell our securities at a price that is below
the prevailing net asset value per share only after a majority of our directors
and our disinterested directors have determined that such sale would be in
the
best interest of us and our stockholders and upon the approval by the holders
of
a majority of our outstanding voting securities voting on the matter at a
meeting at which a quorum is present. If the offering of the securities is
underwritten, a majority of the disinterested directors must determine in good
faith that the price of the securities being sold is not less than a price
which
closely approximates market value of the securities, less any distribution
discount or commission.
Certain
transactions involving certain closely related persons of the Company, including
its directors, officers and employees, may require the prior approval of the
SEC. However, the 1940 Act ordinarily does not restrict transactions between
us
and our portfolio companies.
Subchapter
M Status
We
elected to be treated as a regulated investment company (a "RIC"), taxable
under
Subchapter M of the Internal Revenue Code (the "Code"), for federal income
tax
purposes. In general, a RIC is not taxable on its income or gains to the extent
it distributes such income or gains to its shareholders. In order to qualify
as
a RIC, we must, in general, (1) annually derive at least 90 percent of our
gross
income from dividends, interest and gains from the sale of securities and
similar sources (the "Income Source Rule"); (2) quarterly meet certain
investment asset diversification requirements; and (3) annually distribute
at
least 90 percent of our investment company taxable income as a dividend (the
"Income Distribution Rule"). Any taxable investment company income not
distributed will be subject to corporate level tax. Any taxable investment
company income distributed generally will be taxable to shareholders as dividend
income.
11
In
addition to the requirement that we must annually distribute at least 90 percent
of our investment company taxable income, we may either distribute or retain
our
realized net capital gains from investments, but any net capital gains not
distributed may be subject to corporate level tax. It is our current intention
not to distribute net capital gains. Any net capital gains distributed generally
will be taxable to shareholders as long-term capital gains.
In
lieu
of actually distributing our realized net capital gains, we as a RIC may retain
all or part of our net capital gains and elect to be deemed to have made a
distribution of the retained portion to our shareholders under the "designated
undistributed capital gain" rules of the Code. We currently intend to retain
and
designate all of our net capital gains. In this case, the "deemed dividend"
generally is taxable to our shareholders as long-term capital gains. Although
we
pay tax at the corporate rate on the amount deemed to have been distributed,
our
shareholders receive a tax credit equal to their proportionate share of the
tax
paid and an increase in the tax basis of their shares by the amount per share
retained by the Company.
To
the
extent that we declare a deemed dividend, each shareholder will receive an
IRS
Form 2439 that will reflect each shareholder's receipt of the deemed dividend
income and a tax credit equal to each shareholder's proportionate share of
the
tax paid by us. This tax credit, which is paid at the corporate rate, is often
credited at a higher rate than the actual tax due by a shareholder on the deemed
dividend income. The "residual" credit can be used by the shareholder to offset
other taxes due in that year or to generate a tax refund to the shareholder.
Tax
exempt investors may file for a refund.
The
following simplified examples illustrate the tax treatment under Subchapter
M of
the Code for us and our individual shareholders with regard to three possible
distribution alternatives, assuming a net capital gain of $1.00 per share,
consisting entirely of sales of non-real property assets held for more than
12
months.
Under
Alternative A:
100
percent of net capital gain declared as a cash dividend and distributed to
shareholders:
1.No
federal taxation at the Company level.
2.Taxable
shareholders receive a $1.00 per share dividend and pay federal tax at a
rate
not
in
excess of 15 percent* or $.15 per share, retaining $.85 per
share.
3.Non-taxable
shareholders that file a federal tax return receive a $1.00 per share
dividend
and pay no federal tax, retaining $1.00 per share.
Under
Alternative B:
100
percent of net capital gain retained by the Company and designated as
"undistributed capital gain" or deemed dividend:
1.The
Company pays a corporate-level federal income tax of 35 percent on the
undistributed
gain or $.35 per share and retains 65 percent of the gain or $.65 per
share.
12
2.Taxable
shareholders increase their cost basis in their stock by $.65 per share.
They
pay
federal capital gains tax at a rate not in excess of 15 percent* on 100 percent
of the undistributed
gain of $1.00 per share or $.15 per share in tax. Offsetting this tax,
shareholders
receive a
tax
credit equal to 35 percent of the undistributed gain or $.35 per share.
3. Non-taxable
shareholders that file a federal tax return receive a tax refund equal
to
$.35
per share.
*Assumes
all capital gains qualify for long-term rates of 15 percent.
Under
Alternative C:
100
percent of net capital gain retained by the Company, with no designated
undistributed capital gain or deemed dividend:
1. The
Company pays a corporate-level federal income tax of 35 percent on the retained
gain
or
$.35 per share plus an excise tax of four percent of $.98 per share, or about
$.04 per
share.
2. There
is
no tax consequence at the shareholder level.
Although
we may retain income and gains subject to the limitations described above
(including paying corporate level tax on such amounts), we could be subject
to
an additional four percent excise tax if we fail to distribute 98 percent of
our
aggregate annual taxable income.
As
noted
above, in order to qualify as a RIC, we must meet certain investment asset
diversification requirements each quarter. Because of the specialized nature
of
our investment portfolio, in some years we have been able to satisfy the
diversification requirements under Subchapter M of the Code primarily as a
result of receiving certifications from the SEC under the Code with respect
to
each taxable year beginning after 1998 that we were "principally engaged in
the
furnishing of capital to other corporations which are principally engaged in
the
development or exploitation of inventions, technological improvements, new
processes, or products not previously generally available" for such
year.
Although
we received SEC certifications for 1999-2006, there can be no assurance that
we
will receive such certification for 2007 or subsequent years (to the extent
we
need additional certifications as a result of changes in our portfolio). If
we
require, but fail to obtain, the SEC certification for a taxable year, we may
fail to qualify as a RIC for such year. We will also fail to qualify as a RIC
for a taxable year if we do not satisfy the Income Source Rule or Income
Distribution Rule for such year. In the event we do not qualify as a RIC for
any
taxable year, we will be subject to federal tax with respect to all of our
taxable income, whether or not distributed. In addition, all our distributions
to shareholders in that situation generally will be taxable as ordinary
dividends.
Although
we generally intend to qualify as a RIC for each taxable year, under certain
circumstances we may choose to take action with respect to one or more taxable
years to ensure that we would be taxed under Subchapter C of the Code (rather
than Subchapter M) for such year or years. We will choose to take such action
only if we determine that the result of the action will benefit us and our
shareholders.
13
Prior
to
1999, we were taxable under Subchapter C of the Code (a "C Corporation"). Under
the Code, a C Corporation that elects to be treated as a RIC for federal tax
purposes is taxable on the effective date of the election to the extent of
any
gain built into its assets ("C Corporation Assets") on such date ("Built-In
Gain"). However, a C Corporation may elect alternatively to be taxable on such
Built-In Gain as such gain is realized during the 10-year period beginning
on
the effective date of its RIC election (the "Inclusion Period"). We had Built-In
Gains at the time of our qualification as a RIC and elected to be taxed on
any
Built-In Gain realized during the Inclusion Period. Prior to 1999, we carried
forward ordinary and capital losses from our operations. After our election
of
RIC status, those losses remained available to be carried forward to subsequent
taxable years. Recently issued Internal Revenue Service regulations confirm
that
such losses may be used to offset realized Built-In Gains and, to the extent
so
used, to eliminate C Corporation taxation of such gains. We have previously
used
loss carryforwards to offset Built-In Gains. As of January 1, 2006, the Company
had utilized all of its remaining pre-1999 loss carryforwards and unrealized
Built-In Gains.
Subsidiaries
Harris
& Harris Enterprises, Inc. ("Enterprises"), is a 100 percent wholly owned
subsidiary of the Company and is consolidated in our financial statements.
Enterprises is a partner in Harris Partners I, L.P., and is taxed as a C
Corporation. Harris Partners I, L.P., is a limited partnership. Harris Partners
I, L.P., owned our interest in AlphaSimplex Group, LLC, until AlphaSimplex
was
sold to Natixis Global Asset Management. We received our share of the proceeds
on October 30, 2007. The partners of Harris Partners I, L.P., are Harris &
Harris Enterprises, Inc. (sole general partner) and the Company (sole limited
partner).
Available
Information
Additional
information about us, including our annual report on Form 10-K, quarterly
reports on Form 10-Q, current reports on Form 8-K and amendments to those
reports filed or furnished pursuant to Section 13(a) or 15(d) of the Securities
Exchange Act of 1934, are available on our website at www.TinyTechVC.com.
Information on our website is not part of this annual report on Form
10-K.
Employees
We
currently employ directly 13 full-time employees.
14
Item
1A. Risk Factors.
Investing
in our common stock involves significant risks relating to our business and
investment objective. You should carefully consider the risks and uncertainties
described below before you purchase any of our common stock. These risks and
uncertainties are not the only ones we face. Unknown additional risks and
uncertainties, or ones that we currently consider immaterial, may also impair
our business. If any of these risks or uncertainties materialize, our business,
financial condition or results of operations could be materially adversely
affected. In this event, the trading price of our common stock could decline,
and you could lose all or part of your investment.
Risks
related to the companies in our portfolio.
A
continuing lack of initial public offering opportunities may cause companies
to
stay in our portfolio longer, leading to lower returns, write-downs and
write-offs.
Beginning
in about 2001, many fewer venture capital-backed companies per annum have been
able to complete initial public offerings (IPOs) than in the years of the
previous decade. Moreover, in 2007, according to VentureSource, the
venture capital-backed companies that completed IPOs had a median age of about
8.3 years, which was older than the median age of venture capital-backed IPOs
in
any period since 2001-2002. Now that some of our companies are becoming
more mature, a continuing lack of IPO opportunities for venture capital-backed
companies could lead to companies staying longer in our portfolio as private
entities still requiring funding. In the best case, such stagnation would
dampen returns, and in the worst case, could lead to write-downs and write-offs
as some companies run short of cash and have to accept lower valuations in
private fundings or are not able to access additional capital at all. A
continuing lack of IPO opportunities for venture capital-backed companies is
also causing some venture capital firms to change their strategies, which is
causing some of them to reduce funding of their portfolio companies, making
it
more difficult for such companies to access capital and to fulfill their
potential, leading in some cases to write-downs and write-offs of such companies
by other venture capital firms, such as ourselves, who are co-investors in
such
companies.
Investing
in small, private companies involves a high degree of risk and is highly
speculative.
We
have
invested a substantial portion of our assets in privately held development
stage
or start-up companies, the securities of which are inherently illiquid. These
businesses tend to lack management depth, to have limited or no history of
operations and to have not attained profitability. Tiny technology companies
are
especially risky, involving scientific, technological and commercialization
risks. Because of the speculative nature of these investments, these securities
have a significantly greater risk of loss than traditional investment
securities. Some of our venture capital investments are likely to be complete
losses or unprofitable, and some will never realize their potential. We have
been and will continue to be risk seeking rather than risk averse in our
approach to venture capital and other investments. Neither our investments
nor
an investment in our common stock is intended to constitute a balanced
investment program.
15
We
may invest in companies working with technologies or intellectual property
that
currently have few or no proven commercial applications.
Nanotechnology,
in particular, is a developing area of technology, of which much of the future
commercial value is unknown, difficult to estimate and subject to widely varying
interpretations. There are as of yet relatively few nanotechnology-enabled
products commercially available. The timing of additional future commercially
available nanotechnology products is highly uncertain.
Our
portfolio companies may not successfully develop, manufacture or market their
products.
The
technology of our portfolio companies is new and in many cases unproven. Their
potential products require significant and lengthy product development,
manufacturing and marketing efforts. To date, many of our portfolio companies
have not developed any commercially available products. In addition, our
portfolio companies may not be able to manufacture successfully or to market
their products in order to achieve commercial success. Further, the products
may
never gain commercial acceptance. If our portfolio companies are not able to
develop, manufacture or market successful tiny technology-enabled products,
they
will be unable to generate product revenue or build sustainable or profitable
businesses. Adverse conditions in the target markets of our portfolio companies
may limit or prevent commercial success regardless of the contribution of tiny
technology to these products.
Our
portfolio companies working with tiny technology may be particularly susceptible
to intellectual property litigation.
Research
and commercialization efforts in tiny technology are being undertaken by a
wide
variety of government, academic and private corporate entities. As additional
commercially viable applications of tiny technology emerge, ownership of
intellectual property on which these products are based may be contested. From
time to time, our portfolio companies are or have been involved in intellectual
property disputes and litigation. Any litigation over the ownership of, or
rights to, any of our portfolio companies’ technologies or products could have a
material adverse effect on those companies’ values.
Unfavorable
general economic conditions, as well as unfavorable conditions specific to
the
venture capital industry or a segment of portfolio companies, could result
in
the inability of our portfolio companies to access additional capital, leading
to financial losses in our portfolio.
Most
of
the companies in which we have made or will make investments are susceptible
to
economic slowdowns or recessions. An economic slowdown or adverse capital or
credit market conditions may affect the ability of a company in our portfolio
to
raise additional capital from venture capital or other sources or to engage
in a
liquidity event such as an initial public offering or merger. Certain types
of
portfolio companies, such as those engaged in solar, solid-state lighting and
other alternative energy (cleantech) applications, which are currently in favor
with the media and investors generally, may have a harder time accessing capital
in the future if their industries subsequently fall out of fashion. Adverse
economic, capital or credit market conditions may lead to financial losses
in
our portfolio.
16
The
value of our portfolio could be adversely affected if the technologies
utilized by our portfolio companies are found, or even rumored or feared, to
cause health or environmental risks, or if legislation is passed that limits
the
commercialization of any of these technologies.
Nanotechnology
has received both positive and negative publicity and is the subject
increasingly of public discussion and debate. For
example, debate regarding the production of materials that could cause harm
to
the environment or the health of individuals could raise concerns in the
public’s perception of nanotechnology, not all of which might be rational or
scientifically based. Tiny
technology in general and nanotechnology in particular are currently the subject
of health and environmental impact research. If health or environmental concerns
about tiny technology or nanotechnology
were to
arise, whether or not they had any basis in fact, our portfolio companies might
incur additional research, legal and regulatory expenses, and might have
difficulty raising capital or marketing their products. Government
authorities could, for social or other purposes, prohibit or regulate the use
of
nanotechnology. Legislation
could be passed that could circumscribe the commercialization of any of these
technologies.
Our
portfolio companies may generate revenues from the sale of non-tiny
technology-enabled products.
We
consider a company to be a tiny technology company if a product or products,
or
intellectual property covering a product or products, that we consider to be
at
the microscale or smaller is material to its business plan. The core
business of some of these companies may not be tiny technology-enabled products,
and therefore their success or failure may not be dependent upon the tiny
technology aspects of their business. In addition to developing products
that we consider tiny technology, some of these companies may also develop
products that we do not consider enabled by tiny technology. Some of these
companies will generate revenues from the sale of non-tiny technology-enabled
products. Additionally, it is possible that a portfolio company may decide
to change its business focus after our initial investment and decide to develop
and commercialize non-tiny technology-enabled products.
Risks
related to the illiquidity of our investments.
We
invest in illiquid securities and may not be able to dispose of them when it
is
advantageous to do so, or ever.
Most
of
our investments are or will be equity or equity-linked securities acquired
directly from small companies. These equity securities are generally subject
to
restrictions on resale or otherwise have no established trading market. The
illiquidity of most of our portfolio of equity securities
may adversely affect our ability to dispose of these securities at times when
it
may be advantageous for us to liquidate these investments. We may never be
able
to dispose of these securities.
17
Unfavorable
economic conditions and regulatory changes could impair our ability to engage
in
liquidity events.
Our
business of making private equity investments and positioning our portfolio
companies for liquidity events might be adversely affected by current and future
capital markets and economic conditions. The public equity markets currently
provide less opportunity for liquidity events than at times in the past when
there was more robust demand for initial public offerings, even for more mature
technology companies than those in which we typically invest. The potential
for
public market liquidity could further decrease and could lead to an inability
to
realize potential gains or could lead to financial losses in our portfolio
and a
decrease in our revenues, net income and assets. Recent government reforms
affecting publicly traded companies, stock markets, investment banks and
securities research practices have made it more difficult for privately held
companies to complete successful initial public offerings of their equity
securities, and such reforms have increased the expense and legal exposure
of
being a public company. Slowdowns in initial public offerings may also be having
an adverse effect on the frequency and prices of acquisitions of privately
held
companies. A lack of merger and/or acquisition opportunities for privately
held
companies also may be having an adverse effect on the ability of these companies
to raise capital from private sources. Public equity market response to
companies offering nanotechnology-enabled products is uncertain. An inability
to
engage in liquidity events could negatively affect our liquidity, our
reinvestment rate in new and follow-on investments and the value of our
portfolio.
Even
if some of our portfolio companies complete initial public offerings, the
returns on our investments in those companies would be
uncertain.
When
companies in which we have invested as private entities complete initial public
offerings of their securities, these newly issued securities are by definition
unseasoned issues. Unseasoned issues tend to be highly volatile and have
uncertain liquidity, which may negatively affect their price. In addition,
we
are typically subject to lock-up provisions that prohibit us from selling our
investments into the public market for specified periods of time after initial
public offerings. The market price of securities that we hold may decline
substantially before we are able to sell these securities. Most initial public
offerings of technology companies in the United States are listed on the Nasdaq
Global Market. Government reforms of the Nasdaq Global Market have made
market-making by broker-dealers less profitable, which has caused broker-dealers
to reduce their market-making activities, thereby making the market for
unseasoned stocks less liquid than they might be otherwise.
18
Risks
related to our Company.
Because
there is generally no established market in which to value our investments,
our
Valuation Committee’s value determinations may differ materially from the values
that a ready market or third party would attribute to these
investments.
There
is
generally no public market for the equity securities in which we invest.
Pursuant to the requirements of the 1940 Act, we value all of the private equity
securities in our portfolio at fair value as determined in good faith by a
committee of independent members of our Board of Directors, which we call the
Valuation Committee, pursuant to Valuation Procedures established by the Board
of Directors. As a result, determining fair value requires that judgment be
applied to the specific facts and circumstances of each portfolio investment
pursuant to specified valuation principles and processes. We are required by
the
1940 Act to value specifically each individual investment on a quarterly basis
and record unrealized depreciation for an investment that we believe has become
impaired. Conversely, we must record unrealized appreciation if we believe
that
our securities have appreciated in value. Our valuations, although stated as
a
precise number, are necessarily within a range of values that vary depending
on
the significance attributed to the various factors being
considered.
We
use
the Black-Scholes option pricing model to determine the fair value of warrants
held in our portfolio. Option pricing models, including the Black-Scholes model,
require the use of subjective input assumptions, including expected volatility,
expected life, expected dividend rate, and expected risk-free rate of return.
In
the Black-Scholes model, variations in the expected volatility or expected
term
assumptions have a significant impact on fair value. Because the securities
underlying the warrants in our portfolio are not publicly traded, many of the
required input assumptions are more difficult to estimate than they would be
if
a public market for the underlying securities existed.
Without
a
readily ascertainable market value and because of the inherent uncertainty
of
valuation, the fair value that we assign to our investments may differ from
the
values that would have been used had an efficient market existed for the
investments, and the difference could be material. Any changes in fair value
are
recorded in our consolidated statements of operations as a change in the "Net
(decrease) increase in unrealized appreciation on investments."
In
the
venture capital industry, even when a portfolio of early-stage, high-technology
venture capital investments proves to be profitable over the portfolio's
lifetime, it is common for the portfolio's value to undergo a so-called
"J-curve" valuation pattern. This means that when reflected on a graph, the
portfolio’s valuation would appear in the shape of the letter "J," declining
from the initial valuation prior to increasing in valuation. This J-curve
valuation pattern results from write-downs and write-offs of portfolio
investments that appear to be unsuccessful, prior to write-ups for portfolio
investments that prove to be successful. Because early-stage companies typically
have negative cash flow and are by their nature inherently fragile, a valuation
process can more readily substantiate a loss of value than an increase in value.
Even if our venture capital investments prove to be profitable in the long
run,
such J-curve valuation patterns could have a significant adverse effect on
our
net asset value per share and the value of our common stock in the interim.
Over
time, as we continue to make additional tiny technology investments, this
J-curve pattern may be less relevant for our portfolio as a whole, because
the
individual J-curves for each investment, or series of investments, may overlap
with previous investments at different stages of their J-curves.
19
Changes
in valuations of our privately held, early stage companies tend to be more
volatile than changes in prices of publicly traded
securities.
Investments
in privately held, early stage companies are inherently more volatile than
investments in more mature businesses. Such immature businesses are inherently
fragile and easily affected by both internal and external forces. Our investee
companies can lose much or all of their value suddenly in response to an
internal or external adverse event. Conversely, these immature businesses can
gain suddenly in value in response to an internal or external positive
development. Moreover, because our ownership interests in such investments
are
valued only at quarterly intervals by our Valuation Committee, a committee
made
up of all of our independent members of our Board of Directors, changes in
valuations from one valuation point to another tend to be larger than changes
in
valuations of marketable securities which are revalued in the marketplace much
more frequently, in some highly liquid cases, virtually
continuously.
We
expect to continue to experience material write-downs of securities of portfolio
companies.
Write-downs
of securities of our privately held companies have always been a by-product
and
risk of our business. We expect to continue to experience material write-downs
of securities of privately held portfolio companies. Write-downs of such
companies occur at all stages of their development. Such write-downs may
increase in dollar terms, frequency and as a percentage of our net asset value
as our dollar investment activity in privately held companies continues to
increase, and the number of such holdings in our portfolio continues to grow.
Because the average size of each of our investments in tiny technology has
increased from year to year and continues to increase, the average size of
our
write-downs will probably also increase.
Because
we do not choose investments based on a strategy of diversification, the value
of our business is subject to greater volatility than the value of companies
with more broadly diversified investments.
We
do not
choose investments based on a strategy of diversification. Therefore, we may
be
more vulnerable to events affecting a single sector or industry and therefore
subject to greater volatility than a company that follows a diversification
strategy. Accordingly, an investment in our common stock may present greater
risk to you than an investment in a diversified company.
20
We
are dependent upon key management personnel for future success, and may not
be
able to retain them.
We
are
dependent upon the diligence and skill of our senior management and other key
advisers for the selection, structuring, closing and monitoring of our
investments. We utilize lawyers, and we utilize outside consultants, including
one of our directors, Lori D. Pressman, to assist us in conducting due diligence
when evaluating potential investments. There is generally no publicly available
information about the companies in which we invest, and we rely significantly
on
the diligence of our employees and advisers to obtain information in connection
with our investment decisions. Our future success to a significant extent
depends on the continued service and coordination of our senior management
team,
and particularly on Charles E. Harris, our Chairman, Chief Executive Officer
and
a Managing Director, who will be subject to mandatory retirement pursuant to
the
Company's mandatory retirement policy for senior executives on December 31,
2008; on Douglas W. Jamison, our President, Chief Operating Officer and a
Managing Director, who has been designated by our Board of Directors as the
successor to Mr. Harris in his positions of Chairman and Chief Executive Officer
as of January 1, 2009 upon his retirement; on Daniel B. Wolfe, our Chief
Financial Officer and a Managing Director; on Alexei A. Andreev and Michael
A.
Janse, each an Executive Vice President and Managing Director; and on Sandra
M.
Forman, our General Counsel, Chief Compliance Officer and Director of Human
Resources. The departure of any of our executive officers, key employees or
advisers could materially adversely affect our ability to implement our business
strategy. We do not maintain for our benefit any key-man life insurance on
any
of our officers or employees.
We
will need to hire additional employees as the size of our portfolio
increases.
We
anticipate that it will be necessary for us to add investment professionals
with
expertise in venture capital and/or tiny technology and administrative and
support staff to accommodate the increasing size of our portfolio. We may need
to provide additional scientific, business, accounting, legal or investment
training for our hires. There is competition for highly qualified personnel.
We
may not be successful in our efforts to recruit and retain highly qualified
personnel because the expenses that we incur as a heavily regulated, publicly
held company preclude our paying as high a percentage of our total expenses
in
cash compensation for employees as the private partnerships with which we
compete. Although we have the advantage of offering equity incentive
compensation, unlike those private partnerships, we cannot permit co-investment
in our investments by our employees, and we cannot give our employees 20 percent
or higher carried interests in our investments as incentive compensation taxable
as long-term capital gains.
The
market for venture capital investments, including tiny technology investments,
is highly competitive.
We
face
substantial competition in our investing activities from many competitors,
including but not limited to: private venture capital funds; investment
affiliates of large industrial, technology, service and financial companies;
small business investment companies; hedge funds; wealthy individuals; and
foreign investors. Our most significant competitors typically have significantly
greater financial resources than we do. Greater financial resources are
particularly advantageous in securing lead investor roles in venture capital
syndicates. Lead investors typically negotiate the terms and conditions of
such
financings. Many sources of funding compete for a small number of attractive
investment opportunities. Hence, we face substantial competition in sourcing
good investment opportunities on terms of investment that are commercially
attractive.
21
In
addition to the difficulty of finding attractive investment opportunities,
our
status as a regulated business development company may hinder our ability to
participate in investment opportunities or to protect the value of existing
investments.
We
are
required to disclose on a quarterly basis the names and business descriptions
of
our portfolio companies and the type and value of our portfolio securities.
Most
of our competitors are not subject to these disclosure requirements. Our
obligation to disclose this information could hinder our ability to invest
in
some portfolio companies. Additionally, other current and future regulations
may
make us less attractive as a potential investor than a competitor not subject
to
the same regulations.
Our
failure to make follow-on investments in our portfolio companies could impair
the value of our portfolio.
Following
an initial investment in a portfolio company, we may make additional investments
in that portfolio company as "follow-on" investments, in order to: (1) increase
or maintain in whole or in part our ownership percentage; (2) exercise warrants,
options or convertible securities that were acquired in the original or
subsequent financing; or (3) attempt to preserve or enhance the value of our
investment.
We
may
elect not to make follow-on investments or lack sufficient funds to make such
investments. We have the discretion to make any follow-on investments, subject
to the availability of capital resources. The failure to make a follow-on
investment may, in some circumstances, jeopardize the continued viability of
a
portfolio company and our initial investment, or may result in a missed
opportunity for us to increase our participation in a successful operation,
or
may cause us to lose some or all preferred rights pursuant to "pay-to-play"
provisions that have become common in venture capital transactions. These
provisions require proportionate investment in subsequent rounds of financing
in
order to preserve preferred rights such as anti-dilution protection, liquidation
preferences and preemptive rights to invest in future rounds of financing.
Even
if we have sufficient capital to make a desired follow-on investment, we may
elect not to make a follow-on investment because we may not want to increase
our
concentration of risk, because we prefer other opportunities or because we
are
inhibited by compliance with business development company requirements or the
desire to maintain our tax status.
Bank
borrowing or the issuance of debt securities or preferred stock by us, to fund
investments in portfolio companies or to fund our operating expenses, would
make
our total return to common shareholders more volatile.
Use
of
debt or preferred stock as a source of capital entails two primary risks. The
first is the risk of leverage, which is the use of debt to increase the pool
of
capital available for investment purposes. The use of debt leverages our
available common equity capital, magnifying the impact on net asset value of
changes in the value of our investment portfolio. For example, a business
development company that uses 33 percent leverage (that is, $50 of leverage
per
$100 of common equity) will show a 1.5 percent increase or decline in net asset
value for each 1 percent increase or decline in the value of its total assets.
The second risk is that the cost of debt or preferred stock financing may exceed
the return on the assets the proceeds are used to acquire, thereby diminishing
rather than enhancing the return to common shareholders. If we issue preferred
shares or debt, the common shareholders would bear the cost of this leverage.
To
the extent that we utilize debt or preferred stock financing for any purpose,
these two risks would likely make our total return to common shareholders more
volatile. In addition, we might be required to sell investments, in order to
meet dividend, interest or principal payments, when it might be disadvantageous
for us to do so.
22
As
provided in the 1940 Act and subject to some exceptions, we can issue debt
or
preferred stock so long as our total assets immediately after the issuance,
less
some ordinary course liabilities, exceed 200 percent of the sum of the debt
and
any preferred stock outstanding. The debt or preferred stock may be convertible
in accordance with SEC guidelines, which might permit us to obtain leverage
at
more attractive rates. The requirement under the 1940 Act to pay, in full,
dividends on preferred shares or interest on debt before any dividends may
be
paid on our common stock means that dividends on our common stock from earnings
may be reduced or eliminated. An inability to pay dividends on our common stock
could conceivably result in our ceasing to qualify as a regulated investment
company, or RIC, under the Code, which would in most circumstances be materially
adverse to the holders of our common stock. As of the date hereof, we do not
have any debt or preferred stock outstanding.
We
are authorized to issue preferred stock, which would convey special rights
and
privileges to its owners senior to those of common stock
shareholders.
We
are
currently authorized to issue up to 2,000,000 shares of preferred stock, under
terms and conditions determined by our Board of Directors. These shares would
have a preference over our common stock with respect to dividends and
liquidation. The statutory class voting rights of any preferred shares we would
issue could make it more difficult for us to take some actions that might,
in
the future, be proposed by the Board and/or holders of common stock, such as
a
merger, exchange of securities, liquidation or alteration of the rights of
a
class of our securities, if these actions were perceived by the holders of
the
preferred shares as not in their best interests. The issuance of preferred
shares convertible into shares of common stock might also reduce the net income
and net asset value per share of our common stock upon conversion.
Loss
of status as a RIC would reduce our net asset value and distributable
income.
We
currently intend to qualify as a RIC for 2007 under the Code. As a RIC, we
do
not have to pay federal income taxes on our income (including realized gains)
that is distributed to our shareholders. Accordingly, we are not permitted
under
accounting rules to establish reserves for taxes on our unrealized capital
gains. If we failed to qualify for RIC status in 2007 or beyond, to the extent
that we had unrealized gains, we would have to establish reserves for taxes,
which would reduce our net asset value, accordingly. In addition, if we, as
a
RIC, were to decide to make a deemed distribution of net realized capital gains
and retain the net realized capital gains, we would have to establish
appropriate reserves for taxes that we would have to pay on behalf of
shareholders. It is possible that establishing reserves for taxes could have
a
material adverse effect on the value of our common stock.
23
We
operate in a heavily regulated environment, and changes to, or non-compliance
with, regulations and laws could harm our business.
We
are
subject to substantive SEC regulations as a business development company.
Securities and tax laws and regulations governing our activities may change
in
ways adverse to our and our shareholders’ interests, and interpretations of
these laws and regulations may change with unpredictable consequences. Any
change in the laws or regulations that govern our business could have an adverse
impact on us or on our operations. Changing laws, regulations and standards
relating to corporate governance, valuation and public disclosure, including
the
Sarbanes-Oxley Act of 2002, new SEC regulations, new federal accounting
standards and Nasdaq Global Market rules, are creating additional expense and
uncertainty for publicly held companies in general, and for business development
companies in particular. These new or changed laws, regulations and standards
are subject to varying interpretations in many cases because of their lack
of
specificity, and as a result, their application in practice may evolve over
time, which may well result in continuing uncertainty regarding compliance
matters and higher costs necessitated by ongoing revisions to disclosure and
governance practices.
We
are
committed to maintaining high standards of corporate governance and public
disclosure. As a result, our efforts to comply with evolving laws, regulations
and standards have and will continue to result in increased general and
administrative expenses and a diversion of management time and attention from
revenue-generating activities to compliance activities. In particular, our
efforts to comply with Section 404 of the Sarbanes-Oxley Act of 2002 and the
related regulations regarding our required assessment of our internal controls
over financial reporting and our external auditors' audit of that assessment
has
required the commitment of significant financial and managerial resources.
Moreover,
even though business development companies are not mutual funds, they must
comply with several of the regulations applicable to mutual funds, such as
the
requirement for the implementation of a comprehensive compliance program and
the
appointment of a Chief Compliance Officer. Further, our Board members, Chief
Executive Officer and Chief Financial Officer could face an increased risk
of
personal liability in connection with the performance of their duties. As a
result, we may have difficulty attracting and retaining qualified board members
and executive officers, which could harm our business, and we have significantly
increased both our coverage under, and the related expense for, directors'
and
officers' liability insurance. If our efforts to comply with new or changed
laws, regulations and standards differ from the activities intended by
regulatory or governing bodies, our reputation may be harmed. Also, as business
and financial practices continue to evolve, they may render the regulations
under which we operate less appropriate and more burdensome than they were
when
originally imposed. This increased regulatory burden is causing us to incur
significant additional expenses and is time consuming for our management, which
could have a material adverse effect on our financial performance.
24
Market
prices of our common stock will continue to be volatile.
We
expect
that the market price of our common stock price will continue to be volatile.
The price of the common stock may be higher or lower than the price you pay
for
your shares, depending on many factors, some of which are beyond our control
and
may not be directly related to our operating performance. These factors include
the following:
| • |
stock
market and capital markets
conditions;
|
| • |
internal
developments in our Company with respect to our personnel, financial
condition
and compliance with all applicable
regulations;
|
| • |
announcements
regarding any of our portfolio
companies;
|
| • |
announcements
regarding developments in the nanotechnology field in
general;
|
| • |
environmental
and health concerns regarding nanotechnology, whether real or perceptual;
|
| • |
announcements
regarding government funding and initiatives related to the development
of nanotechnology;
|
| • |
general
economic conditions and trends;
and/or
|
| • |
departures
of key personnel.
|
We
will
not have control over many of these factors, but expect that our stock price
may
be influenced by them. As a result, our stock price may be volatile, and you
may
lose all or part of your investment.
Quarterly
results fluctuate and are not indicative of future quarterly
performance.
Our
quarterly operating results fluctuate as a result of a number of factors. These
factors include, among others, variations in and the timing of the recognition
of realized and unrealized gains or losses, the degree to which we and our
portfolio companies encounter competition in our markets and general economic
and capital markets conditions. As a result of these factors, results for any
one quarter should not be relied upon as being indicative of performance in
future quarters.
To
the extent that we do not realize income or choose not to retain after-tax
realized capital gains, we will have a greater need for additional capital
to
fund our investments and operating expenses.
As
a RIC,
we must annually distribute at least 90 percent of our investment company
taxable income as a dividend and may either distribute or retain our realized
net capital gains from investments. As a result, these earnings may not be
available to fund investments. If we fail to generate net realized capital
gains
or to obtain funds from outside sources, it would have a material adverse effect
on our financial condition and results of operations as well as our ability
to
make follow-on and new investments. Because of the structure and objectives
of
our business, we generally expect to experience net operating losses and rely
on
proceeds from sales of investments, rather than on investment income, to defray
a significant portion of our operating expenses. These sales are unpredictable
and may not occur. In addition, as a business development company, we are
generally required to maintain a ratio of at least 200 percent of total assets
to total borrowings and preferred stock, which may restrict our ability to
borrow to fund these requirements. Lack of capital could curtail our investment
activities or impair our working capital.
25
Investment
in foreign securities could result in additional risks.
We
may
invest in foreign securities, and we currently have one investment in a foreign
security. When we invest in securities of foreign issuers, we may be subject
to
risks not usually associated with owning securities of U.S. issuers. These
risks
can include fluctuations in foreign currencies, foreign currency exchange
controls, social, political and economic instability, differences in securities
regulation and trading, expropriation or nationalization of assets and foreign
taxation issues. In addition, changes in government administrations or economic
or monetary policies in the United States or abroad could result in appreciation
or depreciation of our securities and could favorably or unfavorably affect
our
operations. It may also be more difficult to obtain and enforce a judgment
against a foreign issuer. Any foreign investments made by us must be made in
compliance with U.S. and foreign currency restrictions and tax laws restricting
the amounts and types of foreign investments.
Although
most of our investments are denominated in U.S. dollars, our investments that
are denominated in a foreign currency are subject to the risk that the value
of
a particular currency may change in relation to the U.S. dollar, in which
currency we maintain financial statements and valuations. Among the factors
that
may affect currency values are trade balances, the level of short-term interest
rates, differences in relative values of similar assets in different currencies,
long-term opportunities for investment and capital appreciation and political
developments.
Investing
in our stock is highly speculative and an investor could lose some or all of
the
amount invested.
Our
investment objective and strategies result in a high degree of risk in our
investments and may result in losses in the value of our investment portfolio.
Our investments in portfolio companies are highly speculative and, therefore,
an
investor in our common stock may lose his or her entire investment. The value
of
our common stock may decline and may be affected by numerous market conditions,
which could result in the loss of some or all of the amount invested in our
common stock. The securities markets frequently experience extreme price and
volume fluctuations that affect market prices for securities of companies in
general, and technology and very small capitalization companies in particular.
Because of our focus on the technology and very small capitalization sectors,
and because we are a very small capitalization company ourselves, our stock
price is especially likely to be affected by these market conditions. General
economic conditions, and general conditions in tiny technology in general and
nanotechnology in particular and in the semi-conductor and information
technology, life sciences, materials science and other high technology
industries, may also affect the price of our common stock.
26
Our
shares might trade at discounts from net asset value or at premiums that are
unsustainable over the long term.
Shares
of
business development companies like us may, during some periods, trade at prices
higher than their net asset value and during other periods, as frequently occurs
with closed-end investment companies, trade at prices lower than their net
asset
value. The possibility that our shares will trade at discounts from net asset
value or at premiums that are unsustainable over the long term are risks
separate and distinct from the risk that our net asset value per share will
decrease. The risk of purchasing shares of a business development company that
might trade at a discount or unsustainable premium is more pronounced for
investors who wish to sell their shares in a relatively short period of time
because, for those investors, realization of a gain or loss on their investments
is likely to be more dependent upon changes in premium or discount levels than
upon increases or decreases in net asset value per share. Our common stock
may
not trade at a price higher than or equal to net asset value per share. On
December 31, 2007, our stock closed at $8.79 per share, a premium of $2.86
over
our net asset value per share of $5.93 as of December 31, 2007.
The
Board of Directors intends to grant stock options to our employees pursuant
to
the Company's Equity Incentive Plan. When exercised, these options may have
a
dilutive effect on existing shareholders.
In
accordance with the Company’s Equity Incentive Plan, the Company’s Compensation
Committee may grant options from time to time for up to 20 percent of the total
shares of stock issued and outstanding. When options are exercised, net asset
value per share will decrease if the net asset value per share at the time
of
exercise is higher than the exercise price. Alternatively, net asset value
per
share will increase if the net asset value per share at the time of exercise
is
lower than the exercise price. Therefore, existing shareholders will be diluted
if the net asset value per share at the time of exercise is higher than the
exercise price of the options. Even though issuance of shares pursuant to
exercises of options increases the Company's capital, and regardless of whether
such issuance results in increases or decreases in net asset value per share,
such issuance results in existing shareholders owning a smaller percentage
of
the shares outstanding.
You
have no right to require us to repurchase your shares.
You
do
not have the right to require us to repurchase your shares of common
stock.
Item
1B. Unresolved Staff Comments.
None.
27
Item
2. Properties.
The
Company maintains its offices at 111 West 57th
Street,
New York, New York 10019, where it leases approximately 3,540 square feet of
office space pursuant to lease agreements expiring in 2010. (See "Note 9 of
Notes to Consolidated Financial Statements" contained in "Item 8. Consolidated
Financial Statements and Supplementary Data.")
Item
3. Legal Proceedings.
The
Company is not a party to any legal proceedings.
Item
4. Submission of Matters to a Vote of Security
Holders.
None.
28
PART
II
| Item 5. |
Market
for Registrant's Common Equity, Related Stockholder Matters and
Issuer Purchases of Equity
Securities.
|
Market
Information
Our
common stock is traded on the Nasdaq Global Market under the symbol "TINY."
The
following table sets forth the range of the high and low sales price of the
Company's shares during each quarter of the last two fiscal years, as reported
by Nasdaq Global Market. The quarterly stock prices quoted represent interdealer
quotations and do not include markups, markdowns or commissions.
|
2007
Quarter Ending
|
Low
|
|
High
|
|
|||
|
March
31
|
$
|
11.00
|
$
|
13.58
|
|||
|
June
30
|
$
|
11.01
|
$
|
14.32
|
|||
|
September
30
|
$
|
9.51
|
$
|
11.79
|
|||
|
December
31
|
$
|
8.00
|
$
|
11.10
|
|||
|
2006
Quarter Ending
|
|
Low
|
High
|
||||
|
March
31
|
$
|
12.75
|
$
|
16.10
|
|||
|
June
30
|
$
|
9.57
|
$
|
14.26
|
|||
|
September
30
|
$
|
9.38
|
$
|
12.99
|
|||
|
December
31
|
$
|
11.80
|
$
|
15.16
|
|||
Shareholders
As
of
March 12, 2008, there were approximately 134 holders of record of the Company's
common stock which, the Company has been informed, hold the Company's common
stock for approximately 20,971 beneficial owners.
Dividends
We
did
not pay a cash dividend or declare a deemed dividend for 2007 or 2006. For
more
information about deemed dividends, please refer to the discussion under
“Subchapter M Status.”
29
Securities
Authorized for Issuance Under Equity Compensation Plans
|
EQUITY
COMPENSATION PLAN INFORMATION
As
of December 31, 2007
|
|
|
Number
of securities
to
be issued upon
exercise
of out-
standing
options,
warrants
and rights
|
Weighted-average
exercise
price of
outstanding
options,
warrants
and rights
|
Number
of securities
remaining available for
future
issuance under
equity
compensation
plans
(excluding
securities
reflected in
Column
(a))
|
|||||||
|
Plan
category
|
(a)
|
|
(b)
|
|
(c)
|
|
||||
|
Equity
compensation plans approved by security holders
|
3,967,744
|
$
|
10.54
|
(1)
|
|
|||||
|
Equity
compensation plans not approved by security holders
|
||||||||||
|
TOTAL
|
3,967,744
|
$
|
10.54
|
(1)
|
|
|||||
(1) A
maximum
of twenty percent (20%) of our total shares of our common stock issued and
outstanding, calculated on a fully diluted basis, will be available for awards
under the plan, subject to adjustment as described below. Shares issued under
the plan may be authorized but unissued shares or treasury shares. If any shares
subject to an award granted under the plan are forfeited, cancelled, exchanged
or surrendered, or if an award terminates or expires without a distribution
of
shares, or if shares of stock are surrendered or withheld as payment of either
the exercise price of an award and/or withholding taxes in respect of an award,
those shares will again be available for awards under the plan.
Recent
Sales of Unregistered Securities
The
Company did not sell any equity securities during 2007 that were not registered
under the Securities Act of 1933.
Performance
Graph
The
graph
below matches the cumulative five-year total return of holders of the Company's
common stock with the cumulative total returns of the Nasdaq Composite index
and
the Nasdaq Financial index. The graph assumes that the value of the investment
in the Company's common stock and in each of the indexes (including reinvestment
of dividends) was $100 on December 31, 2002 and tracks it through December
31,
2007.
30
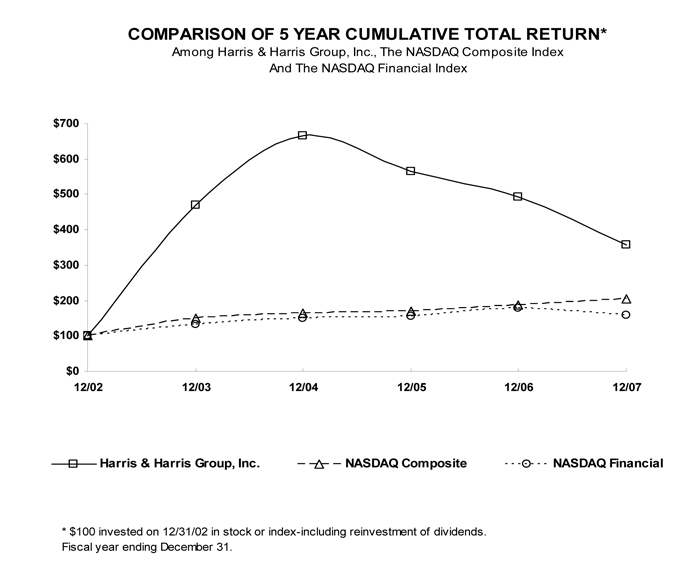
|
|
12/02
|
12/03
|
12/04
|
12/05
|
12/06
|
12/07
|
|||||||||||||
|
Harris
& Harris Group, Inc.
|
100.00
|
468.70
|
665.85
|
565.04
|
491.46
|
357.32
|
|||||||||||||
|
NASDAQ
Composite
|
100.00
|
149.75
|
164.64
|
168.60
|
187.83
|
205.22
|
|||||||||||||
|
NASDAQ
Financial
|
100.00
|
133.86
|
149.89
|
156.52
|
178.54
|
157.20
|
|||||||||||||
The
stock price performance included in this graph is not necessarily indicative
of
future stock price performance.
Source:
Research Data Group, Inc.
Stock
Transfer Agent
American
Stock Transfer & Trust Company, 59 Maiden Lane, New York, New York 10038
(Telephone 800-937-5449, Attention: Mr. Joe Wolf) serves as transfer agent
for
our common stock. Certificates to be transferred should be mailed directly
to
the transfer agent, preferably by registered mail.
31
Item
6. Selected
Financial Data.
The
information below was derived from the audited Consolidated Financial Statements
included in this report and in previous annual reports filed with the SEC.
This
information should be read in conjunction with those Consolidated Financial
Statements and Supplementary Data and the notes thereto. These historical
results are not necessarily indicative of the results to be expected in the
future.
Financial
Position as of December 31:
|
2007
|
2006
|
2005
|
2004
|
2003
|
||||||||||||
|
Total
assets
|
$
|
142,893,332
|
$
|
118,328,590
|
$
|
132,938,120
|
$
|
79,361,451
|
$
|
44,115,128
|
||||||
|
Total
liabilities
|
$
|
4,529,988
|
$
|
4,398,287
|
$
|
14,950,378
|
$
|
4,616,652
|
$
|
3,432,390
|
||||||
|
Net
assets
|
$
|
138,363,344
|
$
|
113,930,303
|
$
|
117,987,742
|
$
|
74,744,799
|
$
|
40,682,738
|
||||||
|
Net
asset value per outstanding share
|
$
|
5.93
|
$
|
5.42
|
$
|
5.68
|
$
|
4.33
|
$
|
2.95
|
||||||
|
Cash
dividends paid
|
$
|
0.00
|
$
|
0.00
|
$
|
0.00
|
$
|
0.00
|
$
|
0.00
|
||||||
|
Cash
dividends paid per outstanding share
|
$
|
0.00
|
$
|
0.00
|
$
|
0.00
|
$
|
0.00
|
$
|
0.00
|
||||||
|
Shares
outstanding, end of year
|
23,314,573
|
21,015,017
|
20,756,345
|
17,248,845
|
13,798,845
|
|||||||||||
Operating
Data for Year Ended December 31:
|
2007
|
2006
|
2005
|
2004
|
2003
|
||||||||||||
|
Total
investment income
|
$
|
2,705,636
|
$
|
3,028,761
|
$
|
1,540,862
|
$
|
637,562
|
$
|
167,785
|
||||||
|
Total
expenses1
|
$
|
14,533,179
|
$
|
10,641,696
|
$
|
7,006,623
|
$
|
4,046,341
|
$
|
2,731,527
|
||||||
|
Net
operating (loss) income
|
$
|
(11,827,543
|
)
|
$
|
(7,612,935
|
)
|
$
|
(5,465,761
|
)
|
$
|
(3,408,779
|
)
|
$
|
(2,563,742
|
) | |
|
Total
tax (benefit) expense2
|
$
|
87,975
|
$
|
(227,355
|
)
|
$
|
8,288,778
|
$
|
650,617
|
$
|
13,761
|
|||||
|
Net
realized income (loss) from investments
|
$
|
30,162
|
$
|
258,693
|
$
|
14,208,789
|
$
|
858,503
|
$
|
(984,925
|
)
|
|||||
|
Net
decrease (increase) in unrealized depreciation on
investments
|
$
|
5,080,936
|
$
|
(4,418,870
|
)
|
$
|
(2,026,652
|
)
|
$
|
484,162
|
$
|
343,397
|
||||
|
Net
(decrease) increase in net assets resulting from
operations
|
$
|
(6,716,445
|
)
|
$
|
(11,773,112
|
)
|
$
|
6,716,376
|
$
|
(2,066,114
|
)
|
$
|
(3,205,270
|
)
|
||
|
(Decrease)
increase in net assets resulting from operations per average
outstanding
share
|
$
|
(0.30
|
)
|
$
|
(0.57
|
)
|
$
|
0.36
|
$
|
(0.13
|
)
|
$
|
(0.28
|
)
|
||
1
Included
in total expenses is non-cash, stock-based, compensation expense of $8,050,807
in 2007 and $5,038,956 in 2006. Also included in total expenses are the
following profit-sharing expenses: $0 in 2007; $50,875 in 2006; $1,796,264
in
2005; and $311,594 in 2004. There was no stock-based compensation expense in
2005, 2004, or 2003.
2
Included
in total tax expense are the following taxes paid by the Company on behalf
of
shareholders: $0 in each of 2007 and 2006; $8,122,367 in 2005; $0 in each of
2004 and 2003.
32
| Item 7. |
Management's
Discussion and Analysis of Financial Condition and
Results of Operations.
|
The
information contained in this section should be read in conjunction with the
Company's 2007 Consolidated Financial Statements and notes thereto.
Forward-Looking
Statements
The
information contained herein may contain "forward-looking statements" based
on
our current expectations, assumptions and estimates about us and our industry.
These forward-looking statements involve risks and uncertainties. Words such
as
"believe," "anticipate," "estimate," "expect," "intend," "plan," "will," "may,"
"might," "could," "continue" and other similar expressions identify
forward-looking statements. In addition, any statements that refer to
expectations, projections or other characterizations of future events or
circumstances are forward-looking statements. Our actual results could differ
materially from those anticipated in the forward-looking statements as a result
of several factors more fully described in "Risk Factors" and elsewhere in
this
Form 10-K. The forward-looking statements made in this Form 10-K relate only
to
events as of the date on which the statements are made. We undertake no
obligation to update publicly any forward-looking statements for any reason,
even if new information becomes available or other events occur in the future.
Background
and Overview
We
incorporated under the laws of the state of New York in August 1981. In 1983,
we
completed an initial public offering and invested $406,936 in Otisville BioTech,
Inc., which also completed an initial public offering later that year. In 1984,
Charles E. Harris purchased a controlling interest in us which also made him
the
control person of Otisville. We then divested our other assets and became a
financial services company, with the investment in Otisville as the initial
focus of our business activity.
In
1992,
we registered as an investment company under the 1940 Act, commencing operations
as a closed-end, non-diversified investment company. In 1995, we elected to
become a business development company subject to the provisions of Sections
55
through 65 of the 1940 Act.
Throughout
our corporate history, we have made early stage venture capital investments
in a
variety of industries. We define venture capital investments as investments
in
start-up firms and small businesses with exceptional growth potential. We have
invested a substantial portion of our assets in venture capital investments
of
private, development stage or start-up companies. These private businesses
tend
to be thinly capitalized, unproven, small companies that lack management depth,
have little or no history of operations and are developing unproven
technologies. At December 31, 2007, $78,110,384, or 56.5 percent, of our net
assets at fair value consisted of private venture capital investments, net
of
unrealized depreciation of $4,567,144. At December 31, 2006, $53,667,831, or
47.1 percent, of our net assets at fair value consisted of private venture
capital investments, net of unrealized depreciation of
$8,450,969.
33
Since
our
investment in Otisville in 1983 through December 31, 2007, we have made a total
of 80 venture capital investments, including four private placement investments
in securities of publicly traded companies. We have sold 45 of these 80
investments, realizing total proceeds of $143,737,906 on our invested capital
of
$51,229,202. As measured from first dollar in to last dollar out, the average
and median holding periods for these 45 investments were 3.69 years and 3.11
years, respectively. As measured by the 150 separate rounds of investment within
these 45 investments, the average and median holding periods for the 150
separate rounds of investment were 2.87 years and 2.49 years,
respectively.
In
1994,
we made our first tiny technology investment. From August 2001 through December
31, 2007, all 38 of our initial investments have been in tiny technology. From
August 2001 through December 31, 2007, we have invested a total (before any
subsequent write-ups, write-downs or dispositions) of $86,635,250 in tiny
technology.
We
currently have 30 active tiny technology companies in our portfolio, including
one tiny technology investment made prior to 2001. At December 31, 2007, from
first dollar in, the average and median holding periods for these 30 active
tiny
technology investments were 3.01 years and 2.82 years,
respectively.
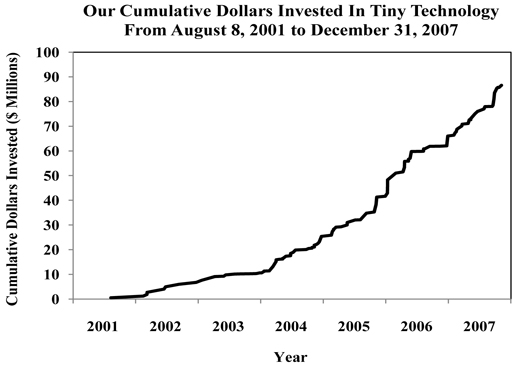
34
The
following is a summary of our initial and follow-on investments in tiny
technology from 2001 to the present. We consider a "round led" to be a round
where we were the new investor or the leader of a set of new investors in an
investee company. Typically, but not always, the lead investor negotiates the
price and terms of a deal with the investee company.
|
2001
|
2002
|
2003
|
2004
|
2005
|
2006
|
2007
|
||||||||||||||||
|
Total
Incremental Investments
|
$
|
489,999
|
$
|
6,240,118
|
$
|
3,812,600
|
$
|
14,837,846
|
$
|
16,251,339
|
$
|
24,408,187
|
$
|
20,595,161
|
||||||||
|
No.
of New Investments
|
1
|
7
|
5
|
8
|
4
|
6
|
7
|
|||||||||||||||
|
No.
of Follow-On Investment Rounds
|
0
|
1
|
5
|
21
|
13
|
14
|
20
|
|||||||||||||||
|
No.
of Rounds Led
|
0
|
1
|
0
|
2
|
0
|
7
|
3
|
|||||||||||||||
|
Average
Dollar Amount –
Initial
|
$
|
489,999
|
$
|
784,303
|
$
|
437,156
|
$
|
911,625
|
$
|
1,575,000
|
$
|
2,383,424
|
$
|
1,086,441
|
||||||||
|
Average
Dollar Amount – Follow- On
|
N/A
|
$
|
750,000
|
$
|
325,364
|
$
|
359,278
|
$
|
765,488
|
$
|
721,974
|
$
|
649,504
|
|||||||||
We
value
our private venture capital investments each quarter as determined in good
faith
by our Valuation Committee, a committee of independent directors, within
guidelines established by our Board of Directors in accordance with the 1940
Act. (See "Footnote to Consolidated Schedule of Investments" contained in "Item
8. Consolidated Financial Statements and Supplementary Data.")
In
the
years 2001 through 2007, the Company recorded the following gross write-ups
in
privately held securities as a percentage of net assets at the beginning of
the
year ("BOY"), gross write-downs in privately held securities as a percentage
of
net assets at the beginning of the year, and net write-ups/(write-downs) in
privately held securities as a percentage of net assets at the beginning of
the
year.
35
1
|
2001
|
2002
|
2003
|
2004
|
2005
|
2006
|
2007
|
||||||||||||||||
|
Net
Asset Value, BOY
|
$
|
31,833,475
|
$
|
24,334,770
|
$
|
27,256,046
|
$
|
40,682,738
|
$
|
74,744,799
|
$
|
117,987,742
|
$
|
113,930,303
|
||||||||
|
Gross
Write-Downs During Year
|
$
|
(2,532,730
|
)
|
$
|
(5,400,005
|
)
|
$
|
(1,256,102
|
)
|
$
|
(5,711,229
|
)
|
$
|
(3,450,236
|
)
|
$
|
(4,211,323
|
)
|
$
|
(7,810,794
|
)
|
|
|
Gross
Write-Ups During Year
|
$
|
1,528,866
|
$
|
285
|
$
|
847,578
|
$
|
6,288,397
|
$
|
23,485,176
|
$
|
279,363
|
$
|
11,694,618
|
||||||||
|
Gross
Write-Downs as a Percentage of Net Asset Value, BOY
|
-7.96
|
%
|
-22.19
|
%
|
-4.61
|
%
|
-14.04
|
%
|
-4.62
|
%
|
-3.57
|
%
|
-6.86
|
%
|
||||||||
|
Gross
Write-Ups as a Percentage of Net Asset Value, BOY
|
4.80
|
%
|
0
|
%
|
3.11
|
%
|
15.46
|
%
|
31.42
|
%
|
0.24
|
%
|
10.26
|
%
|
||||||||
|
Net
Write-Downs/Write-Ups as a Percentage of Net Asset Value,
BOY
|
-3.15
|
%
|
-22.19
|
%
|
-1.49
|
%
|
1.42
|
%
|
26.8
|
%
|
-3.33
|
%
|
3.40
|
%
|
||||||||
We
have
discretion in the investment of our capital. However, we invest primarily in
illiquid equity securities of private companies. Generally, these investments
take the form of preferred stock, are subject to restrictions on resale and
have
no established trading market. Our principal objective is to achieve long-term
capital appreciation. Therefore, a significant portion of our investment
portfolio provides little or no income in the form of dividends or interest.
We
earn interest income from fixed-income securities, including U.S. government
and
agency securities. The amount of interest income we earn varies with the average
balance of our fixed-income portfolio and the average yield on this portfolio.
Interest income is secondary to capital gains and losses in our results of
operations.
We
present the financial results of our operations utilizing accounting principles
generally accepted in the United States for investment companies. On this basis,
the principal measure of our financial performance during any period is the
net
increase/(decrease) in our net assets resulting from our operating activities,
which is the sum of the following three elements:
Net
Operating Income / (Loss)
- the
difference between our income from interest, dividends, and fees and our
operating expenses.
36
Net
Realized Income / (Loss) on Investments
- the
difference between the net proceeds of sales of portfolio securities and their
stated cost, plus income from interests in limited liability
companies.
Net
Increase / (Decrease) in Unrealized Appreciation or Depreciation on
Investments
- the
net unrealized change in the value of our investment portfolio.
Owing
to
the structure and objectives of our business, we generally expect to experience
net operating losses and seek to generate increases in our net assets from
operations through the long term appreciation of our venture capital
investments. We have relied, and continue to rely, on proceeds from sales of
investments, rather than on investment income, to defray a significant portion
of our operating expenses. Because such sales are unpredictable, we attempt
to
maintain adequate working capital to provide for fiscal periods when there
are
no such sales.
Results
of Operations
Years
Ended December 31, 2007, 2006, and 2005
During
the years ended December 31, 2007, 2006, and 2005, we had net (decreases)
increases in net assets resulting from operations of $(6,716,445),
$(11,773,112), and $6,716,376, respectively.
Investment
Income and Expenses:
During
the years ended December 31, 2007, 2006, and 2005, we had net operating losses
of $11,827,543, $7,612,935, and $5,465,761, respectively. The variation in
these
results is primarily owing to the changes in investment income and operating
expenses, including non-cash expense of $8,050,807 in 2007 and $5,038,956 in
2006 associated with the granting of stock options. During the years ended
December 31, 2007, 2006, and 2005, total investment income was $2,705,636,
$3,028,761, and $1,540,862, respectively. During the years ended December 31,
2007, 2006, and 2005, total operating expenses were $14,533,179, $10,641,696,
and $7,006,623, respectively.
During
2007, as compared with 2006, investment income decreased from $3,028,761 to
$2,705,636, reflecting a decrease in our average holdings of U.S. government
and
agency securities throughout the period. During the twelve months ended December
31, 2007, our average holdings of such securities were $62,184,565, as compared
with $69,506,136 at December 31, 2006.
37
Operating
expenses, including non-cash, stock-based compensation expenses, were
$14,533,179 and $10,641,696 for the twelve months ended December 31, 2007,
and
December 31, 2006, respectively. The increase in operating expenses for the
twelve months ended December 31, 2007, as compared to the twelve months ended
December 31, 2006, was primarily owing to increases in salaries, benefits and
stock-based compensation expenses and to increases in administration and
operations expense, professional fees and directors' fees and expenses.
Salaries, benefits and non-cash, stock-based compensation expense increased
by
$3,502,053, or 44.1 percent, through December 31, 2007, as compared to December
31, 2006, primarily as a result of an increase in non-cash expense of $3,011,851
through December 31, 2007, associated with the Harris & Harris Group, Inc.
2006 Equity Incentive Plan (the "Stock Plan"). While the non-cash, stock-based,
compensation expense
for the Stock Plan increased our operating expenses by $8,050,807, this increase
was offset by a corresponding increase to our additional paid-in capital,
resulting in no net impact to our net asset value. The non-cash, stock-based,
compensation expense and corresponding increase to our additional paid-in
capital may increase in future quarters. Salaries and benefits also increased
for the twelve months ended December 31, 2007, owing to an increase in our
headcount as compared with that of the same period in 2006. At December 31,
2007, we had 13 full-time employees, as compared with 10 full-time employees
and
one part-time employee at December 31, 2006. Administration and operations
expense increased by $182,573, or 14.6 percent, for the twelve months ended
December 31, 2007, as compared with the same period in 2006, owing to an
increase in Nasdaq Global Market fees related to the increase in our number
of
outstanding shares and increased office-related and travel expenses related
to
the increase in headcount. Professional fees increased by $165,083, or 22.4
percent, primarily as a result of an increase in legal fees, an increase in
audit fees and corporate consulting costs for the audit of our compliance
program. Directors' fees and expenses increased by $94,310, or 27.7 percent,
primarily as a result of additional meetings held in the period ended December
31, 2007, as compared with the period ended December 31, 2006, as well as an
increase in the monthly retainers paid to committee chairs and to the Lead
Independent Director.
During
2006, investment income increased, reflecting an increase in our average
holdings of U.S. government and agency securities, as our average holdings
increased from $50,620,881 at December 31, 2005, to $69,506,136 at December
31,
2006, and as a result of an increase in interest rates during the year. During
2005, investment income increased, reflecting an increase in our income on
U.S.
government and agency securities, as our holdings increased from $44,622,722
at
December 31, 2004 to $96,250,864 at December 31, 2005, and as a result of an
increase in interest rates during the year.
The
increase in operating expenses for the year ended December 31, 2006, was
primarily owing to increases in salaries, benefits and stock-based compensation
expense, and directors' fees and expenses, offset by decreases in administrative
and operations expenses, profit-sharing expense and professional fees. Salaries,
benefits and stock-based compensation expense increased by $5,474,243, or 222.6
percent, for the year ended December 31, 2006, as compared with December 31,
2005, primarily as a result of non-cash expense of $5,038,956 associated with
the Stock Plan adopted during the second quarter of 2006 and secondarily as
a
result of an increase in the number of full-time employees. The increase in
salaries, benefits and stock-based compensation expense reflects expenses
associated with ten full-time employees and one part-time employee during the
year ended December 31, 2006, as compared with an average of nine full-time
employees during the year ended December 31, 2005. Salaries, benefits and
stock-based compensation include $5,038,956 of non-cash expense associated
with
the Stock Plan, versus no such charge in 2005. Directors' fees and expenses
increased by $31,876, or 10.3 percent, as a result of additional meetings held
in 2006 related to the adoption of the Stock Plan. Administrative and operations
expense decreased by $69,274, or 5.3 percent, primarily as a result of a
decrease in our directors' and officers' liability insurance expense and
decreases in the cost of proxy-related expenses. Profit-sharing expense for
the
year ended December 31, 2006, was $50,875, as compared with $1,796,264 for
December 31, 2005, owing to the termination of the profit-sharing plan effective
May 4, 2006. We recorded $50,875 of profit-sharing expense toward the remainder
of the 2005 profit-sharing payment in the year ended December 31, 2006, because
of updated estimates of our ultimate tax liability for 2005. Professional fees
decreased by $92,234, or 11.1 percent, for the year ended December 31, 2006,
as
compared with December 31, 2005.
Professional fees were lower for the year ended December 31, 2006, as compared
with December 31, 2005, primarily as a result of the elimination of consulting
costs incurred for a temporary Senior Controller in 2005 and the reduction
of
some of our Sarbanes-Oxley-related compliance costs incurred in
2005.
38
The
increase in operating expenses during 2005 was primarily owing to increases
in
the profit-sharing provision, salaries and benefits, professional fees,
administration and operations, rent expense and Directors' fees and expenses.
Profit-sharing expense for 2005 was $1,796,264, an increase of $1,484,670 as
compared with 2004. Profit-sharing expense increased primarily as a result
of
the gains realized on the sale of NeuroMetrix, Inc., offset by the taxes payable
by the Company on the deemed dividend and taxes payable on Built-In Gains.
The
profit-sharing expense was also impacted by the Company's decision to retain
its
net realized long-term capital gains for reinvestment for growth, rather than
distribute them as a cash dividend. When the Company chooses to retain its
net
realized long-term capital gains, it declares a deemed dividend and pays taxes
on behalf of shareholders. Conversely, when the Company distributes its net
realized long-term capital gains as a cash dividend, the shareholders pay all
of
the taxes. The taxes payable by the Company on behalf of shareholders reduce
the
amount of profit against which the profit-sharing payable to employees is
calculated. Had the Company chosen to distribute its net realized long-term
capital gains as a cash dividend, the provision for employee profit sharing
would have been $3,420,737 for 2005, rather than the actual provision for
employee profit sharing of $1,796,264 for 2005.
For
the
year ended December 31, 2005, as compared with 2004, salaries and benefits
increased by $530,945, or 27.5 percent, primarily as a result of the addition
of
three employees. Professional fees increased by $162,751, or 24.4 percent,
reflecting in part the expenses associated with ongoing compliance with the
Sarbanes-Oxley Act of 2002. Administration and operations increased by $600,824,
or 83.6 percent, primarily as the result of increases in travel expenses
associated with additional investments in portfolio companies, increases in
expenses related to the preparation and distribution of the annual and quarterly
reports and proxy statement owing to the increased number of shareholders,
and
an increase in the premium expense for director and officer liability insurance.
The premium expense for director and officer liability insurance increased
by
$339,810 to $512,038 in 2005, and the premium expense for 2006 is estimated
to
be $514,650. Rent expense increased by $60,148 or 39.7 percent, owing primarily
to the leasing of additional office space in California and New York. Directors'
fees and expenses in 2005 increased by $99,664 or 47.6 percent as a result
of an
increase in the fees paid to the directors for monthly retainer and meeting
attendance.
Realized
Income and Losses on
Investments:
During
the years ended December 31, 2007, 2006, and 2005, we had net realized income
from investments of $30,162, $258,693, and $14,208,789, respectively. The
variation in these results is primarily owing to variations in gross realized
income from investments and income taxes in each of the three years. For the
years ended December 31, 2007, 2006, and 2005, realized income from investments,
before taxes, was $118,137, $31,338, and $23,862,037, respectively. Income
tax
expense (benefit) for the years ended December 31, 2007, 2006, and 2005 was
$87,975, $(227,355), and $9,653,248, respectively.
During
the year ended December 31, 2007, we realized net gains of $118,137, consisting
primarily of proceeds received from the sale of our interest in AlphaSimplex
Group, LLC, and income from our investment in Exponential Business Development
Company. During the year ended December 31, 2007, we recognized tax expense
of
$87,975, consisting of $74,454 of interest and penalties related to our 2005
tax
returns and $13,521 in current year expense.
39
During
the year ended December 31, 2006, we realized net gains of $31,338, consisting
primarily of proceeds received from the liquidation of Optiva, Inc., proceeds
received from Exponential Business Development Company, and net losses realized
on our investment in AlphaSimplex Group, LLC. During 2005, we deemed the
securities we held in Optiva, Inc., worthless and recorded the proceeds received
and due to us on the liquidation of our bridge notes, realizing a loss of
$1,619,245. At December 31, 2005, we recorded a $75,000 receivable for estimated
proceeds from the final payment on the Optiva, Inc., bridge notes. During the
first quarter of 2006, we received payment of $95,688 from these bridge notes,
resulting in the realized gain of $20,688 on Optiva, Inc. During the year ended
December 31, 2006, we realized tax benefits of $227, 355 for 2005 taxes that
had
been refunded.
During
the year ended December 31, 2005, our realized income from investments before
taxes of $23,862,037 consisted primarily of a realized gain of $30,179,762
from
the sale of our investment in NeuroMetrix, Inc., offset by realized losses
of
$1,358,286, $2,093,968, $1,091,209, and $1,619,245, from the sale of our shares
in Agile Materials & Technologies, Inc., Experion Systems, Inc.,
Nanotechnologies, Inc., and Optiva, Inc., respectively. Realized losses on
U.S.
government and agency securities totaled $422,383 for 2005. For the year ended
December 31, 2005, our income tax expense on realized gains was $9,653,248,
which includes $8,122,367 of taxes payable by the Company on behalf of
shareholders in connection with the deemed dividend and $1,364,470 of taxes
on
Built-In Gains.
Net
Unrealized
Appreciation and Depreciation on Investments:
During
the year ended December 31, 2007, net unrealized depreciation on total
investments decreased by $5,080,936.
During
the years ended December 31, 2006, and 2005, net unrealized depreciation on
total investments increased by $4,418,870 and $2,026,652,
respectively.
During
the year ended December 31, 2007, net unrealized depreciation on our venture
capital investments decreased by $3,883,825, or 46.0 percent, from $8,450,969
to
$4,567,144, owing primarily to increases in the valuations of our investments
in
BridgeLux, Inc., of $3,699,529, Crystal IS, Inc., of $13,819, CSwitch, Inc.,
of
$48,935, D-Wave Systems, Inc., of $202,408, Exponential Business Development
Company of $2,026, Innovalight, Inc., of $3,218,216, Kovio, Inc., of $125,000,
Mersana Therapeutics, Inc., of $118,378, NanoGram Corporation of $2,437,136,
NeoPhotonics Corporation of $2,160, SiOnyx, Inc., of $899,566, Solazyme, Inc.,
of $612,291 and Zia Laser, Inc., of $6,329, offset by decreases in the
valuations of our investments in Ancora Pharmaceuticals, Inc., of $100,561,
Chlorogen, Inc., of $1,326,073, Evolved Nanomaterial Sciences, Inc., of
$2,800,000, Kereos, Inc., of $1,340,257, Nanomix, Inc., of $459,772, NanoOpto
Corporation of $1,369,885, Polatis, Inc., of $9,534 and Questech Corporation
of
$404,712. We also had an increase
owing to foreign currency translation of $307,636 on our investment in D-Wave
Systems, Inc. Unrealized depreciation on our U.S. government and agency
securities portfolio decreased from $556,451 at December 31, 2006, to unrealized
appreciation of $640,660 at December 31, 2007.
40
The
net
increase in unrealized depreciation on our venture capital investments in 2006
was owing primarily to decreases in the valuations of our investments in
Nanomix, Inc., of $1,710,000, NanoOpto Corporation of $1,211,259, NeoPhotonics
Corporation of $254,238, Polatis, Inc., of $145,228, SiOnyx, Inc., of $679,950
and Zia Laser, Inc., of $172,500, and to increases in the valuations of our
investments in Crystal IS of $19,735 and Questech Corporation of $259,628.
We
also had a decrease, owing to foreign currency translation, of $34,103 on our
investment in D-Wave Systems, Inc. Unrealized depreciation on our U.S.
government and agency securities portfolio increased from $69,541 at December
31, 2005, to $556,451 at December 31, 2006.
The
net
increase in unrealized depreciation on our venture capital investments in 2005
was the result of the appreciation in value of $19,790,298 on investments held,
offset by depreciation of $23,181,420 related to investments sold. The change
in
unrealized depreciation on investments held was owing to appreciation in our
investment in NeuroMetrix, Inc., prior to the sale of our interest in it as
well
as to increases in the valuations of NanoGram Corporation, Nanosys, Inc., and
Nantero, Inc., of $313,534, $870,113 and $813,771, respectively. These increases
were offset by decreases in the valuations of AlphaSimplex Group LLC, CSwitch,
Inc., Mersana Therapeutics, Inc., NanoOpto, Inc., Polatis, Inc., and Zia Laser,
Inc., of $109,464, $500,000, $563,097, $529,997, $169,827, and $1,312,500
respectively. The change in unrealized depreciation on investments sold is
owing
to the realization of the gain on our investment in NeuroMetrix, Inc., offset
by
realizations of losses on our investments in Agile Materials and Technologies,
Inc., Experion Systems, Inc., Nanotechnologies, Inc., and Optiva, Inc.
Financial
Condition
December
31, 2007
At
December 31, 2007, our total assets and net assets were $142,893,332 and
$138,363,344, respectively. Our net asset value ("NAV") per share at that date
was $5.93, and our shares outstanding increased to 23,314,573 at December 31,
2007.
During
the twelve months ended December 31, 2007, significant developments included
an
increase in the value of our venture capital investments of $24,442,553 and
an
increase in the value of our investment in U.S. government and agency
obligations of $1,537,446. The increase in the value of our venture capital
investments, from $53,667,831 at December 31, 2006, to $78,110,384 at December
31, 2007, resulted primarily from seven new and 20 follow-on investments and
by
a net increase of $3,883,825 in the net value of our venture capital
investments. The increase in the value of our U.S. government and agency
obligations, from $58,656,147 at December 31, 2006, to $60,193,593 at December
31, 2007, is primarily owing to the use of net proceeds of $12,993,168 received
through a registered stock offering and proceeds received from stock option
exercises of $10,105,511, offset by a payment of $80,236 for federal tax
and interest and penalties, profit sharing payments
of $261,661, net operating expenses and by new and follow-on venture capital
investments totaling $20,595,161.
41
For
the
year ended December 31, 2007, the Company issued 999,556 shares and received
proceeds of $10,105,511 as a result of employee stock option
exercises.
The
following table is a summary of additions to our portfolio of venture capital
investments made during the twelve months ended December 31, 2007:
|
New
Investments
|
Cost
|
|||
|
Adesto
Technologies Corporation
|
$
|
1,147,826
|
||
|
Ancora
Pharmaceuticals, Inc.
|
$
|
800,000
|
||
|
BioVex
Group, Inc.
|
$
|
2,500,000
|
||
|
Ensemble
Discovery Corporation
|
$
|
2,000,000
|
||
|
Lifco,
Inc.
|
$
|
946,528
|
||
|
Phoenix
Molecular Corporation
|
$
|
50,010
|
||
|
Siluria
Technologies, Inc.
|
$
|
160,723
|
||
|
Follow-on
Investments
|
||||
|
BridgeLux,
Inc.
|
$
|
350,877
|
||
|
BridgeLux,
Inc.
|
$
|
233,918
|
||
|
BridgeLux,
Inc.
|
$
|
916,928
|
||
|
Cambrios
Technologies Corporation
|
$
|
1,300,000
|
||
|
Chlorogen,
Inc.
|
$
|
7,042
|
||
|
CSwitch,
Inc.
|
$
|
32,624
|
||
|
CSwitch,
Inc.
|
$
|
529,852
|
||
|
Innovalight,
Inc.
|
$
|
1,993,568
|
||
|
Kereos,
Inc.
|
$
|
540,000
|
||
|
Kovio,
Inc.
|
$
|
1,000,000
|
||
|
NanoGram
Corporation
|
$
|
851,393
|
||
|
Mersana
Therapeutics, Inc.
|
$
|
500,000
|
||
|
Nanomix,
Inc.
|
$
|
680,240
|
||
|
NanoOpto
Corporation
|
$
|
268,654
|
||
|
Nextreme
Thermal Solutions, Inc.
|
$
|
750,000
|
||
|
Polatis,
Inc.
|
$
|
17,942
|
||
|
Polatis,
Inc.
|
$
|
13,454
|
||
|
Polatis,
Inc.
|
$
|
58,582
|
||
|
SiOnyx,
Inc.
|
$
|
2,445,000
|
||
|
Solazyme,
Inc.
|
$
|
500,000
|
||
|
Total
|
$
|
20,595,161
|
The
following tables summarize the fair values of our portfolios of venture capital
investments and U.S. government and agency obligations, as compared with their
cost, at December 31, 2007, and December 31, 2006:
42
|
December
31,
|
|||||||
|
2007
|
2006
|
||||||
|
Venture
capital investments, at cost
|
$
|
82,677,528
|
$
|
62,118,800
|
|||
|
Net
unrealized depreciation (1)
|
4,567,144
|
8,450,969
|
|||||
|
Venture
capital investments, at value
|
$
|
78,110,384
|
$
|
53,667,831
|
|||
|
December
31,
|
|||||||
|
2007
|
2006
|
||||||
|
U.S.
government and agency obligations, at cost
|
$
|
59,552,933
|
$
|
59,212,598
|
|||
|
Net
unrealized appreciation (depreciation) (1)
|
640,660
|
(556,451
|
)
|
||||
|
U.S.
government and agency obligations, at value
|
$
|
60,193,593
|
$
|
58,656,147
|
|||
(1)At
December 31, 2007, and December 31, 2006, the net accumulated unrealized
depreciation on investments was $3,926,484 and $9,007,420,
respectively.
The
following table summarizes the fair value composition of our venture capital
investment portfolio at December 31, 2007, and December 31, 2006.
|
December
31,
|
|||||||
|
Category
|
2007
|
2006
|
|||||
|
Tiny
Technology
|
99.9
|
%
|
99.9
|
%
|
|||
|
Other
Venture Capital Investments
|
0.1
|
%
|
0.1
|
%
|
|||
|
Total
Venture Capital Investments
|
100.0
|
%
|
100.0
|
%
|
|||
December
31, 2006
At
December 31, 2006, our total assets and net assets were $118,328,590 and
$113,930,303, respectively. Our NAV per share at that date was $5.42, and our
shares outstanding increased to 21,015,017 at December 31,
2006.
43
During
the twelve months ended December 31, 2006, significant developments included
an
increase in the value of our venture capital investments of $20,480,498 and
a
decrease in the value of our investment in U.S. government and agency securities
of $37,594,717. The increase in the value of our venture capital investments,
from $33,187,333 at December 31, 2005, to $53,667,831 at December 31,
2006, resulted
primarily from six new and 10 follow-on investments, partially offset by a
net
decrease of $3,927,689 in the net value of our previous venture capital
investments. The decrease in the value of our U.S. government and agency
securities, from $96,250,864 at December 31, 2005, to $58,656,147 at December
31, 2006, was primarily owing to the use of funds for investments totaling
$24,408,187, tax payments of $9,425,922, profit-sharing payments of $1,897,072,
an increase in unrealized losses of $486,910 and payment of net operating
expenses.
During
December 2006, the Company also issued stock and received proceeds upon the
exercise of employee stock options. Through December 31, 2006, the Company
issued 258,672 shares and received proceeds of $2,615,190 as a result of option
exercises.
The
Company's liabilities decreased from $14,950,378 at December 31, 2005, to
$4,398,287 at December 31, 2006, primarily owing to the payment of the tax
payable on behalf of shareholders of $8,122,367 in January 2006, the payment
of
$1,897,072 in profit sharing in March 2006 and the reversal of the accrual
for
federal and state taxes payable of $1,514,967 recorded at December 31, 2005.
The
following table is a summary of additions to our portfolio of venture capital
investments made during the twelve months ended December 31, 2006:
|
New
Investments
|
Cost
|
|||
|
D-Wave
Systems, Inc.
|
$
|
1,750,547
|
||
|
Evolved
Nanomaterial Sciences, Inc.
|
2,800,000
|
|||
|
Innovalight,
Inc.
|
2,500,000
|
|||
|
Metabolon,
Inc.
|
2,500,000
|
|||
|
SiOnyx,
Inc.
|
750,000
|
|||
|
Xradia,
Inc.
|
4,000,000
|
|||
|
Follow-on
Investments
|
||||
|
Chlorogen,
Inc.
|
$
|
221,438
|
||
|
Crystal
IS, Inc.
|
1,098,240
|
|||
|
CSwitch
Corporation
|
2,850,000
|
|||
|
NanoGram
Corporation
|
1,262,764
|
|||
|
NanoOpto
Corporation
|
433,138
|
|||
|
NeoPhotonics
Corporation
|
2,750,000
|
|||
|
Nextreme
|
500,000
|
|||
|
Polatis,
Inc.
|
89,310
|
|||
|
Questech
Corporation
|
12,750
|
|||
|
SiOnyx,
Inc.
|
890,000
|
|||
|
Total
|
$
|
24,408,187
|
44
Cash
Flow
Year
Ended December 31, 2007
Net
cash
used in operating activities for the year ended December 31, 2007, was
$4,142,572, primarily owing to the payment of operating expenses.
Cash
used
in investing activities for the year ended December 31, 2007, was $20,697,886,
primarily reflecting a net increase in our investment in U.S. government and
agency securities of $235,754 and investments in private placements of
$20,595,161, less proceeds from the sale of venture capital investments of
$174,669.
Cash
provided by financing activities for the year ended December 31, 2007, was
$23,098,679, reflecting
the issuance of shares in connection with the Stock Plan and the net proceeds
from the issuance of 1,300,000 new shares of our common stock on June 25, 2007,
in a registered direct follow-on offering.
Year
Ended December 31, 2006
Net
cash
used in operating activities for the year ended December 31, 2006, was
$14,955,302, primarily owing both to the payment of various federal, state
and
local taxes, including the tax paid on behalf of shareholders for the deemed
dividend, and to the payment of operating expenses.
Cash
provided by investing activities for the year ended December 31, 2006, was
$13,198,611, primarily reflecting net proceeds from the sale of U.S. government
and agency securities of $37,593,589, less investments in private placements
of
$24,408,187.
Cash
provided by financing activities for the year ended December 31, 2006, was
$2,615,190, reflecting
the issuance of shares in connection with the Stock Plan.
Year
Ended December 31, 2005
Net
cash
used in operating activities for the year ended December 31, 2005, was
$2,914,285, primarily owing to an increase in our operating
expenses.
Cash
used
in investing activities for the year ended December 31, 2005, was $33,049,325,
primarily reflecting a net increase in our investment in U.S. government and
agency securities of $52,144,482 and investments in private placements of
$16,251,339, less proceeds from the sale of venture capital investments of
$35,392,200.
Cash
provided by financing activities for the year ended December 31, 2005, was
$36,526,567, reflecting net proceeds from the issuance of 3,507,500 new shares
of our common stock on September 14, 2005, in an underwritten follow-on
offering.
45
Liquidity
and Capital Resources
Our
primary sources of liquidity are cash, receivables and freely marketable
securities, net of short-term indebtedness. Our secondary sources of liquidity
are restricted securities of companies that are publicly traded.
December
31, 2007
At
December 31, 2007, and December 31, 2006, our total net primary liquidity was
$61,183,136 and $61,323,306, respectively, and our secondary liquidity was
$0
and $0, respectively.
Our
net
primary sources of liquidity are more than adequate to cover our gross cash
operating expenses over the next 12 months. Our gross cash operating expenses
for 2007 and 2006 totaled $6,263,510 and $5,285,448, respectively.
The
increase in our primary liquidity from December 31, 2006, to December 31, 2007,
is primarily owing to the proceeds received through a registered direct stock
offering from a shelf registration statement and proceeds received from stock
option exercises, offset by the use of funds for investments and payment of
net
operating expenses. In the future, we may sell additional shares registered
pursuant to our shelf registration statement.
On
November 29, 2006, we filed a shelf registration statement with the SEC on
Form
N-2 to register 4,000,000 shares of our common stock. On December 11, 2006,
and
on April 23, 2007, we filed amended registration statements with the SEC. On
May
11, 2007, the SEC declared the registration statement effective. The common
stock may be sold at prices and on terms to be set forth in one or more
supplements to the prospectus from time to time.
On
June
25, 2007, we completed the sale of 1,300,000 shares of our common stock from
our
shelf registration statement for gross proceeds of $14,027,000; net proceeds
of
this offering, after placement agent fees and offering costs of $1,033,832,
were
$12,993,168. We intend to use, and have been using, the net proceeds of this
offering to make new investments in tiny technology, as well as for follow-on
investments in our existing venture capital investments and for working capital.
Through December 31, 2007, we have used $9,475,687 of the net proceeds from
this
offering for these purposes.
On
April
17, 2003, we signed a seven-year sublease for office space at 111 West
57th
Street
in New York City. On December 17, 2004, we signed a sublease for additional
office space at our current location. The subleases expire on April 29, 2010.
Total rent expense for our office space in New York City was $178,167 in 2007,
$174,625 in 2006 and $171,171 in 2005. Future minimum sublease payments in
each
of the following years are: 2008 -- $193,083; 2009 -- $197,700; and thereafter,
for the remaining term -- $65,969.
46
December
31, 2006
At
December 31, 2006, and December 31, 2005, our total net primary liquidity was
$61,323,306 and $97,797,219, respectively, and our secondary liquidity was
$0
and $0, respectively.
Our
net
primary sources of liquidity were more than adequate to cover our gross cash
operating expenses over the next 12 months. Our gross cash operating expenses
for 2006 and 2005 totaled $5,285,448 and $5,021,066, respectively.
The
decrease in our primary liquidity from December 31, 2005, to December 31, 2006,
was primarily owing to the use of funds for investments, profit-sharing and
tax
payments, as well as net operating expenses.
Critical
Accounting Policies
The
Company's significant accounting policies are described in Note 2 to the
Consolidated Financial Statements and in the Footnote to the Consolidated
Schedule of Investments. Critical accounting policies are those that are both
important to the presentation of our financial condition and results of
operations and those that require management’s most difficult, complex or
subjective judgments. The Company considers the following accounting policies
and related estimates to be critical:
Stock-Based
Compensation
Determining
the appropriate fair-value model and calculating the fair value of share-based
awards at the date of grant requires judgment. We use the Black-Scholes option
pricing model to estimate the fair value of employee stock options, consistent
with the provisions of SFAS No. 123(R). Management uses the Black-Scholes
option pricing model because of the lack of the historical option data that
is
required for use in other, more complex models. Other models may yield fair
values that are significantly different from those calculated by the
Black-Scholes option pricing model.
Option
pricing models, including the Black-Scholes model, require the use of subjective
input assumptions, including expected volatility, expected life, expected
dividend rate, and expected risk-free rate of return. In the Black-Scholes
model, variations in the expected volatility or expected term assumptions have
a
significant impact on fair value. As the volatility or expected term assumptions
increase, the fair value of the stock option increases. In the Black-Scholes
model, the expected dividend rate and expected risk-free rate of return are
not
as significant to the calculation of fair value. A higher assumed dividend
rate
yields a lower fair value, whereas higher assumed interest rates yield higher
fair values for stock options.
We
use
the simplified calculation of expected life described in the SEC’s Staff
Accounting Bulletin 107 because of the lack of historical information about
option exercise patterns. Future exercise behavior could be materially different
than that which is assumed by the model.
Expected
volatility is based on the historical fluctuations in the Company's stock.
The
Company's
stock has historically been volatile, which increases the fair
value.
47
SFAS
No. 123(R) requires us to develop an estimate of the number of share-based
awards that will be forfeited owing to employee turnover. Quarterly changes
in
the estimated forfeiture rate can have a significant effect on reported
share-based compensation, as the effect of adjusting the rate for all expense
amortization after the grant date is recognized in the period the forfeiture
estimate is changed. If the actual forfeiture rate proves to be higher than
the
estimated forfeiture rate, then an adjustment will be made to increase the
estimated forfeiture rate, which would result in a decrease to the expense
recognized in the financial statements. If the actual forfeiture rate proves
to
be lower than the estimated forfeiture rate, then an adjustment will be made
to
decrease the estimated forfeiture rate, which would result in an increase to
the
expense recognized in the financial statements. Such adjustments would affect
our operating expenses and additional paid-in capital, but would have no effect
on our net asset value.
Valuation
of Portfolio Investments
As
a
business development company, we invest in illiquid securities including debt
and equity securities of private companies. These investments are generally
subject to restrictions on resale and generally have no established trading
market. We value substantially all of our equity investments at fair value
as
determined in good faith by our Valuation Committee on a quarterly basis. The
Valuation Committee, comprised of all of our non-interested Board members,
reviews and approves the valuation of our investments within the valuation
procedures established by the Board of Directors. Fair value is generally
defined as the amount that an investment could be sold for in an orderly
disposition over a reasonable time. Generally, to increase objectivity in
valuing our assets, external measures of value, such as public markets or
third-party transactions, are utilized whenever possible. Valuation is not
based
on long-term work-out value, nor immediate liquidation value, nor incremental
value for potential changes that may take place in the future. Upon sale of
investments, the values that are ultimately realized may be different from
what
is presently estimated. This difference could be material.
Pension
and Post-Retirement Benefit Plan Assumptions
The
Company provides a Retiree Medical Benefit Plan for employees who meet certain
eligibility requirements. Several statistical and other factors that attempt
to
anticipate future events are used in calculating the expense and liability
values related to our post-retirement benefit plans. These factors include
assumptions we make about the discount rate, the rate of increase in healthcare
costs, and mortality, among others.
The
discount rate reflects the current rate at which the post-retirement benefit
liabilities could be effectively settled considering the timing of expected
payments for plan participants. In estimating this rate, we consider rates
of
return on high quality fixed-income investments included in published bond
indexes. We consider the Moody’s Aa Corporate Bond Index and the Citigroup
Pension Liability Index in the determination of the appropriate discount rate
assumptions. The weighted average rate we utilized to measure our post
retirement benefit obligation as of December 31, 2007, and to calculate our
2008 expense was 6.55 percent, which is an increase from the 5.75 percent rate
used in determining the 2007 expense.
48
Recent
Developments — Portfolio Companies
Two
of
our portfolio companies have been considering with their advisors the
possibility of filing for initial public offerings (IPOs) in 2008. There can
be
no assurance that either of them will file for an IPO in 2008, and a variety
of
factors, including stock market and general business conditions, could lead
either or both of them to terminate such considerations.
On
January 16, 2008, we made a $736,019 follow-on investment that has not yet
been
announced in a privately held tiny technology portfolio company.
On
January 31, 2008, we made a $377,580 follow-on investment that has not yet
been
announced in a privately held tiny technology portfolio company.
On
February 1, 2008, we made a $25,000 follow-on investment that has not yet been
announced in a privately held tiny technology portfolio company.
On
February 8, 2008, we made a $244,500 new investment in PolyRemedy,
Inc.
On
February 21, 2008, we made a $1,052,174 follow-on investment that has not yet
been announced in a privately held tiny technology portfolio
company.
On
February 25, 2008, we made a $1,000,001 follow-on investment that has not yet
been announced in a privately held tiny technology portfolio
company.
On
March
7, 2008, we made a $2,000,000 follow-on investment that has not yet been
announced in a privately held tiny technology portfolio company.
Item
7A. Quantitative
and Qualitative Disclosures About Market Risk.
Our
business activities contain elements of risk. We consider the principal types
of
market risk to be valuation risk and the risk associated with fluctuations
in
interest rates. Although we are risk-seeking rather than risk-averse in our
investments, we consider the management of risk to be essential to our business.
Value,
as
defined in Section 2(a)(41) of the 1940 Act, is (i) the market price for those
securities for which market quotations are readily available and (ii) fair
value
as determined in good faith by, or under the direction of, the Board of
Directors for all other assets. (See the "Valuation Procedures" in the "Footnote
to Consolidated Schedule of Investments" contained in "Item 8. Consolidated
Financial Statements and Supplementary Data.")
49
Neither
our investments nor an investment in us is intended to constitute a balanced
investment program.
We
have
invested a substantial portion of our assets in private development stage or
start-up companies. These private businesses tend to be based on new technology
and to be thinly capitalized, unproven, small companies that lack management
depth and have not attained profitability or have no history of operations.
Because of the speculative nature and the lack of a public market for these
investments, there is significantly greater risk of loss than is the case with
traditional investment securities. We expect that some of our venture capital
investments will be a complete loss or will be unprofitable and that some will
appear to be likely to become successful but never realize their potential.
Even
when our private equity investments complete initial public offerings (IPOs),
we
are normally subject to lock-up agreements for a period of time, and thereafter,
the market for the unseasoned publicly traded securities may be relatively
illiquid.
Because
there is typically no public market for our interests in the small privately
held companies in which we invest, the valuation of the equity interests in
that
portion of our portfolio is determined in good faith by our Valuation Committee,
comprised of the independent members of our Board of Directors, in accordance
with our Valuation Procedures. In the absence of a readily ascertainable market
value, the determined value of our portfolio of equity interests may differ
significantly from the values that would be placed on the portfolio if a ready
market for the equity interests existed. Any changes in valuation are recorded
in our consolidated statements of operations as "Net increase (decrease) in
unrealized appreciation on investments." Changes in valuation of any of our
investments in privately held companies from one period to another may be
volatile.
We
also
invest in short-term money market instruments, and both short and long-term
U.S.
government and agency securities. To the extent that we invest in short and
long-term U.S. government and agency securities, changes in interest rates
result in changes in the value of these obligations which result in an increase
or decrease of our net asset value. The level of interest rate risk exposure
at
any given point in time depends on the market environment, the expectations
of
future price and market movements, and the quantity and duration of both the
short and long-term U.S. government and agency securities held by the Company,
and it will vary from period to period. If the average interest rate on U.S.
government and agency securities at December 31, 2007, were to increase by
25,
75 and 150 basis points, the weighted average value of these securities held
by
us at December 31, 2007, would decrease by approximately $144,380, $433,139
and
$866,278, respectively, and our net asset value would decrease
correspondingly.
Most
of
our investments are denominated in U.S. dollars. We currently have one
investment denominated in Canadian dollars. We are exposed to foreign currency
risk related to potential changes in foreign currency exchange rates. The
potential loss in fair value on this investment resulting from a 10 percent
adverse change in quoted foreign currency exchange rates is $202,408 at December
31, 2007.
In
addition, in the future, we may from time to time opt to borrow money to make
investments. Our net investment income will be dependent upon the difference
between the rate at which we borrow funds and the rate at which we invest such
funds. As a result, there can be no assurance that a significant change in
market interest rates will not have a material adverse effect on our net
investment income in the event we choose to borrow funds for investing
purposes.
50
Item
8. Consolidated
Financial Statements and Supplementary Data.
HARRIS
& HARRIS GROUP, INC.
INDEX
TO CONSOLIDATED FINANCIAL STATEMENTS AND SCHEDULES
The
following reports and consolidated financial schedules of Harris & Harris
Group, Inc. are filed herewith and included in response to Item 8.
|
Documents
|
Page
|
|
|
52
|
||
|
Report
of Independent Registered Public Accounting Firm
|
53
|
|
|
Consolidated
Financial Statements
|
||
|
Consolidated
Statements of Assets and Liabilities as of December 31, 2007, and
2006
|
55
|
|
|
Consolidated
Statements of Operations for the years ended December 31, 2007,
2006,
2005
|
56
|
|
|
Consolidated
Statements of Cash Flows for the years ended December 31, 2007,
2006, and
2005
|
57
|
|
|
Consolidated
Statements of Changes in Net Assets for the years ended December
31, 2007,
2006, and 2005
|
58
|
|
|
|
||
|
Consolidated
Schedule of Investments as of December 31, 2007
|
59-69
|
|
|
Consolidated
Schedule of Investments as of December 31, 2006
|
70-77
|
|
|
Footnote
to Consolidated Schedule of Investments
|
78-82
|
|
|
Notes
to Consolidated Financial Statements
|
83-102
|
|
|
103
|
Schedules
other than those listed above have been omitted because they are not applicable
or the required information is presented in the consolidated financial
statements and/or related notes.
51
Management's
Report on Internal Control Over Financial Reporting
Management
of the Company is responsible for establishing and maintaining adequate internal
control over financial reporting. Internal control over financial reporting
is
defined in Rules 13a-15(f) and 15d-15(f) under the Securities Exchange Act
of
1934 as a process designed by, or under the supervision of, the Company's
principal executive and principal financial officers and effected by the
Company's Board of Directors, management and other personnel to provide
reasonable assurance regarding the reliability of financial reporting and the
preparation of financial statements for external purposes in accordance with
generally accepted accounting principles and includes those policies and
procedures that:
|
•
|
pertain
to the maintenance of records that in reasonable detail accurately
and
fairly reflect the transactions and dispositions of the assets of
the
Company;
|
|
•
|
provide
reasonable assurance that transactions are recorded as necessary
to permit
preparation of financial statements in accordance with generally
accepted
accounting principles, and that receipts and expenditures of the
company
are being made only in accordance with authorizations of management
and
directors of the Company; and
|
|
•
|
provide
reasonable assurance regarding prevention or timely detection of
unauthorized acquisition, use or disposition of the Company's assets
that
could have a material effect on the financial
statements.
|
Because
of its inherent limitations, internal control over financial reporting may
not
prevent or detect misstatements. Also, projections of any evaluation of
effectiveness of internal control over financial reporting to future periods
are
subject to the risk that controls may become inadequate because of changes
in
conditions, or that the degree of compliance with the policies or procedures
may
deteriorate.
Management
has assessed the effectiveness of our internal control over financial reporting
as of December 31, 2007. In making its assessment, management used the criteria
set forth by the Committee of Sponsoring Organizations of the Treadway
Commission (COSO) in Internal Control-Integrated Framework. Based on the results
of this assessment, management (including our Chief Executive Officer and Chief
Financial Officer) has concluded that, as of December 31, 2007, the Company's
internal control over financial reporting was effective.
The
effectiveness of the Company's internal control over financial reporting has
been audited by PricewaterhouseCoopers LLP, an independent registered public
accounting firm, as stated in their report which appears on page 53 of this
Annual Report on Form 10-K.
52
Report
of Independent Registered Public Accounting Firm
To
the
Board of Directors and Shareholders of Harris & Harris Group,
Inc.:
In
our
opinion, the accompanying consolidated statements of assets and liabilities
including the consolidated schedules of investments, and the related
consolidated
statements of operations, changes in net assets, cash flows, and
the financial highlights present
fairly, in all material respects, the financial position of Harris & Harris
Group, Inc. and its subsidiaries ("the Company") at
December 31, 2007 and December 31, 2006, and the results of their operations,
their cash flows, the changes in their net assets, and the financial
highlights for each of the three years in the period ended December 31, 2007,
in
conformity with accounting principles generally accepted in the United States
of
America. Also
in
our opinion, the Company maintained, in all material respects, effective
internal control over financial reporting as of December 31, 2007, based on
criteria established in Internal
Control - Integrated Framework
issued
by the Committee of Sponsoring Organizations of the Treadway Commission (COSO).
The
Company's management is responsible for these financial statements, for
maintaining effective internal control over financial reporting and for its
assessment of the effectiveness of internal control over financial
reporting,
included in Management's Report on Internal Control over Financial Reporting
appearing on page 52 of the 2007 Annual Report to Shareholders. Our
responsibility is to express opinions on these financial statements and on
the
Company's internal control over financial reporting based on our
integrated audits. We
conducted our
audits
in
accordance with the standards of the Public Company Accounting Oversight Board
(United States). Those standards require that we plan and perform the audits
to
obtain reasonable assurance about whether the financial statements are free
of
material misstatement and whether effective internal control over financial
reporting was maintained in all material respects. Our audits of the financial
statements included examining, on a test basis, evidence supporting the amounts
and disclosures in the financial statements, assessing the accounting principles
used and significant estimates made by management, and evaluating the overall
financial statement presentation. Our audit of internal control over financial
reporting included obtaining an understanding of internal control over financial
reporting, assessing the risk that a material weakness exists, and testing
and
evaluating the design and operating effectiveness of internal control based
on
the assessed risk. Our audits also included performing such other procedures
as
we considered necessary in the circumstances. We believe that our audits provide
a reasonable basis for our opinions.
As
more
fully disclosed in Note 2 of the Notes to Consolidated Financial Statements,
the
financial statements include investments valued at $78,110,384 (56.5% of net
assets) at December 31, 2007, the fair values of which have been estimated
by
the Board of Directors in the absence of readily ascertainable market values.
These estimated values may differ significantly from the values that would
have
been used had a ready market for the investments existed, and the differences
could be material.
A
company’s internal control over financial reporting is a process designed to
provide reasonable assurance regarding the reliability of financial reporting
and the preparation of financial statements for external purposes in accordance
with generally accepted accounting principles. A company’s internal control over
financial reporting includes those policies and procedures that (i) pertain
to the maintenance
of records that, in reasonable detail, accurately and fairly reflect the
transactions and dispositions of the assets of the company; (ii) provide
reasonable assurance that transactions are recorded as necessary to permit
preparation of financial statements in accordance with generally accepted
accounting principles, and that receipts and expenditures of the company are
being made only in accordance with authorizations of management and directors
of
the company; and (iii) provide reasonable assurance regarding prevention or
timely detection of unauthorized acquisition, use, or disposition of the
company’s assets that could have a material effect on the financial
statements.
53
Because
of its inherent limitations, internal control over financial reporting may
not
prevent or detect misstatements. Also, projections of any evaluation of
effectiveness to future periods are subject to the risk that controls may become
inadequate because of changes in conditions, or that the degree of compliance
with the policies or procedures may deteriorate.
/s/
PricewaterhouseCoopers LLP
New
York,
New York
March
12,
2008
54
|
HARRIS
& HARRIS GROUP, INC.
CONSOLIDATED
STATEMENTS OF ASSETS AND
LIABILITIES
|
|
December 31, 2007
|
December 31, 2006
|
||||||
|
ASSETS
|
|||||||
|
Investments,
at value (Cost: $142,230,461 at 12/31/07, $121,331,398 at
12/31/06)
|
$
|
138,303,977
|
$
|
112,323,978
|
|||
|
Cash
and cash equivalents
|
330,009
|
2,071,788
|
|||||
|
Restricted
funds (Note 7)
|
2,667,020
|
2,149,785
|
|||||
|
Receivable
from portfolio company
|
524
|
0
|
|||||
|
Receivable
from broker (Note 4)
|
0
|
819,905
|
|||||
|
Interest
receivable
|
647,337
|
625,372
|
|||||
|
Prepaid
expenses
|
488,667
|
10,945
|
|||||
|
Other
assets
|
455,798
|
326,817
|
|||||
|
Total
assets
|
$
|
142,893,332
|
$
|
118,328,590
|
|||
|
LIABILITIES
& NET ASSETS
|
|||||||
|
Accounts
payable and accrued liabilities (Note 7)
|
$
|
4,515,463
|
$
|
4,115,300
|
|||
|
Accrued
profit sharing (Note 5)
|
0
|
261,661
|
|||||
|
Deferred
rent
|
14,525
|
21,326
|
|||||
|
Total
liabilities
|
4,529,988
|
4,398,287
|
|||||
|
Net
assets
|
$
|
138,363,344
|
$
|
113,930,303
|
|||
|
Net
assets are comprised of:
|
|||||||
|
Preferred
stock, $0.10 par value, 2,000,000 shares authorized; none
issued
|
|
$
|
0
|
|
$
|
0
|
|
|
Common
stock, $0.01 par value, 45,000,000 shares authorized at 12/31/07
and
12/31/06; 25,143,313 issued at 12/31/07 and 22,843,757 issued at
12/31/06
|
|
|
251,434
|
|
|
228,438
|
|
|
Additional
paid in capital (Note 10)
|
160,927,691
|
129,801,201
|
|||||
|
Accumulated
net realized loss
|
(15,483,766
|
)
|
(3,686,385
|
)
|
|||
|
Accumulated
unrealized depreciation of investments
|
(3,926,484
|
)
|
(9,007,420
|
)
|
|||
|
Treasury
stock, at cost (1,828,740 shares at 12/31/07 and 12/31/06)
|
(3,405,531
|
)
|
(3,405,531
|
)
|
|||
|
Net
assets
|
$
|
138,363,344
|
$
|
113,930,303
|
|||
|
Shares
outstanding
|
23,314,573
|
21,015,017
|
|||||
|
Net
asset value per outstanding share
|
$
|
5.93
|
$
|
5.42
|
|||
The
accompanying notes are an integral part of these consolidated financial
statements.
55
|
HARRIS
& HARRIS GROUP, INC.
CONSOLIDATED
STATEMENTS OF OPERATIONS
|
|
Year Ended
|
Year Ended
|
Year Ended
|
||||||||
|
December 31, 2007
|
December 31, 2006
|
December 31, 2005
|
||||||||
|
Investment
income:
|
||||||||||
|
Interest
from:
|
||||||||||
|
Fixed-income
securities
|
$
|
2,705,597
|
$
|
2,991,261
|
$
|
1,409,273
|
||||
|
Portfolio
companies
|
0
|
0
|
65,620
|
|||||||
|
Miscellaneous
income
|
39
|
37,500
|
65,969
|
|||||||
|
Total
investment income
|
2,705,636
|
3,028,761
|
1,540,862
|
|||||||
|
Expenses:
|
||||||||||
|
Salaries,
benefits and stock-based compensation (Note 4)
|
11,435,329
|
7,933,276
|
2,459,033
|
|||||||
|
Administration
and operations
|
1,432,653
|
1,250,080
|
1,319,354
|
|||||||
|
Profit-sharing
provision (Note 5)
|
0
|
50,875
|
1,796,264
|
|||||||
|
Professional
fees
|
902,911
|
737,828
|
830,062
|
|||||||
|
Rent
|
235,998
|
239,846
|
211,582
|
|||||||
|
Directors'
fees and expenses
|
435,060
|
340,750
|
308,874
|
|||||||
|
Depreciation
|
63,113
|
64,916
|
64,713
|
|||||||
|
Custodian
fees
|
28,115
|
24,125
|
16,741
|
|||||||
|
Total
expenses
|
14,533,179
|
10,641,696
|
7,006,623
|
|||||||
|
Net
operating loss
|
(11,827,543
|
)
|
(7,612,935
|
)
|
(5,465,761
|
)
|
||||
|
Net
realized gain from investments:
|
||||||||||
|
Realized
gain from investments
|
118,137
|
31,338
|
23,862,037
|
|||||||
|
Income
tax expense (benefit) (Note 8)
|
87,975
|
(227,355
|
)
|
9,653,248
|
||||||
|
Net
realized gain from investments
|
30,162
|
258,693
|
14,208,789
|
|||||||
|
Net
decrease (increase) in unrealized depreciation on
investments:
|
||||||||||
|
Change
as a result of investment sales
|
0
|
0
|
(23,181,420
|
)
|
||||||
|
Change
on investments held
|
5,080,936
|
(4,418,870
|
)
|
19,790,298
|
||||||
|
Change
in unrealized depreciation on investments
|
5,080,936
|
(4,418,870
|
)
|
(3,391,122
|
)
|
|||||
|
Income
tax (benefit) (Note 8)
|
0
|
0
|
(1,364,470
|
)
|
||||||
|
Net
decrease (increase) in unrealized depreciation on
investments
|
5,080,936
|
(4,418,870
|
)
|
(2,026,652
|
)
|
|||||
|
Net
(decrease) increase in net assets resulting from
operations:
|
||||||||||
|
Total
|
$
|
(6,716,445
|
)
|
$
|
(11,773,112
|
)
|
$
|
6,716,376
|
||
|
Per
average basic and diluted outstanding share
|
$
|
(0.30
|
)
|
$
|
(0.57
|
)
|
$
|
0.36
|
||
|
Average
outstanding shares
|
22,393,030
|
20,759,547
|
18,471,770
|
|||||||
The
accompanying notes are an integral part of these consolidated financial
statements.
56
|
HARRIS
& HARRIS GROUP, INC.
CONSOLIDATED
STATEMENTS OF CASH FLOWS
|
|
Year Ended
|
Year Ended
|
Year Ended
|
||||||||
|
December 31, 2007
|
December 31, 2006
|
December 31, 2005
|
||||||||
|
Cash
flows used in operating activities:
|
||||||||||
|
Net
(decrease) increase in net assets resulting from
operations
|
$
|
(6,716,445
|
)
|
$
|
(11,773,112
|
)
|
$
|
6,716,376
|
||
|
Adjustments
to reconcile net increase (decrease) in net assets resulting from
operations to net cash used in operating activities:
|
||||||||||
|
Net
realized and unrealized (gain) loss on investments
|
(5,199,073
|
)
|
4,420,619
|
(20,470,915
|
)
|
|||||
|
Deferred
income taxes
|
0
|
0
|
(1,364,470
|
)
|
||||||
|
Depreciation
and amortization
|
(60,009
|
)
|
(426,168
|
)
|
346,019
|
|||||
|
Taxes
payable on behalf of shareholders on deemed dividend
|
0
|
0
|
8,122,367
|
|||||||
|
Stock-based
compensation expense
|
8,050,807
|
5,038,956
|
0
|
|||||||
|
Changes
in assets and liabilities:
|
||||||||||
|
Restricted
funds
|
(517,235
|
)
|
(419,351
|
)
|
(138,463
|
)
|
||||
|
Receivable
from portfolio company
|
(524
|
)
|
75,000
|
(65,000
|
)
|
|||||
|
Interest
receivable
|
(21,965
|
)
|
(376,808
|
)
|
(189,603
|
)
|
||||
|
Income
tax receivable
|
0
|
0
|
(7,023
|
)
|
||||||
|
Prepaid
expenses
|
(477,722
|
)
|
(7,951
|
)
|
539,496
|
|||||
|
Other
receivables
|
819,905
|
(819,905
|
)
|
0
|
||||||
|
Other
assets
|
(152,012
|
)
|
(176,325
|
)
|
11,599
|
|||||
|
Accounts
payable and accrued liabilities
|
400,163
|
1,002,643
|
268,525
|
|||||||
|
Accrued
profit sharing
|
(261,661
|
)
|
(1,846,197
|
)
|
1,796,264
|
|||||
|
Deferred
rent
|
(6,801
|
)
|
(9,677
|
)
|
(3,927
|
)
|
||||
|
Current
income tax liability
|
0
|
(9,637,026
|
)
|
1,524,470
|
||||||
|
Net
cash used in operating activities
|
(4,142,572
|
)
|
(14,955,302
|
)
|
(2,914,285
|
)
|
||||
|
Cash
flows from investing activities:
|
||||||||||
|
Net
(purchase) sale of short-term investments and marketable
securities
|
(235,754
|
)
|
37,593,589
|
(52,144,482
|
)
|
|||||
|
Investment
in private placements and loans
|
(20,595,161
|
)
|
(24,408,187
|
)
|
(16,251,339
|
)
|
||||
|
Proceeds
from sale of investments
|
174,669
|
28,295
|
35,392,200
|
|||||||
|
Purchase
of fixed assets
|
(41,640
|
)
|
(15,086
|
)
|
(45,704
|
)
|
||||
|
Net
cash (used in) provided by investing activities
|
(20,697,886
|
)
|
13,198,611
|
(33,049,325
|
)
|
|||||
|
Cash
flows from financing activities:
|
||||||||||
|
Proceeds
from public offering, net (Note 10)
|
12,993,168
|
0
|
36,526,567
|
|||||||
|
Proceeds
from stock option exercises (Note 4)
|
10,105,511
|
2,615,190
|
0
|
|||||||
|
Net
cash provided by financing activities
|
23,098,679
|
2,615,190
|
36,526,567
|
|||||||
|
Net
(decrease) increase in cash and cash equivalents:
|
||||||||||
|
Cash
and cash equivalents at beginning of the year
|
2,071,788
|
1,213,289
|
650,332
|
|||||||
|
Cash
and cash equivalents at end of the year
|
330,009
|
2,071,788
|
1,213,289
|
|||||||
|
Net
(decrease) increase in cash and cash equivalents
|
$
|
(1,741,779
|
)
|
$
|
858,499
|
$
|
562,957
|
|||
|
Supplemental
disclosures of cash flow information:
|
||||||||||
|
Income
taxes paid
|
$
|
80,236
|
$
|
9,425,922
|
$
|
0
|
||||
The
accompanying notes are an integral part of these consolidated financial
statements.
57
|
HARRIS
& HARRIS GROUP, INC.
CONSOLIDATED
STATEMENTS OF CHANGES IN NET ASSETS
|
|
Year Ended
|
Year Ended
|
Year Ended
|
||||||||
|
December 31, 2007
|
December 31, 2006
|
December 31, 2005
|
||||||||
|
Changes
in net assets from operations:
|
||||||||||
|
Net
operating loss
|
$
|
(11,827,543
|
)
|
$
|
(7,612,935
|
)
|
$
|
(5,465,761
|
)
|
|
|
Net
realized gain on investments
|
30,162
|
258,693
|
14,208,789
|
|||||||
|
Net
(increase) in unrealized depreciation on investments as a result
of
sales
|
0
|
0
|
(23,181,420
|
)
|
||||||
|
Net
decrease (increase) in unrealized depreciation on investments
held
|
5,080,936
|
(4,418,870
|
)
|
19,790,298
|
||||||
|
Net
change in deferred taxes
|
0
|
0
|
1,364,470
|
|||||||
|
Net
(decrease) increase in net assets resulting from
operations
|
(6,716,445
|
)
|
(11,773,112
|
)
|
6,716,376
|
|||||
|
Changes
in net assets from capital stock transactions:
|
||||||||||
|
Issuance
of common stock upon the exercise of stock options
|
9,996
|
2,587
|
0
|
|||||||
|
Issuance
of common stock on offering
|
13,000
|
0
|
35,075
|
|||||||
|
Additional
paid in capital on common stock issued
|
23,075,683
|
2,612,603
|
36,491,492
|
|||||||
|
Stock-based
compensation expense
|
8,050,807
|
5,038,956
|
0
|
|||||||
|
Net
increase in net assets resulting from capital stock
transactions
|
31,149,486
|
7,654,146
|
36,526,567
|
|||||||
|
Changes
in net assets from adoption of SFAS No. 158
|
0
|
61,527
|
0
|
|||||||
|
Net
increase (decrease) in net assets
|
24,433,041
|
(4,057,439
|
)
|
43,242,943
|
||||||
|
Net
Assets:
|
||||||||||
|
Beginning
of the year
|
113,930,303
|
117,987,742
|
74,744,799
|
|||||||
|
End
of the year
|
$
|
138,363,344
|
$
|
113,930,303
|
$
|
117,987,742
|
||||
The
accompanying notes are an integral part of these consolidated financial
statements.
58
|
HARRIS
& HARRIS GROUP, INC.
CONSOLIDATED
SCHEDULE OF INVESTMENTS AS OF DECEMBER 31,
2007
|
|
Method
of
|
Shares/
|
|||||||||
|
Valuation
(1)
|
Principal
|
Value
|
||||||||
|
Investments
in Unaffiliated Companies (2)(3) – 15.25% of net assets at
value
|
||||||||||
|
Private
Placement Portfolio (Illiquid) – 15.25% of net assets at
value
|
||||||||||
|
BioVex
Group, Inc. (4)(5)(6)(7)(8) – Developing novel biologics for
treatment of cancer and infectious disease Series
E
Convertible Preferred Stock
|
(B)
|
|
2,799,552
|
$
|
2,500,000
|
|||||
|
Exponential
Business Development Company (4)(5) — Venture capital partnership focused
on early stage companies
Limited
Partnership Interest
|
(B)
|
|
1
|
2,026
|
||||||
|
Molecular
Imprints, Inc. (4)(5) — Manufacturing nanoimprint lithography capital
equipment
|
||||||||||
|
Series
B Convertible Preferred Stock
|
(B)
|
|
1,333,333
|
2,000,000
|
||||||
|
Series
C Convertible Preferred Stock
|
(B)
|
|
1,250,000
|
2,389,250
|
||||||
|
Warrants
at $2.00 expiring 12/31/11
|
(B)
|
|
125,000
|
110,750
|
||||||
|
4,500,000
|
||||||||||
|
Nanosys,
Inc. (4)(5)(7) — Developing zero and one-dimensional inorganic
nanometer-scale materials and devices
|
||||||||||
|
Series
C Convertible Preferred Stock
|
(B)
|
|
803,428
|
2,370,113
|
||||||
|
Series
D Convertible Preferred Stock
|
(B)
|
|
1,016,950
|
3,000,003
|
||||||
|
5,370,116
|
||||||||||
|
Nantero,
Inc. (4)(5)(7) — Developing a high-density, nonvolatile, random access
memory chip, enabled by carbon nanotubes
|
||||||||||
|
Series
A Convertible Preferred Stock
|
(B)
|
|
345,070
|
1,046,908
|
||||||
|
Series
B Convertible Preferred Stock
|
(B)
|
|
207,051
|
628,172
|
||||||
|
Series
C Convertible Preferred Stock
|
(B)
|
|
188,315
|
571,329
|
||||||
|
2,246,409
|
||||||||||
The
accompanying notes are an integral part of these consolidated financial
statements.
59
|
HARRIS
& HARRIS GROUP, INC.
CONSOLIDATED
SCHEDULE OF INVESTMENTS AS OF DECEMBER
31, 2007
|
|
Method
of
|
Shares/
|
|||||||||
|
Valuation
(1)
|
Principal
|
Value
|
||||||||
|
Investments
in Unaffiliated Companies (2)(3) – 15.25% of net assets at value
(cont.)
|
||||||||||
|
Private
Placement Portfolio (Illiquid) – 15.25% of net assets at value
(cont.)
|
||||||||||
|
NeoPhotonics
Corporation (4)(5) — Developing and manufacturing optical devices and
components
|
||||||||||
|
Common
Stock
|
(B)
|
|
716,195
|
$
|
133,141
|
|||||
|
Series
1 Convertible Preferred Stock
|
(B)
|
|
1,831,256
|
1,831,256
|
||||||
|
Series
2 Convertible Preferred Stock
|
(B)
|
|
741,898
|
741,898
|
||||||
|
Series
3 Convertible Preferred Stock
|
(B)
|
|
2,750,000
|
2,750,000
|
||||||
|
Warrants
at $0.15 expiring 01/26/10
|
(B)
|
|
16,364
|
1,325
|
||||||
|
Warrants
at $0.15 expiring 12/05/10
|
(B)
|
|
14,063
|
1,139
|
||||||
|
|
5,458,759
|
|||||||||
|
Polatis,
Inc. (4)(5)(7)(9) — Developing MEMS-based optical networking
components
|
||||||||||
|
Series
A-1 Convertible Preferred Stock
|
(B)
|
|
16,775
|
0
|
||||||
|
Series
A-2 Convertible Preferred Stock
|
(B)
|
|
71,611
|
132,653
|
||||||
|
Series
A-4 Convertible Preferred Stock
|
(B)
|
|
4,774
|
8,768
|
||||||
|
Series
A-5 Convertible Preferred Stock
|
(B)
|
|
16,438
|
135,105
|
||||||
|
276,526
|
||||||||||
|
Starfire
Systems, Inc. (4)(5)(7) — Producing ceramic-forming
polymers
|
||||||||||
|
Common
Stock
|
(B)
|
|
375,000
|
150,000
|
||||||
|
Series
A-1 Convertible Preferred Stock
|
(B)
|
|
600,000
|
600,000
|
||||||
|
750,000
|
||||||||||
|
Total
Unaffiliated Private Placement Portfolio (cost:
$21,435,392)
|
$
|
21,103,836
|
||||||||
|
Total
Investments in Unaffiliated Companies (cost:
$21,435,392)
|
$
|
21,103,836
|
||||||||
The
accompanying notes are an integral part of these consolidated financial
statements.
60
|
HARRIS
& HARRIS GROUP, INC.
CONSOLIDATED
SCHEDULE OF INVESTMENTS AS OF DECEMBER
31, 2007
|
|
Method
of
|
Shares/
|
|||||||||
|
Valuation
(1)
|
Principal
|
Value
|
||||||||
|
Investments
in Non-Controlled Affiliated Companies (2)(10) – 38.06% of net assets
at value
|
||||||||||
|
Private
Placement Portfolio (Illiquid) – 38.06% of net assets at
value
|
||||||||||
|
Adesto
Technologies Corporation (4)(5)(6)(7) — Developing semiconductor-related
products enabled at the nanoscale
|
||||||||||
|
Series
A Convertible Preferred Stock
|
(B)
|
|
3,416,149
|
$
|
1,147,826
|
|||||
|
Ancora
Pharmaceuticals Inc. (4)(5)(6)(7) – Developing synthetic
carbohydrates for pharmaceutical markets and for internal drug
development programs
|
||||||||||
|
Series
B Convertible Preferred Stock
|
(B)
|
|
909,091
|
639,062
|
||||||
|
Warrants
at $1.06 expiring 05/01/08
|
(B)
|
|
754,717
|
60,377
|
||||||
|
699,439
|
||||||||||
|
BridgeLux,
Inc. (4)(5)(11) — Manufacturing high-power light emitting
diodes
|
||||||||||
|
Series
B Convertible Preferred Stock
|
(B)
|
|
1,861,504
|
2,792,256
|
||||||
|
Series
C Convertible Preferred Stock
|
(B)
|
|
2,130,699
|
3,196,050
|
||||||
|
Warrants
at $0.7136 expiring 02/02/2017
|
(B)
|
|
98,340
|
138,856
|
||||||
|
Warrants
at $0.7136 expiring 04/26/2017
|
(B)
|
|
65,560
|
92,833
|
||||||
|
6,219,995
|
||||||||||
|
Cambrios
Technologies Corporation (4)(5)(7) — Developing nanowire-enabled
electronic materials for the display industry
|
||||||||||
|
Series
B Convertible Preferred Stock
|
(B)
|
|
1,294,025
|
1,294,025
|
||||||
|
Series
C Convertible Preferred Stock
|
(B)
|
|
1,300,000
|
1,300,000
|
||||||
|
2,594,025
|
||||||||||
|
Chlorogen,
Inc. (4)(5)(12) — Developed patented chloroplast technology to produce
plant-made proteins
|
||||||||||
|
Series
A Convertible Preferred Stock
|
(B)
|
|
4,478,038
|
0
|
||||||
|
Series
B Convertible Preferred Stock
|
(B)
|
|
2,077,930
|
0
|
||||||
|
Secured
Convertible Bridge Note (including interest)
|
(B)
|
|
$
|
176,811
|
0
|
|||||
|
0
|
||||||||||
The
accompanying notes are an integral part of these consolidated financial
statements.
61
|
HARRIS
& HARRIS GROUP, INC.
CONSOLIDATED
SCHEDULE OF INVESTMENTS AS OF DECEMBER
31, 2007
|
|
Method
of
|
Shares/
|
|||||||||
|
Valuation
(1)
|
Principal
|
Value
|
||||||||
|
Investments
in Non-Controlled Affiliated Companies (2)(10) – 38.06% of net assets
at value (cont.)
|
||||||||||
|
Private
Placement Portfolio (Illiquid) – 38.06% of net assets at value
(cont.)
|
||||||||||
|
Crystal
IS, Inc. (4)(5)(7) — Developing single-crystal aluminum nitride substrates
for optoelectronic devices
|
||||||||||
|
Series
A Convertible Preferred Stock
|
(B)
|
|
391,571
|
$
|
305,425
|
|||||
|
Series
A-1 Convertible Preferred Stock
|
(B)
|
|
1,300,376
|
1,014,294
|
||||||
|
Warrants
at $0.78 expiring 05/05/2013
|
(B)
|
|
15,231
|
9,550
|
||||||
|
Warrants
at $0.78 expiring 05/12/2013
|
(B)
|
|
2,350
|
1,473
|
||||||
|
Warrants
at $0.78 expiring 08/08/2013
|
(B)
|
|
4,396
|
2,796
|
||||||
|
1,333,538
|
||||||||||
|
CSwitch,
Inc. (4)(5)(7)(13) — Developing next-generation, system-on- a-chip
solutions for communications-based platforms
|
||||||||||
|
Series
A-1 Convertible Preferred Stock
|
(B)
|
|
6,863,118
|
3,431,559
|
||||||
|
Secured
Convertible Bridge Note (including interest)
|
(B)
|
|
$
|
529,852
|
541,581
|
|||||
|
3,973,140
|
||||||||||
|
D-Wave
Systems, Inc. (4)(5)(7)(14) — Developing high- performance quantum
computing systems
|
||||||||||
|
Series
B Convertible Preferred Stock
|
(B)
|
|
2,000,000
|
2,226,488
|
||||||
|
Ensemble
Discovery Corporation (4)(5)(6)(7) – Developing DNA Programmed
Chemistry for the discovery of new classes of therapeutics and
bioassays
|
||||||||||
|
Series
B Convertible Preferred Stock
|
(B)
|
|
1,449,275
|
2,000,000
|
||||||
|
Innovalight,
Inc. (4)(5)(7) – Developing renewable energy products enabled by
silicon-based nanomaterials
|
||||||||||
|
Series
B Convertible Preferred Stock
|
(B)
|
|
16,666,666
|
5,718,216
|
||||||
|
Series
C Convertible Preferred Stock
|
(B)
|
|
5,810,577
|
1,993,568
|
||||||
|
7,711,784
|
||||||||||
The
accompanying notes are an integral part of these consolidated financial
statements.
62
|
HARRIS
& HARRIS GROUP, INC.
CONSOLIDATED
SCHEDULE OF INVESTMENTS AS OF DECEMBER
31, 2007
|
|
Method
of
|
Shares/
|
|||||||||
|
Valuation
(1)
|
Principal
|
Value
|
||||||||
|
Investments
in Non-Controlled Affiliated Companies (2)(10) – 38.06% of net assets
at value (cont.)
|
||||||||||
|
Private
Placement Portfolio (Illiquid) – 38.06% of net assets at value
(cont.)
|
||||||||||
|
Kereos,
Inc. (4)(5)(7) — Developing emulsion-based imaging agents and targeted
therapeutics to image and treat cancer and cardiovascular
disease
|
||||||||||
|
Series
B Convertible Preferred Stock
|
(B)
|
|
545,456
|
$
|
159,743
|
|||||
|
Kovio,
Inc. (4)(5)(7) — Developing semiconductor products using printed
electronics and thin-film technologies
|
||||||||||
|
Series
C Convertible Preferred Stock
|
(B)
|
|
2,500,000
|
3,125,000
|
||||||
|
Series
D Convertible Preferred Stock
|
(B)
|
|
800,000
|
1,000,000
|
||||||
|
4,125,000
|
||||||||||
|
Lifco,
Inc. (4)(5)(6)(7)(15) — Developing energy solutions using nanostructured
materials
|
||||||||||
|
Series
A Convertible Preferred Stock
|
(B)
|
|
1,208,262
|
946,528
|
||||||
|
Mersana
Therapeutics, Inc. (4)(5)(7)(16) — Developing advanced polymers for drug
delivery
|
||||||||||
|
Series
A Convertible Preferred Stock
|
(B)
|
|
68,451
|
136,902
|
||||||
|
Series
B Convertible Preferred Stock
|
(B)
|
|
866,500
|
1,733,000
|
||||||
|
Warrants
at $2.00 expiring 10/21/10
|
(B)
|
|
91,625
|
118,380
|
||||||
|
|
1,988,282
|
|||||||||
|
Metabolon,
Inc. (4)(5)(7) – Discovering biomarkers through the use of
metabolomics
|
||||||||||
|
Series
B Convertible Preferred Stock
|
(B)
|
|
2,173,913
|
2,500,000
|
||||||
The
accompanying notes are an integral part of these consolidated financial
statements.
63
|
HARRIS
& HARRIS GROUP, INC.
CONSOLIDATED
SCHEDULE OF INVESTMENTS AS OF DECEMBER
31, 2007
|
|
Method
of
|
Shares/
|
|||||||||
|
Valuation
(1)
|
Principal
|
Value
|
||||||||
|
Investments
in Non-Controlled Affiliated Companies (2)(10) – 38.06% of net assets
at value (cont.)
|
||||||||||
|
Private
Placement Portfolio (Illiquid) – 38.06% of net assets at value
(cont.)
|
||||||||||
|
NanoGram
Corporation (4)(5)(7) — Developing a broad suite of intellectual property
utilizing nanoscale materials
|
||||||||||
|
Series
I Convertible Preferred Stock
|
(B)
|
|
63,210
|
$
|
124,524
|
|||||
|
Series
II Convertible Preferred Stock
|
(B)
|
|
1,250,904
|
2,464,281
|
||||||
|
Series
III Convertible Preferred Stock
|
(B)
|
|
1,242,144
|
2,447,024
|
||||||
|
Series
IV Convertible Preferred Stock
|
(B)
|
|
432,179
|
851,393
|
||||||
|
5,887,222
|
||||||||||
|
Nanomix,
Inc. (4)(5)(7) — Producing nanoelectronic sensors that integrate carbon
nanotube electronics with silicon microstructures
|
||||||||||
|
Series
C Convertible Preferred Stock
|
(B)
|
|
977,917
|
330,228
|
||||||
|
Series
D Convertible Preferred Stock
|
(B)
|
|
6,802,397
|
680,240
|
||||||
|
1,010,468
|
||||||||||
|
NanoOpto
Corporation (4)(5)(17) — Manufactured discrete and integrated optical
communications sub-components on a chip by utilizing nano
manufacturing and nano coating technology
|
||||||||||
|
Series
A-1 Convertible Preferred Stock
|
(B)
|
|
267,857
|
0
|
||||||
|
Series
B Convertible Preferred Stock
|
(B)
|
|
3,819,935
|
0
|
||||||
|
Series
C Convertible Preferred Stock
|
(B)
|
|
1,932,789
|
0
|
||||||
|
Series
D Convertible Preferred Stock
|
(B)
|
|
1,397,218
|
0
|
||||||
|
Warrants
at $0.4359 expiring 03/15/10
|
(B)
|
|
193,279
|
0
|
||||||
|
Secured
Convertible Bridge Note (including interest)
|
(B)
|
|
$
|
268,654
|
105,714
|
|||||
|
|
105,714
|
|||||||||
|
Nextreme
Thermal Solutions, Inc. (4)(5)(7) — Developing thin-film thermoelectric
devices for cooling and energy conversion
|
||||||||||
|
Series
A Convertible Preferred Stock
|
(B)
|
|
1,750,000
|
1,750,000
|
||||||
The
accompanying notes are an integral part of these consolidated financial
statements.
64
|
HARRIS
& HARRIS GROUP, INC.
CONSOLIDATED
SCHEDULE OF INVESTMENTS AS OF DECEMBER
31, 2007
|
|
Method
of
|
Shares/
|
|||||||||
|
Valuation
(1)
|
Principal
|
Value
|
||||||||
|
Investments
in Non-Controlled Affiliated Companies (2)(10) – 38.06% of net assets
at value (cont.)
|
||||||||||
|
Private
Placement Portfolio (Illiquid) – 38.06% of net assets at value
(cont.)
|
||||||||||
|
Questech
Corporation (4)(5) — Manufacturing and marketing proprietary metal and
stone decorative tiles
|
||||||||||
|
Common
Stock
|
(B)
|
|
655,454
|
$
|
589,259
|
|||||
|
Warrants
at $1.50 expiring 11/19/08
|
(B)
|
|
5,000
|
1,085
|
||||||
|
Warrants
at $1.50 expiring 11/19/09
|
(B)
|
|
5,000
|
1,910
|
||||||
|
592,254
|
||||||||||
|
Siluria
Technologies, Inc. (4)(5)(6)(7) – Developing new-generation
nanomaterials
|
||||||||||
|
Series
S-2 Convertible Preferred Stock
|
(B)
|
|
482,218
|
160,723
|
||||||
|
Solazyme,
Inc. (4)(5)(7) — Developing energy-harvesting machinery of photosynthetic
microbes to produce industrial and pharmaceutical
molecules
|
||||||||||
|
Series
A Convertible Preferred Stock
|
(B)
|
|
988,204
|
997,691
|
||||||
|
Series
B Convertible Preferred Stock
|
(B)
|
|
495,246
|
500,000
|
||||||
|
1,497,691
|
||||||||||
|
Xradia,
Inc. (4)(5) – Designing, manufacturing and selling ultra high
resolution 3D x-ray microscopes and fluorescence imaging
systems
|
||||||||||
|
Series
D Convertible Preferred Stock
|
(B)
|
|
3,121,099
|
4,000,000
|
||||||
|
Zia
Laser, Inc. (4)(5)(18) — Developed quantum dot semiconductor
lasers
|
||||||||||
|
Series
C Convertible Preferred Stock
|
(B)
|
|
1,500,000
|
21,329
|
||||||
|
Total
Non-Controlled Private Placement Portfolio (cost:
$54,306,393)
|
$
|
52,651,189
|
||||||||
|
Total
Investments in Non-Controlled Affiliated Companies (cost:
$54,306,393)
|
$
|
52,651,189
|
||||||||
The
accompanying notes are an integral part of these consolidated financial
statements.
65
|
HARRIS
& HARRIS GROUP, INC.
CONSOLIDATED
SCHEDULE OF INVESTMENTS AS OF DECEMBER
31, 2007
|
|
Method
of
|
Shares/
|
|||||||||
|
Valuation
(1)
|
Principal
|
Value
|
||||||||
|
Investments
in Controlled Affiliated Companies (2)(19) – 3.15% of net assets at
value
|
||||||||||
|
Private
Placement Portfolio (Illiquid) – 3.15% of net assets at
value
|
||||||||||
|
Evolved
Nanomaterial Sciences, Inc. (4)(5)(20) — Developed nanoscale-enhanced
approaches for the resolution of chiral molecules
|
||||||||||
|
Series
A Convertible Preferred Stock
|
(B)
|
|
5,870,021
|
$
|
0
|
|||||
|
Phoenix
Molecular Corporation (4)(5)(6)(7) – Developing technology to enable
the separation of difficult-to-separate materials.
|
||||||||||
|
Common
Stock
|
(B)
|
|
1,000
|
10
|
||||||
|
Unsecured
Convertible Bridge Note (including interest)
|
(B)
|
|
$
|
50,000
|
50,733
|
|||||
|
|
50,743
|
|||||||||
|
SiOnyx,
Inc. (4)(5)(7) — Developing silicon-based optoelectronic products enabled
by its proprietary "Black Silicon"
|
||||||||||
|
Series
A Convertible Preferred Stock
|
(B)
|
|
233,499
|
135,686
|
||||||
|
Series
A-1 Convertible Preferred Stock
|
(B)
|
|
2,966,667
|
1,723,930
|
||||||
|
Series
A-2 Convertible Preferred Stock
|
(B)
|
|
4,207,537
|
2,445,000
|
||||||
|
4,304,616
|
||||||||||
|
Total
Controlled Private Placement Portfolio (cost:
$6,935,743)
|
$
|
4,355,359
|
||||||||
|
Total
Investments in Controlled Affiliated Companies (cost:
$6,935,743)
|
$
|
4,355,359
|
||||||||
|
Total
Private Placement Portfolio (cost: $82,677,528)
|
$
|
78,110,384
|
||||||||
The
accompanying notes are an integral part of these consolidated financial
statements.
66
|
HARRIS
& HARRIS GROUP, INC.
CONSOLIDATED
SCHEDULE OF INVESTMENTS AS OF DECEMBER
31, 2007
|
|
U.S.
Government and Agency Securities –43.50% of net assets at
value
|
||||||||||
|
U.S.
Treasury Bill — due date 02/21/08
|
(J)
|
|
$
|
2,750,000
|
$
|
2,738,725
|
||||
|
U.S.
Treasury Notes — due date 02/15/08, coupon 3.375%
|
(H)
|
|
15,005,000
|
15,006,200
|
||||||
|
U.S.
Treasury Notes — due date 05/15/08, coupon 3.75%
|
(H)
|
|
9,000,000
|
9,010,530
|
||||||
|
U.S.
Treasury Notes — due date 09/15/08, coupon 3.125%
|
(H)
|
|
5,000,000
|
4,991,800
|
||||||
|
U.S.
Treasury Notes — due date 01/15/09, coupon 3.25%
|
(H)
|
|
3,000,000
|
3,005,160
|
||||||
|
U.S.
Treasury Notes — due date 02/15/09, coupon 4.50%
|
(H)
|
|
5,100,000
|
5,176,908
|
||||||
|
U.S.
Treasury Notes — due date 04/15/09, coupon 3.125%
|
(H)
|
|
3,000,000
|
3,001,410
|
||||||
|
U.S.
Treasury Notes — due date 07/15/09, coupon 3.625%
|
(H)
|
|
3,000,000
|
3,023,910
|
||||||
|
U.S.
Treasury Notes — due date 10/15/09, coupon 3.375%
|
(H)
|
|
3,000,000
|
3,018,510
|
||||||
|
U.S.
Treasury Notes — due date 01/15/10, coupon 3.625%
|
(H)
|
|
3,000,000
|
3,034,680
|
||||||
|
U.S.
Treasury Notes — due date 04/15/10, coupon 4.00%
|
(H)
|
|
3,000,000
|
3,060,930
|
||||||
|
U.S.
Treasury Notes — due date 07/15/10, coupon 3.875%
|
(H)
|
|
3,000,000
|
3,060,930
|
||||||
|
U.S.
Treasury Notes — due date 10/15/10, coupon 4.25%
|
(H)
|
|
2,000,000
|
2,063,900
|
||||||
|
Total
Investments in U.S. Government and Agency Securities (cost:
$59,552,933)
|
$
|
60,193,593
|
||||||||
|
Total
Investments (cost: $142,230,461)
|
$
|
138,303,977
|
The
accompanying notes are an integral part of these consolidated financial
statements.
67
|
HARRIS
& HARRIS GROUP, INC.
CONSOLIDATED
SCHEDULE OF INVESTMENTS AS OF DECEMBER 31,
2007
|
Notes
to
Consolidated Schedule of Investments
|
(1)
|
See
Footnote to Consolidated Schedule of Investments on page 78 for a
description of the Valuation
Procedures.
|
|
(2)
|
Investments
in unaffiliated companies consist of investments in which we own
less than
five percent of the voting shares of the portfolio company. Investments
in
non-controlled affiliated companies consist of investments in which
we own
five percent or more, but less than 25 percent, of the voting shares
of
the portfolio company, or where we hold one or more seats on the
portfolio
company’s Board of Directors but do not control the company. Investments
in controlled affiliated companies consist of investments in which
we own
25 percent or more of the voting shares of the portfolio company
or
otherwise control the company.
|
|
(3)
|
The
aggregate cost for federal income tax purposes of investments in
unaffiliated companies is $21,435,392. The gross unrealized appreciation
based on the tax cost for these securities is $1,732,194. The gross
unrealized depreciation based on the tax cost for these securities
is
$2,063,750.
|
|
(4)
|
Legal
restrictions on sale of investment.
|
|
(5)
|
Represents
a non-income producing security. Equity investments that have not
paid
dividends within the last 12 months are considered to be non-income
producing.
|
|
(6)
|
Initial
investment was made during 2007.
|
|
(7)
|
These
investments are development stage companies. A development stage
company
is defined as a company that is devoting substantially all of its
efforts
to establishing a new business, and either it has not yet commenced
its
planned principal operations, or it has commenced such operations
but has
not realized significant revenue from
them.
|
|
(8)
|
With
our purchase of Series E Convertible Preferred Stock of BioVex, we
received a warrant to purchase a number of shares of common stock
of
BioVex as determined by dividing 624,999.99 by the price per share
at
which the common stock is offered and sold to the public in connection
with the initial public offering. The ability to exercise this
warrant is therefore contingent on BioVex completing successfully
an
initial public offering before the expiration date of the warrant
of
September 27, 2012. The exercise price of this warrant shall be 110
percent of the initial public offering
price.
|
|
(9)
|
Continuum
Photonics, Inc., merged with Polatis, Ltd., to form Polatis,
Inc.
|
The
accompanying notes are an integral part of these consolidated financial
statements.
68
|
HARRIS
& HARRIS GROUP, INC.
CONSOLIDATED
SCHEDULE OF INVESTMENTS AS OF DECEMBER
31, 2007
|
|
(10)
|
The
aggregate cost for federal income tax purposes of investments in
non-controlled affiliated companies is $54,306,393. The gross unrealized
appreciation based on the tax cost for these securities is $10,915,201.
The gross unrealized depreciation based on the tax cost for these
securities is $12,570,405.
|
|
(11)
|
BridgeLux,
Inc., was previously named eLite Optoelectronics,
Inc.
|
| (12) |
On
November 30, 2007, Chlorogen filed a Certificate of Dissolution with
the
state of Delaware.
|
|
(13)
|
With
our investment in a secured convertible bridge note issued by CSwitch,
we
received a warrant to purchase a number of shares of the class of
stock
sold in the next financing of CSwitch equal to $529,322.36, the principal
of the note, divided by the lowest price per share of the class of
stock
sold in the next financing of CSwitch. The ability to exercise this
warrant is therefore contingent on CSwitch completing successfully
a
subsequent round of financing. The warrant will expire five years
from the date of the close of the next round of financing. The cost
basis of this warrant is $529.32.
|
|
(14)
|
D-Wave
Systems, Inc., is located and is doing business primarily in Canada.
We
invested in D-Wave Systems, Inc., through D-Wave USA, a Delaware
company.
Our investment is denominated in Canadian dollars and is subject
to
foreign currency translation. See "Note 2. Summary of Significant
Accounting Policies."
|
| (15) |
On
February 28, 2008, Lifco, Inc., merged with CFX Battery, Inc., to
form CFX
Battery, Inc.
|
|
(16)
|
Mersana
Therapeutics, Inc., was previously named Nanopharma
Corp.
|
|
(17)
|
On
July 19, 2007, NanoOpto Corporation sold its assets to API Nanotronics,
Inc.
|
|
(18)
|
On
November 30, 2006, the assets of Zia Laser, Inc., were acquired by
Innolume, Inc.
|
|
(19)
|
The
aggregate cost for federal income tax purposes of investments in
controlled affiliated companies is $6,935,743. The gross unrealized
appreciation based on the tax cost for these securities is $219,616.
The
gross unrealized depreciation based on the tax cost for these securities
is $2,800,000.
|
|
(20)
|
On
September 30, 2007, Evolved Nanomaterial Sciences, Inc., filed for
Chapter
7 bankruptcy.
|
The
accompanying notes are an integral part of this consolidated
schedule.
69
|
HARRIS
& HARRIS GROUP, INC.
CONSOLIDATED
SCHEDULE OF INVESTMENTS AS OF DECEMBER 31,
2006
|
|
Method
of
Valuation
(3)
|
Shares/
Principal
|
Value
|
||||||||
|
Investments
in Unaffiliated Companies (6)(7) – 15.61% of net
assets
|
||||||||||
|
Private
Placement Portfolio (Illiquid) – 15.61% of net
assets
|
||||||||||
|
AlphaSimplex
Group, LLC (2) — Investment management company headed by
|
||||||||||
|
Dr.
Andrew W. Lo, holder of the Harris & Harris Group Chair at MIT
Limited
Liability Company Interest
|
(B)
|
|
—
|
$
|
10,521
|
|||||
|
Exponential
Business Development Company (1)(2) —
|
||||||||||
|
Venture
capital partnership focused on early stage companies
Limited
Partnership Interest
|
(B)
|
|
—
|
0
|
||||||
|
Molecular
Imprints, Inc. (1)(2) — Manufacturing nanoimprint lithography capital
equipment
|
||||||||||
|
Series
B Convertible Preferred Stock
|
(A)
|
|
1,333,333
|
2,000,000
|
||||||
|
Series
C Convertible Preferred Stock
|
(A)
|
|
1,250,000
|
2,500,000
|
||||||
|
Warrants
at $2.00 expiring12/31/11
|
(B)
|
|
125,000
|
0
|
||||||
|
4,500,000
|
||||||||||
|
Nanosys,
Inc. (1)(2)(5) — Developing zero and one-dimensional inorganic
nanometer-scale materials for use in nanotechnology- enabled
systems
|
||||||||||
|
Series
C Convertible Preferred Stock
|
(C)
|
|
803,428
|
2,370,113
|
||||||
|
Series
D Convertible Preferred Stock
|
(C)
|
|
1,016,950
|
3,000,003
|
||||||
|
5,370,116
|
||||||||||
|
Nantero,
Inc. (1)(2)(5) — Developing a high-density, nonvolatile, random access
memory chip, enabled by carbon nanotubes
|
||||||||||
|
Series
A Convertible Preferred Stock
|
(C)
|
|
345,070
|
1,046,908
|
||||||
|
Series
B Convertible Preferred Stock
|
(C)
|
|
207,051
|
628,172
|
||||||
|
Series
C Convertible Preferred Stock
|
(C)
|
|
188,315
|
571,329
|
||||||
|
2,246,409
|
||||||||||
The
accompanying notes are an integral part of these consolidated financial
statements.
70
|
HARRIS
& HARRIS GROUP, INC.
CONSOLIDATED
SCHEDULE OF INVESTMENTS AS OF DECEMBER
31, 2006
|
|
Method
of
Valuation
(3)
|
Shares/
Principal
|
Value
|
||||||||
|
Investments
in Unaffiliated Companies (6)(7) – 15.61% of net assets
(cont.)
|
||||||||||
|
Private
Placement Portfolio (Illiquid) – 15.61% of net assets
(cont.)
|
||||||||||
|
NeoPhotonics
Corporation (1)(2) — Developing and manufacturing planar optical devices
and components
|
||||||||||
|
Common
Stock
|
(C)
|
|
716,195
|
$
|
133,141
|
|||||
|
Series
1 Convertible Preferred Stock
|
(C)
|
|
1,831,256
|
1,831,256
|
||||||
|
Series
2 Convertible Preferred Stock
|
(C)
|
|
741,898
|
741,898
|
||||||
|
Series
3 Convertible Preferred Stock
|
(C)
|
|
2,750,000
|
2,750,000
|
||||||
|
Warrants
at $0.15 expiring 01/26/10
|
(C)
|
|
16,364
|
164
|
||||||
|
Warrants
at $0.15 expiring 12/05/10
|
(C)
|
|
14,063
|
140
|
||||||
|
5,456,599
|
||||||||||
|
Polatis,
Inc. (1)(2)(5)(10) — Developing optical networking components by merging
materials, MEMS and electronics technologies
|
||||||||||
|
Series
A-1 Convertible Preferred Stock
|
(B)
|
|
16,775
|
0
|
||||||
|
Series
A-2 Convertible Preferred Stock
|
(B)
|
|
71,611
|
141,520
|
||||||
|
Series
A-4 Convertible Preferred Stock
|
(B)
|
|
4,774
|
9,435
|
||||||
|
Series
A-5 Convertible Preferred Stock
|
(B)
|
|
5,491
|
45,127
|
||||||
|
196,082
|
||||||||||
|
Total
Unaffiliated Private Placement Portfolio (cost:
$18,107,124)
|
$
|
17,779,727
|
||||||||
|
Total
Investments in Unaffiliated Companies (cost:
$18,107,124)
|
$
|
17,779,727
|
||||||||
The
accompanying notes are an integral part of these consolidated financial
statements.
71
|
HARRIS
& HARRIS GROUP, INC.
CONSOLIDATED
SCHEDULE OF INVESTMENTS AS OF DECEMBER
31, 2006
|
|
Method
of
Valuation
(3)
|
Shares/
Principal
|
Value
|
||||||||
|
Investments
in Non-Controlled Affiliated Companies (6)(8) – 28.20% of net
assets
|
||||||||||
|
Private
Placement Portfolio (Illiquid) – 28.20% of net
assets
|
||||||||||
|
BridgeLux,
Inc. (1)(2)(11) — Manufacturing high-power light emitting
diodes
|
||||||||||
|
Series
B Convertible Preferred Stock
|
(A)
|
|
1,861,504
|
$
|
1,000,000
|
|||||
|
Cambrios
Technologies Corporation (1)(2)(5) — Developing nanowire- enabled
electronic materials for the display industry
|
||||||||||
|
Series
B Convertible Preferred Stock
|
(A)
|
|
1,294,025
|
1,294,025
|
||||||
|
Chlorogen,
Inc. (1)(2)(5) — Developing patented chloroplast technology to produce
plant-made proteins
|
||||||||||
|
Series
A Convertible Preferred Stock
|
(C)
|
|
4,478,038
|
785,000
|
||||||
|
Series
B Convertible Preferred Stock
|
(C)
|
|
2,077,930
|
364,261
|
||||||
|
Secured
Convertible Bridge Note (including interest)
|
(A)
|
|
$
|
221,438
|
225,697
|
|||||
|
1,374,958
|
||||||||||
|
Crystal
IS, Inc. (1)(2)(5) — Developing single-crystal aluminum nitride substrates
for optoelectronic devices
|
||||||||||
|
Series
A Convertible Preferred Stock
|
(C)
|
|
|
391,571
|
|
|
305,425
|
|
||
|
Series
A-1 Convertible Preferred Stock
|
|
|
(C)
|
|
1,300,376
|
1,014,294
|
||||
|
Warrants
at $0.78 expiring 05/05/2013
|
(B)
|
|
15,231
|
0
|
||||||
|
Warrants
at $0.78 expiring 05/12/2013
|
(B)
|
|
2,350
|
0
|
||||||
|
Warrants
at $0.78 expiring 08/08/2013
|
(B)
|
|
4,396
|
0
|
||||||
|
1,319,719
|
||||||||||
|
CSwitch,
Inc. (1)(2)(5) — Developing next-generation, system-on-a-chip solutions
for communications-based platforms
|
||||||||||
|
Series
A-1 Convertible Preferred Stock
|
(C)
|
|
6,700,000
|
3,350,000
|
||||||
The
accompanying notes are an integral part of these consolidated financial
statements.
72
|
HARRIS
& HARRIS GROUP, INC.
CONSOLIDATED
SCHEDULE OF INVESTMENTS AS OF DECEMBER
31, 2006
|
|
|
|
Method
of
Valuation
(3)
|
|
Shares/
Principal
|
|
Value
|
|
|||
|
Investments
in Non-Controlled Affiliated Companies (6)(8) – 28.20% of net assets
(cont.)
|
||||||||||
|
Private
Placement Portfolio (Illiquid) – 28.20% of net assets
(cont.)
|
||||||||||
|
|
|
|
|
|
|
|
|
|
|
|
|
D-Wave
Systems, Inc. (1)(2)(4)(5)(13) — Developing high-performance quantum
computing systems
|
||||||||||
|
Series
B Convertible Preferred Stock
|
(A)
|
|
2,000,000
|
$
|
1,716,444
|
|||||
|
Warrants
at $0.85 expiring 10/19/07
|
(B)
|
|
1,800,000
|
0
|
||||||
|
1,716,444
|
||||||||||
|
Innovalight,
Inc. (1)(2)(4)(5) - Developing renewable energy products enabled
by
silicon-based nanomaterials
|
||||||||||
|
Series
B Convertible Preferred Stock
|
(A)
|
|
16,666,666
|
2,500,000
|
||||||
|
Kereos,
Inc. (1)(2)(5) — Developing emulsion-based imaging agents and targeted
therapeutics to image and treat cancer and cardiovascular
disease
|
||||||||||
|
Series
B Convertible Preferred Stock
|
(A)
|
|
349,092
|
960,000
|
||||||
|
Kovio,
Inc. (1)(2)(5) — Developing semiconductor products using printed
electronics and thin-film technologies
|
||||||||||
|
Series
C Convertible Preferred Stock
|
(A)
|
|
2,500,000
|
3,000,000
|
||||||
|
Mersana
Therapeutics, Inc. (1)(2)(5)(12) — Developing advanced polymers for drug
delivery
|
||||||||||
|
Series
A Convertible Preferred Stock
|
(C)
|
|
68,452
|
136,904
|
||||||
|
Series
B Convertible Preferred Stock
|
(C)
|
|
616,500
|
1,233,000
|
||||||
|
Warrants
at $2.00 expiring 10/21/10
|
(B)
|
|
91,625
|
0
|
||||||
|
1,369,904
|
||||||||||
|
Metabolon,
Inc. (1)(2)(4)(5) - Discovering biomarkers through the use of
metabolomics
|
||||||||||
|
Series
B Convertible Preferred Stock
|
(A)
|
|
2,173,913
|
2,500,000
|
||||||
The
accompanying notes are an integral part of these consolidated financial
statements.
73
|
HARRIS
& HARRIS GROUP, INC.
CONSOLIDATED
SCHEDULE OF INVESTMENTS AS OF DECEMBER
31, 2006
|
|
|
|
Method
of
Valuation
(3)
|
|
Shares/
Principal
|
|
Value
|
|
|||
|
Investments
in Non-Controlled Affiliated Companies (6)(8) – 28.20% of net assets
(cont.)
|
||||||||||
|
Private
Placement Portfolio (Illiquid) – 28.20% of net assets
(cont.)
|
||||||||||
|
NanoGram
Corporation (1)(2)(5) — Developing a broad suite of intellectual property
utilizing nanotechnology
|
||||||||||
|
Series
I Convertible Preferred Stock
|
(C)
|
|
63,210
|
$
|
64,259
|
|||||
|
Series
II Convertible Preferred Stock
|
(C)
|
|
1,250,904
|
1,271,670
|
||||||
|
Series
III Convertible Preferred Stock
|
(C)
|
|
1,242,144
|
1,262,764
|
||||||
|
|
2,598,693
|
|||||||||
|
Nanomix,
Inc. (1)(2)(5) — Producing nanoelectronic sensors that integrate carbon
nanotube electronics with silicon microstructures
|
||||||||||
|
Series
C Convertible Preferred Stock
|
(B)
|
|
9,779,181
|
790,000
|
||||||
|
NanoOpto
Corporation (1)(2)(5) — Manufacturing discrete and integrated optical
communications sub-components on a chip by utilizing nano manufacturing
and nano coating technology
|
||||||||||
|
Series
A-1 Convertible Preferred Stock
|
(B)
|
|
267,857
|
16,400
|
||||||
|
Series
B Convertible Preferred Stock
|
(B)
|
|
3,819,935
|
560,328
|
||||||
|
Series
C Convertible Preferred Stock
|
(B)
|
|
1,932,789
|
425,266
|
||||||
|
Series
D Convertible Preferred Stock
|
(B)
|
|
1,397,218
|
204,951
|
||||||
|
Warrants
at $0.4359 expiring 03/15/10
|
(B)
|
|
193,279
|
0
|
||||||
|
1,206,945
|
||||||||||
|
Nextreme
Thermal Solutions, Inc. (1)(2)(5) — Developing thin-film thermoelectric
devices
|
||||||||||
|
Series
A Convertible Preferred Stock
|
(A)
|
|
1,000,000
|
1,000,000
|
||||||
|
Questech
Corporation (1)(2) — Manufacturing and marketing proprietary metal and
stone decorative tiles
|
||||||||||
|
Common
Stock
|
(B)
|
|
655,454
|
996,683
|
||||||
|
Warrants
at $1.50 expiring 11/21/07
|
(B)
|
|
3,750
|
77
|
||||||
|
Warrants
at $1.50 expiring 11/19/08
|
(B)
|
|
5,000
|
103
|
||||||
|
Warrants
at $1.50 expiring 11/19/09
|
(B)
|
|
5,000
|
103
|
||||||
|
996,966
|
||||||||||
The
accompanying notes are an integral part of these consolidated financial
statements.
74
|
HARRIS
& HARRIS GROUP, INC.
CONSOLIDATED
SCHEDULE OF INVESTMENTS AS OF DECEMBER
31, 2006
|
|
|
|
Method
of
Valuation
(3)
|
|
Shares/
Principal
|
|
Value
|
|
|||
|
Investments
in Non-Controlled Affiliated Companies (6)(8) – 28.20% of net assets
(cont.)
|
||||||||||
|
Private
Placement Portfolio (Illiquid) – 28.20% of net assets
(cont.)
|
||||||||||
|
Solazyme,
Inc. (1)(2)(5) — Developing energy-harvesting machinery of photosynthetic
microbes to produce industrial and pharmaceutical
molecules
|
||||||||||
|
Series
A Convertible Preferred Stock
|
(C)
|
|
988,204
|
$
|
385,400
|
|||||
|
Starfire
Systems, Inc. (1)(2)(5) —Producing ceramic-forming
polymers
|
||||||||||
|
Common
Stock
|
(A)
|
|
375,000
|
150,000
|
||||||
|
Series
A-1 Convertible Preferred Stock
|
(C)
|
|
600,000
|
600,000
|
||||||
|
|
750,000
|
|||||||||
|
Xradia,
Inc. (1)(2)(4) - Designing, manufacturing and selling ultra high
resolution 3D x-ray microscopes and fluorescence imaging
systems.
|
||||||||||
|
Series
D Convertible Preferred Stock
|
(A)
|
|
3,121,099
|
4,000,000
|
||||||
|
Zia
Laser, Inc. (1)(2)(5) — Developing quantum dot semiconductor
lasers
|
||||||||||
|
Series
C Convertible Preferred Stock
|
(C)
|
|
1,500,000
|
15,000
|
||||||
|
Total
Non-Controlled Private Placement Portfolio (cost:
$39,571,676)
|
$
|
32,128,054
|
||||||||
|
Total
Investments in Non-Controlled Affiliated Companies (cost:
$39,571,676)
|
$
|
32,128,054
|
||||||||
The
accompanying notes are an integral part of these consolidated financial
statements.
75
|
HARRIS
& HARRIS GROUP, INC.
CONSOLIDATED
SCHEDULE OF INVESTMENTS AS OF DECEMBER 31,
2006
|
|
|
|
Method
of
Valuation
(3)
|
|
Shares/
Principal
|
|
Value
|
|
|||
|
Investments
in Controlled Affiliated Companies (6)(9) – 3.30% of net
assets
|
||||||||||
|
Private
Placement Portfolio (Illiquid) – 3.30% of net
assets
|
||||||||||
|
Evolved
Nanomaterial Sciences, Inc. (1)(2)(4)(5) — Developing
nanotechnology-enhanced approaches for the resolution of chiral
molecules
|
||||||||||
|
Series
A Convertible Preferred Stock
|
(A)
|
|
5,870,021
|
$
|
2,800,000
|
|||||
|
SiOnyx,
Inc. (1)(2)(4)(5) — Developing silicon-based optoelectronic products
enabled by its proprietary, "Black Silicon"
|
||||||||||
|
Series
A Convertible Preferred Stock
|
(C)
|
|
233,499
|
70,050
|
||||||
|
Series
A-1 Convertible Preferred Stock
|
(C)
|
|
2,966,667
|
890,000
|
||||||
|
960,050
|
||||||||||
|
Total
Controlled Private Placement Portfolio (cost:
$4,440,000)
|
$
|
3,760,050
|
||||||||
|
Total
Investments in Controlled Affiliated Companies (cost:
$4,440,000)
|
$
|
3,760,050
|
||||||||
|
U.S.
Government and Agency Securities – 51.48% of net
assets
|
||||||||||
|
U.S.
Treasury Bill — due date 1/18/07
|
(J)
|
|
2,217,000
|
2,212,677
|
||||||
|
U.S.
Treasury Notes — due date 11/30/07, coupon 4.25%
|
(H)
|
|
6,500,000
|
6,455,345
|
||||||
|
U.S.
Treasury Notes — due date 02/15/08, coupon 3.375%
|
(H)
|
|
9,000,000
|
8,842,860
|
||||||
|
U.S.
Treasury Notes — due date 05/15/08, coupon 3.75%
|
(H)
|
|
9,000,000
|
8,862,210
|
||||||
|
U.S.
Treasury Notes — due date 09/15/08, coupon 3.125%
|
(H)
|
|
5,000,000
|
4,861,350
|
||||||
|
U.S.
Treasury Notes — due date 01/15/09, coupon 3.25%
|
(H)
|
|
3,000,000
|
2,910,930
|
||||||
|
U.S.
Treasury Notes — due date 02/15/09, coupon 4.50%
|
(H)
|
|
5,100,000
|
5,069,145
|
||||||
|
U.S.
Treasury Notes — due date 04/15/09, coupon 3.125%
|
(H)
|
|
3,000,000
|
2,893,830
|
||||||
|
U.S.
Treasury Notes — due date 07/15/09, coupon 3.625%
|
(H)
|
|
3,000,000
|
2,920,890
|
||||||
|
U.S.
Treasury Notes — due date 10/15/09, coupon 3.375%
|
(H)
|
|
3,000,000
|
2,894,310
|
||||||
|
U.S.
Treasury Notes — due date 01/15/10, coupon 3.625%
|
(H)
|
|
3,000,000
|
2,907,420
|
||||||
|
U.S.
Treasury Notes — due date 04/15/10, coupon 4.00%
|
(H)
|
|
3,000,000
|
2,935,560
|
||||||
|
U.S.
Treasury Notes — due date 07/15/10, coupon 3.875%
|
(H)
|
|
3,000,000
|
2,920,560
|
||||||
|
U.S.
Treasury Notes — due date 10/15/10, coupon 4.25%
|
(H)
|
|
2,000,000
|
1,969,060
|
||||||
|
Total
Investments in U.S. Government and Agency Securities (cost:
$59,212,598)
|
$
|
58,656,147
|
||||||||
|
Total
Investments (cost: $121,331,398)
|
$
|
112,323,978
|
||||||||
The
accompanying notes are an integral part of these consolidated financial
statements.
76
|
HARRIS
& HARRIS GROUP, INC.
CONSOLIDATED
SCHEDULE OF INVESTMENTS AS OF DECEMBER 31,
2006
|
Notes
to
Consolidated Schedule of Investments
|
(1)
|
Represents
a non-income producing security. Equity investments that have not
paid
dividends within the last 12 months are considered to be non-income
producing.
|
|
(2)
|
Legal
restrictions on sale of investment.
|
|
(3)
|
See
Footnote to Schedule of Investments for a description of the Valuation
Procedures.
|
|
(4)
|
Initial
investment was made during 2006.
|
|
(5)
|
These
investments are development stage companies. A development stage
company
is defined as a company that is devoting substantially all of its
efforts
to establishing a new business, and either it has not yet commenced
its
planned principal operations, or it has commenced such operations
but has
not realized significant revenue from
them.
|
|
(6)
|
Investments
in unaffiliated companies consist of investments in which we own
less than
five percent of the voting shares of the portfolio company. Investments
in
non-controlled affiliated companies consist of investments in which
we own
five percent or more, but less than 25 percent, of the voting shares
of
the portfolio company or where we hold one or more seats on the portfolio
company’s Board of Directors. Investments in controlled affiliated
companies consist of investments in which we own 25 percent or more
of the
voting shares of the portfolio
company.
|
|
(7)
|
The
aggregate cost for federal income tax purposes of investments in
unaffiliated companies is $18,107,124. The gross unrealized appreciation
based on the tax cost for these securities is $1,732,194. The gross
unrealized depreciation based on the tax cost for these securities
is
$2,059,591.
|
|
(8)
|
The
aggregate cost for federal income tax purposes of investments in
non-controlled affiliated companies is $39,571,676. The gross unrealized
appreciation based on the tax cost for these securities is $333,269.
The
gross unrealized depreciation based on the tax cost for these securities
is $7,776,891.
|
|
(9)
|
The
aggregate cost for federal income tax purposes of investments in
controlled affiliated companies is $4,400,000. The gross unrealized
appreciation based on the tax cost for these securities is $0. The
gross
unrealized depreciation based on the tax cost for these securities
is
$679,950.
|
|
(10)
|
Continuum
Photonics, Inc., merged with Polatis, Ltd., to form Polatis,
Inc.
|
|
(11)
|
BridgeLux,
Inc., was previously named eLite Optoelectronics,
Inc.
|
|
(12)
|
Mersana
Therapeutics, Inc., was previously named Nanopharma
Corp.
|
|
(13)
|
D-Wave
Systems, Inc., is located and is doing business primarily in Canada.
We
invested in D-Wave Systems, Inc., through D-Wave USA, a Delaware
company.
Our investment is denominated in Canadian dollars and is subject
to
foreign currency translation. Refer to “Note 2. Summary of Significant
Accounting Policies.”
|
The
accompanying notes are an integral part of this consolidated
schedule.
77
|
HARRIS
& HARRIS GROUP, INC.
FOOTNOTE
TO CONSOLIDATED SCHEDULE OF
INVESTMENTS
|
VALUATION
PROCEDURES
Our
investments can be classified into five broad categories for valuation
purposes:
Equity-Related
Securities;
Investments
in Intellectual Property or Patents or Research and Development in Technology
or
Product Development;
Long-Term
Fixed-Income Securities;
Short-Term
Fixed-Income Securities; and
All
Other
Securities.
The
1940
Act requires periodic valuation of each investment in our portfolio to determine
net asset value. Under the 1940 Act, unrestricted securities with readily
available market quotations are to be valued at the current market value; all
other assets must be valued at "fair value" as determined in good faith by
or
under the direction of the Board of Directors.
Our
Board
of Directors is responsible for (1) determining overall valuation guidelines
and
(2) ensuring the valuation of investments within the prescribed
guidelines.
Our
Valuation Committee, comprised of all of our independent Board members, is
responsible for reviewing and approving the valuation of our assets within
the
guidelines established by the Board of Directors.
Fair
value is generally defined as the amount that an investment could be sold for
in
an orderly disposition over a reasonable time. Generally, to increase
objectivity in valuing our assets, external measures of value, such as public
markets or third-party transactions, are utilized whenever possible. Valuation
is not based on long-term work-out value, nor immediate liquidation value,
nor
incremental value for potential changes that may take place in the
future.
The
values assigned to these investments are based on available information and
do
not necessarily represent amounts that might ultimately be realized, as these
amounts depend on future circumstances and cannot reasonably be determined
until
the individual investments are actually liquidated or become
marketable.
Our
valuation policy with respect to the five broad investment categories is as
follows:
78
Equity-Related
Securities
Equity-related
securities, including warrants, are valued using one or more of the following
basic methods of valuation:
A.
Cost. This
method may be used in the early stages of a company’s development until
significant positive or negative events occur subsequent to the date of the
original investment that dictate a change to another valuation method.
B.
Analytical Method. The
analytical method is generally used to value an investment position when there
is no established public or private market in the company’s securities. This
valuation method is inherently imprecise and ultimately the result of
reconciling the judgments of our Valuation Committee members, based on the
data
available to them. The resulting valuation, although stated as a precise number,
is necessarily within a range of values that vary depending upon the
significance attributed to the various factors being considered.
The
analytical method considers the following factors:
|
·
|
The
cost of the Company’s investment;
|
|
·
|
Transactions
in a company's securities or unconditional firm offers by responsible
parties as a factor in determining
valuation;
|
| · |
The
financial condition and operating results of the
company;
|
| · |
The
long-term potential of the business and technology of the
company;
|
| · |
The
values of similar securities issued by companies in similar
businesses;
|
| · |
Multiples
to revenue, net income or EBITDA that similar securities issued by
companies in similar businesses receive;
|
| · |
The
proportion of the company's securities we own and the nature of any
rights
to require the company to register restricted securities under applicable
securities laws; and
|
| · |
The
rights and preferences of the class of securities we own as compared
to
other classes of securities the portfolio company has issued.
|
When
the
analytical method is used to value warrants, the Company utilizes the
Black-Scholes model.
79
C.
Private Market. The
private market method uses actual, executed, historical transactions in a
company’s securities by responsible third parties as a basis for valuation. The
private market method may also use, where applicable, unconditional firm offers
by responsible third parties as a basis for valuation.
D.
Public Market. The
public market method is used when there is an established public market for
the
class of the company’s securities held by us or into which our securities are
convertible. We discount market value for securities that are subject to
significant legal and contractual restrictions. Other securities, for which
market quotations are readily available, are carried at market value as of
the
time of valuation. Market value for securities traded on securities exchanges
or
on the Nasdaq Global Market is the last reported sales price on the day of
valuation. For other securities traded in the over-the-counter market and listed
securities for which no sale was reported on that day, market value is the
mean
of the closing bid price and asked price on that day. This method is the
preferred method of valuation when there is an established public market for
a
company’s securities, as that market provides the most objective basis for
valuation. If
for
any reason, the Valuation Committee determines that market quotations are not
reliable, such securities shall be fair valued by the Valuation Committee in
accordance with these Valuation Procedures.
Investments
in Intellectual Property or Patents or Research and Development in Technology
or
Product Development
These
investments are carried at fair value using the following basic methods of
valuation:
E.
Cost. This
method may be used in the early stages of commercializing or developing
intellectual property or patents or research and development in technology
or
product development until significant positive or adverse events occur
subsequent to the date of the original investment that dictate a change to
another valuation method.
F.
Analytical Method. The
analytical method is used to value an investment after analysis of the best
available outside information where the factual information available to us
dictates that an investment should no longer be valued under either the cost
or
private market method. This valuation method is inherently imprecise and
ultimately the result of reconciling the judgments of our Valuation Committee
members. The resulting valuation, although stated as a precise number, is
necessarily within a range of values that vary depending upon the significance
attributed to the various factors being considered. Some of the factors
considered may include the results of research and development, product
development progress, commercial prospects, term of patent and projected
markets.
80
The
analytical method considers the following factors:
|
·
|
The
cost of the investment;
|
|
·
|
Investments
in the same or substantially similar intellectual property or patents
or
research and development in technology or product development or
offers by
responsible third parties;
|
|
·
|
The
results of research and
development;
|
|
·
|
Product
development progress;
|
|
·
|
Commercial
prospects;
|
|
·
|
Term
of patent;
|
|
·
|
Projected
markets; and
|
|
·
|
Other
subjective factors.
|
G.
Private Market. The
private market method uses actual third-party investments in intellectual
property or patents or research and development in technology or product
development as a basis for valuation, using actual executed historical
transactions by responsible third parties. The private market method may also
use, where applicable, unconditional firm offers by responsible third parties
as
a basis for valuation.
As
of
December 31, 2007, and December 31, 2006, we do not have any investments in
intellectual property or patents or research and development in technologies
or
products.
Long-Term
Fixed-Income Securities
H.
Readily Marketable.
Long-term, fixed-income securities for which market quotations are readily
available are carried at market value as of the time of valuation using the
most
recent bid quotations when available.
I.
Not Readily Marketable.
Long-term, fixed-income securities for which market quotations are not readily
available are carried at fair value as determined in good faith by the Valuation
Committee on the basis of available data, which may include credit quality
and
interest rate analysis, as well as quotations from dealers and brokers. Where
such quotations are not available, fair value is determined using prices from
independent pricing services that the Board believes are reasonably reliable
and
based on reasonable price discovery procedures and data from other sources.
81
Short-Term
Fixed-Income Securities
J.
Short-Term Fixed-Income Securities
are
valued in the same manner as long-term fixed-income securities until the
remaining maturity is 60 days or less, after which time such securities may
be
valued at amortized cost if there is no concern over payment at
maturity.
All
Other Securities
K.
All Other Securities
are
reported at fair value as determined in good faith by the Valuation Committee.
As of December 31, 2007, and December 31, 2006, we did not have any of these
investments.
For
all
other securities, the reported values shall reflect the Valuation Committee's
judgment of fair values as of the valuation date using the outlined basic
methods of valuation or any other method of valuation within the prescribed
guidelines that the Valuation Committee determines after review and analysis
is
more appropriate for the particular kind of investment. They do not necessarily
represent an amount of money that would be realized if we had to sell such
assets in an immediate liquidation. Thus, valuations as of any particular date
are not necessarily indicative of amounts that we may ultimately realize as
a
result of future sales or other dispositions of investments we
hold.
82
|
NOTES
TO CONSOLIDATED FINANCIAL
STATEMENTS
|
NOTE
1. THE COMPANY
Harris
& Harris Group, Inc. (the
"Company," "us," "our" and "we"), is a venture capital company operating as
a
business development company ("BDC") under the Investment Company Act of 1940
("1940 Act"). We operate as an internally managed company whereby our officers
and employees, under the general supervision of our Board of Directors, conduct
our operations.
We
elected to become a BDC on July 26, 1995, after receiving the necessary
shareholder approvals. From September 30, 1992, until the election of BDC
status, we operated as a closed-end, non-diversified investment company under
the 1940 Act. Upon commencement of operations as an investment company, we
revalued all of our assets and liabilities in accordance with the 1940 Act.
Prior to September 30, 1992, we were registered and filed under the reporting
requirements of the Securities Exchange Act of 1934 (the "1934 Act") as an
operating company and, while an operating company, operated directly and through
subsidiaries.
Harris
& Harris Enterprises, Inc.,SM
is a 100
percent wholly owned subsidiary of the Company. Harris & Harris Enterprises,
Inc., is a partner in Harris Partners I, L.P.,SM
and is
taxed under Subchapter C of the Code (a “C Corporation”). Harris Partners I,
L.P, is a limited partnership and owned our interest in AlphaSimplex Group,
LLC.
The partners of Harris Partners I, L.P., are Harris & Harris Enterprises,
Inc., (sole general partner) and Harris & Harris Group, Inc., (sole limited
partner). Harris & Harris Enterprises, Inc., pays taxes on any non-passive
investment income generated by Harris Partners I, L.P. The Company consolidates
the results of its subsidiaries for financial reporting
purposes.
NOTE
2. SUMMARY OF SIGNIFICANT ACCOUNTING POLICIES
The
following is a summary of significant accounting policies followed in the
preparation of the consolidated financial statements:
Principles
of Consolidation.
The
consolidated financial statements have been prepared in accordance with
accounting principles generally accepted in the United States of America for
investment companies and include the accounts of the Company and its wholly
owned subsidiaries. All significant inter-company accounts and transactions
have
been eliminated in consolidation.
Use
of
Estimates.
The
preparation of the consolidated financial statements in conformity with
accounting principles generally accepted in the United States of America
requires management to make estimates and assumptions that affect the reported
amounts of assets and liabilities and contingent assets and liabilities as
of
December 31, 2007, and December 31, 2006, and the reported amounts of revenues
and expenses for the twelve months ended December 31, 2007, 2006, and 2005.
Actual results could differ from these estimates, and the differences could
be
material. The most significant estimates relate to the fair valuations of
certain of our investments. At December 31, 2007, and 2006, 54.6 percent and
45.4 percent, respectively, of the Company’s total assets represented portfolio
investments whose fair values have been determined by the Board of Directors
in
good faith in the absence of readily available market values.
83
Cash
and Cash Equivalents.
Cash and
cash equivalents includes demand deposits and money market instruments with
maturities of less than three months. Cash and cash equivalents are carried
at
cost which approximates fair value.
Portfolio
Investment Valuations.
Investments are stated at "value" as defined in the 1940 Act and in the
applicable regulations of the SEC. Value, as defined in Section 2(a)(41) of
the
1940 Act, is (i) the market price for those securities for which a market
quotation is readily available and (ii) the fair value as determined in good
faith by, or under the direction of, the Board of Directors for all other
assets. (See "Valuation Procedures" in the "Footnote to Consolidated Schedule
of
Investments.") At December 31, 2007, and 2006, our financial statements include
private venture capital investments valued at $78,110,384 and $53,667,831,
respectively, the fair values of which were determined in good faith by, or
under the direction, of the Board of Directors. Upon sale of investments, the
values that are ultimately realized may be different from what is presently
estimated. The difference could be material.
Foreign
Currency Translation.
The
accounting records of the Company are maintained in U.S. dollars. All assets
and
liabilities denominated in foreign currencies are translated into U.S. dollars
based on the rate of exchange of such currencies against U.S. dollars on the
date of valuation. For the year ended December 31, 2007, included in the net
decrease in unrealized depreciation on investments was a $307,636 gain resulting
from foreign currency translation.
Securities
Transactions.
Securities transactions are accounted for on the date the securities are
purchased or sold (trade date).
Interest
Income Recognition. Interest
income, adjusted for amortization of premium and accretion of discount, is
recorded on accrual basis. The Company ceases accruing interest when securities
are determined to be non-income producing and writes off any previously accrued
interest.
Realized
Gain or Loss and Unrealized Appreciation or Depreciation of Portfolio
Investments. Realized
gain or loss is recognized when an investment is disposed of and is computed
as
the difference between the Company’s cost basis in the investment at the
disposition date and the net proceeds received from such disposition. Realized
gains and losses on investment transactions are determined by specific
identification. Unrealized appreciation or depreciation is computed as the
difference between the fair value of the investment and the cost basis of such
investment.
Stock-Based
Compensation.
The
Company has a stock-based employee compensation plan. The Company accounts
for
the plan in accordance with the provisions of Statement of Financial Accounting
Standards ("SFAS") No. 123(R), "Share-Based Payment." See “Note 4. Stock-Based
Compensation” for further discussion.
84
Income
Taxes.
As we
intend to qualify as a RIC under Subchapter M of the Internal Revenue Code,
the
Company does not provide for income taxes. Our taxes are accounted for in
accordance with SFAS No. 109,
"Accounting for Income Taxes."
However,
we pay federal, state and local income taxes on behalf of our wholly owned
subsidiary, Harris & Harris Enterprises, Inc., which is a C corporation. See
“Note 8. Income Taxes."
In
June
2006, the FASB issued Interpretation 48, "Accounting for Uncertainty in Income
Taxes" (“FIN 48”),
an interpretation of SFAS No. 109. FIN 48 clarifies the accounting and
reporting for income taxes where interpretation of the law is uncertain.
FIN 48 prescribes a comprehensive model for the financial statement
recognition, measurement, presentation and disclosure of income tax
uncertainties with respect to positions taken or expected to be taken in income
tax returns. The Company adopted FIN 48 on January 1, 2007, which had no
effect on the Company's financial statements. The Company recognizes interest
and penalties in income tax expense. See “Note
8.
Income Taxes”
for
further discussion.
Restricted
Funds.
The
Company maintains a rabbi trust for the purposes of accumulating funds to
satisfy the obligations incurred by us for the Supplemental Executive Retirement
Plan ("SERP") under the employment agreement with Charles E.
Harris.
Property
and Equipment.
Property
and equipment are included in "Other Assets" and are carried at cost, less
accumulated depreciation of $336,877. Depreciation is provided using the
straight-line method over the estimated useful lives of the premises and
equipment.
Concentration
of Credit Risk.
The
Company places its cash and cash equivalents with financial institutions and,
at
times, cash held in checking accounts may exceed the Federal Deposit Insurance
Corporation insured limit.
Recent
Accounting Pronouncements.
In
September 2006, FASB issued SFAS No. 157, "Fair Value Measurements." This
statement defines fair value, establishes a framework for measuring fair value
and expands disclosures about fair value measurements. SFAS No. 157 is
effective for us on January 1, 2008. The adoption of SFAS No. 157 will
not have a material impact on our consolidated financial
statements.
In
February 2007, the FASB issued Statement No. 159, "The Fair Value Option
for Financial Assets and Financial Liabilities" (“SFAS No. 159”).
SFAS No. 159 would allow the Company an irrevocable election to measure
certain financial assets and liabilities at fair value, with unrealized gains
and losses on the elected items recognized in earnings at each reporting period.
The fair value option may only be elected at the time of initial recognition
of
a financial asset or financial liability or upon the occurrence of certain
specified events. The election is applied on an instrument-by-instrument basis,
with a few exceptions, and is applied only to entire instruments and not to
portions of instruments. SFAS No. 159 also provides expanded disclosure
requirements regarding the effects of electing the fair value option on the
financial statements. SFAS No. 159 is effective prospectively for fiscal
years beginning after November 15, 2007. The Company is currently
evaluating this Statement. However, as investments are carried at fair value,
the Company does not anticipate that this Statement will have a significant
impact on the consolidated financial statements.
85
NOTE
3. INVESTMENTS
The
private placement portfolio at fair value consisted of the following geographic
regions at December 31, 2007, and 2006:
|
December
31, 2007
|
||||||||||
|
Geographic Region
|
Fair Value
|
Percentage of
Total Private
Placement
Portfolio
|
Percentage
of Net Assets
|
|||||||
|
West
|
$
|
50,124,606
|
64.2
|
%
|
36.2
|
%
|
||||
|
Northeast
|
$
|
16,849,547
|
21.6
|
%
|
12.2
|
%
|
||||
|
Midwest
|
$
|
4,659,743
|
6.0
|
%
|
3.4
|
%
|
||||
|
Southeast
|
$
|
4,250,000
|
5.4
|
%
|
3.1
|
%
|
||||
|
Outside
U.S.
|
$
|
2,226,488
|
2.8
|
%
|
1.6
|
%
|
||||
|
$
|
78,110,384
|
100.0
|
%
|
|||||||
|
December
31, 2006
|
||||||||||
|
Geographic
Region
|
Fair Value
|
Percentage of
Total Private
Placement
Portfolio
|
Percentage
of Net Assets
|
|||||||
|
West
|
$
|
29,759,833
|
55.5
|
%
|
26.1
|
%
|
||||
|
Northeast
|
$
|
11,856,596
|
22.1
|
%
|
10.4
|
%
|
||||
|
Midwest
|
$
|
6,834,958
|
12.7
|
%
|
6.0
|
%
|
||||
|
Southeast
|
$
|
3,500,000
|
6.5
|
%
|
3.1
|
%
|
||||
|
Outside
U.S.
|
$
|
1,716,444
|
3.2
|
%
|
1.5
|
%
|
||||
|
$
|
53,667,831
|
100.0
|
%
|
|||||||
NOTE
4. STOCK-BASED COMPENSATION
On
March
23, 2006, the Board of Directors of the Company voted to terminate the Employee
Profit-Sharing Plan and to establish the Stock Plan, subject to shareholder
approval. This proposal was approved at the May 4, 2006, Annual Meeting of
Shareholders. The Stock Plan provides for the grant of equity-based awards
of
stock options to our officers, employees and directors (subject to receipt
of an
exemptive order described below) and restricted stock (subject to receipt of
an
exemptive order described below) to our officers and employees who are selected
by our Compensation Committee for participation in the plan and subject to
compliance with the 1940 Act.
86
On
July
11, 2006, the Company filed an application with the SEC regarding certain
provisions of the Stock Plan, and on June 29, 2007, the Company responded to
comments from the SEC on the application. In the event that the SEC provides
the
exemptive relief requested by the application, and we receive any additional
stockholder approval required by the SEC, the Compensation Committee may, in
the
future, authorize awards of stock options under the Stock Plan to non-employee
directors of the Company and authorize grants of restricted stock to
employees.
A
maximum
of 20 percent of our total shares of our common stock issued and outstanding
are
available for awards under the Stock Plan. Under the Stock Plan, no more than
25
percent of the shares of stock reserved for the grant of the awards under the
Stock Plan may be restricted stock awards at any time during the term of the
Stock Plan. If any shares of restricted stock are awarded, such awards will
reduce on a percentage basis the total number of shares of stock for which
options may be awarded. If the Company does not receive exemptive relief from
the SEC to issue restricted stock, all shares granted under the Stock Plan
may
be subject to stock options. No more than 1,000,000 shares of our common stock
may be made subject to awards under the Stock Plan to any individual in any
year.
On
June
26, 2006, the Compensation Committee of the Board of Directors of the Company
approved individual stock option awards for certain officers and employees
of
the Company. Both non-qualified stock options ("NQSOs") and incentive stock
options ("ISOs"), subject to the limitations of Section 422 of the Internal
Revenue Code, were awarded under the Stock Plan. The terms and conditions of
the
stock options granted were determined by the Compensation Committee and set
forth in award agreements between the Company and each award recipient. Options
to purchase a total of 3,958,283 shares of stock were granted with vesting
periods ranging from December 2006 to June 2014 and with an exercise price
of
$10.11. Upon exercise, the shares will be issued from our previously authorized
shares. The full Board of Directors ratified and approved the grants on August
3, 2006, on which date the Company's common stock price fluctuated between
$9.76
and $10.00.
On
June
27, 2007, the Compensation Committee of the Board of Directors and the full
Board of Directors of the Company approved a new grant of individual NQSO awards
for certain officers and employees of the Company. The terms and conditions
of
the stock options granted were set forth in award agreements between the Company
and each award recipient entered into on that date. Options to purchase a total
of 1,700,609 shares of stock were granted with vesting periods ranging from
December 2007 to June 2014 and with an exercise price of $11.11, which was
the
closing volume weighted average price of our shares of common stock on June
27,
2007. Upon exercise, the shares would be issued from our previously authorized
but unissued shares.
87
The
Company accounts for the Stock Plan in accordance with the provisions of SFAS
No. 123(R), “Share-Based Payment,” which requires that we determine the fair
value of all share-based payments to employees, including the fair value of
grants of employee stock options, and record these amounts as an expense in
the
Statement of Operations over the vesting period with a corresponding increase
to
our additional paid-in capital. At December 31, 2007, the increase to our
operating expenses was offset by the increase to our additional paid-in capital,
resulting in no net impact to our net asset value. Additionally, the Company
does not record the tax benefits associated with the expensing of stock options,
because the Company currently intends to qualify as a RIC under Subchapter
M of
the Code.
An
option's expected term is the estimated period between the grant date and the
exercise date of the option. As the expected term period increases, the fair
value of the option and the non-cash compensation cost will also increase.
The
expected term assumption is generally calculated using historical stock option
exercise data. The Company does not have historical exercise data to develop
such an assumption. In cases where companies do not have historical data and
where the options meet certain criteria, SEC Staff Accounting Bulletin 107
("SAB
107") provides the use of a simplified expected term calculation. Accordingly,
the Company calculated the expected terms using the SAB 107 simplified
method.
Expected
volatility is the measure of how the stock's price is expected to fluctuate
over
a period of time. An increase in the expected volatility assumption yields
a
higher fair value of the stock option. Expected volatility factors for the
stock
options were based on the historical fluctuations in the Company’s stock price
over a period commensurate with the expected term of the option, adjusted for
stock splits and dividends.
The
expected dividend yield assumption is traditionally calculated based on a
company's historical dividend yield. An increase to the expected dividend yield
results in a decrease in the fair value of option and resulting compensation
cost. Although the Company has declared deemed dividends in previous years,
most
recently in 2005, the amounts and timing of any future dividends cannot be
reasonably estimated. Therefore, for purposes of calculating fair value, the
Company has assumed an expected dividend yield of 0 percent.
The
risk-free interest rate assumptions are based on the annual yield on the
measurement date of a zero-coupon U.S Treasury bond the maturity of which equals
the option’s expected term. Higher assumed interest rates yield higher fair
values.
The
amount of non-cash, stock-based compensation expense recognized in the
Consolidated Statements of Operations is based on the fair value of the awards
the Company expects to vest, recognized over the vesting period on a
straight-line basis for each award, and adjusted for actual forfeitures that
occur before vesting. The forfeiture rate is estimated at the time of grant
and
revised, if necessary, in subsequent periods if the actual forfeiture rate
differs from the estimated rate and is accounted for in the current period
and
prospectively.
88
The
fair
value of each stock option award is estimated on the date of grant using the
Black-Scholes option pricing model as permitted by SFAS No. 123(R). The stock
options granted on June 26, 2006, were awarded in five different grant types,
each with different contractual terms. The assumptions used in the calculation
of fair value of the stock options granted on June 26, 2006, using the
Black-Scholes model for each contract term were as follows:
|
Type of Award
|
|
Term
|
|
Number
of Options
Granted
|
|
Expected
Term
in Yrs
|
|
Expected
Volatility
Factor
|
|
Expected
Dividend
Yield
|
|
Risk-free
Interest
Rates
|
|
Weighted
Average
Fair
Value
Per Share
|
||||||||
|
Non-qualified
stock options
|
1 Year
|
1,001,017
|
0.75
|
37.4%
|
|
0%
|
|
5.16%
|
|
$
|
1.48
|
|||||||||||
|
Non-qualified
stock options
|
2 Years
|
815,000
|
1.625
|
45.2%
|
0%
|
|
5.12%
|
|
$
|
2.63
|
||||||||||||
|
Non-qualified
stock options
|
3 Years
|
659,460
|
2.42
|
55.7%
|
|
0%
|
|
5.09%
|
|
$
|
3.81
|
|||||||||||
|
Non-qualified
stock options
|
10 Years
|
|
690,000
|
5.75
|
75.6%
|
|
0%
|
|
5.08%
|
|
$
|
6.94
|
||||||||||
|
Incentive
stock options
|
10 Years
|
792,806
|
7.03
|
75.6%
|
|
0%
|
|
5.08%
|
|
$
|
7.46
|
|||||||||||
|
|
||||||||||||||||||||||
|
Total
|
3,958,283
|
$
|
4.25
|
|||||||||||||||||||
The
stock
options granted on June 27, 2007, were awarded in four different grant types,
each with different contractual terms. The assumptions used in the calculation
of fair value of the stock options granted on June 27, 2007, using the
Black-Scholes model for each contract term were as follows:
|
Type
of Award
|
Contractual
Term
|
Number
of Options
Granted
|
Expected
Term
in Yrs
|
Expected
Volatility
Factor
|
Expected
Dividend
Yield
|
Risk-free
Interest
Rates
|
Fair
Value
Per Share
|
|||||||||||||||
|
Non-qualified
stock options
|
1.5
Years
|
380,000
|
1
|
42.6%
|
|
0%
|
|
4.93%
|
|
$
|
2.11
|
|||||||||||
|
|
||||||||||||||||||||||
|
Non-qualified
stock options
|
2.5
Years
|
600,540
|
2
|
40.1%
|
|
0%
|
|
4.91%
|
|
$
|
2.92
|
|||||||||||
|
Non-qualified
stock options
|
3.5
Years
|
338,403
|
3
|
44.7%
|
|
0%
|
|
4.93%
|
|
$
|
3.94
|
|||||||||||
|
Non-qualified
stock options
|
9
Years
|
381,666
|
Ranging
from 4.75- 6.28
|
Ranging
from 57.8% to 59.9%
|
|
0%
|
|
Ranging
from 4.97% to 5.01%
|
|
Ranging
from $5.92 to $6.85
|
||||||||||||
|
Total
|
1,700,609
|
|||||||||||||||||||||
89
For
the
years ended December 31, 2007, and December 31, 2006, the Company recognized
$8,050,807 and $5,038,956 of compensation expense in the Consolidated Statements
of Operations, respectively. As of December 31, 2007, there was approximately
$7,810,508 of unrecognized compensation cost related to unvested stock option
awards. This cost is expected to be recognized over a weighted-average period
of
approximately 1.7 years.
For
the
year ended December 31, 2007, a total of 999,556 options were exercised for
total proceeds to the Company of $10,105,511. For the year ended December 31,
2006, a total of 258,672 shares were exercised for total proceeds to the Company
of $2,615,190. At December 31, 2006, the Company had a broker receivable
totaling $819,905 for proceeds from stock option exercises transacted on
December 29, 2006. The Company received these proceeds on January 3,
2007.
The
grant
date fair value of options vested during the years ended December 31, 2007,
and
December 31, 2006, was $6,851,874 and $3,781,681, respectively.
For
the
years ended December 31, 2007, and December 31, 2006, the calculation of the
net
decrease in net assets resulting from operations per share excludes the stock
options because such options were anti-dilutive. The options may be dilutive
in
future periods in which there is a net increase in net assets resulting from
operations, in the event that there is a significant increase in the average
stock price in the stock market or significant decreases in the amount of
unrecognized compensation cost.
A
summary
of the changes in outstanding stock options is as follows:
|
Shares
|
|
Weighted
Average
Exercise
Price
|
|
Weighted
Average
Grant Date
Fair Value
|
|
Weighted
Average
Remaining
Contractual
Term (Yrs)
|
|
Aggregate
Intrinsic
Value
|
||||||||
|
Options
Outstanding at December
31, 2006
|
3,699,611
|
$
|
10.11
|
$
|
4.43
|
|||||||||||
|
Granted
|
1,700,609
|
$
|
11.11
|
$
|
3.68
|
3.43
|
||||||||||
|
Exercised
|
(999,556
|
)
|
$
|
10.11
|
$
|
1.97
|
||||||||||
|
Forfeited
or Expired
|
(432,920
|
)
|
$
|
3.99
|
||||||||||||
|
Options
Outstanding at December
31, 2007
|
3,967,744
|
$
|
10.54
|
$
|
4.77
|
4.58
|
$
|
0
|
||||||||
|
Options
Exercisable at December
31, 2007
|
1,717,125
|
$
|
10.43
|
$
|
4.45
|
4.18
|
$
|
0
|
||||||||
|
Options
Exercisable and Expected to be Exercisable
at December 31, 2007
|
3,858,226
|
$
|
10.55
|
$
|
4.70
|
4.47
|
$
|
0
|
||||||||
90
The
aggregate intrinsic value in the table above with respect to options
outstanding, exercisable and expected to be exercisable, is calculated as the
difference between the Company's closing stock price of $8.79 on the last
trading day of 2007 and the exercise price, multiplied by the number of
in-the-money options. This calculation represents the total pre-tax intrinsic
value that would have been received by the option holders had all options been
fully vested and all option holders exercised their awards on December 31,
2007.
For
the
twelve months ended December 31, 2007, the aggregate intrinsic value of the
999,556 options exercised was $1,700,552. For the twelve months ended December
31, 2006, the aggregate intrinsic value for the 258,672 options exercised was
$512,171.
Unless
earlier terminated by our Board of Directors, the Stock Plan will expire on
May
4, 2016. The expiration of the Stock Plan will not by itself adversely affect
the rights of plan participants under awards that are outstanding at the time
the Stock Plan expires. Our Board of Directors may terminate, modify or suspend
the plan at any time, provided that no modification of the plan will be
effective unless and until any required shareholder approval has been obtained.
The Compensation Committee may terminate, modify or amend any outstanding award
under the Stock Plan at any time, provided that in such event, the award holder
may exercise any vested options prior to such termination of the Stock Plan
or
award.
NOTE
5. EMPLOYEE PROFIT-SHARING PLAN
Prior
to
the adoption of the Stock Plan, the Company operated the Amended and Restated
Harris & Harris Group, Inc. Employee Profit-Sharing Plan (the "2002 Plan").
Effective May 4, 2006, the 2002 Plan was terminated.
The
2002
Plan (and its predecessor) provided for profit sharing by our officers and
employees equal to 20 percent of our "qualifying income" for that plan
year.
As
soon
as practicable following the year-end, the Compensation Committee determined
whether, and if so how much, qualifying income existed for a plan year.
Approximately 90 percent of the amount determined by the Compensation Committee
was then paid out to plan participants pursuant to the distribution percentages
set forth in the 2002 Plan. The remaining payment was paid out after we
finalized our tax returns for that plan year.
At
December 31, 2006, we accrued $261,661 for profit sharing related to the 2005
plan year. On March 1, 2006, the Company paid $1,897,072 to plan participants
(employees and former employees), which represented approximately 90 percent
of
the total estimated profit-sharing payment for 2005. The balance of $261,661
related to the 2005 plan year was paid on January 31, 2007, upon finalization
of
our tax returns.
91
NOTE
6. DISTRIBUTABLE EARNINGS
As
of
December 31, 2007, December 31, 2006, and December 31, 2005, there were no
distributable earnings. The difference between the book basis and tax basis
components of distributable earnings is primarily nondeductible deferred
compensation and net operating losses.
On
December 20, 2005, the Company declared a designated undistributed capital
gain
dividend ("deemed dividend") for shareholders of record as of December 31,
2005.
The deemed dividend for 2005 was $23,206,763. See “Note 8. Income Taxes.” The
Company did not declare dividends for the years ended December 31, 2007, or
December 31, 2006.
NOTE
7. EMPLOYEE BENEFITS
Employment
Agreement with CEO
Pursuant
to his employment agreement, as most recently amended as of August 2, 2007
(the
"Employment Agreement"), during the period of employment, Charles E. Harris
is
to receive compensation in the form of base salary, with automatic yearly
adjustments to reflect inflation, which amounted to a minimum required base
salary of $246,651 for 2006. In addition, the Board may increase such salary,
and subsequently decrease it, but not below the level provided for by the
automatic adjustments described above. Mr. Harris's base salary for 2006 was
increased to $300,000 (thereby also increasing his SERP benefit as described
below) in part in recognition of a 74 percent decrease in Mr. Harris's
profit-sharing allocation in recent years in order to provide additional profit
sharing to other employees. This was the first salary increase for Mr. Harris,
other than cost-of-living adjustments, since 1994. Mr. Harris's base salary
for
2007 and 2008 was increased to $306,187 and $314,623, respectively, based on
cost-of-living adjustments.
Under
his
employment agreement, Mr. Harris is entitled to participate in all compensation
and employee benefit plans or programs, and to receive all benefits,
perquisites, and emoluments for which salaried employees are eligible. Under
the
Employment Agreement, we furnish Mr. Harris with certain perquisites, which
include a company car, health-club membership, membership in certain social
or
country clubs, a reimbursement for an annual physical examination and up to
a
$5,000 annual reimbursement, adjusted for inflation, over the period of the
agreement, for personal financial or tax advice.
The
Employment Agreement also provides Mr. Harris with life insurance for the
benefit of his designated beneficiary in the amount of at least $2,000,000;
provides reimbursement for uninsured medical expenses, not to exceed $10,000
per
annum, adjusted for inflation, over the period of the agreement; provides Mr.
Harris and his spouse with long-term care insurance; and provides Mr. Harris
with disability insurance providing for continuation of 100 percent of his
base
salary for a specified period. These benefits are for the term of the Employment
Agreement. The Employment Agreement provides that the term of Mr. Harris's
employment may not be extended beyond December 31, 2008, unless a committee
of
the Board consisting of non-interested Directors extends the date by one year
pursuant to the Executive Mandatory Retirement Benefit Plan, and Mr. Harris
agrees to serve beyond December 31, 2008.
92
Mr.
Harris's Employment Agreement also provides for a supplemental executive
retirement plan (the "SERP") and a severance compensation agreement for his
benefit as discussed below.
In
the
event of termination without cause or by constructive discharge, Mr. Harris’s
Employment Agreement provides for the continuation of certain benefits over
specified periods, as well as severance pay, payable to Mr. Harris (or to his
estate if he dies before all payments are made), equal to two times his base
salary distributed over a period of two years.
Other
than Mr. Harris, our Chairman and Chief Executive Officer, none of our executive
officers has a change in control agreement. None of our executive officers
is
entitled to any special payments solely upon a change in control.
In
addition, Mr. Harris is entitled to receive severance pay pursuant to the
severance compensation agreement that he entered into with us, effective August
15, 1990, and amended and restated effective as of January 1, 2005. The
severance compensation agreement provides that if, following a change in our
control, as defined in the agreement, Mr. Harris’s employment is terminated by
us without cause or by him within one year of such change in control, he shall
be entitled to receive compensation in a lump sum payment equal to 2.99 times
his average base salary plus other amounts included in Mr. Harris’s income as
compensation from the Company (but excluding bonus, incentive, profit sharing
plan and equity compensation) as in effect over the most recent five years
preceding the year in which the change in control occurred. Under the severance
compensation agreement, Mr. Harris is also entitled to receive a lump sum
payment equal to any amounts forfeited on account of his termination, under
any
employee pension benefit plan, including benefits under the Company’s executive
mandatory retirement benefit plan. In addition, he is entitled to receive
medical and health insurance coverage under the Company’s retiree medical
benefit plan and all other benefits he would be eligible to receive in the
event
of termination without cause or by constructive discharge, although no duplicate
benefits will be provided. In the event that Mr. Harris is entitled to receive
2.99 times his base salary under the severance compensation agreement, he shall
not also be paid two times his base salary under the employment
agreement.
SERP
The
Employment Agreement provides that we adopt a supplemental executive retirement
plan (the "SERP") for the benefit of Mr. Harris. Under the SERP, we will cause
an amount equal to one-twelfth of Mr. Harris's current annual salary to be
credited each month to a special account maintained on our books for the benefit
of Mr. Harris, provided that Mr. Harris is employed by us on the last business
day of such month. The amounts credited to the SERP Account are deemed invested
or reinvested in such investments as are requested by Mr. Harris and agreed
to
by the Company. The SERP Account is credited and debited to reflect the deemed
investment returns, losses and expenses attributed to such deemed investments
and reinvestments in accordance with the terms of the SERP. Mr. Harris's benefit
under the SERP equals the balance in the SERP Account and such benefit will
always be 100 percent vested (i.e., not forfeitable).
93
In
2005,
Mr. Harris received a $125,000 distribution from the SERP Account. The balance
of the SERP Account will be paid in a lump sum on May 30, 2008, and any
subsequent balance will be paid on July 31, 2009.
If
Mr.
Harris dies before the entire benefit under the SERP Account has been paid
to
him, the amount remaining in the SERP Account will be distributed to his
beneficiary in a lump-sum payment on the 90th
day
after the date of his death.
We
have
established a rabbi trust for the purpose of accumulating funds to satisfy
the
obligations incurred by us under the SERP, which amounted to $2,667,020 and
$2,149,785 at December 31, 2007, and 2006, respectively, and is included in
accounts payable and accrued liabilities. The restricted funds for the SERP
Account totaled $2,667,020 and $2,149,785 at December 31, 2007, and 2006,
respectively. Mr. Harris's rights to benefits pursuant to this SERP will be
no
greater than those of a general creditor of us.
401(k)
Plan
We
adopted a 401(k) Plan covering substantially all of our employees. Matching
contributions to the plan are at the discretion of the Compensation Committee.
For the year ended December 31, 2007, the Compensation Committee approved a
100
percent match which amounted to $176,873. The 401(k) Company match for the
years
ended December 31, 2006 and 2005 was $155,000 and $119,360,
respectively.
Medical
Benefit Retirement Plan
On
June
30, 1994, we adopted a plan to provide medical and dental insurance for
retirees, their spouses and dependents who, at the time of their retirement,
have ten years of service with us and have attained 50 years of age or have
attained 45 years of age and have 15 years of service with us. On February
10,
1997, we amended this plan to include employees who have seven full years of
service and have attained 58 years of age. On November 3, 2005, we amended
this
plan to reverse the 1997 amendment for future retirees and to remove dependents
other than spouses from the plan. The coverage is secondary to any government
or
subsequent employer provided health insurance plans. The annual premium cost
to
us with respect to the entitled retiree shall not exceed $12,000, subject to
an
index for inflation. On December 8, 2003, the Medicare Prescription Drug,
Improvement and Modernization Act of 2003 (the "Act") was signed into law.
The
Act introduces a prescription drug benefit under Medicare (Medicare Part D)
as
well as a federal subsidy to sponsors of retiree health care benefit plans
that
provide a benefit that is at least actuarially equivalent to Medicare Part
D.
The Act, which went into effect January 1, 2006, provides a 28 percent subsidy
for post-65 prescription drug benefits. Our liability assumes our plan is
actuarially equivalent under the Act.
94
The
stock
options of retirees who qualify for the Medical Benefit Retirement Plan will
remain exercisable (to the extent exercisable at the time of the optionee’s
termination) post retirement, if such retiree executes a post-termination
non-solicitation agreement in a form reasonably acceptable to the Company,
until
the expiration of its term.
The
plan
is unfunded and has no assets. The following disclosures about changes in the
benefit obligation under our plan to provide medical and dental insurance for
retirees are as of the measurement date of December 31:
|
2007
|
|
2006
|
|||||
|
Accumulated
Postretirement Benefit Obligation at Beginning of Year
|
$
|
696,827
|
$
|
675,334
|
|||
|
Service
Cost
|
102,676
|
79,381
|
|||||
|
Interest
Cost
|
33,935
|
33,786
|
|||||
|
Actuarial
(Gain)/Loss
|
(196,248
|
)
|
(84,879
|
)
|
|||
|
Benefits
Paid
|
(8,445
|
)
|
(6,795
|
)
|
|||
|
Accumulated
Postretirement Benefit Obligation at End of Year
|
$
|
628,745
|
$
|
696,827
|
|||
In
accounting for the plan, the assumption made for the discount rate was 6.55
percent and 5.75 percent for the years ended December 31, 2007, and 2006,
respectively. The assumed health care cost trend rates in 2007 were 9 percent
grading to 6 percent over three years for medical and 5 percent per year for
dental. The assumed health care cost trend rates in 2006 were 9 percent grading
to 6 percent over three years for medical and 3 percent per year for dental.
The
effect on disclosure information of a one percentage point change in the assumed
health care cost trend rate for each future year is shown below.
|
1% Decrease
in Rates
|
Assumed
Rates
|
1% Increase
in Rates
|
||||||||
|
Aggregated
Service and Interest Cost
|
$
|
105,317
|
$
|
136,611
|
$
|
179,692
|
||||
|
Accumulated
Postretirement Benefit Obligation
|
$
|
606,717
|
$
|
628,745
|
$
|
883,758
|
||||
The
net
periodic postretirement benefit cost for the year is determined as the sum
of
service cost for the year, interest on the accumulated postretirement benefit
obligation and amortization of the transition obligation (asset) less previously
accrued expenses over the average remaining service period of employees expected
to receive plan benefits. The following is the net periodic postretirement
benefit cost for the years ended December 31, 2007, 2006, and
2005:
95
|
2007
|
|
2006
|
|
2005
|
||||||
|
Service
Cost
|
$
|
102,676
|
$
|
79,381
|
$
|
49,990
|
||||
|
Interest
Cost on Accumulated Postretirement Benefit Obligation
|
33,935
|
33,786
|
32,573
|
|||||||
|
Amortization
of Transition Obligation
|
0
|
0
|
0
|
|||||||
|
Amortization
of Net (Gain)/Loss
|
(6,234
|
)
|
0
|
0
|
||||||
|
Net
Periodic Post Retirement Benefit Cost
|
$
|
130,377
|
$
|
113,167
|
$
|
82,563
|
||||
The
Company estimates the following benefits to be paid in each of the following
years:
|
2008
|
$
|
18,489
|
||
|
2009
|
$
|
23,639
|
||
|
2010
|
$
|
25,584
|
||
|
2011
|
$
|
20,213
|
||
|
2012
|
$
|
21,663
|
||
|
2013
through 2017
|
$
|
135,078
|
The
contribution payable for 2008 is estimated to be $18,489.
On
December 31, 2006, the Company adopted the recognition and disclosure provisions
of SFAS No. 158. SFAS No. 158 required the Company to recognize the funded
status of its retirement benefit plans in the December 31, 2006 statement of
assets and liabilities with a corresponding adjustment to net assets. The
adjustment to net assets at adoption of $61,527 represents the net unrecognized
actuarial gains of $95,145 applicable to the healthcare benefit plan net of
$33,618 of unrecognized actuarial losses applicable to the Executive Mandatory
Retirement Benefit Plan. Such amounts previously were reflected as a net
increase of the plan's funded status in the Company's statement of assets and
liabilities pursuant to the provisions of SFAS Nos. 106 and 187. These amounts
will be subsequently recognized as net periodic benefit cost pursuant to the
Company's historical accounting policy for amortizing such amounts. Further,
actuarial gains and losses that arise in subsequent periods and are not
recognized as net periodic benefit cost in the same periods will be recognized
as a component of net assets. Those amounts will be subsequently recognized
as a
component of net periodic benefit cost on the same basis as the amounts
recognized at adoption of SFAS No. 158.
For
the
year ended December 31, 2007, net unrecognized actuarial gains, which resulted
from the increase in the discount rate referred to above, increased by $190,014,
which represents $196,248 of actuarial gains arising during the year, net of
a
$6,234 reclassification adjustment which reduced the net periodic benefit cost
for the year.
96
Executive
Mandatory Retirement Benefit Plan
On
March
20, 2003, in order to begin planning for eventual management succession, the
Board of Directors voted to establish the Executive Mandatory Retirement Benefit
Plan for individuals who are employed by us in a bona fide executive or high
policy-making position. The plan was amended and restated effective January
1,
2005, to comply with certain provisions of the Internal Revenue Code. There
are
currently four individuals that qualify under the plan: Charles E. Harris,
the
Chairman and Chief Executive Officer, Douglas W. Jamison, the President and
Chief Operating Officer, Daniel B. Wolfe, the Chief Financial Officer, and
Mel
P. Melsheimer, the former President, Chief Operating Officer and Chief Financial
Officer. Under this plan, mandatory retirement takes place effective December
31
of the year in which the eligible individuals attain the age of 65. On an annual
basis beginning in the year in which the designated individual attains the
age
of 65, a committee of the Board consisting of non-interested directors may
determine for our benefit to postpone the mandatory retirement date for that
individual for one additional year.
Under
applicable law prohibiting discrimination in employment on the basis of age,
we
can impose a mandatory retirement age of 65 for our executives or employees
in
high policy-making positions only if each employee subject to the mandatory
retirement age is entitled to an immediate retirement benefit at retirement
age
of at least $44,000 per year. The benefits payable at retirement to Mr. Harris
and Mr. Melsheimer under our existing 401(k) plan do not equal this threshold.
The plan was established to provide the difference between the benefit required
under the age discrimination laws and that provided under our existing plans.
For individuals retiring after 2007, the benefit under the plan is paid to
the
qualifying individual in the form of a lump sum, and is paid six months and
one
day after the individual’s separation from service with the Company, pursuant to
certain exceptions.
At
December 31, 2007, and 2006, we had accrued $382,932 and $347,075, respectively,
for benefits under this plan. At December 31, 2007, $235,630 was accrued for
Mr.
Melsheimer and $147,302 was accrued for Mr. Harris. Currently, there is no
accrual for Mr. Jamison or Mr. Wolfe. This benefit will be unfunded, and the
expense as it relates to Mr. Melsheimer and Mr. Harris is being amortized over
the fiscal periods through the years ended December 31, 2004, and 2008,
respectively. On December 31, 2004, Mr. Melsheimer retired pursuant to the
Executive Mandatory Retirement Benefit Plan. His annual benefit under the plan
is $22,915. Mr. Harris's projected mandatory benefit will be approximately
$147,302 and paid as a lump sum six months and one day after his
retirement.
NOTE
8. INCOME TAXES
We
filed
for the 1999 tax year to elect treatment as a regulated investment company
("RIC") under Subchapter M of the Internal Revenue Code of 1986 (the "Code")
and
qualified for the same treatment for the years 2000 through 2007. However,
there
can be no assurance that we will qualify as a RIC for 2008 or subsequent years.
97
In
the
case of a RIC, which furnishes capital to development corporations, there is
an
exception to the rule relating to the diversification of investments required
to
qualify for RIC treatment. This exception is available only to registered
management investment companies which the SEC determines to be principally
engaged in the furnishing of capital to other corporations which are principally
engaged in the development or exploitation of inventions, technological
improvements, new processes, or products not previously generally available
("SEC Certification"). We have received SEC Certification since 1999, including
for 2006, but it is possible that we may not receive SEC Certification in future
years.
In
addition, under certain circumstances, even if we qualified for Subchapter
M
treatment for a given year, we might take action in a subsequent year to ensure
that we would be taxed in that subsequent year as a C Corporation, rather than
as a RIC. As a RIC, we must, among other things, distribute at least 90 percent
of our investment company taxable income and may either distribute or retain
our
realized net capital gains on investments.
Provided
that a proper election is made, a corporation taxable under Subchapter C of
the
Code or a C Corporation that elects to qualify as a RIC continues to be taxable
as a C Corporation on any gains realized within 10 years of its qualification
as
a RIC (the "Inclusion Period") from sales of assets that were held by the
corporation on the effective date of the RIC election ("C Corporation Assets"),
to the extent of any gain built into the assets on such date ("Built-In Gain").
If the corporation fails to make a proper election, it is taxable on its
Built-In Gain as of the effective date of its RIC election. We had Built-In
Gains at the time of our qualification as a RIC and made the election to be
taxed on any Built-In Gain realized during the Inclusion Period.
To
the
extent that we retain capital gains and declare a deemed dividend to
shareholders, the dividend is taxable to the shareholders. We would pay tax
on
behalf of shareholders, at the corporate rate, on the distribution, and the
shareholders would receive a tax credit equal to their proportionate share
of
the tax paid. We took advantage of this rule for 2005. Included in net realized
income from investments for the year ended December 31, 2005, were net realized
gains before taxes of $23,862,037, which consisted primarily of a net realized
long term capital gain on the sale of our investment in Neurometrix, Inc.,
offset by realized net long term capital losses on the sales of Agile Materials
& Technologies, Inc., Experion Systems, Inc., Nanotechnologies, Inc., and
Optiva, Inc. We applied $140,751 of our capital loss carryforwards and $501,640
of our pre-1999 loss carryforwards on Built-In Gains to these
gains.
In
December 2005, we declared a deemed dividend on net taxable realized long-term
capital gains of $23,206,763. The Company recorded a tax payable on its
Consolidated Statements of Assets and Liabilities of $8,122,367 for taxes
payable on behalf of its shareholders. This distribution of $8,122,367 was
also
recorded as an income tax expense on the Consolidated Statements of Operations
for the year ended December 31, 2005. Shareholders of record at December 31,
2005, received a tax credit of $0.39131971 per share. The balance of $15,084,396
was retained by the Company. The Company paid $8,122,367 of taxes on behalf
of
its shareholders on January 30, 2006. At December 31, 2005, we had $1,514,967
accrued for federal and state income taxes payable upon filing of our 2005
tax
returns.
98
For
federal tax purposes, the Company’s 2004 through 2007 tax years remain open for
examination by the tax authorities under the normal three year statute of
limitations. Generally, for state tax purposes, the Company’s 2004 through 2007
tax years remain open for examination by the tax authorities under a four year
statute of limitations.
For
the
twelve months ended December 31, 2007, we paid $74,454 in interest and penalties
related to the federal income tax on Built-In Gains recognized in the Company's
2005 tax year, which is included in income tax expense. During 2007, we paid
$10,290 in federal, state and local income taxes. At December 31, 2007, we
had
$0 accrued for federal, state and local taxes payable by the
Company.
We
pay
federal, state and local taxes on behalf of our wholly owned subsidiary, Harris
& Harris Enterprises, Inc., which is taxed as a C Corporation. For the years
ended December 31, 2007, 2006, and 2005, our income tax expense (benefit) for
Harris & Harris Enterprises, Inc., was $3,231, $9,475 and ($6,411),
respectively.
For
the
years ended December 31, 2007, 2006, and 2005, the Company's income tax
(benefit) expense was allocated as follows:
|
|
2007
|
2006
|
2005
|
|||||||
|
Investment
operations
|
$
|
0
|
$
|
0
|
$
|
0
|
||||
|
Realized
income on investments
|
87,975
|
(227,355
|
)
|
1,530,881
|
||||||
|
Taxes
paid on behalf of shareholders
|
0
|
0
|
8,122,367
|
|||||||
|
Increase
(decrease) in unrealized appreciation on investments
|
0
|
(0
|
)
|
(1,364,470
|
)
|
|||||
|
Total
income tax (benefit) expense
|
$
|
87,975
|
$
|
(227,355
|
)
|
$
|
8,288,778
|
|||
The
above
tax expense consists of the following:
|
2007
|
2006
|
2005
|
||||||||
|
Current
|
$
|
87,975
|
$
|
(227,355
|
)
|
$
|
9,653,248
|
|||
|
Deferred —
Federal
|
0
|
0
|
(1,364,470
|
)
|
||||||
|
Total
income tax (benefit) expense
|
$
|
87,975
|
$
|
(227,355
|
)
|
$
|
8,288,778
|
|||
Continued
qualification as a RIC requires us to satisfy certain investment asset
diversification requirements in future years. Our ability to satisfy those
requirements may not be controllable by us. There can be no assurance that
we
will qualify as a RIC in subsequent years.
99
NOTE
9. COMMITMENTS & GUARANTEES
On
April
17, 2003, we signed a seven-year sublease for office space at 111 West
57th
Street
in New York City. On December 17, 2004, we signed a sublease for additional
office space at our current location. The subleases expire on April 29, 2010.
Total rent expense for our office space in New York City was $178,167 in
2007,
$174,625 in 2006 and $171,171 in 2005. Future minimum sublease payments in
each
of the following years are: 2008 — $193,083; 2009 — $197,700; and thereafter,
for the remaining term — $65,969.
In
the
ordinary course of business, we indemnify our officers and directors, subject
to
certain regulatory limitations, for loss or liability related to their service
on behalf of the Company, including serving on the Boards of Directors or
as
officers of portfolio companies. At December 31, 2007, and 2006, we believe
our
estimated exposure is minimal, and accordingly we have no liability
recorded.
NOTE
10. CAPITAL TRANSACTIONS
On
November 29, 2006, we filed a registration statement with the SEC on Form
N-2 to
register 4,000,000 shares of our common stock. On December 11, 2006, and
on
April 23, 2007, we filed amended registration statements with the SEC. On
May
11, 2007, the SEC declared the registration statement effective. The common
stock may be sold at prices and on terms to be set forth in one or more
supplements to the prospectus from time to time.
On
June
25, 2007, we completed the sale of 1,300,000 shares of our common stock for
gross proceeds of $14,027,000; net proceeds of this offering, after placement
agent fees and offering costs of $1,033,832, were $12,993,168.
NOTE
11. CHANGE IN NET ASSETS PER SHARE
The
following table sets forth the computation of basic and diluted per share
net
increases in net assets resulting from operations for the twelve months ended
December 31, 2007, 2006, and 2005.
|
2007
|
2006
|
2005
|
||||||||
|
Numerator
for (decrease) increase in net assets per share
|
$
|
(6,716,445
|
)
|
$
|
(11,773,112
|
)
|
$
|
6,716,376
|
||
|
Denominator
for basic and diluted weighted average shares
|
22,393,030
|
20,759,547
|
18,471,770
|
|||||||
|
Basic
and diluted net (decrease) increase in net assets per share resulting
from
operations
|
$
|
(0.30
|
)
|
$
|
(0.57
|
)
|
$
|
0.36
|
||
100
NOTE
12.
SUBSEQUENT EVENTS
On
January 16, 2008, we made a $736,019 follow-on investment that has not yet
been
announced in a privately held tiny technology portfolio company.
On
January 31, 2008, we made a $377,580 follow-on investment that has not yet
been
announced in a privately held tiny technology portfolio company.
On
February 1, 2008, we made a $25,000 follow-on investment that has not yet
been
announced in a privately held tiny technology portfolio company.
On
February 8, 2008, we made a $244,500 new investment in PolyRemedy,
Inc.
On
February 21, 2008, we made a $1,052,174 follow-on investment that has not
yet
been announced in a privately held tiny technology portfolio
company.
On
February 25, 2008, we made a $1,000,001 follow-on investment that has not
yet
been announced in a privately held tiny technology portfolio
company.
On
March
7, 2008, we made a $2,000,000 follow-on investment that has not yet been
announced in a privately held tiny technology portfolio company.
101
NOTE
13.
SELECTED QUARTERLY DATA (UNAUDITED)
|
2007
|
|||||||||||||
|
1st Quarter
|
2nd Quarter
|
3rd Quarter
|
4th Quarter
|
||||||||||
|
Total
investment income
|
$
|
652,498
|
$
|
637,701
|
$
|
743,414
|
$
|
672,023
|
|||||
|
Net
operating loss
|
$
|
(2,667,118
|
)
|
$
|
(2,891,667
|
)
|
$
|
(3,117,595
|
)
|
$
|
(3,151,163
|
)
|
|
|
Net
increase (decrease) in net assets resulting from
operations
|
$
|
(6,390,160
|
)
|
$
|
(4,093,644
|
)
|
$
|
604,237
|
$
|
3,163,122
|
|||
|
Net
(decrease) increase in net assets resulting from operations per
average
outstanding share
|
$
|
(0.30
|
)
|
$
|
(0.19
|
)
|
$
|
0.03
|
$
|
0.16
|
|||
|
2006
|
|||||||||||||
|
1st Quarter
|
|
2nd Quarter
|
|
3rd Quarter
|
|
4th Quarter
|
|||||||
|
Total
investment income
|
$
|
804,862
|
$
|
785,265
|
$
|
719,619
|
$
|
719,015
|
|||||
|
Net
operating loss
|
$
|
(767,743
|
)
|
$
|
(693,887
|
)
|
$
|
(2,988,790
|
)
|
$
|
(3,162,515
|
)
|
|
|
Net
increase (decrease) in net assets resulting from
operations
|
$
|
(1,653,990
|
)
|
$
|
(1,282,997
|
)
|
$
|
(2,588,092
|
)
|
$
|
(6,248,033
|
)
|
|
|
Net
(decrease) increase in net assets resulting from operations per
average
outstanding share
|
$
|
(0.08
|
)
|
$
|
(0.06
|
)
|
$
|
(0.12
|
)
|
$
|
(0.31
|
)
|
|
102
|
HARRIS
& HARRIS GROUP, INC.
FINANCIAL
HIGHLIGHTS
|
|
Year Ended
December 31, 2007
|
|
Year Ended
December 31, 2006
|
|
Year Ended
December 31, 2005
|
||||||
|
Per
Share Operating Performance
|
||||||||||
|
Net
asset value per share, beginning of year
|
$
|
5.42
|
$
|
5.68
|
$
|
4.33
|
||||
|
Net
operating (loss) income*
|
(0.53
|
)
|
(0.37
|
)
|
(0.30
|
)
|
||||
|
Net
realized income on investments*
|
0.00
|
0.01
|
0.77
|
|||||||
|
Net
increase (decrease) in unrealized appreciation (depreciation) as
a result
of sales*
|
0.00
|
0.00
|
(1.18
|
)
|
||||||
|
Net
increase (decrease) in unrealized appreciation (depreciation) on
investments held*
|
0.23
|
(0.21
|
)
|
1.07
|
||||||
|
Total
from investment operations*
|
(0.30
|
)
|
(0.57
|
)
|
0.36
|
|||||
|
Net
increase as a result of stock- based compensation expense*
|
0.36
|
0.24
|
0.00
|
|||||||
|
Net
increase as a result of proceeds from exercise of options
|
0.19
|
0.07
|
0.00
|
|||||||
|
Net
increase as a result of stock offering
|
0.26
|
0.00
|
0.99
|
|||||||
|
Total
increase from capital stock transactions
|
0.81
|
0.31
|
0.99
|
|||||||
|
Net
asset value per share, end of year
|
$
|
5.93
|
$
|
5.42
|
$
|
5.68
|
||||
|
Stock
price per share, end of year
|
$
|
8.79
|
$
|
12.09
|
$
|
13.90
|
||||
|
Total
return based on stock price
|
(27.3
|
)%
|
(13.0
|
)%
|
(15.1
|
)%
|
||||
|
Supplemental
Data:
|
||||||||||
|
Net
assets, end of year
|
$
|
138,363,344
|
$
|
113,930,303
|
$
|
117,987,742
|
||||
|
Ratio
of expenses to average net assets
|
11.6
|
%
|
9.2
|
%
|
7.5
|
%
|
||||
|
Ratio
of net operating loss to average net assets
|
(9.5
|
)%
|
(6.6
|
)%
|
(5.8
|
)%
|
||||
|
Cash
dividends paid per share
|
$
|
0.00
|
$
|
0.00
|
$
|
0.00
|
||||
|
Taxes
payable on behalf of shareholders on the deemed dividend per
share
|
$
|
0.00
|
$
|
0.00
|
$
|
0.39
|
||||
|
Number
of shares outstanding, end of year
|
23,314,573
|
21,015,017
|
20,756,345
|
|||||||
*Based
on
average shares outstanding.
The
accompanying notes are an integral part of this schedule.
103
Item
9. Changes in and Disagreements With Accountants on
Accounting and Financial Disclosure.
None.
Item
9A. Controls and Procedures.
Disclosure
Controls and Procedures
As
of the
end of the period covered by this report, the Company’s management, under the
supervision and with the participation of our chief executive officer and chief
financial officer, conducted an evaluation of the effectiveness of the design
and operation of our disclosure controls and procedures (as required by Rules
13a-15 of the Securities Exchange Act of 1934 (the "1934 Act")). Disclosure
controls and procedures means controls and other procedures of an issuer that
are designed to ensure that information required to be disclosed by the issuer
in the reports that it files or submits under the 1934 Act is recorded,
processed, summarized and reported, within time periods specified in the SEC's
rules and forms, and that such information is accumulated and communicated
to
the issuer's management, as appropriate, to allow timely decisions regarding
required disclosures. As of December 31, 2007, based upon this evaluation of
our
disclosure controls and procedures, our chief executive officer and chief
financial officer concluded that our disclosure controls and procedures were
effective.
Internal
Control Over Financial Reporting
Management's
Report on Internal Control Over Financial Reporting and the Report of
Independent Registered Public Accounting Firm, on the Company’s internal control
over financial reporting, is included in Item 8 of this Annual Report on Form
10-K.
Changes
in Internal Control Over Financial Reporting
There
have not been any changes in the Company's internal control over financial
reporting (as such term is defined in Rules 13a-15(f) and 15d-15(f) under the
Exchange Act) during the fourth quarter of 2007 to which this report relates
that have materially affected, or are reasonably likely to materially affect,
the Company’s internal control over financial reporting.
Item
9B. Other Information.
None.
104
PART
III
Item
10. Directors and Executive Officers of the
Registrant.
The
information set forth under the captions "Nominees," "Executive Officers,"
"Section 16(a) Beneficial Ownership Reporting Compliance" and "Audit Committee"
in our Proxy Statement for the Annual Meeting of Shareholders to be held May
1,
2008, to be filed pursuant to Regulation 14A under the Securities Exchange
Act
of 1934 (the "2008 Proxy Statement"), is herein incorporated by
reference.
We
have
adopted a Code of Conduct for Directors and Employees, which also applies to
our
Chief Executive Officer, Chief Financial Officer, Treasurer and Controller
and
is posted on our website at
http://www.tinytechvc.com/shareholder_information/Code_of_Conduct.html. You
may
obtain a copy of the Code of Conduct, free of charge, by calling
1-877-TINY-TECH.
The
Board
of Directors has determined that Dugald A. Fletcher, James E. Roberts and
Richard P. Shanley are all "Audit Committee Financial Experts" serving on our
Audit Committee. Messrs. Fletcher, Roberts and Shanley are independent as
defined under Section 2(a)(19) of the Investment Company Act of 1940 and under
the rules of the NASD.
Item
11. Executive Compensation.
The
information set forth under the captions "Executive Compensation," "Compensation
Committee Interlocks and Insider Participation" and "Compensation Committee
Report on Executive Compensation" in the 2008 Proxy Statement is herein
incorporated by reference.
Item
12. Security Ownership of Certain Beneficial Owners and
Management and Related Stockholder Matters.
The
information set forth under the caption "Principal Shareholders and Ownership
by
Directors and Executive Officers" in the 2008 Proxy Statement is herein
incorporated by reference. The "Equity Compensation Plan Information" chart
is
set forth under Item 5.
Item
13. Certain Relationships and Related Transactions, and
Director Independence.
The
information set forth under the captions "Board Committees," "Nominees" and
"Related Party Transactions" in the 2008 Proxy Statement is herein incorporated
by reference.
105
Item
14. Principal Accountant Fees and
Services.
The
information set forth under the captions "Audit Committee's Pre-Approval
Policies" and "Fees Paid to PwC for 2007 and 2006" in the 2008 Proxy Statement
is herein incorporated by reference.
106
PART
IV
Item
15. Exhibits and Financial Statements Schedules.
| (a) |
The
following documents are filed as a part of this
report:
|
| (1) |
Listed
below are the financial statements which are filed as part of this
report:
|
| · |
Consolidated
Statements of Assets and Liabilities as of December 31, 2007, and
2006;
|
| · |
Consolidated
Statements of Operations for the years ended December 31, 2007, 2006,
and
2005;
|
| · |
Consolidated
Statements of Cash Flows for the years ended December 31, 2007, 2006,
and
2005;
|
| · |
Consolidated
Statements of Changes in Net Assets for the years ended December
31, 2007,
2006, and 2005;
|
| · |
Consolidated
Schedule of Investments as of December 31,
2007;
|
| · |
Consolidated
Schedule of Investments as of December 31,
2006;
|
| · |
Footnote
to Consolidated Schedule of
Investments;
|
| · |
Notes
to Consolidated Financial Statements;
and
|
|
·
|
Financial
Highlights for the years ended December 31, 2007, 2006, and
2005.
|
|
(2)
|
No
financial statement schedules are required to be filed herewith because
(i) such schedules are not required or (ii) the information has been
presented in the above financial
statements.
|
|
(3)
|
The
following exhibits are filed with this report or are incorporated
herein
by reference to a prior filing, in accordance with Rule 12b-32 under
the
Securities Exchange Act of 1934.
|
|
3.1(a)
|
Restated
Certificate of Incorporation of Harris & Harris Group, Inc., dated
September 23, 2005, incorporated by reference as Exhibit 99 to Form
8-K
(File No. 814-00176) filed on September 27,
2005.
|
|
3.1(b)
|
Certificate
of Amendment of the Certificate of Incorporation of Harris & Harris
Group, Inc., dated May 19, 2006, incorporated by reference as Exhibit
3.1
to the Company's Form 10-Q (File No. 814-00176) filed on August 9,
2006.
|
|
3.2
|
Restated
By-laws, incorporated by reference as Exhibit B to Pre-Effective
Amendment
No.1 to the Company's Registration Statement on Form N-2 (File No.
333-112862) filed on March 22,
2004.
|
107
|
4.1
|
Form
of Specimen Certificate of Common Stock, incorporated by reference
to
Exhibit D to the Company's Registration Statement on Form N-2 (File
No.
333-138996) filed November 29,
2006.
|
|
10.1
|
Harris
& Harris Group, Inc. Custodian Agreement with JP Morgan, incorporated
by reference as Exhibit J to Pre-Effective Amendment No. 1 to the
Company's Registration Statement on Form N-2 (File No. 333-112862)
filed
on March 22, 2004.
|
|
10.2
|
Form
of Indemnification Agreement which has been established with all
directors
and executive officers of the Company, incorporated by reference
as
Exhibit I(7) to Pre-Effective Amendment No. 1 to the Company's
Registration Statement on Form N-2 (File No. 333-112862) filed on
March
22, 2004.
|
|
10.3
|
Deferred
Compensation Agreement, incorporated by reference as Exhibit 10.5
to the
Company's Form 10-K for the year ended December 31, 2004 (File No.
814-00176) filed on March 16, 2005.
|
|
10.4
|
Amendment
No. 4 to Deferred Compensation Agreement, incorporated by reference
as
Exhibit 10 to the Company's Form 10-Q (File No. 814-00176) filed
on August
9, 2006.
|
|
10.5
|
Amendment
No. 2 to Deferred Compensation Agreement, incorporated by reference
as
Exhibit 10.1 to the Company's Form 8-K (File No. 814-00176) filed
on
October 15, 2004.
|
|
10.6
|
Amendment
No. 1 to Deferred Compensation Agreement, incorporated by reference
as
Exhibit 10.2 to the Company's Form 10-Q (File No. 811-07074) filed
on May
14, 2003.
|
|
10.7
|
Trust
Under Harris & Harris Group, Inc., Deferred Compensation Agreement,
incorporated by reference as Exhibit I(12) to the Company's Registration
Statement on Form N-2 (File No. 333-138996) filed on November 29,
2006.
|
|
10.8*
|
Harris
& Harris Group, Inc. Amended and Restated Employee Profit-Sharing
Plan.
|
|
10.9
|
Harris
& Harris Group, Inc. 2006 Equity Incentive Plan, incorporated by
reference as Appendix B to the Company's Proxy Statement for the
2006
Annual Meeting of Shareholders filed on April 3,
2006.
|
| 10.10 |
Form
of Incentive Stock Option Agreement incorporated by reference as
Exhibit
10.1 to the Company's Form 8-K (File
No. 814-00176) filed
on June 26, 2006.
|
| 10.11 |
Form
of Non-Qualified Stock Option Agreement, incorporated by reference
as
Exhibit 10.2 to the Company's Form 8-K (File
No. 814-00176) filed
on June 26, 2006.
|
108
|
10.12
|
Harris
& Harris Group, Inc. Directors Stock Purchase Plan 2001, incorporated
by reference as Exhibit I(6) to the Company's Registration Statement
on
Form N-2 (File No. 333-138996) filed on November 29,
2006.
|
|
10.13
|
Amended
and Restated Employment Agreement between Harris & Harris Group, Inc.
and Charles E. Harris, dated August 2, 2007, incorporated by reference
as
Exhibit 10.1 to the Company’s Form 8-K (File No. 814-00176) filed on
August 3, 2007.
|
|
10.14
|
Amended
and Restated Severance Compensation Agreement, dated August 2, 2007,
incorporated by reference as Exhibit 10.2 to the Company’s Form 8-K (File
No. 814-00176) filed on August 3,
2007.
|
|
10.15
|
Amended
and Restated Supplemental Executive Retirement Plan, dated August
2, 2007,
incorporated by reference as Exhibit 10.3 to the Company’s Form 8-K (File
No. 814-00176) filed on August 3,
2007.
|
|
10.16
|
Amended
and Restated Harris & Harris Group, Inc. Executive Mandatory
Retirement Benefit Plan, dated August 2, 2007, incorporated by reference
as Exhibit 10.4 to the Company’s Form 8-K (File No. 814-00176) filed on
August 3, 2007.
|
|
10.17*
|
Agreement
of Sub-Sublease, dated April 18, 2003, by and between Prominent USA,
Inc.
and Harris & Harris Group, Inc.
|
|
10.18*
|
Amendment
to Agreement of Sub-Sublease, dated May 9, 2003, by and between Prominent
USA, Inc., and Harris & Harris Group,
Inc.
|
|
10.19*
|
Assignment
and Assumption, Modification and Extension of Sublease Agreement,
dated
December 17, 2004, by and among the Economist Newspaper Group, Inc.,
National Academy of Television Arts & Sciences, and Harris &
Harris Group, Inc.
|
|
14.1
|
Code
of Conduct for Directors and Employees of Harris & Harris Group, Inc.
incorporated by reference as Exhibit 14 to the Company's Form 8-K
(File
No. 814-00176) filed on October 5,
2004.
|
|
14.2
|
Code
of Ethics Pursuant to Rule 17j-1, incorporated by reference as Exhibit
14
to the Company's Form 8-K (File No. 814-00176) filed on March 7,
2008.
|
|
31.01*
|
Certification
of CEO pursuant to Section 302 of the Sarbanes-Oxley Act of
2002.
|
|
31.02*
|
Certification
of CFO pursuant to Section 302 of the Sarbanes-Oxley Act of
2002.
|
|
32.01*
|
Certification
of CEO and CFO pursuant to 18 U.S.C. Section 1350, as adopted pursuant
to
Section 906 of the Sarbanes-Oxley Act of
2002.
|
*Filed
herewith
109
SIGNATURES
Pursuant
to the requirements of Section 13 or 15(d) of the Securities Exchange Act of
1934, the Company has duly caused this report to be signed on its behalf by
the
undersigned, thereunto duly authorized.
|
HARRIS
& HARRIS GROUP, INC.
|
||
|
Date:
March 12, 2008
|
By:
|
/s/
Charles E. Harris
|
|
Charles
E. Harris
|
||
|
Chairman
of the Board
|
||
Pursuant
to the requirements of the Securities Exchange Act of 1934, this report has
been
signed below by the following persons on behalf of the Company and in the
capacities and on the dates indicated.
|
Signatures
|
Title
|
Date
|
||
|
/s/
Charles E. Harris
|
Chairman
of the Board
|
March
12, 2008
|
||
|
Charles
E. Harris
|
and
Chief Executive Officer
|
|||
|
/s/
Daniel B. Wolfe
|
Chief
Financial Officer
|
March
12, 2008
|
||
|
Daniel
B. Wolfe
|
||||
|
/s/
Patricia N. Egan
|
Chief
Accounting Officer
|
March
12, 2008
|
||
| Patricia N. Egan |
and
Senior Controller
|
|
||
|
/s/
W. Dillaway Ayres, Jr.
|
Director
|
March
12, 2008
|
||
|
W.
Dillaway Ayres, Jr.
|
||||
|
/s/
C. Wayne Bardin
|
Director
|
March
12, 2008
|
||
|
C.
Wayne Bardin
|
110
|
/s/
Phillip A. Bauman
|
Director
|
March
12, 2008
|
||
|
Phillip
A. Bauman
|
||||
|
/s/
G. Morgan Browne
|
Director
|
March
12, 2008
|
||
|
G.
Morgan Browne
|
||||
|
/s/
Dugald A. Fletcher
|
Director
|
March
12, 2008
|
||
|
Dugald
A. Fletcher
|
||||
|
/s/
Douglas W. Jamison
|
Director
|
March
12, 2008
|
||
|
Douglas
W. Jamison
|
||||
|
/s/
Kelly S. Kirkpatrick
|
Director
|
March
12, 2008
|
||
|
Kelly
S. Kirkpatrick
|
||||
|
/s/
Lori D. Pressman
|
Director
|
March
12, 2008
|
||
|
Lori
D. Pressman
|
||||
|
/s/
Charles E. Ramsey
|
Director
|
March
12, 2008
|
||
|
Charles
E. Ramsey
|
||||
|
/s/
James E. Roberts
|
Director
|
March
12, 2008
|
||
|
James
E. Roberts
|
||||
|
/s/
Richard P. Shanley
|
Director
|
March
12, 2008
|
||
|
Richard
P. Shanley
|
111
EXHIBIT
INDEX
The
following exhibits are filed with this report in accordance with Rule 12b-32
under the Securities Exchange Act of 1934.
|
Description
|
||
|
10.8
|
Harris
& Harris Group, Inc. Amended and Restated Employee Profit-Sharing
Plan.
|
|
|
10.17
|
Agreement
of Sub-Sublease, dated April 18, 2003, by and between Prominent USA,
Inc.
and Harris & Harris Group, Inc.
|
|
|
10.18
|
Amendment
to Agreement of Sub-Sublease, dated May 9, 2003, by and between Prominent
USA, Inc., and Harris & Harris Group, Inc.
|
|
|
10.19
|
Assignment
and Assumption, Modification and Extension of Sublease Agreement,
dated
December 17, 2004, by and among the Economist Newspaper Group, Inc.,
National Academy of Television Arts & Sciences, and Harris &
Harris Group, Inc.
|
|
|
31.01
|
Certification
of CEO pursuant to Section 302 of the Sarbanes-Oxley Act of
2002.
|
|
|
31.02
|
Certification
of CFO pursuant to Section 302 of the Sarbanes-Oxley Act of
2002.
|
|
|
32.01
|
Certification
of CEO and CFO pursuant to 18 U.S.C. Section 1350, as adopted pursuant
to
Section 906 of the Sarbanes-Oxley Act of
2002.
|
112